

Summary
Dysregulated mTORC1 signaling alters a wide range of cellular processes, contributing to metabolic disorders and cancer. Defining the molecular details of downstream effectors is thus critical for uncovering selective therapeutic targets. We report that mTORC1 and its downstream kinase S6K enhance eIF4A/4B-mediated translation of Wilms’ tumor 1-associated protein (WTAP), an adaptor for the N6-methyladenosine (m6A) RNA methyltransferase complex. This regulation is mediated by 5’UTR of WTAP mRNA that is targeted by eIF4A/4B. Single nucleotide-resolution m6A mapping revealed that MAX dimerization protein 2 (MXD2) mRNA contains m6A, and increased m6A modification enhances its degradation. WTAP induces cMyc-MAX association by suppressing MXD2 expression, which promotes cMyc transcriptional activity and proliferation of mTORC1-activated cancer cells. These results elucidate a mechanism whereby mTORC1 stimulates oncogenic signaling via m6A RNA modification and illuminates WTAP-MXD2-cMyc axis as a potential therapeutic target for mTORC1-driven cancers.
eTOC blurb
Cho et al. report that mTORC1 enhances WTAP translation through eIF4A/4B, resulting in the increase of global mRNA m6A modification. m6A modification of mRNAs by mTORC1 destabilizes transcripts through YTHDF m6A reader proteins. Among the targets, mTORC1 increases m6A modification on MXD2 mRNA, cMyc suppressor, resulting in increased cMyc activity and tumor growth.
Graphical abstract
Introduction
The mechanistic target of rapamycin complex 1 (mTORC1) is an evolutionarily conserved serine/threonine kinase that senses environmental cues and regulates a diverse array of physiological processes (Saxton and Sabatini, 2017; Shimobayashi and Hall, 2014). Once activated, mTORC1 promotes synthesis of macromolecules including nucleotides, proteins, and lipids while inhibiting catabolic processes such as autophagy (Gomes and Blenis, 2015; Jewell and Guan, 2013). Activation of mTORC1 signaling has been reported in ~80% of human cancers including the genetic tumor syndromes, tuberous sclerosis complex (TSC) and lymphangioleiomyomatosis (LAM) (Lam et al., 2018; Mossmann et al., 2018).
mTORC1 also regulates diverse aspects of mRNA metabolism. For example, mTORC1 promotes mRNA translation through its downstream proteins, ribosomal protein S6 kinase (S6K) and eukaryotic initiation factor 4E (eIF4E)-binding protein (4E-BP) (Hinnebusch et al., 2016; Kimball and Jefferson, 2006; Ma and Blenis, 2009). mTORC1-activated S6K promotes recruitment of eIF4B into the translation pre-initiation complex where the eIF4A/4B RNA helicase unwinds highly structured 5’ untranslated regions (5’UTR) in specific mRNAs to enhance their translation efficiency (Csibi et al., 2014; Holz et al., 2005; West et al., 1998). mTORC1 also promotes splicing and polyadenylation of a subset of genes to increase mRNA stability and translation (Chang et al., 2015; Lee et al., 2017; Ma et al., 2008; Tang et al., 2018a). Thus, mTORC1 plays crucial roles in supporting cell growth and proliferation through regulation of RNA metabolic processes at global and gene-specific levels.
RNA processing and quality control are pivotal nodes of gene expression control during cell fate decisions and disease development (Gilbert et al., 2016; Gott and Emeson, 2000). One of the most well-studied RNA chemical modifications is the N6-adenosine methylation (m6A) of mRNA (Fu et al., 2014; Meyer and Jaffrey, 2017). m6A is generated by a nuclear methyltransferases termed as “writers” which includes the heterodimeric methyltransferase METTL3-METTL14, and the adaptor protein WTAP which is required for m6A formation and localization of METTL3-METTL14 to the nucleus (Ping et al., 2014; Schwartz et al., 2014). Subsequently, the m6A-reader proteins such as the YTH domain-containing protein family, bind to the m6A-containing mRNAs to control their fates, including splicing, intracellular localization, and stability (Patil et al., 2018). Alterations in m6A modifications on transcripts encoding oncogenes and tumor suppressors induce malignancies in leukemia, glioma, breast and lung cancers (Barbieri and Kouzarides, 2020; Huang et al., 2020). However, very little is known about how the m6A modification process is controlled by cellular signal transduction pathways in these conditions.
Here, we uncover an important role for the mTORC1 pathway in stimulating global and gene-specific mRNA methylation. We show that mTORC1-activated eIF4A/4B enhances the translation of WTAP mRNA, which encodes a central component of the m6A methyltransferase writer complex. Additionally, through single-nucleotide resolution transcriptome-wide m6A mapping, we discover the MXD2-cMyc axis as an important downstream effector of mTORC1-mediated m6A RNA modification in promoting cell growth and proliferation. Our findings provide a rationale for the development of therapeutics targeting RNA modification events to treat mTORC1-driven diseases.
Results
mTOR stimulates global m6A levels
Given that mTOR regulates multiple steps of mRNA quality control (Chang et al., 2015; Lee et al., 2017; Ma et al., 2008; Tang et al., 2018a), we speculated that mTOR may also regulate mRNA chemical modifications. We measured m6A levels in poly(A)-RNA isolated from insulin-treated HEK293E cells using liquid chromatography mass spectrometry (LC-MS) (Jia et al., 2011). Insulin did not significantly change global m6A levels until 12 hr which continued to increase by 30~50% after 30 hr insulin treatment (Figure 1A and Supplemental Figure 1A). Conversely, inhibition of mTOR activity with catalytic inhibitor, torin1, suppressed insulin-induced m6A modification (Figures 1B–1D). Thus, mTOR activation promotes m6A modification of mRNAs.
Figure 1. mTOR induces m6A modification of mRNAs.

(A) LC-MS analysis of m6A levels in twice-purified poly(A)-RNA from HEK293E cells. Cells were treated with insulin (200 nM, 30 hr) after overnight serum starvation.
(B-C) Two-dimensional thin layer chromatograph (2D TLC, B) analysis of nucleotide levels in HEK293E cells. Cells were serum starved overnight and treated with insulin (200 nM, 30 hr) with or without pretreatment of torin1 (250 nM). Twice-purified poly(A)-RNAs were digested with nuclease T1 and radio-labeled with 32P-ATP. (C) shows quantification of the intensity of nucleotide spots in (B).
(D) LC-MS analysis of m6A levels in HEK293E cells serum starved overnight and treated with insulin (200 nM, 30 hr) with or without pretreatment of torin1 (250 nM).
(E) Density plot of m6A read coverage at m6A sites. miCLIP was performed in HEK293E cells serum starved overnight and treated with insulin (200 nM, 30 hr) with or without pretreatment of torin1 (250 nM). The log2 value of miCLIP reads was calculated at each m6A site. A density plot represents changes at miCLIP reads at individual sites. The mean read density for each sample is indicated by dashed vertical lines.
(F) MEME-CHIP motif enrichment analysis of miCLIP reads.
(G) Metagene plot of the frequency of m6A sites throughout the transcript body.
(H) Immunoblot analysis of HEK293E cells treated with insulin (200 nM, 30 hr) after overnight serum starvation.
(I) Immunoblot analysis of HEK293E cells serum starved overnight and treated with insulin (200 nM, 30 hr) with or without pretreatment of torin1 (250 nM).
(J) Immunoblot analysis of HEK293E cells treated with siRNA against non-targeting control (NTC) or mTOR.
(K, L) Immunoblot (K) and LC-MS (L) analysis of HEK293E cells stimulated with insulin (200 nM, 30 hr) after overnight serum starvation. Cell were treated with siRNA against non-targeting control (NTC) or WTAP.
N ≥ 3. *p < 0.05. **p < 0.01. ***p < 0.001. Error bars show standard deviation (SD).
We next sought to investigate mTOR-dependent changes in individual m6A sites on transcripts. To this end, we performed transcriptome-wide m6A mapping using m6A individual-nucleotide-resolution cross-linking and immunoprecipitation (miCLIP) (Linder et al., 2015). Consistent with the globally decreased m6A levels, torin1 decreased the abundance of read counts on individual m6A sites (Figure 1E). The m6A writer complex preferentially deposits m6A on the consensus sequence, DRA*CH (D = G/A/U, R = G/A, A* = m6A, H = U/A/C), and the m6A modification is generally enriched around the last exon (Dominissini et al., 2012; Meyer et al., 2012). Interestingly, torin1 did not specifically alter the m6A consensus motif (Figure 1F) nor the distribution of m6A across the transcript body (Figure 1G), indicating that mTOR signaling affects the global activity of the m6A methyltransferase.
mTORC1-S6K pathway induces WTAP expression
To elucidate molecular mechanisms of how mTOR regulates m6A methyltransferase activity, we examined protein levels of the core m6A methyltransferase complex; METTL3, METTL14, and WTAP. Upon insulin stimulation the protein level of WTAP was markedly induced while the levels of METTL3 and METTL14 were not affected (Figure 1H). Consistent with m6A induction by 30 hr insulin treatment (Supplemental Figure 1A), WTAP expression was gradually increased by insulin which was highest at 30 hr (Supplemental Figure 1B). Inhibition of mTOR activity by torin1 treatment or mTOR silencing by siRNA suppressed WTAP expression (Figures 1I and 1J). Knockdown of WTAP suppressed insulin-induced m6A levels (Figures 1K and 1L), indicating that WTAP is required for the mTOR-dependent m6A modification.
mTOR forms two distinct complexes, mTOR complex 1 and 2 (mTORC1 and mTORC2), with their respective key components Raptor and Rictor (Kim et al., 2002; Sarbassov et al., 2005). To investigate which mTOR complex regulates WTAP, we silenced Raptor or Rictor. As a result, Raptor knockdown, but not Rictor knockdown, significantly reduced WTAP levels (Figure 2A), indicating that mTORC1 regulates WTAP expression. Treatment of mTORC1-specific inhibitor, rapamycin, suppressed insulin-induced WTAP expression (Figure 2B). In cancer cell panels with overactive mTORC1 signaling, WTAP expression was suppressed by rapamycin and torin1 treatment (Figures 2C–2F). In patient-derived TSC2-deficient LAM cell line (Yu et al., 2004), reconstitution of TSC2 markedly reduced WTAP protein levels (Figure 2G). Thus, mTORC1 activity is required for WTAP protein expression.
Figure 2. mTORC1-S6K1 signaling regulates WTAP expression.

(A) Immunoblot analysis of HEK293E cells treated with siRNAs against each denoted gene.
(B) Immunoblot analysis of HEK293E cells serum starved overnight and treated with insulin (200 nM, 30 hr) with or without pretreatment of rapamycin (100 nM).
(C-F) Immunoblot analysis of human LAM 621–101 (C), MCF7 (D), H1299 (E), and DLD1 (F) cells treated with rapamycin (100 nM, 24 hr) or torin1 (250 nM, 24 hr).
(G) Immunoblot analysis of LAM 621–101 (TSC2−/−) cells expressing empty vector or TSC2.
(H) Immunoblot analysis of kidney from wild type (Tsc2+/+) and Tsc2 heterozygous (Tsc2+/−) mice treated with vehicle or rapamycin (8 mg/kg) for 8 weeks.
(I) Representative magnetic resonance imaging (MRI) and histology (H&E stained sections) images of kidneys from Tsc2+/− mice before and after vehicle or rapamycin (8 mg/kg) treatment for 8 weeks. Blue arrowheads indicate cysts and papillary lesions. Red arrowheads indicate solid tumors. Scale bars, 2 mm.
(J) Tumor score was calculated by the sum of the tumor lesion area from H&E images. Tsc2+/− mice were treated with vehicle or rapamycin (8 mg/kg) for 8 weeks. N ≥ 6. ***p < 0.001. Error bars show standard error of the mean (SEM).
(K) Immunoblot analysis of LAM 621–101 (TSC2−/−) cells treated with siRNAs against each denoted gene.
(L) Immunoblot analysis of HEK293E cells transfected with empty vector or constitutively active S6K1-CA (S6K1-F5A/R3A/T389E). Cells were serum starved overnight and treated with insulin (200 nM, 30 hr) with or without pretreatment of rapamycin (100 nM).
To further examine the regulation of WTAP by mTORC1 in vivo, we used a Tsc2-heterozygote mouse model (Tsc2+/−), which spontaneously develops kidney tumors via loss-of-heterozygosity (Onda et al., 1999; Woodrum et al., 2010). In the kidneys of these mice, mTORC1 was active as measured by increased phosphorylation of ribosomal protein S6 (pS6) compared to the normal kidneys (Figure 2H). WTAP expression was also markedly induced (Figure 2H – [Capitalize label Wtap in Figure]). Administration of rapamycin to these mice suppressed both pS6 and WTAP levels (Figure 2H). Rapamycin also reduced tumor burden, measured by the decreased number and area of the tumors detected by magnetic resonance imaging (MRI) and hematoxylin and eosin (H&E) staining (Figures 2I and 2J) (Kalogerou et al., 2012; Lee et al., 2009).
S6K1/2 is a key downstream effector of mTORC1 (Holz and Blenis, 2005; Schalm et al., 2005). Indeed, knockdown of S6K1/2 reduced WTAP expression (Figure 2K). Expression of a constitutively active form of S6K1 (S6K1-CA) (Schalm et al., 2005) restored WTAP expression upon rapamycin treatment (Figure 2L). Therefore, the mTORC1-S6K axis regulates WTAP expression.
eIF4A/4B induces WTAP protein translation
We next investigated the mechanism of how mTORC1-S6K signaling regulates WTAP expression. Unexpectedly, expression levels of WTAP mRNA did not correlate with protein expression (Figures 3A and 3B). This suggests that mTORC1-S6K signaling increases WTAP protein expression via post-transcriptional mechanisms. We and others have shown that mTORC1-S6K promotes translation of mRNAs with a highly structured 5’UTR via recruitment of eIF4A/4B into the translation preinitiation complex. eIF4A unwinds highly structured 5’UTR with its RNA helicase activity, thereby increasing the efficiency of target mRNA translation (Csibi et al., 2014; Holz et al., 2005; Shahbazian et al., 2010).
Figure 3. eIF4A/4B promotes translation of WTAP.

(A, B) Quantification of immunoblot results (A) or qPCR analysis (B) of WTAP in HEK293E, LAM, MCF7, and H1299 cells with or without rapamycin (100 nM) or torin1 (250 nM). N = 3. *p < 0.05. ***p < 0.001 Error bars show standard deviation (SD).
(C) Analysis of the nucleotide length and Gibbs free energy of 5’UTR.
(D) Immunoblot analysis of LAM 621–101 (TSC2−/−) cells treated with siRNAs against each denoted gene.
(E) Quantification of the 2D TLC analysis of nucleotide levels in LAM 621–101 (TSC2−/−) cells. Cells were treated with siRNAs against each denoted gene. N = 2. *p < 0.05. Error bars show standard deviation (SD).
(F, G) qPCR analysis of sucrose-gradient polysome fractions of HEK293E cells treated with siRNAs against each denoted gene. N = 2. *p < 0.05. Error bars show standard error of the mean (SEM).
(H) Immunoblot analysis of LAM 621–101 (TSC2−/−) cells treated with silvestrol for 24 hr.
(I) Immunoblot analysis of WTAP knockout HEK293E cells transfected with empty vector or WTAP containing coding region (CDS) or 5’UTR and CDS (5’UTR-CDS). Cells were treated with silvestrol for 24 hr. Numbers below each band show the quantification of band intensity normalized by loading control.
Intriguingly, computational structure-prediction analysis based on the primary RNA sequence (Lorenz et al., 2011) indicated that the 5’UTR of WTAP is highly structured, with very low Gibbs free energy (ΔG = −158.50 kcal/mol) (Figure 3C). This complexity is comparable to that of well-known eIF4A/4B target genes such as cMyc, ODC1, and BCL2 (Figure 3C) (Csibi et al., 2014; Shahbazian et al., 2010). In contrast, METTL3 or METTL14 5’UTRs contain much simpler secondary structures (Figure 3C). Knockdown of eIF4A1/2 or eIF4B significantly reduced WTAP protein levels as well as global m6A levels (Figures 3D and 3E; Supplemental Figures 2A and 2B).
We then measured translation efficiency of WTAP mRNA using a polysome profiling assay (Supplemental Figures 2C and 2D). Knockdown of eIF4A shifted WTAP mRNA toward lighter polysomal fractions (Figure 3F), indicating that WTAP translation is suppressed. In contrast, the mRNA distribution of a control gene PPIB, which contains an unstructured 5’UTR (Figure 3C), was not shifted (Figure 3G). Furthermore, a small molecule inhibitor of eIF4A, silvestrol (Bordeleau et al., 2008), decreased WTAP protein levels (Figure 3H). This effect was markedly abrogated in the WTAP construct that lacks its 5’UTR (Figure 3I and Supplemental Figure 2E). Collectively, these results demonstrate that mTORC1-S6K induces WTAP protein expression via eIF4A-mediated mRNA translation.
mTORC1 decreases mRNA levels via m6A modification
To explore biological impact of mTORC1-mediated m6A modification, we revisited our m6A sequencing data that compared transcriptome-wide m6A levels between DMSO and torin1-treated cells (Figures 1E–1G). While mRNA levels were globally decreased by mTORC1 inhibition consistent with mTORC1’s role in promoting nucleotide synthesis (Ben-Sahra et al., 2016; Düvel et al., 2010; Valvezan et al., 2017), to our surprise, the mRNAs whose expression increased after torin1 treatment were enriched in annotated m6A sites (Figure 4A). This is in line with the previous studies showing that m6A destabilizes mRNAs, and inhibition of m6A deposition on these transcripts leads to increased mRNA stability (Sommer et al., 1978). This raises the possibility that the biological roles of mTORC1 in promoting cell growth and proliferation may be mediated, in part, by enhancing WTAP levels, which leads to increased m6A formation and subsequent degradation of specific transcripts.
Figure 4. mTORC1 and m6A enzymes suppress MXD2 expression.

(A) Cumulative distribution plot of transcript abundance from RNA-seq of miCLIP input samples in Figure 1 (DMSO vs. torin1). Transcripts were binned based on number of called m6A sites in DMSO samples. The log2 fold change in torin1 over DMSO was calculated for each transcript. Inset is a boxplot of the same data. Statistical significance was determined using Tukey’s HSD test.
(B) Genome tracks of miCLIP and input RNA-seq coverage on MXD2. Areas containing m6A sites (black dashes) are highlighted with purple boxes.
(C) qPCR analysis of MXD2 in LAM 621–101 (TSC2−/−) cells knocked down with METTL3 and METTL14.
(D) qPCR analysis of MXD2 in LAM 621–101 (TSC2−/−) cells knocked down with WTAP.
(E) qPCR analysis of MXD2 in LAM 621–101 (TSC2−/−), MCF7, H1299, DLD1, and BT549 cells treated with rapamycin (100 nM, 24hr) or torin1 (250 nM, 24 hr).
(F) qPCR analysis of Mxd2 in Tsc2+/+ and Tsc2+/− mouse kidneys treated with vehicle or rapamycin (8 mg/kg) for 8 weeks.
(G) qPCR analysis of MXD2 in HEK293E cells expressing METTL14 with METTL3-WT or METTL3-Mut (amino acids 395–398 converted from DPPW to APPA). Cells were serum starved overnight and treated with insulin (200 nM, 30 hr). Relative fold change was calculated by normalizing MXD2 mRNA levels in siMETTL3/14 compared to siNTC in each condition.
(H) qPCR analysis of MXD2 in HEK293E cells expressing WTAP. The cells were for serum starved overnight and treated with insulin (200 nM, 30 hr) with or without pretreatment of torin1 (250 nM).
(I) Immunoblot analysis of MXD2 in LAM 621–101 (TSC2−/−) cells treated with siRNAs against each denoted gene.
N ≥ 3. *p < 0.05. **p < 0.01. ***p < 0.001. ****p < 0.0001. Error bars show standard deviation (SD).
Therefore, we followed up on those genes whose m6A levels are decreased while mRNA levels are increased by torin1 (Supplemental Figure 3). Normalization of m6A levels on each gene by transcript abundance gave 2,439 genes whose m6A levels are significantly decreased by torin1 (Supplemental Tables 1A and 1B). Among these, we probed for the genes whose mRNA levels are significantly increased by torin1. Statistical analysis of this set of genes narrowed down our list of most significant candidates to 199 genes (Supplemental Table 1C). Gene Ontology (GO) analysis (Huang et al., 2009) revealed that over half of the genes were enriched in cellular macromolecule metabolic processes (Supplemental Table 1D). Other cellular functions such as protein O-linked mannosylation, protein targeting, and gene silencing were also enriched (Supplemental Table 1D). We then focused on 105 genes associated with cellular macromolecule metabolic processes and performed qPCR to confirm the changes in mRNA levels. For the qPCR analysis, we tested the following conditions in TSC2-deficient LAM cells: 1) to verify mTORC1 dependency, we treated with torin1, and 2) to verify m6A dependency, we knocked down METTL3/METTL14 or WTAP (Supplemental Tables 2A and 2B; Supplemental Figures 4A and 4B). As a result of our analysis, the mRNA levels of 18 genes, including MAX dimerization protein 2 (MXD2, also known as Max interactor 1 or MXI1), Fibroblast growth factor receptor 1 (FGFR1), and FGFR3 were consistently and statistically significantly increased in all three conditions (Figures 4B–4D; Supplemental Figure 3; Supplemental Table 2C).
mTORC1 suppresses MAX dimerization protein 2 (MXD2) expression by m6A modification
Among the m6A sequencing candidate genes (Supplemental Table 2C), it was of particular interest that mTORC1 can potentially regulate cMyc signaling via m6A modification of cMyc suppressor, MXD2. MXD proteins are known to inhibit cMyc activity by competing with cMyc transcriptional co-activator Max (Mathsyaraja et al., 2019; Schreiber-Agus et al., 1995, 1998). Among the MXD family proteins, only the expression of MXD2, but not MXD1, MXD3, or MXD4, was increased by rapamycin (Supplemental Figure 4C). Rapamycin and torin1 significantly induced MXD2 mRNA levels in multiple cancer cell lines with overactive mTORC1 signaling (Figure 4E), suggesting that mTORC1 suppresses MXD2 expression in various cancers. In Tsc2-deficient mouse kidney tumors, Mxd2 mRNA level was markedly decreased compared to control, which was restored by rapamycin treatment (Figure 4F). In HEK293E cells depleted of endogenous METTL3-METTL14, expression of wild type METTL3 with METTL14, but not the catalytic inactive mutant (METTL3-D395A/W398A) (Lin et al., 2016; Wang et al., 2016), suppressed MXD2 levels (Figure 4G and Supplemental Figure 4D). Furthermore, a METTL3 catalytic inactive mutant increased MXD2 expression, consistent with a dominant negative effect of this mutation. Ectopic expression of WTAP suppressed torin1-induced MXD2 expression (Figure 4H and Supplemental Figure 4E). Finally, MXD2 protein levels were induced by WTAP knockdown (Figure 4I) while decreased by insulin treatment (Supplemental Figure 4F).
Once mRNAs are modified with m6A, the m6A-binding proteins are recruited to determine the fate of mRNAs (Patil et al., 2018). Among these m6A readers, YTHDF proteins degrade m6A-modified mRNAs (Lasman et al., 2020; Wang et al., 2014; Zaccara and Jaffrey, 2020). Indeed, knockdown of YTHDF2/3 increased expression of MXD2 (Figure 5A and Supplemental Figure 4G), indicating that mTORC1-dependent m6A modification decreases MXD2 mRNA stability. Assessment of MXD2 mRNA levels upon transcription inhibition or by 5-ethynyl uridine (5-EU) labeling revealed that rapamycin and torin1 increase the stability of MXD2 mRNA (Figures 5B–5D).
Figure 5. mTORC1 decreases MXD2 mRNA stability via m6A modification.

(A) qPCR analysis of MXD2 in LAM 621–101 (TSC2−/−) cells knocked down with YTHDF2 and YTHDF3.
(B, C) mRNA stability analysis of MXD2 in LAM 621–101 (TSC2−/−) cells treated with rapamycin (100 nM) (B) or torin1 (250 nM) (C). Cells were treated with actinomycin D (5 μg/mL) for the indicated times.
(D) 5-ethynyl uridine (5-EU) labeling analysis of MXD2 mRNA. LAM 621–101 (TSC2−/−) cells were labeled with 5-EU overnight and treated with rapamycin (100 nM) or torin1 (250 nM) for the indicated times.
(E) Schematic of conserved m6A RNA modification site and amino acids among various species. The consensus m6A modification motif is highlighted in yellow (GGA*C; A* is the methylated adenosine). Point mutation in m6A modification motif (C to T) is highlighted in blue.
(F, G) qPCR analysis of wild type or m6A site-mutated MXD2. LAM 621–101 (TSC2−/−) cells were transfected with each MXD2 construct and treated with torin1(250 nM) (F) or rapamycin (100 nM) (G) for 24 hr.
N ≥ 3. *p < 0.05. **p < 0.01. ***p < 0.001. Error bars show standard deviation (SD).
From our single nucleotide-resolution m6A sequencing, we identified two mTORC1-dependent m6A sites in MXD2 (Figure 4B and Supplemental Table 1). One of these sites are highly conserved among various species (Figure 5E), indicating functional importance of this modification. Therefore, we generated MXD2 mutant whose m6A modification motif is mutated without changes in amino acid sequence (Figure 5E). In contrast to wild type MXD2, the expression of m6A site mutant MXD2 was not induced by rapamycin or torin1 (Figures 5F and 5G). Collectively, these results demonstrate that mTORC1 controls MXD2 expression via m6A modification.
WTAP induces cMyc activity and cell proliferation through MXD2
Given that mTORC1-WTAP suppresses expression of cMyc inhibitor, MXD2 (Figures 4 and 5), we further investigated the impact of this signaling axis in cMyc activity and cell growth. In WTAP knockdown cells, expression of cMyc target genes was decreased, including SRM, RPL23, CDC25A, CDC25C, and ODC1 (Figures 6A and 6B) (Dang, 2012; Ji et al., 2011). Such reduction of cMyc target gene expression was fully restored by MXD2 knockdown (Figures 6A and 6B). Mechanistically, we found that association of cMyc with MAX was decreased by WTAP knockdown, with concomitant increase in MXD2-MAX binding (Figure 6C) and decreased cMyc occupancy in target gene promoters (Supplemental Figures 5A and 5B). WTAP knockdown also decreased proliferation of cancer cell lines with overactive mTORC1 signaling (Figures 6D–6I; Supplemental Figures 5C–5L), which was restored by MXD2 knockdown (Figure 6J) and cMyc expression (Figures 6K and 6L). Notably, WTAP depletion did not significantly suppress growth of TSC2-restored LAM cells (Figures 2G and 6F; Supplemental Figure 5C), demonstrating specific effect of WTAP in survival of mTORC1-activated cells. Therefore, MXD2-cMyc signaling is a key effector of mTORC1 and WTAP-dependent cell growth.
Figure 6. WTAP promotes cMyc activity and cell proliferation through MXD2.

(A, B) qPCR analysis of cMyc target genes in HEK293E (A) or LAM 621–101 (TSC2−/−) cells (B) knocked down with WTAP and MXD2.
(C) Co-immunoprecipitation (co-IP) analysis of MAX. HEK293E cells knocked down with WTAP were transfected with MAX-V5. Immunoprecipitation was performed using IgG or anti-V5 antibodies and immunoblot analysis was performed using indicated antibodies. 1% of total cell lysate was loaded as input control.
(D, E) Crystal violet (CV) staining of LAM 621–101 (TSC2−/−) cells knocked down with WTAP (D). (E) shows the quantified absorbance of solubilized CV dye.
(F-I) Cell numbers were measured in LAM 621–101 (TSC2−/−) cells expressing empty vector or TSC2 (F), MCF7 (G), H1299 (H), or DLD1 (I) after knockdown of WTAP.
(J) CV staining analysis of LAM 621–101 (TSC2−/−) cells knocked down with WTAP and MXI1. Graph shows quantified absorbance of solubilized CV dye.
(K, L) CV staining (K) and immunoblot (L) analyses of LAM 621–101 (TSC2−/−) cells knocked down with WTAP with or without cMyc overexpression.
N ≥ 3. *p < 0.05. **p < 0.01. ***p < 0.001. Error bars show standard deviation (SD).
Discussion
Here, we report that in response to growth factor stimulation, mTORC1 signaling increases the expression of m6A methyltransferase adaptor protein, WTAP, to induce m6A RNA modification. WTAP is an essential adaptor for the METTL3-METTL14 methyltransferase, and loss of WTAP abrogates the formation of m6A in mRNA (Ping et al., 2014; Schwartz et al., 2014). In addition, WTAP is required to maintain the nuclear localization and nuclear speckle enrichment of the m6A writer complex, which is where methylation occurs (Ping et al., 2014). Despite the central role of WTAP in the m6A writer complex, mechanisms that control its expression have not previously been identified. We show that a structured element in the WTAP 5’UTR confers sensitivity to eIF4A/4B, which accounts for its translational regulation by mTORC1. Therefore, our findings indicate that controlling the level of WTAP protein is a key regulatory mechanism used by growth factors and mTORC1 to promote the m6A methylation of RNA substrates during cell growth.
The cMyc transcription factor is a well-known oncogene that promotes expression of a variety of cell growth-related genes (Dang, 2012; Ji et al., 2011). mTORC1 signaling has been shown to activate cMyc via increased transcription (Masui et al., 2013), translation (Csibi et al., 2014; West et al., 1998), and protein stabilization (Zhang et al., 2006). Our data indicate another layer of mTORC1-mediated cMyc activation by degrading the mRNA of its suppressor, MXD2 (Figure 7). MXD2 inhibits transcriptional activity of cMyc by preventing its binding to Max, a cMyc transcriptional co-activator (Gan et al., 2010; Schreiber-Agus et al., 1995). Expression of cMyc has also been shown to be regulated by m6A methylation (Huang et al., 2018; Su et al., 2018; Vu et al., 2017). Considering the convergence of mTORC1 and cMyc activities in a variety of cellular anabolic processes (Chen et al., 2018; Pourdehnad et al., 2013), careful orchestration of cMyc expression and activity upon growth factor signaling would be critical for mTORC1-dependent cell growth and proliferation, and improper regulation is likely a major contributor to tumorigenesis.
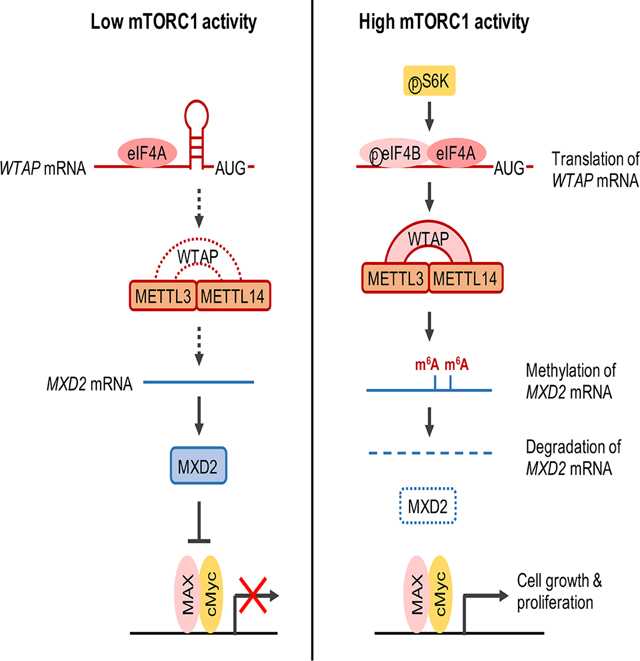
Figure 7. mTORC1 promotes cell growth by inhibiting cMyc suppressor, MXD2, through m6A RNA modification.

mTORC1 increases cellular m6A levels by increasing the expression of methyltransferase complex adaptor protein, WTAP, through eIF4A/4B-dependent translation. In cells with high mTORC1 activity, the increased m6A modification on MXD2 mRNA decreases its stability, thereby suppressing MXD2 protein expression (right panel). In cells with low mTORC1-WTAP activity, MXD2 inhibits association of cMyc with its transcriptional co-activator MAX, which leads to decreased cMyc transcriptional activity and cell proliferation (left panel).
Activation of mTORC1 signaling is detected in a majority of cancers (Lam et al., 2018; Mossmann et al., 2018). Therefore, small molecule inhibitors targeting mTORC1, such as rapamycin and its analogs (rapalogs), have been examined for their potential efficacy against a variety of cancers. However, due to inhibition of a broad spectrum of mTORC1-regulated effectors that contribute to undesired side effects and the suppression of negative feedback mechanisms that normally suppress upstream inputs such as Akt signaling, rapalogs in monotherapy have had modest success in the clinic (Li et al., 2014; Sawyers, 2003). Thus, discovering new connections of this important signaling system to downstream effectors critical to the control of cell growth and survival are needed. Our data indicate that mTORC1/S6K-dependent regulation of eIF4A/4B and WTAP may provide a promising therapeutic target for mTORC1-driven cancers as well as other metabolic diseases associated with dysregulated mTORC1 signaling. Overexpression of WTAP has also been implicated in various malignancies including glioblastoma (Ji et al., 2011), leukemia (Bansal et al., 2014), bladder (Chen and Wang, 2018), renal (Tang et al., 2018b) and liver (Chen et al., 2019) cancers. Therefore, suppression of WTAP expression using eIF4A inhibitors including silvestrol and eFT226, which are currently in preclinical and clinical trials for several types of cancers (Cunningham et al., 2018), can be a potential therapeutic approach for the treatment of mTORC1-active and WTAP-overexpressing cancers. Similarly, the recently developed small molecule inhibitors targeting METTL3, may also hold a therapeutic promise (Tzelepis et al., 2019).
Tumors rewire chemical modifications of RNAs to promote cell proliferation and survival (Barbieri and Kouzarides, 2020; Delaunay and Frye, 2019). Here we reveal how growth factors and mTORC1 signaling regulate m6A RNA modification and gene expression. In support of the findings presented here, Villa et al. (In press) have found that mTORC1 coordinates S-adenosyl methionine (SAM) production by mTORC1 to expression of WTAP and increased m6A levels. In addition, a second mechanism for the regulation of m6A has been revealed by Tang et al. (Tang et al., 2021), which showed that mTORC1 stabilizes METTL3-METTL14 chaperonin containing TCP1 (CCT) complex. Collectively, these works provide a rationale for the characterization of new cancer biomarkers and therapeutics targeting RNA modifications downstream of oncogenic signaling pathways.
Limitations of the study
We have found that mTORC1 regulates WTAP expression through the highly-structured region in its 5’UTR. In the current study, we have investigated this mechanism only in human and mouse systems. However, given that both mTORC1 signaling and m6A machineries are evolutionarily conserved from yeast to humans (Meyer and Jaffrey, 2017; Saxton and Sabatini, 2017), it will be interesting to further study whether this regulation is conversed in other species where mTORC1 and m6A pathways play important physiological functions. Our results demonstrate that WTAP is a major effector of mTORC1-dependent m6A regulation. Nevertheless, mTORC1 is known to utilize multiple layers of control in fine tuning and coordinating, from a variety of environmental inputs, the regulation of important downstream processes. One such example is the regulation of lipid metabolism. mTORC1 induces lipogenic enzymes through SREBP1/2 transcription factors by increasing SREBP expression, by regulating the proteolytic cleavage of SREBP, and by inactivating its negative regulators (Ricoult and Manning, 2013). mTORC1 also promotes mRNA splicing and stability of lipogenic enzyme transcripts (Lee et al., 2017). Furthermore, mTORC1 induces the synthesis of precursors for lipid synthesis, including acetyl-CoA and glycerol backbones, by increasing the glycolytic flux (Valvezan and Manning, 2019). Therefore, it would not be surprising and indeed makes biological sense if mTORC1 controls m6A modification and processing of several mRNAs through a variety of integrated and coordinated mechanisms.
STAR Methods
RESOURCE AVAILABILITY
Lead Contact
Further information and requests for resources and reagents should be directed to and will be fulfilled by the Lead Contact, John Blenis (job2064@med.cornell.edu).
Materials Availability
All reagents generated in this study are available from the Lead Contact without restriction.
Data and Code Availability
The image dataset supporting the current study have been deposited in a public repository; Mendeley Data: http://dx.doi.org/10.17632/7sgjcvjpt9.1. The miCLIP-seq and RNA-seq data files dataset generated in this study is available at GEO: GSE165690. These datasets can be found at https://www.ncbi.nlm.nih.gov/geo/query/acc.cgi?acc=GSE152633 using the following token: uzghcsuafjknzwt.
EXPERIMENTAL MODEL AND SUBJECT DETAILS
Details of cell lines used have been provided under section “Cell lines and cell culture” and details of mice used have been provided under “Mouse studies”.
Cell lines and cell culture
HEK293E and HEK293T cells were obtained from ATCC and GenHunter, respectively. Human renal angiomyolipoma-derived LAM 621–101 cells stably expressing empty vector or TSC2 were provided by Elisabeth Henske (Siroky et al., 2012). BT549, DLD1, MCF7, and NCI-H1299 cells were obtained from ATCC. HEK293E, HEK293T, NCI-H1299, BT549, and LAM 621–101 Cells were grown in DMEM (Gibco) with 10% FBS (Sigma-Aldrich-Aldrich) at 37°C with 5% CO2. MCF7, and DLD1 cells were cultured in RPMI (Corning) with 10% FBS (Sigma-Aldrich-Aldrich).
Mouse studies
All animal procedures were approved by the Institutional Animal Care and Use Committee (IACUC) at Weill Cornell Medicine. Nine-month-old male Tsc2tm1Djk/+ mice on the A/J strain background (referred to as Tsc2+/− in this article) (Onda et al., 1999; Woodrum et al., 2010) were provided by Tuberous Sclerosis Alliance and Van Andel Institute. Wild type male A/J strain mice of a similar age were obtained from the Jackson Laboratory (Stock No. 000646). Rapamycin (LC Laboratories) was dissolved in DMSO as 20 mg/ml stock. The stock solution was freshly diluted with vehicle (0.25% Polyethylene Glycol and 0.25% Tween-80) for the treatment. Intraperitoneal injection of vehicle or rapamycin (8 mg/kg) was administered every other day for 8 weeks at the beginning of 11-month of age. MRI was taken before (0 week) and after (8 week) the drug treatment to detect kidney cystadenomas.
METHOD DETAILS
Single nucleotide-resolution mapping of m6A (miCLIP)
m6A mapping was performed as previously described (Linder et al., 2015). Briefly, 15 μg of twice poly(A) purified RNA from HEK293E cells (samples in biological triplicate) was sheared using an RNA fragmentation reagent (Thermo Fisher Scientific) at 70°C for 7 minutes. 150 ng of each sample was saved as input for RNA-seq. Samples were then incubated with 15 μg of antim6A antibody (Abcam ab151230) for 2 hr at 4°C and then UV crosslinked twice at 150 mJ⋅sec−1/cm2. Following one-hour incubation with Protein A/G magnetic beads (Thermo Fisher Scientific), the beads were extensively washed as previously described. After washing, 3’ ends were dephosphorylated with T4 Polynucleotide Kinase (PNK, New England Biolabs) and pre-adenylated adapters were ligated to the 3’ end. Samples were radiolabeled with γ−32P-ATP (Perkin Elmer) and PNK, run on a 4–12% Bis-Tris NuPAGE gel (Thermo Fisher Scientific) and transferred to 0.45 μm a nitrocellulose membrane. RNA was liberated from the membrane using proteinase K (New England Biolabs) in 50 mM Tris [pH 7.4], 100 mM NaCl, 0.5% SDS, 1 mM EDTA at 50°C for one hour. Samples were then phenol:chloroform (Thermo Fisher Scientific) extracted and ethanol precipitated. Barcoded reverse transcription primers with unique molecular identifier barcodes were annealed to adapter sequences and reverse transcribed using Superscript IV (Invitrogen). The resulting cDNA was gel purified and eluted overnight at 37°C. cDNA was then circularized using Circligase I (Lucigen) for 8 hr at 60°C. Libraries were amplified using KAPA HiFi (Kapa Biosystems) and primers removed with Ampure XP beads (Beckman Coulter). Paired-end 50 nucleotide reads were sequenced using a HiSeq 2500 at the Weill Cornell Medicine Epigenomics Core Facility.
Bioinformatic analysis of miCLIP
Analysis of miCLIP reads was performed as previously described (Linder et al., 2015). First, adapter sequences were removed using Flexbar (--pre-trim-phred 30) and demultiplexed using pyBarcodeFilter.py (Dodt et al., 2012). PCR duplicates were removed using pyCRAC.py (Webb et al., 2014). The forward and reverse-complement reverse reads were concatenated and aligned using Burrow-Wheeler Aligner (bwa aln -n 0.06 -q 20 GRCh38/hg38.fa). Single-nucleotide m6A sites were called using CIMS.pl in the CTK package (Shah et al., 2017). High-confidence m6A sites were called by filtering adenosines followed by a C→T transition with a p-value < 0.05 that fell within a DRACH consensus sequence. Unique m6A sites from biological triplicates were pooled for metagene analysis and motif analysis using MEME-CHIP (Machanick and Bailey, 2011). Coverage at m6A sites was determined by first normalizing library sizes to the number of unique transcripts per million reads (uTPM). Read coverage at m6A sites was determined using BEDTools Coverage (Quinlan and Hall, 2010). For cumulative distribution plot, the number of m6A sites for transcripts in control (DMSO treated) cells was calculated and used to determine log2 fold-change for input RNA-seq following binning transcripts based on the number of m6A sites.
Bioinformatics analysis
For the gene ontology (GO) enrichment analysis (Supplemental Table 1 and 2), the list of genes was uploaded to the DAVID database website (https://david.ncifcrf.gov/) for biological pathway analysis.
LC-MS analysis of m6A
Total RNA was isolated by Purelink RNA miniprep kit (Ambion) or Trizol (Invitrogen). Poly(A) RNAs were purified by Oligo(dT) beads (Thermo Fisher Scientific or NEB) and RNA clean up kit (Zymo Research). 100–200 ng of twice-purified poly(A)-RNA was digested with 1 unit of nuclease P1 (Sigma-Aldrich) for 2 hr at 37°C followed by 1 unit of alkaline phosphatase (Sigma-Aldrich) treatment for 2 hr at 37°C. Adenosine and m6A levels were analyzed by quadrupole-time of flight mass spectrometer (Q-TOF, Agilent) or quadrupole-orbitrap mass spectrometer (Q-Exactive Plus Hybrid Quadrupole-Orbitrap, Thermo Fisher) mass spectrometers. Q-TOF operating in positive ion mode was coupled to C18 chromatography via electrospray ionization and used to scan from m/z 200 to 300 at 1 Hz and 15,000 resolution. LC separation was on an Acquity UPLC BEH C18 column (2.1 mm x 100 mm, 1.75 μm particle size, 130 Å pore size; Waters) at 60°C using a gradient of solvent A (100% water) and solvent B (100% methanol). Flow rate was 400 μL/min, except that from 6 min to 8 min flow rate was increased to 700 μL/min. The LC gradient was: 0 min, 10% B; 1 min, 10% B; 5 min, 30% B; 7 min, 100% B; 11 min, 100% B; 11.5 min, 10% B; 14 min, 10% B. Q-Exactive operating in positive ion mode was coupled to hydrophilic interaction chromatography (HILIC) via electrospray ionization and used to scan from m/z 250 to 300 and 140,000 resolution. LC separation was on an Xbridge BEH amide column (2.1 mm x 150 mm, 2.5 μm particle size, 130 Å pore size; Waters) at 25°C using a gradient of solvent A (5% acetonitrile in water with 20 mM ammonium acetate and 20 mM ammonium hydroxide) and solvent B (100% acetonitrile). Flow rate was 350 μL/min. The LC gradient was: 0 min, 75% B; 3 min, 75% B; 4 min, 50% B; 5 min, 10% B; 7 min, 10% B; 7.5 min, 75% B; 11 min, 75% B.
2D-TLC analysis of m6A
Two-dimensional thin-layer chromatography (2D-TLC) analysis of m6A levels on mRNA was performed as described previously (Kruse et al., 2011). Briefly, 100 ng of twice-purified poly(A)-RNA was digested with 2 units of ribonuclease T1 for 2 hr at 37°C with RNAse inhibitor (Invitrogen). Digested mRNA was labeled with 32P-ATP by incubating the digested mRNAs with T4 PNK (10 units, NEB) and 0.4 mBq [γ−32P] ATP (PerkinElmer) for 30 min at 37°C. After labeling, 10 units of apyrase (NEB) was added for 30 min at 30°C to hydrolyze γ-phosphate from free 32P-ATP. After phenol:chloroform extraction and ethanol precipitation, samples were resuspended in 8 μl of nuclease-free water and incubated with 1 unit of nuclease P1 for 3 h at 37°C. The nucleotides were then spotted on the glass-backed PEI-cellulose plates (Merck-Millipore) and separated by two different separation stages as described previously (Mauer et al., 2017). The plates were exposed to a storage phosphor screen (GE Healthcare Life Sciences) and processed on a Typhoon Trio imager (GE Healthcare Life Sciences). Imagestudio software (Licor) was used to quantify the intensity of individual spots. The relative amount of m6A was measured as a percentage of the total intensity of A, C and U spots, as described previously (Mauer et al., 2017).
MRI imaging of mouse kidney
MRI scans were performed at the Animal Imaging Core Facility at Memorial Sloan Kettering Cancer Center (MSKCC) using a 9.4T 20-cm bore Bruker Biospec scanners (Bruker Biospin MRI GmbH, Ettlingen) equipped with an ID 114 mm maximum strength of 530 mT/m Bruker gradient. An ID 40 mm Bruker volume resonator was used for RF excitation and MRI signal acquisition. The mice were anesthetized with 2% isoflurane gas (Baxter Healthcare Corporation) in oxygen. Animal respiration was monitored with a small animal physiological monitoring system (SA Instruments). To image kidney area, respiratory coronal T2-weighted images were acquired using fast spin-echo Rapid Acquisition with Relaxation Enhancement (RARE) sequence (TR 2.0 s, TE 33 ms, RARE factor of 8, slice thickness of 0.4 mm, FOV 30 mm, in-plane resolution of 117 um, and 10 averages). Kidney cystadenomas in the MRI images were categorized as cyst (white spots), papillary (partially filled grey spots), and solid tumors (grey spots) as previously described (Kalogerou et al., 2012; Lee et al., 2009).
Histological analysis of kidney cystadenoma
After 8 weeks of drug treatment, mice were euthanized by carbon dioxide (CO2). Kidneys were fixed with 10% neutral buffered formalin (RICCA Chemical) for 48 hours and transferred to 70% ethanol. The fixed tissues were sliced sagitally, processed in alcohol and xylene, and paraffin-embedded following standard procedures. Slides were prepared with a series of 5 μm coronal sections taken at 700 μm intervals. Slides were haematoxylin and eosin (H&E) stained, and whole-slide images were generated on a slide scanner (Pannoramic 250 Flash III, 20x/0.8NA objective, 3DHistech) at a pixel size of 0.2431 μm per pixel. Images were analyzed and annotated using Caseviewer 2.2 software (3D Histech) by blinded researchers, including a board-certified veterinary pathologist (SM). Lesions were scored semi-quantitatively using a previously described method (Lee et al., 2009). Briefly, the tumor score was calculated by the sum of the tumor lesion scores per kidney according to the tumor lesion area. Tumor lesion score (mm2): 0 (0), 1 (0 < x ≤ 0.09), 2 (0.09 < x ≤ 0.2), 3 (0.2 < x ≤ 0.35), 4 (0.35 < x ≤ 0.5), 5 (x > 0.5).
Expression constructs and mutagenesis
Expression constructs were transfected using Lipofectamine 2000 or 3000 reagent (Invitrogen). METTL3 (Addgene plasmid 53739), METTL14 (Addgene plasmid 53740), cMyc (Addgene plasmid, 74164), GFP (Addgene plasmid 13031), or Max (Addgene plasmid ,82944) were obtained from Addgene. The human MXD2 plasmid, cloned into pcDNA 3, was a gift from Dr. Almut Schulze (German Cancer Research Center, Germany) (Delpuech et al., 2007). To generate WTAP expression plasmids, the coding sequence of human WTAP with or without 5’UTR (NM_004906.4) was cloned into pENTR vector, and pLenti-blasticidin-based plasmids were generated by Gateway LR reaction (Invitrogen). The constitutively active S6K1 (pKH3-S6K1-F5A/T389E/R3A) is previously described (Csibi et al., 2014; Schalm et al., 2005). 15–30 nM siRNAs (Sigma-Aldrich-Aldrich) were transfected using Lipofectamine RNAiMAX reagent (Invitrogen): Negative control (SIC001, SIC002), METTL3 (SASI_Hs01_00044317, SASI_Hs01_00044318, SASI_Hs01_00044319, SASI_Hs01_00044320), METTL14 (SASI_Hs01_00179440, SASI_Hs01_00179441, SASI_Hs02_00354390, SASI_Hs01_00179442), WTAP (SASI_Hs01_00039282, SASI_Hs01_00039283, SASI_Hs01_00039284, SASI_Hs01_00102839, SASI_Hs01_00102842), YTHDF2 (SASI_Hs01_00133214, SASI_Hs01_00133215), YTHDF3 (SASI_Hs01_00202277, SASI_Hs01_00202278), mTOR (SASI_Hs01_00203144, SASI_Hs01_00203145), Raptor (SASI_Hs01_00048380, SASI_Hs01_00048381, SASI_Hs01_00048382), Rictor (SASI_Hs01_00223573, SASI_Hs01_00223574, SASI_Hs01_00366683), S6K1 (SASI_Hs01_00148595, SASI_Hs01_00148596, SASI_Hs01_00148597), S6K2 (SASI_Hs01_00218651, SASI_Hs01_00218652, SASI_Hs01_00218653), eIF4A1 (SASI_Hs02_00331809, SASI_Hs02_00331808), eIF4A2 (SASI_Hs01_00119368, SASI_Hs01_00119367), eIF4B (SASI_Hs01_00121466, SASI_Hs02_00331818), and MXD2 (SASI_Hs01_00139543, SASI_Hs01_00139544, SASI_Hs01_00139545). shRNA construct was obtained from the RNAi Consortium (TRC) at the Broad Institute: shWTAP (TRCN0000231426, targeting 3’UTR; TRCN0000001074 and TRCN0000231422, targeting CDS). Non-mammalian targeting control shRNA (shNTC) was obtained from Sigma-Aldrich-Aldrich (Sigma-Aldrich-Aldrich, SHC002). METTL3 catalytic dead mutant METTL3-D395A/W398A (A1184C/TG1192GC) and MXD2 m6A site mutant (C882T) were generated using QuickChange site-directed mutagenesis kit (Strategene).
CRISPR/Cas9 knockout
Guide RNA sequence against human WTAP (CTGACAAACGGACCAAGTAA) was cloned into lentiCRISPRv2 vector (Sanjana et al., 2014). HEK293T cells were co-transfected with lentiCRISPRv2 construct, lentiviral packaging, and envelope plasmids to generate virus. HEK293E cells were infected with viral supernatants with polybrene (8 μg/mL) and selected with puromycin (2 μg/mL). After selection, cells were serial diluted in 96-well plates to isolate single cell clone of WTAP knockout cells, followed by immunoblot analysis of WTAP to confirm knockout efficiency.
Generation of stable cell lines
To generate lentiviruses, HEK293T cells were co-transfected with the viral plasmid of interest with packaging and envelope plasmids using Lipofectamine 2000. The next day media was changed, and virus-containing supernatants were collected at 48 hr after transfection. Target cells were infected with 0.45 μM-filtered viral supernatants in the presence of a serum-containing medium supplemented with 8 μg/mL polybrene for 16 hr. After 16 hr, viral-containing medium was removed and cells were grown in serum-containing medium for 24 hr. Virus infected cells were treated with puromycin (2 μg/ml) for selection. The knock-down of target protein was confirmed by immunoblot or qPCR analysis.
Crystal violet staining
Cells were fixed with 4% methanol-free formaldehyde (Polysciences) and incubated with 0.1% crystal violet solution (Sigma-Aldrich-Aldrich) for 30 min. After rinsing five times with PBS, the plates were scanned for image analysis. For quantification, dyes were eluted using methanol, and the absorbance of crystal violet solutions was measured at 570 nm using Envision plate reader (PerkinElmer).
Cell growth analysis
Cells seeded on 6-well plates (LAM 621–101, 1 × 10⁵ cells; MCF7, 8 × 10⁴ cells; H1299 and DLD1, 5 × 10⁴ cells) were grown in the media (MCF7 and DLD1, RPMI; LAM 621–101 and H1299, DMEM) with 10% FBS. Cell numbers were counted on the indicated day using Multisizer 3 Coulter Counter (Beckman Coulter).
Immunoblot analysis
Cells were homogenized on ice either using RIPA (40 mM HEPES [pH 7.4], 1 mM EDTA, 120 mM NaCl, 0.5 mM DTT, 0.1% Brij-35, 0.1% deoxycholate, 0.5% NP-40) or Triton X-100 (40 mM HEPES [pH 7.4], 1 mM EDTA, 120 mM NaCl, 0.5 mM DTT, 1% Triton X-100) lysis buffers supplemented with protease inhibitors (250 μM PMSF, 5 μg/ml pepstatin A, 10 μg/ml leupeptin, 5 μg/ml aprotinin) and phosphatase inhibitors (10 mM β-glycerophosphate, 1 mM NaF, 1 mM Na3VO4). Cell lysates were cleared by centrifugation at 13,000 rpm at 4°C for 30 min. Bradford protein assay or detergent compatible (DC) protein assay (Bio-rad) was used to measure protein concentration. Proteins were boiled for 10 min with Laemmli sample buffer. SDS‐PAGE gels were used to separate proteins (15–60 μg) and transferred to nitrocellulose membrane (Amersham Biosciences). Membranes were then incubated with Odyssey blocking solution (LI-COR Biosciences), followed by incubation with primary and IRDye secondary (LI-COR Biosciences) antibodies. Immunoblot signals were detected and quantified by Odyssey imaging system (LI-COR Biosciences). Immunoblot images are representative of at least two independent experiments. Antibodies against cMyc, pS6(S240/S244), S6K1, mTOR, Raptor, Rictor, eIF4A1, eIF4B, and TSC2 (Cell Signaling Technology); METTL3 (Proteintech); METTL14, MXD2, and Vinculin (Sigma-Aldrich-Aldrich); WTAP (Proteintech and Abcam for human; Novus for mouse); S6K2 (Genetex); MAX (Bethyl); and HA (Santa Cruz) were used.
Purification of RNA and proteins from tissues
Simultaneous isolation of RNA and protein from tissues was performed following the protocol in Kopec et al. (Kopec et al., 2017). Briefly, tissues were lysed with Trizol (Invitrogen) and homogenized using a tissuelyser (Qiagen). After adding chloroform, the top layer of the aqueous solution was processed for RNA purification following the manufacturer’s protocol. For purification of proteins, 100% ethanol was added to the bottom layer of the aqueous solution. After centrifugation, isopropanol was added to the supernatant to precipitate proteins. Protein pellet was washed with 95% ethanol and dissolved in lysis buffer (20 mM EDTA,140 mM NaCl, 5% SDS, 100 mM Tris [pH 8.0]).
Quantitative RT-PCR analysis
PureLink RNA isolation kit (Life Technologies) or Trizol (Invitrogen) was used to isolate total RNA from cells and tissues. Genomic DNA was removed by DNAse I (Sigma-Aldrich-Aldrich) treatment. RNA was reverse transcribed using iScript kit (Bio-rad) unless otherwise indicated. The resulting cDNA was analyzed by quantitative RT-PCR (qPCR) using SYBR green master mix (Life Technologies) on QuantStudio6 Real-Time PCR system (Life Technologies). mRNA levels were calculated by delta-delta CT method using housekeeping genes ACTIN, GAPDH, PPIB, and TBP (human); or Actin, Tbp and, 36b4 (mouse) as controls. Primer list is in Supplemental Table 3.
Polysome analysis
After treatment of 100 μg/ml cycloheximide (Sigma-Aldrich-Aldrich) for 5 min, cells were washed twice with ice-cold PBS containing 100 μg/ml cycloheximide and solubilized by polysome lysis buffer (15 mM Tris [pH 7.4], 15 mM MgCl2, 250 mM NaCl, 1% Triton X-100, 1 mM DTT, 100 μg/ml cycloheximide, 400 U/ml RNAseOut (Invitrogen), protease inhibitors). Lysates were centrifuged for 15 min at 13,000 rpm at 4°C. Cell lysates containing the same amount of total RNAs were loaded onto 20% to 50% sucrose gradient generated by Gradient Station (Biocomp). Tubes were centrifuged at 36,000 rpm for 2 hr at 4°C on SW40Ti rotor (Beckman Coulter). After centrifugation, fractions were collected using Foxy JR Fraction Collector and UA-6 Absorbance Detector (Teledyne Isco). RNA was extracted using TurboCapture 96 mRNA Kit (Qiagen) and reverse transcribed using High-Capacity cDNA Reverse Transcription Kit (Applied Biosystems). mRNA levels in the resulting cDNA were analyzed by qPCR.
Small molecule inhibitors
Insulin, PF4708671, actinomycin D, and cycloheximide (Sigma-Aldrich-Aldrich); Torin1 (Tocris Bioscience); Rapamycin (Calbiochem and LC Laboratories); and Silvestrol (ChemScene).
mRNA stability assay
Actinomycin D (5 μg/mL) was treated to cells for the indicated times, and the mRNA levels at each time point were analyzed by qPCR. For 5-ethynyl uridine labeling, 5-ethynyl uridine (0.2 mM) was added to the complete culture medium for overnight and washed with PBS twice and harvested the samples for 0 hour and other cells were treated with rapamycin (100 nM) or torin1 (250 nM) for 24 hours. Total RNA was isolated by Purelink RNA miniprep kit (Ambion), and EU labeled RNAs were isolated using a commercially available kit (Click-iT Nascent RNA Capture Kit, life technologies).
Immunoprecipitation
Cells on a 10-cm plate were washed twice with ice-cold PBS and harvested into 15 ml tube. Cells were collected by centrifugation at 1,000 x g at 4 °C for 5 min. Cell pellets were re-su spended with 1 ml of lysis buffer (20 mM Tris HCl pH 8, 137 mM NaCl, 1% Nonidet P-40, 2 mM EDTA) supplemented with protease inhibitors (250 μM PMSF, 5 μg/ml pepstatin A, 10 μg/ml leupeptin, 5 μg/ml aprotinin) and phosphatase inhibitors (10 mM β-glycerophosphate, 1 mM NaF, 1 mM Na3VO4), and incubated on ice for 30 min. After centrifugation at 13,000 rpm at 4 °C for 30 min, 1mg of lysates were incubated with anti-V5 (Sigma-Aldrich) or anti-Flag agarose affinity gels (Sigma-Aldrich) to pull down immune complexes for 1.5 hours at 4 °C. Beads were washed with lysis buffer for 3 times and were boiled with 2X Laemmli sample buffer for 10 min. Boiled beads were briefly centrifuged and supernatants were subjected to immunoblot analysis.
ChIP-qPCR
Cells were fixed with 1% formaldehyde for 15 min in room temperature and quenched with 0.125 M glycine for 5 minutes in room temperature. ChIP assays was performed using a commercially available kit (ChIP-IT Express, Active Motif). Briefly, cell pellet was lysed to isolate chromatin using lysis buffer, followed by disruption with a Dounce homogenizer. LAM 621–101 cells chromatin was sheared enzymatically for 10 minutes at 37 C (ChIP-IT Express Enzymatic° Shearing Kit, Active Motif). Immunoprecipitation was performed using anti-cMyc (9402, Cell Signaling) or anti-Rabbit IgG (2729, Cell Signaling) antibodies. Complexes were washed, eluted from the beads with elution buffer containing SDS buffer, and followed by RNase and proteinase K treatment. Crosslinks were reversed by incubation overnight at 65°C, and ChIP DNA was purified with a Chromatin IP DNA purification kit (Active Motif) and qPCR was performed with SYBR Green master mix on a Step One Real-Time PCR system (all Life Technologies) using the primer sets for MAP2K1, CCNB1, CDK4, RPL4, and RPL35 listed in Table S3 (Barrilleaux et al., 2013; Ciribilli and Borlak, 2017; Menssen and Hermeking, 2002).
In silico analysis of 5’UTR structure
The Gibbs free energy and secondary structure of 5’UTR were analyzed by the RNAfold web server (Lorenz et al., 2011): Actin (NM_001101.5), BCL2 (NM_000633.2), cMyc (NM_002467.1), METTL3 (NM_019852.5), METTL14 (NM_020961.4), ODC1 (NM_002539.3), PPIB (NM_000942.5), and WTAP (NM_004906.4).
Data availability
miCLIP-seq and RNA-seq data files have been deposited to the NCBI Gene Expression Omnibus under accession number GEO: GSE152633. These datasets can be found at https://www.ncbi.nlm.nih.gov/geo/query/acc.cgi?acc=GSE152633 using the following token: uzghcsuafjknzwt.
QUANTIFICATION AND STATISTICAL ANALYSIS
Data obtained from LC-MS, 2D-TLC, qPCR, immunoblot, and crystal violet staining assays are statistically analyzed using Student’s t-test and the graphs show mean +SD or ± SD. Statistical significance of cumulative distribution plot is determined using Tukey’s HSD test. Tumor scores of Tsc2+/− mice and mRNA levels from polysome analysis are statistically analyzed using Student’s t-test and the error bars show mean ± SEM. Detailed methods and p-value are described in figure legends and individual method sections.
Supplementary Material
Excel spreadsheet: Table S1. Analysis of miCLIP results, Related to Figure 5. (A) m6A and input mRNA levels analyzed by miCLIP and RNA-seq. HEK293E cells were serum starved overnight and treated with insulin (200 nM, 30 hr) with or without pretreatment of torin1 (250 nM). N = 3.
(B) Subset of the genes from (A) whose m6A levels were decreased by torin1 (log2 (Torin1/DMSO) < −0.5, p < 0.05).
(C) Subset of the genes from (B) whose mRNA levels were increased by torin1 (log2 (Torin1/DMSO) > 0.5, p < 0.05).
(D) Gene Ontology (GO) analysis of the genes in (C).
Excel spreadsheet: Table S2. qPCR screen of miCLIP candidates, Related to Figure 5. (A, B) qPCR analysis of 105 genes from Supplemental Table 1D which are categorized as cellular macromolecule metabolic process. LAM 621-101 (TSC2−/−) cells were treated with torin1 (250 nM, 24 hr) (A) or siRNAs against METTL13/METTL14 or WTAP (B). Results are shown for 104 genes except ZNF664 (not expressed in LAM 621-101 cells).
(C) Subset of the genes from (A) and (B) whose mRNA levels were increased by torin1, siMETTL3/METTL14, and siWTAP (qPCR fold change > 1.2, p < 0.05).
Excel spreadsheet: Table S3. Primers list, Related to all Figures.
Excel spreadsheet: Table S4. siRNAs list, Related to all Figures.
KEY RESOURCES TABLE
| REAGENT or RESOURCE | SOURCE | IDENTIFIER |
|---|---|---|
| Antibodies | ||
| Rabbit monoclonal anti-cMyc | Cell Signaling Technology | Cat#15605, RRID:AB_1903938 |
| Rabbit polyclonal anti-S6K1 | Cell Signaling Technology | Cat#2708; RRID: AB_390722 |
| Rabbit monoclonal anti-pS6(S240/S244) | Cell Signaling Technology | Cat#5364; RRID: AB_10694233 |
| Rabbit monoclonal anti-mTOR | Cell Signaling Technology | Cat#5048, RRID:AB_10828101 |
| Rabbit monoclonal anti-Raptor | Cell Signaling Technology | Cat#2280, RRID:AB_561245 |
| Rabbit polyclonal anti-Rictor | Cell Signaling Technology | Cat#9476, RRID:AB_10612959 |
| Rabbit anti-eIF4A1 | Cell Signaling Technology | Cat#2490, RRID:AB_823487 |
| Rabbit anti-eIF4B | Cell Signaling Technology | Cat#3592, RRID:AB_2293388 |
| Rabbit monoclonal anti-TSC2 | Cell Signaling Technology | Cat#4308, RRID:AB_10547134 |
| Rabbit polyclonal anti-METTL3 | Proteintech | Cat#15073–1-AP, RRID:AB_2142033 |
| mouse monoclonal anti-Vinculin | Sigma-Aldrich | Cat#V9264; RRID: AB_10603627 |
| Rabbit polyclonal anti-METTL14 | Sigma-Aldrich | Cat#HPA038002, RRID:AB_10672401 |
| Rabbit polyclonal anti-MXD2 | Sigma-Aldrich | Cat#HPA035319, RRID:AB_10670588 |
| Mouse monoclonal anti-WTAP | Proteintech | Cat#60188–1-Ig, RRID:AB_10859484 |
| Rabbit anti-WTAP | Abcam | Cat#ab195380, RRID:AB_2868572 |
| Rabbit anti-WTAP | Novus | Cat#NBP1–83040, RRID:AB_11041336 |
| Rabbit polyclonal anti-S6K2 | Gene Tex | Cat#GTX101886, RRID:AB_1951783 |
| Mouse monoclonal anti-HA | Santa Cruz Biotechnology | Cat#sc-7392, RRID:AB_627809 |
| Rabbit polyclonal anti-cMyc (ChIP) | Cell Signaling Technology | Cat#9402, RRID:AB_2151827 |
| Rabbit polyclonal anti-MAX | Bethyl | Cat#A302–866A, RRID:AB_10634559 |
| Rabbit polyclonal Anti-N6-methyladenosine (m6A) antibody | Abcam | Cat#ab151230, RRID:AB_2753144 |
| Rabbit Normal IgG | Cell Signaling Technology | Cat#2729, RRID:AB_1031062 |
| Chemicals, Peptides, and Recombinant Proteins | ||
| Anti-Flag agarose affinity gel | Sigma-Aldrich | Cat#A2220 |
| Rapamycin | Calbiochem | Cat#553210 |
| Rapamycin | LC Laboratories | Cat#R-5000 |
| PF4708671 | Sigma-Aldrich | Cat#PZ0143 |
| Torin1 | Tocris Bioscience | Cat#4247 |
| Actinomycin D | Sigma-Aldrich | Cat#A1410 |
| RNase inhibitor | Invitrogen | Cat#10777019 |
| Anti-V5 agarose affinity gel | Sigma-Aldrich | Cat#A7345 |
| Lipofectamine RNAiMAX Transfection Reagent | Invitrogen | Cat#13778075 |
| Lipofectamine 3000 reagent | Invitrogen | Cat#L3000015 |
| DNase I | Sigma-Aldrich | Cat#AMPD1 |
| [γ−32P]-ATP | Perkin Elmer | Cat#NEG035C001MC |
| RNA Fragmentation Reagents | Thermo Fisher Scientific | Cat#AM8740 |
| T4 Polynucleotide Kinase | New England Biolabs | Cat#M0201S |
| Apyrase | New England Biolabs | Cat#M0398L |
| TRIzol | Invitrogen | Cat#15596018 |
| Protein A/G magnetic beads | Thermo Fisher Scientific | Cat#88802 |
| Proteinase K | New England Biolabs | Cat#P8107 |
| Lipofectamine 2000 reagent | Invitrogen | Cat#11668500 |
| NuPAGE 4–12% Bis Tris Protein Gels | Thermo Fisher Scientific | Cat#NP0321BOX |
| Phenol:Chloroform:IAA, 25:24:1, pH 6.6 | Thermo Fisher Scientific | Cat#AM9730 |
| SuperScript IV Reverse Transcriptase | Invitrogen | Cat#18090010 |
| Circligase I | Lucigen | Cat#CL4111K |
| AMPure XP for PCR Purification | Beckman Coulter | Cat#A63880 |
| Nuclease P1 from Penicillium citrinum | Sigma-Aldrich | Cat#N8630–1VL |
| Phosphatase, Alkaline from Escherichia coli | Sigma-Aldrich | Cat#P5931–100UN |
| TLC PEI Cellulose F | Merck-Millipore | Cat#105725 |
| Silvestrol | Cheme scene | Cat#CS-0543 |
| Insulin solution human | Sigma-Aldrich | Cat#I9278 |
| Crystal Violet | Sigma-Aldrich | Cat#C3886 |
| Oligo d(T)25 Magnetic Beads | New England Biolabs | Cat#S1419S |
| Dynabeads Oligo(dT)25 | Invitrogen | Cat#61005 |
| 10% neutral buffered formalin | RICCA Chemical | Cat#3190–1 |
| Methanol-free 10% formaldehyde | Polysciences | Cat#04018–1 |
| Cycloheximide | Sigma-Aldrich | Cat#C4859 |
| Critical Commercial Assays | ||
| PureLink RNA Mini kit | Ambion | Cat#12183018A |
| iScript cDNA synthesis kit | Bio-rad | Cat#170–8891BUN |
| High-Capacity cDNA Reverse Transcription Kit | Applied Biosystems | Cat#4368814 |
| KAPA HiFi HotStart Library Amplification Kit Illumina Platforms | Kapa Biosystems | Cat#KR0408 |
| Gateway LR clonase II enzyme mix | Invitrogen | Cat#11791 |
| QuickChange site-directed mutagenesis kit | Strategene | Cat#200521 |
| RNA Clean & Concentrator | Zymo Research | Cat#R1016 |
| Click-it Nascent RNA Capture Kit | Thermo Fisher Scientific | Cat#C10365 |
| ChIP-IT Express Kit | Active Motif | Cat#53009 |
| Chromatin IP DNA purification kit | Active Motif | Cat#58002 |
| SYBR Green PCR Master Mix | Life Technologies | Cat#4312704 |
| TuRboCapture 96 mRNA Kit | Qiagen | Cat#72251 |
| Deposited Data | ||
| Raw miCLIP data | This paper | GSE152633 |
| Raw data of Images and WB | This paper | http://dx.doi.org/10.17632/7sgjcvjpt9.1 |
| Experimental Models: Cell Lines | ||
| Human: Renal angiomyolipoma-derived LAM 621–101 (TSC2−/−) | Drs. Jane Yu and Elizabeth Henske | Yu et al., 2004 |
| Human: HEK293E | ATCC | Cat#293 c18; RRID: CVCL_6974 |
| Human: HEK293T | GenHunter | Cat#Q401 |
| Human: MCF7 | ATCC | Cat#HTB-22; RRID: CVCL_0031 |
| Human: DLD1 | ATCC | Cat#CCL-221; RRID: CVCL_0248 |
| Human: NCI-H1299 | ATCC | Cat#CRL-5803, RRID: CVCL_0060 |
| Human: BT549 | ATCC | Cat#HTB-122, RRID:CVCL_1092 |
| Experimental Models: Organisms/Strains | ||
| Male Tsc2tm1Djk/+ mice (A/J strain) | Tuberous Sclerosis Alliance and Van Andel Institute | Onda et al., 1999 |
| Male wild type A/J strain mice | Jackson Laboratory | Cat#000646 |
| Oligonucleotides | ||
| pLKO.1-puro-Non-Mammalian shRNA Control | Sigma-Aldrich | SHC002 |
| pLKO.1-puro-shWTAP-#1(Human) | Sigma-Aldrich | TRCN0000231426 |
| pLKO.1-puro-shWTAP-#2(Human) | Sigma-Aldrich | TRCN0000001074 |
| pLKO.1-puro-shWTAP-#3(Human) | Sigma-Aldrich | TRCN0000231422 |
| sgRNA targeting sequence (Human WTAP): CTGACAAACGGACCAAGTAA | This paper | N/A |
| Primers for qPCR analysis, see Table S3 | This paper | N/A |
| siRNAs list, see Table S4 | This paper | N/A |
| Recombinant DNA | ||
| pcDNA3-Flag-METTL3 | Addgene | Cat#53739 |
| pcDNA3-Flag-METTL14 | Addgene | Cat#53740 |
| pCDNA3-HA-human cMYC | Addgene | Cat#74164 |
| Lentiviral packaging and envelope plasmids | Dr. David Baltimore | N/A |
| pcDNA3-EGFP | Addgene | Cat#13031 |
| pDONR223-MAX-WT-V5 | Addgene | Cat#82944 |
| pcDNA3-MXD2 | Dr. AlmutSchulze | Delpuech et al., 2007 |
| lentiCRISPRv2 vector | Dr. Feng Zhang | Sanjana et al., 2014 |
| pKH3-S6K1-F5A/T389E/R3A | Dr. John Blenis | Schalm et al., 2005 |
| pENTR-WTAP(5’UTR+CDS) | This paper | N/A |
| pcDNA3-Flag-WTAP(CDS) | Addgene | Cat#53741 |
| pcDNA3-METTL3-D395A/W398A | This paper | N/A |
| pcDNA3-MXD2-C882T(m6A site mutant) | This paper | N/A |
| Software and Algorithms | ||
| FLEXBAR | Dodt et. al., 2012 | https://github.com/seqan/flexbar/wiki |
| MEME-ChIP de novo motif search | Machanick and Bailey 2011 | https://www.ncbi.nlm.nih.gov/pubmed/21486936 |
| CTK package | Shah et al., 2017 | https://github.com/chaolinzhanglab/ctk |
| BEDTools | Quinlan and Hall, 2010 | https://github.com/arq5x/bedtools2 |
| Adobe Photoshop | Adobe | Adobe |
| Odyssey imaging system | LI-COR Biosciences | LI-COR Biosciences |
| pyCRAC.py | Webb et al., 2014 | https://git.ecdf.ed.ac.uk/sgrannem/pycrac |
| DAVID | Open source | http://david.abcc.ncifcrf.gov/ |
| Other | ||
| Mass spectrometry | Dr. Joshua Rabinowitz and Dr. Cholsoon Jang | N/A |
| MRI imaging (9.4T 20-cm bore Bruker Biospec scanners) | Memorial Sloan Kettering Cancer Center | N/A |
Highlights.
mTORC1 induces WTAP translation through eIF4A/4B
mTORC1-WTAP increases global m6A levels on mRNA
Increased m6A modification by mTORC1 destabilizes mRNAs
mTORC1 decreases mRNA expression of MXD2, cMyc suppressor, through m6A modification
Acknowledgments
This research was supported by NIH R01HL121266, R01GM051405, and 5T32CA203702 (JP) (JB), R01CA186702 (SRJ), DP1DK113643 (JDR), F32CA221104 (BFP), Starr Cancer Consortium I11–0015 (JB and NP), LAM Foundation LAM00100F01–14 and Tuberous Sclerosis Alliance TSA-01–14BP (GL), and American Diabetes Association 1–17-PDF-076 (CJ). SM and MSKCC Animal Imaging Core Facility were funded in part by P30CA008748. We are grateful to Elisabeth Henske and Dean Aguir for sharing LAM cell lines and TSC mouse models, and Almut Schulze for MXD2 constructs. We also thank members of the Blenis, Jaffrey, and Lee laboratories, and Martin Prince for technical assistance and scientific discussions.
Footnotes
Declaration of Interests
J.B. is an advisory board member for Molecular Cell. S.R.J. is scientific founder, advisor to, and owns equity in Gotham Therapeutics.
Publisher's Disclaimer: This is a PDF file of an unedited manuscript that has been accepted for publication. As a service to our customers we are providing this early version of the manuscript. The manuscript will undergo copyediting, typesetting, and review of the resulting proof before it is published in its final form. Please note that during the production process errors may be discovered which could affect the content, and all legal disclaimers that apply to the journal pertain.
References
- Bansal H, Yihua Q, Iyer SP, Ganapathy S, Proia D, Penalva LO, Uren PJ, Suresh U, Carew JS, Karnad AB, et al. (2014). WTAP is a novel oncogenic protein in acute myeloid leukemia. Leukemia 28, 1171–1174. [DOI] [PMC free article] [PubMed] [Google Scholar]
- Barbieri I, and Kouzarides T. (2020). Role of RNA modifications in cancer. Nat. Rev. Cancer 1–20. [DOI] [PubMed] [Google Scholar]
- Barrilleaux BL, Cotterman R, and Knoepfler PS (2013). Chromatin immunoprecipitation assays for Myc and N-Myc. Methods Mol. Biol. 1012, 117–133. [DOI] [PMC free article] [PubMed] [Google Scholar]
- Ben-Sahra I, Hoxhaj G, Ricoult SJH, Asara JM, and Manning BD (2016). mTORC1 induces purine synthesis through control of the mitochondrial tetrahydrofolate cycle. Science 351, 728–733. [DOI] [PMC free article] [PubMed] [Google Scholar]
- Bordeleau M-E, Robert F, Gerard B, Lindqvist L, Chen SMH, Wendel H-G, Brem B, Greger H, Lowe SW, Porco JA, et al. (2008). Therapeutic suppression of translation initiation modulates chemosensitivity in a mouse lymphoma model. J. Clin. Invest. [DOI] [PMC free article] [PubMed] [Google Scholar]
- Chang JW, Zhang W, Yeh HS, De Jong EP, Jun S, Kim KH, Bae SS, Beckman K, Hwang TH, Kim KS, et al. (2015). MRNA 3′-UTR shortening is a molecular signature of mTORC1 activation. Nat. Commun. 6, 1–9. [DOI] [PubMed] [Google Scholar]
- Chen L, and Wang X. (2018). Relationship between the genetic expression of WTAP and bladder cancer and patient prognosis. Oncol. Lett. 16, 6966–6970. [DOI] [PMC free article] [PubMed] [Google Scholar]
- Chen H, Liu H, and Qing G. (2018). Targeting oncogenic Myc as a strategy for cancer treatment. Signal Transduct. Target. Ther. 3, 1–7. [DOI] [PMC free article] [PubMed] [Google Scholar]
- Chen Y, Peng C, Chen J, Chen D, Yang B, He B, Hu W, Zhang Y, Liu H, Dai L, et al. (2019). WTAP facilitates progression of hepatocellular carcinoma via m6A-HuR-dependent epigenetic silencing of ETS1. Mol. Cancer 18, 127. [DOI] [PMC free article] [PubMed] [Google Scholar]
- Ciribilli Y, and Borlak J. (2017). Oncogenomics of c-Myc transgenic mice reveal novel regulators of extracellular signaling, angiogenesis and invasion with clinical significance for human lung adenocarcinoma. Oncotarget 8, 101808–101831. [DOI] [PMC free article] [PubMed] [Google Scholar]
- Csibi A, Lee G, Yoon S-O, Tong H, Ilter D, Elia I, Fendt S-M, Roberts TM, and Blenis J. (2014). The mTORC1/S6K1 pathway regulates glutamine metabolism through the eIF4B-dependent control of c-Myc translation. Curr. Biol. 24, 2274–2280. [DOI] [PMC free article] [PubMed] [Google Scholar] [Retracted]
- Cunningham TA, Chapman E, and Schatz JH (2018). EIF4A inhibition: Ready for primetime? Oncotarget 9, 35515–35516. [DOI] [PMC free article] [PubMed] [Google Scholar]
- Dang CV (2012). MYC on the path to cancer. Cell 149, 22–35. [DOI] [PMC free article] [PubMed] [Google Scholar]
- Delaunay S, and Frye M. (2019). RNA modifications regulating cell fate in cancer. Nat. Cell Biol. 21, 552–559. [DOI] [PubMed] [Google Scholar]
- Delpuech O, Griffiths B, East P, Essafi A, Lam EW-F, Burgering B, Downward J, and Schulze A. (2007). Induction of Mxi1-SRα by FOXO3a Contributes to Repression of Myc-Dependent Gene Expression. Mol. Cell. Biol. 27, 4917–4930. [DOI] [PMC free article] [PubMed] [Google Scholar]
- Dodt M, Roehr J, Ahmed R, and Dieterich C. (2012). FLEXBAR—Flexible Barcode and Adapter Processing for Next-Generation Sequencing Platforms. Biology (Basel). 1, 895–905. [DOI] [PMC free article] [PubMed] [Google Scholar]
- Dominissini D, Moshitch-Moshkovitz S, Schwartz S, Salmon-Divon M, Ungar L, Osenberg S, Cesarkas K, Jacob-Hirsch J, Amariglio N, Kupiec M, et al. (2012). Topology of the human and mouse m6A RNA methylomes revealed by m6A-seq. Nature 485, 201–206. [DOI] [PubMed] [Google Scholar]
- Düvel K, Yecies JL, Menon S, Raman P, Lipovsky AI, Souza AL, Triantafellow E, Ma Q, Gorski R, Cleaver S, et al. (2010). Activation of a metabolic gene regulatory network downstream of mTOR complex 1. Mol. Cell 39, 171–183. [DOI] [PMC free article] [PubMed] [Google Scholar]
- Fu Y, Dominissini D, Rechavi G, and He C. (2014). Gene expression regulation mediated through reversible m 6 A RNA methylation. Nat. Rev. Genet. 15, 293–306. [DOI] [PubMed] [Google Scholar]
- Gan B, Lim C, Chu G, Hua S, Ding Z, Collins M, Hu J, Jiang S, Fletcher-Sananikone E, Zhuang L, et al. (2010). FoxOs enforce a progression checkpoint to constrain mTORC1-Activated renal tumorigenesis. Cancer Cell 18, 472–484. [DOI] [PMC free article] [PubMed] [Google Scholar]
- Gilbert WV, Bell TA, and Schaening C. (2016). Messenger RNA modifications: Form, distribution, and function. Science (80-. ). 352, 1408–1412. [DOI] [PMC free article] [PubMed] [Google Scholar]
- Gomes AP, and Blenis J. (2015). A nexus for cellular homeostasis: the interplay between metabolic and signal transduction pathways. Curr. Opin. Biotechnol. 34, 110–117. [DOI] [PMC free article] [PubMed] [Google Scholar]
- Gott JM, and Emeson RB (2000). Functions and Mechanisms of RNA Editing. Annu. Rev. Genet. 34, 499–531. [DOI] [PubMed] [Google Scholar]
- Hinnebusch AG, Ivanov IP, and Sonenberg N. (2016). Translational control by 5′-untranslated regions of eukaryotic mRNAs. Science (80-. ). 352, 1413–1416. [DOI] [PMC free article] [PubMed] [Google Scholar]
- Holz MK, and Blenis J. (2005). Identification of S6K1 as a novel mTOR-phosphorylating kinase. J. Biol. Chem. [DOI] [PubMed] [Google Scholar]
- Holz MK, Ballif BA, Gygi SP, and Blenis J. (2005). mTOR and S6K1 mediate assembly of the translation preinitiation complex through dynamic protein interchange and ordered phosphorylation events. Cell 123, 569–580. [DOI] [PubMed] [Google Scholar]
- Huang DW, Sherman BT, and Lempicki RA (2009). Systematic and integrative analysis of large gene lists using DAVID bioinformatics resources. Nat. Protoc. 4, 44–57. [DOI] [PubMed] [Google Scholar]
- Huang H, Weng H, Sun W, Qin X, Shi H, Wu H, Zhao BS, Mesquita A, Liu C, Yuan CL, et al. (2018). Recognition of RNA N 6 -methyladenosine by IGF2BP proteins enhances mRNA stability and translation. Nat. Cell Biol. 20, 285–295. [DOI] [PMC free article] [PubMed] [Google Scholar]
- Huang H, Weng H, and Chen J. (2020). m6A Modification in Coding and Non-coding RNAs: Roles and Therapeutic Implications in Cancer. Cancer Cell 37, 270–288. [DOI] [PMC free article] [PubMed] [Google Scholar]
- Jewell JL, and Guan K-L (2013). Nutrient signaling to mTOR and cell growth. Trends Biochem. Sci. 38, 233–242. [DOI] [PMC free article] [PubMed] [Google Scholar]
- Ji H, Wu G, Zhan X, Nolan A, Koh C, de Marzo A, Doan HM, Fan J, Cheadle C, Fallahi M, et al. (2011). Cell-type independent MYC target genes reveal a primordial signature involved in biomass accumulation. PLoS One 6. [DOI] [PMC free article] [PubMed] [Google Scholar]
- Jia G, Fu Y, Zhao X, Dai Q, Zheng G, Yang Y, Yi C, Lindahl T, Pan T, Yang YG, et al. (2011). N6-Methyladenosine in nuclear RNA is a major substrate of the obesity-associated FTO. Nat. Chem. Biol. 7, 885–887. [DOI] [PMC free article] [PubMed] [Google Scholar]
- Kalogerou M, Zhang Y, Yang J, Garrahan N, Paisey S, Tokarczuk P, Stewart A, Gallacher J, Sampson JR, and Shen MH (2012). T2 weighted MRI for assessing renal lesions in transgenic mouse models of tuberous sclerosis. Eur. J. Radiol. 81, 2069–2074. [DOI] [PubMed] [Google Scholar]
- Kim DH, Sarbassov DD, Ali SM, King JE, Latek RR, Erdjument-Bromage H, Tempst P, and Sabatini DM (2002). mTOR interacts with raptor to form a nutrient-sensitive complex that signals to the cell growth machinery. Cell 110, 163–175. [DOI] [PubMed] [Google Scholar]
- Kimball SR, and Jefferson LS (2006). Branched-Chain Amino Acids: Metabolism, Physiological Function, and Application Signaling Pathways and Molecular Mechanisms through which Branched-Chain Amino Acids Mediate Translational Control of Protein Synthesis 1–3. [DOI] [PubMed] [Google Scholar]
- Kopec AM, Rivera PD, Lacagnina MJ, Hanamsagar R, and Bilbo SD (2017). Optimized solubilization of TRIzol-precipitated protein permits Western blotting analysis to maximize data available from brain tissue. J. Neurosci. Methods 280, 64–76. [DOI] [PMC free article] [PubMed] [Google Scholar]
- Kruse S, Zhong S, Bodi Z, Button J, Alcocer MJC, Hayes CJ, and Fray R. (2011). A novel synthesis and detection method for cap-associated adenosine modifications in mouse mRNA. Sci. Rep. 1, 126. [DOI] [PMC free article] [PubMed] [Google Scholar]
- Lam HC, Siroky BJ, and Henske EP (2018). Renal disease in tuberous sclerosis complex: pathogenesis and therapy. Nat. Rev. Nephrol. 14, 704–716. [DOI] [PubMed] [Google Scholar]
- Lasman L, Krupalnik V, Viukov S, Mor N, Aguilera-Castrejon A, Schneir D, Bayerl J, Mizrahi O, Peles S, Tawil S, et al. (2020). Context-dependent compensation between functional Ythdf m6A reader proteins. Genes Dev. 34, 1373–1391. [DOI] [PMC free article] [PubMed] [Google Scholar]
- Lee G, Zheng Y, Cho S, Jang C, England C, Dempsey JM, Yu Y, Liu X, He L, Cavaliere PM, et al. (2017). Post-transcriptional Regulation of De Novo Lipogenesis by mTORC1-S6K1-SRPK2 Signaling. Cell 171, 1545–1558.e18. [DOI] [PMC free article] [PubMed] [Google Scholar]
- Lee N, Woodrum CL, Nobil AM, Rauktys AE, Messina MP, and Dabora SL (2009). Rapamycin weekly maintenance dosing and the potential efficacy of combination sorafenib plus rapamycin but not atorvastatin or doxycycline in tuberous sclerosis preclinical models. BMC Pharmacol. 9, 8. [DOI] [PMC free article] [PubMed] [Google Scholar]
- Li J, Kim SG, and Blenis J. (2014). Rapamycin: One drug, many effects. Cell Metab. 19, 373–379. [DOI] [PMC free article] [PubMed] [Google Scholar]
- Linder B, Grozhik AV, Olarerin-George AO, Meydan C, Mason CE, and Jaffrey SR (2015). Single-nucleotide-resolution mapping of m6A and m6Am throughout the transcriptome. Nat. Methods 12, 767–772. [DOI] [PMC free article] [PubMed] [Google Scholar]
- Lorenz R, Bernhart SH, Höner zu Siederdissen C, Tafer H, Flamm C, Stadler PF, and Hofacker IL (2011). ViennaRNA Package 2.0. Algorithms Mol. Biol. 6, 26. [DOI] [PMC free article] [PubMed] [Google Scholar]
- Ma XM, and Blenis J. (2009). Molecular mechanisms of mTOR-mediated translational control. Nat. Rev. Mol. Cell Biol. 10, 307–318. [DOI] [PubMed] [Google Scholar]
- Ma XM, Yoon S-O, Richardson CJ, Jülich K, and Blenis J. (2008). SKAR Links Pre-mRNA Splicing to mTOR/S6K1-Mediated Enhanced Translation Efficiency of Spliced mRNAs. Cell 133, 303–313. [DOI] [PubMed] [Google Scholar]
- Machanick P, and Bailey T. (2011). MEME-ChIP: motif analysis of large DNA datasets. Bioinformatics 27, 1696–1697. [DOI] [PMC free article] [PubMed] [Google Scholar]
- Masui K, Tanaka K, Akhavan D, Babic I, Gini B, Matsutani T, Iwanami A, Liu F, Villa GR, Gu Y, et al. (2013). mTOR complex 2 controls glycolytic metabolism in glioblastoma through FoxO acetylation and upregulation of c-Myc. Cell Metab. 18, 726–739. [DOI] [PMC free article] [PubMed] [Google Scholar]
- Mathsyaraja H, Freie B, Cheng PF, Babaeva E, Catchpole JT, Janssens D, Henikoff S, and Eisenman RN (2019). Max deletion destabilizes MYC protein and abrogates Eμ-Myc lymphomagenesis. Genes Dev. 33, 1252–1264. [DOI] [PMC free article] [PubMed] [Google Scholar]
- Mauer J, Luo X, Blanjoie A, Jiao X, Grozhik AV, Patil DP, Linder B, Pickering BF, Vasseur J-J, Chen Q, et al. (2017). Reversible methylation of m6Am in the 5’ cap controls mRNA stability. Nature 541, 371–375. [DOI] [PMC free article] [PubMed] [Google Scholar]
- Menssen A, and Hermeking H. (2002). Characterization of the c-MYC-regulated transcriptome by SAGE: Identification and analysis of c-MYC target genes. Proc. Natl. Acad. Sci. U. S. A. 99, 6274–6279. [DOI] [PMC free article] [PubMed] [Google Scholar]
- Meyer KD, and Jaffrey SR (2017). Rethinking m 6 A Readers, Writers, and Erasers. Annu. Rev. Cell Dev. Biol. 33, 319–342. [DOI] [PMC free article] [PubMed] [Google Scholar]
- Meyer KD, Saletore Y, Zumbo P, Elemento O, Mason CE, and Jaffrey SR (2012). Comprehensive analysis of mRNA methylation reveals enrichment in 3′ UTRs and near stop codons. Cell 149, 1635–1646. [DOI] [PMC free article] [PubMed] [Google Scholar]
- Mossmann D, Park S, and Hall MN (2018). mTOR signalling and cellular metabolism are mutual determinants in cancer. Nat. Rev. Cancer 18, 744–757. [DOI] [PubMed] [Google Scholar]
- Onda H, Lueck A, Marks PW, Warren HB, and Kwiatkowski DJ (1999). Tsc2(+/−) mice develop tumors in multiple sites that express gelsolin and are influenced by genetic background. J. Clin. Invest. 104, 687–695. [DOI] [PMC free article] [PubMed] [Google Scholar]
- Patil DP, Pickering BF, and Jaffrey SR (2018). Reading m6A in the Transcriptome: m6A-Binding Proteins. Trends Cell Biol. 28, 113–127. [DOI] [PMC free article] [PubMed] [Google Scholar]
- Ping XL, Sun BF, Wang L, Xiao W, Yang X, Wang WJ, Adhikari S, Shi Y, Lv Y, Chen YS, et al. (2014). Mammalian WTAP is a regulatory subunit of the RNA N6-methyladenosine methyltransferase. Cell Res. 24, 177–189. [DOI] [PMC free article] [PubMed] [Google Scholar]
- Pourdehnad M, Truitt ML, Siddiqi IN, Ducker GS, Shokat KM, and Ruggero D. (2013). Myc and mTOR converge on a common node in protein synthesis control that confers synthetic lethality in Myc-driven cancers. Proc. Natl. Acad. Sci. U. S. A. 110, 11988–11993. [DOI] [PMC free article] [PubMed] [Google Scholar]
- Quinlan A, and Hall I. (2010). BEDTools: a flexible suite of utilities for comparing genomic features. Bioinformatics 26, 841–842. [DOI] [PMC free article] [PubMed] [Google Scholar]
- Ricoult SJH, and Manning BD (2013). The multifaceted role of mTORC1 in the control of lipid metabolism. EMBO Rep. 14, 242–251. [DOI] [PMC free article] [PubMed] [Google Scholar]
- Sanjana NE, Shalem O, and Zhang F. (2014). Improved vectors and genome-wide libraries for CRISPR screening. Nat. Methods 11, 783–784. [DOI] [PMC free article] [PubMed] [Google Scholar]
- Sarbassov DD, Guertin DA, Ali SM, and Sabatini DM (2005). Phosphorylation and regulation of Akt/PKB by the rictor-mTOR complex. Science (80-. ). 307, 1098–1101. [DOI] [PubMed] [Google Scholar]
- Sawyers CL (2003). Will mTOR inhibitors make it as cancer drugs? Cancer Cell 4, 343–348. [DOI] [PubMed] [Google Scholar]
- Saxton RA, and Sabatini DM (2017). mTOR Signaling in Growth, Metabolism, and Disease. Cell 168, 960–976. [DOI] [PMC free article] [PubMed] [Google Scholar]
- Schalm SS, Tee AR, Blenis J, Rsprr SK, and Dd D. (2005). Characterization of a conserved C-terminal (RSPRR) motif in S6K1 required for its mTOR-dependent regulation. J Biol Chem 2. [DOI] [PubMed] [Google Scholar]
- Schreiber-Agus N, Chin L, Chen K, Torres R, Rao G, Guida P, Skoultchi AI, and DePinho RA (1995). An amino-terminal domain of Mxi1 mediates anti-myc oncogenic activity and interacts with a homolog of the Yeast Transcriptional Repressor SIN3. Cell 80, 777–786. [DOI] [PubMed] [Google Scholar]
- Schreiber-Agus N, Meng Y, Hoang T, Hou H, Ghen K, Greenberg R, Cordon-Cardo C, Leet HW, and Depinho RA (1998). Role of Mxi1 in ageing organ systems and the regulation of normal and neoplastic growth. Nature 393, 483–487. [DOI] [PubMed] [Google Scholar]
- Schwartz S, Mumbach MR, Jovanovic M, Wang T, Maciag K, Bushkin GG, Mertins P, Ter-Ovanesyan D, Habib N, Cacchiarelli D, et al. (2014). Perturbation of m6A writers reveals two distinct classes of mRNA methylation at internal and 5’ sites. Cell Rep. 8, 284–296. [DOI] [PMC free article] [PubMed] [Google Scholar]
- Shah A, Qian Y, Weyn-Vanhentenryck S, and Zhang C. (2017). CLIP Tool Kit (CTK): a flexible and robust pipeline to analyze CLIP sequencing data. Bioinformatics 33, 566–567. [DOI] [PMC free article] [PubMed] [Google Scholar]
- Shahbazian D, Parsyan A, Petroulakis E, Topisirovic I, Martineau Y, Gibbs BF, Svitkin Y, and Sonenberg N. (2010). Control of Cell Survival and Proliferation by Mammalian Eukaryotic Initiation Factor 4B. Mol. Cell. Biol. 30, 1478–1485. [DOI] [PMC free article] [PubMed] [Google Scholar]
- Shimobayashi M, and Hall MN (2014). Making new contacts: the mTOR network in metabolism and signalling crosstalk. Nat. Rev. Mol. Cell Biol. 15, 155–162. [DOI] [PubMed] [Google Scholar]
- Siroky BJ, Yin H, Babcock JT, Lu L, Hellmann AR, Dixon BP, Quilliam LA, and Bissler JJ (2012). Human TSC-associated renal angiomyolipoma cells are hypersensitive to ER stress. Am. J. Physiol. Renal Physiol. 303, F831–44. [DOI] [PMC free article] [PubMed] [Google Scholar]
- Sommer S, Lavi U, and Darnell JE (1978). The absolute frequency of labeled N-6-methyladenosine in HeLa cell messenger RNA decreases with label time. J. Mol. Biol. 124, 487–499. [DOI] [PubMed] [Google Scholar]
- Su R, Dong L, Li C, Nachtergaele S, Wunderlich M, Qing Y, Deng X, Wang Y, Weng X, Hu C, et al. (2018). R-2HG Exhibits Anti-tumor Activity by Targeting FTO/m6A/MYC/CEBPA Signaling. Cell 172, 90–105.e23. [DOI] [PMC free article] [PubMed] [Google Scholar]
- Tang Hong-Wen; Weng Jui-Hsia; Lee Wen X.; Hu Yanhui; Gu Lei; Cho Sungyun; Lee Gina; Binari Richard; Li Cathleen; Cheng Min, E.; Kim Ah-Ram; Xu Jun; Shen Zhangfei; Xu Chiwei; Asara John M.; Blenis John; Perrimon N. (2021). mTORC1-chaperonin CCT signaling regulates m 6 A RNA methylation to suppress autophagy. Proc. Natl. Acad. Sci. U. S. A. 118, e2021945118. [DOI] [PMC free article] [PubMed] [Google Scholar]
- Tang HW, Hu Y, Chen CL, Xia B, Zirin J, Yuan M, Asara JM, Rabinow L, and Perrimon N. (2018a). The TORC1-Regulated CPA Complex Rewires an RNA Processing Network to Drive Autophagy and Metabolic Reprogramming. Cell Metab. 27, 1040–1054.e8. [DOI] [PMC free article] [PubMed] [Google Scholar]
- Tang J, Wang F, Cheng G, Si S, Sun X, Han J, Yu H, Zhang W, Lv Q, Wei J-F, et al. (2018b). Wilms’ tumor 1-associating protein promotes renal cell carcinoma proliferation by regulating CDK2 mRNA stability. J. Exp. Clin. Cancer Res. 37, 40. [DOI] [PMC free article] [PubMed] [Google Scholar]
- Tzelepis K, De Braekeleer E, Yankova E, Rak J, Aspris D, Domingues AF, Fosbeary R, Hendrick A, Leggate D, Ofir-Rosenfeld Y, et al. (2019). Pharmacological Inhibition of the RNA m6a Writer METTL3 As a Novel Therapeutic Strategy for Acute Myeloid Leukemia. Blood 134, 403–403. [Google Scholar]
- Valvezan AJ, and Manning BD (2019). Molecular logic of mTORC1 signalling as a metabolic rheostat. Nat. Metab. 1, 321–333. [DOI] [PMC free article] [PubMed] [Google Scholar]
- Valvezan AJ, Turner M, Belaid A, Lam HC, Miller SK, McNamara MC, Baglini C, Housden BE, Perrimon N, Kwiatkowski DJ, et al. (2017). mTORC1 Couples Nucleotide Synthesis to Nucleotide Demand Resulting in a Targetable Metabolic Vulnerability. Cancer Cell 32, 624–638.e5. [DOI] [PMC free article] [PubMed] [Google Scholar]
- Vu LP, Pickering BF, Cheng Y, Zaccara S, Nguyen D, Minuesa G, Chou T, Chow A, Saletore Y, Mackay M, et al. (2017). The N 6 -methyladenosine (m 6 A)-forming enzyme METTL3 controls myeloid differentiation of normal hematopoietic and leukemia cells. Nat. Med. 23, 1369–1376. [DOI] [PMC free article] [PubMed] [Google Scholar]
- Wang X, Lu Z, Gomez A, Hon GC, Yue Y, Han D, Fu Y, Parisien M, Dai Q, Jia G, et al. (2014). N 6-methyladenosine-dependent regulation of messenger RNA stability. Nature 505, 117–120. [DOI] [PMC free article] [PubMed] [Google Scholar]
- Webb S, Hector RD, Kudla G, and Granneman S. (2014). PAR-CLIP data indicate that Nrd1-Nab3-dependent transcription termination regulates expression of hundreds of protein coding genes in yeast. Genome Biol. 15. [DOI] [PMC free article] [PubMed] [Google Scholar]
- West MJ, Stoneley M, and Willis AE (1998). Translational induction of the c-myc oncogene via activation of the FRAP/TOR signalling pathway. Oncogene 17, 769–780. [DOI] [PubMed] [Google Scholar]
- Woodrum C, Nobil A, and Dabora SL (2010). Comparison of three rapamycin dosing schedules in A/J Tsc2+/−mice and improved survival with angiogenesis inhibitor or asparaginase treatment in mice with subcutaneous tuberous sclerosis related tumors. J. Transl. Med. 8, 14. [DOI] [PMC free article] [PubMed] [Google Scholar]
- Yu J, Astrinidis A, Howard S, and Henske EP (2004). Estradiol and tamoxifen stimulate LAM-associated angiomyolipoma cell growth and activate both genomic and nongenomic signaling pathways. Am. J. Physiol. Lung Cell. Mol. Physiol. 286, L694–700. [DOI] [PubMed] [Google Scholar]
- Zaccara S, and Jaffrey SR (2020). A Unified Model for the Function of YTHDF Proteins in Regulating m6A-Modified mRNA. Cell 181, 1582–1595.e18. [DOI] [PMC free article] [PubMed] [Google Scholar]
- Zhang HH, Lipovsky AI, Dibble CC, Sahin M, and Manning BD (2006). S6K1 Regulates GSK3 under Conditions of mTOR-Dependent Feedback Inhibition of Akt. Mol. Cell 24, 185–197. [DOI] [PMC free article] [PubMed] [Google Scholar]
Associated Data
This section collects any data citations, data availability statements, or supplementary materials included in this article.
Supplementary Materials
Excel spreadsheet: Table S1. Analysis of miCLIP results, Related to Figure 5. (A) m6A and input mRNA levels analyzed by miCLIP and RNA-seq. HEK293E cells were serum starved overnight and treated with insulin (200 nM, 30 hr) with or without pretreatment of torin1 (250 nM). N = 3.
(B) Subset of the genes from (A) whose m6A levels were decreased by torin1 (log2 (Torin1/DMSO) < −0.5, p < 0.05).
(C) Subset of the genes from (B) whose mRNA levels were increased by torin1 (log2 (Torin1/DMSO) > 0.5, p < 0.05).
(D) Gene Ontology (GO) analysis of the genes in (C).
Excel spreadsheet: Table S2. qPCR screen of miCLIP candidates, Related to Figure 5. (A, B) qPCR analysis of 105 genes from Supplemental Table 1D which are categorized as cellular macromolecule metabolic process. LAM 621-101 (TSC2−/−) cells were treated with torin1 (250 nM, 24 hr) (A) or siRNAs against METTL13/METTL14 or WTAP (B). Results are shown for 104 genes except ZNF664 (not expressed in LAM 621-101 cells).
(C) Subset of the genes from (A) and (B) whose mRNA levels were increased by torin1, siMETTL3/METTL14, and siWTAP (qPCR fold change > 1.2, p < 0.05).
Excel spreadsheet: Table S3. Primers list, Related to all Figures.
Excel spreadsheet: Table S4. siRNAs list, Related to all Figures.
Data Availability Statement
The image dataset supporting the current study have been deposited in a public repository; Mendeley Data: http://dx.doi.org/10.17632/7sgjcvjpt9.1. The miCLIP-seq and RNA-seq data files dataset generated in this study is available at GEO: GSE165690. These datasets can be found at https://www.ncbi.nlm.nih.gov/geo/query/acc.cgi?acc=GSE152633 using the following token: uzghcsuafjknzwt.
miCLIP-seq and RNA-seq data files have been deposited to the NCBI Gene Expression Omnibus under accession number GEO: GSE152633. These datasets can be found at https://www.ncbi.nlm.nih.gov/geo/query/acc.cgi?acc=GSE152633 using the following token: uzghcsuafjknzwt.