

Abstract
Context:
The validity of self-reported anthropometric indices has been examined in previous studies in different populations.
Aims:
The aim of our study was to evaluate the validity of self-reported height, weight, body mass index (BMI), and waist circumference (WC) for the first time in middle-age staffs of Isfahan University of Medical Sciences.
Settings and Design:
In this cross-sectional study, a total of 171 men and women were selected from staffs of Isfahan University of Medical Sciences, Isfahan, Iran.
Methods and Materials:
Technician- and self-reported measurements of height, weight, and WC were collected from all participants. BMI was calculated by dividing weight in kg by height in meters squared. Overweight and obesity were defined as BMI ≥25-<29.9 and ≥30 kg/m2, respectively. Abdominal obesity was defined as WC ≥94 and ≥80 cm in men and women, respectively.
Statistical Analysis:
Independent t-test, chi-square, Pearson and intraclass correlation coefficients (ICCs), as well as Kappa measurements, were used.
Results:
Fifty and 19 percentages of the study population were overweight and obese, respectively. Self-reported height (r = 0.83, P < 0.001, ICC =0.89, 95% confidence interval (CI): 0.85–0.92), weight (r = 0.95, P < 0.001, ICC = 0.979, 95% CI: 0.971–0.98), BMI (r = 0.70, P < 0.001, ICC = 0.81, 95% CI: 0.74–0.86), and WC (r = 0.60, P < 0.001, ICC = 0.71, 95% CI: 0.51–0.81) were highly correlated with actually measured ones. Approximately 80% and 65% of individuals who were defined as overweight and obese, respectively, based on actually measured data were correctly diagnosed as overweight and obese, respectively, based on self-reported data. The Kappa coefficients for different categories of weight situation and abdominal obesity were 0.59 and 0.32, respectively. Fifty-seven percent of participants who were diagnosed with abdominal obesity based on actually measured data were correctly diagnosed with abdominal obesity based on self-reported data. Also, approximately 48% and 69% of men and women, respectively, who were diagnosed with abdominal obesity based on actually measured data were correctly diagnosed with abdominal obesity based on self-reported ones.
Conclusions:
We found that self-reported data of anthropometric measures are reasonable in middle-age staff of Isfahan University of Medical Sciences. Nevertheless, self-reported data on WC should be cautiously relined on, in particular, among men.
Keywords: Adult, anthropometry, Iran, self-reported, validity
Introduction
Anthropometric measurements are an important part of nutritional assessments. Height, weight, waist circumference (WC), and hip circumference are the most popularly used anthropometric indicators in both medical field and research. These indicators are used as screening measures in human health and can also be considered as strong predictors for several chronic conditions. Earlier investigations have used these measurements to predict the risk of cardiovascular disease, diabetes, hypertension, and some types of cancers.[1]
In large-scale population-based studies, the use of self-reported data of anthropometric measures is common. However, the validity of these measures should be investigated before their use in disease prediction. Assessment of the precision of self-reported anthropometric indicators in adults has revealed inconsistent findings in different countries. Several studies, in particular, in western nations, suggested relatively good correlations between self-reported measurements and the actually measured values[2,3]; however, other studies in China, Italy, the Netherlands, and North America represented that self-reported weight and height did not supply partly valid data compared with the actually measured ones.[4,5] The bias in self-reported anthropometric data might be influenced by sex, age, actual body size, sociodemographic characters, and ethics.[5,6,7,8] Some studies have shown that both men and women tended to underreport their weight and overreport their height.[1,5,7,9,10,11] In addition, both genders tended to underreport their waist and hip circumferences.[7] Khunti et al. reported that the mean WC, based on self-reported data, was 6.8 cm lower than actually measured values in the UK population.[12] Lim et al. reported high correlation coefficients between self-reported values of waist and hip circumferences and the measured ones.[13]
To the best of our knowledge, no information is available about the validity of self-reported anthropometric measures in the Middle East. As the dietary intakes, body size, and sociocultural norms in this part of the world is different from those in other regions, the assessment of self-reported anthropometric measures in this region should be examined before the application in epidemiologic studies. Considering the growing number of epidemiologic studies in this region, this study was performed to assess the validity of anthropometric indicators, including height, weight, body mass index (BMI), and WC, in a group of middle-age staff of Isfahan University of Medical Sciences.
Subjects and Methods
Subjects
This cross-sectional study was conducted on a subgroup of randomly selected adult people, working in Isfahan University of Medical Sciences, Isfahan, Iran. The sample size of the study was calculated based on the formula provided by previous studies.[14] According to this paper, a sample size of 100 is good for validation studies.[14] Convenience random sampling method was used to select a total of 171 men and women aged 25-63 years (mean age: 57 years) from May to June 2011. At first, we randomly selected three main buildings, out of 7, in the campus of Isfahan University of Medical Sciences. Then, based on levels of each building, 2 or 3 floors were randomly chosen. Finally, all staff on the selected floors were requested to participate in the study. We did not include pregnant women as well as those who were on a specific diet and those who had attended a nutrition clinic recently to start a weight loss diet. All participants completed the written informed consent forms before data collection. The study protocol was approved by the Medical Ethics Committee of Isfahan University of Medical Sciences, Isfahan, Iran.
Assessment of anthropometric measures
After collection of socio-demographic information, participants were requested to recall their weight, height, WC. This information was recorded by a trained interviewer. Then, another trained interviewer immediately measured the exact amounts of these indicators based on standard protocols. Weight was measured using a Seca digital scale (Seca 700, Germany) to the nearest 500 g in light clothing without shoes. Height was measured in a standing position using a tape measure to the nearest 0·5 cm in standing position without shoes while shoulders touching the wall and individuals were looking straight forward. We computed BMI by dividing weight (kg) by height (m) squared (kg/m2). The middle point of the narrowest area of the waist was considered WC.[15] All measurements were performed three times and the average of three measurements was recorded as the final estimate.
Assessment of other variables
Respondents were requested to complete forms that included some data on age, gender, and other demographic variables.
Statistics
Mean values of self-reported and actually measured data were compared using independent t-test. Pearson correlation coefficient was used to evaluate the correlation between the self-reported values and the measured ones. The reliability of the quantitative data was evaluated using intraclass correlation coefficient (ICC) and nominal data using the Kappa coefficient. Participants were categorized in terms of BMI into three groups: BMI <25 kg/m2, 25≤ BMI <30 kg/m2 and BMI ≥30 kg/m2. This classification was done to determine the accuracy of self-reported data in the identification of people with obesity and abdominal obesity. As suggested cut-off points for WC by NCEP–ATP III (102 for men and 88 cm for women) were reported inappropriate for Iranians,[16] IDF suggested cut-off points (94 cm for men and 80 cm for women) were used in this study.[17,18] Chi-squared test was used to examine the distribution of abdominally obese people based on reported and actually measured values. Statistical analyses were performed using the Statistical Package for the Social Sciences (SPSS) software package (version 18, SPSS Inc., Chicago, IL). P <0.05 was considered significant.
Results
The characteristics of the study population are shown in Table 1. Mean age and BMI of participants were 40.06 ± 7.7 years and 26.26 ± 3.7 kg/m2, respectively. Fifty percent of the study population were overweight and 19% were obese, respectively.
Table 1.
General characteristics of participants (n=171)
| Gender | P | |||
|---|---|---|---|---|
|
| ||||
| Men (n=103) | Women (n=68) | Total (n=171) | ||
| Age (Mean±SD) | 40.2±8.86 | 39.8±5.92 | 40.06±7.70 | 0.85 |
| BMI (Mean±SD) | 26.7±3.4 | 25.4±4.08 | 26.26±3.74 | 0.03 |
| BMI Categories (n (%)) | ||||
| <25 kg/m2 | 33 (32.4) | 31 (47.7) | 64 (38.3) | 0.11 |
| 25-29.99 kg/m2 | 55 (53.9) | 29 (44.6) | 84 (50.3) | |
| 30≤ kg/m2 | 14 (13.7) | 5 (7.7) | 19 (11.4) | |
P values were obtained from an independent Student’s t test or χ2 test, where appropriate. BMI: Body mass index
Table 2 illustrates means and standard deviations (SD) of actually measured and self-reported weight, height, BMI, and WC. In the whole population, mean self-reported WC was significantly lower than actually measured values (86.5 ± 11.5 vs. 90.9 ± 9.8, P < 0.001). There were no significant difference in mean BMI (25.9 ± 4.6 vs. 26.2 ± 3.7, P = 0.19), weight (72.3 ± 13.6 vs. 72.8 ± 13.4, P = 0.72), and height (166.90 ± 11.04 vs. 166.1± 8.7, P = 0.48) comparing self-reported and actually measured values. The same point was seen in males and females, separately. Mean self-reported WC in men was significantly lower than actually measured values (89.35 ± 12.1 vs. 94.02 ± 8.7, P = 0.003). There were no significant difference in mean BMI (26.70 ± 4.9 vs. 26.75 ± 3.44, P = 0.92), weight (77.9 ± 12.4 vs. 78.4 ± 12.2, P = 0.79), and height (171.4 ± 11.3 vs. 171.0 ± 6.9, P = 0.75) in men comparing self-reported and actually measured values. For females, mean self-reported WC was significantly lower than actually measured values (82.14 ± 9.06 vs. 85.98 ± 9.4, P = 0.02). There were no significant difference in mean BMI (24.86 ± 4.03 vs. 25.47 ± 4.08, P = 0.39), weight (63.6 ± 10.6 vs. 64.1 ± 10.3, P = 0.79), and height (160.2 ± 6.01 vs. 158.9 ± 5.54, P = 0.19) comparing self-reported and actually measured values in females.
Table 2.
Mean and standard deviation of measured and self-reported weight, height, derived body mass index, and waist circumferences data
| Measured data | Self-reported data | Differencea (95% CI) | P b | |
|---|---|---|---|---|
| Female (n=68) | ||||
| Weight (kg) | 64.1±10.3 | 63.6±10.6 | -0.47 (-4.10, 3.14) | 0.79 |
| Height (cm) | 158.9±5.54 | 160.2±6.01 | 1.28 (-6.67-3.25) | 0.19 |
| Body mass index (BMI) (kg/m2) | 25.47±4.08 | 24.86±4.03 | -0.60 (-2.01, 0.79) | 0.39 |
| Waist circumferences (cm) | 85.98±9.4 | 82.14±9.06 | -3.84 (-7.21, -0.46) | 0.02 |
| Male (n =103) | ||||
| Weight (kg) | 78.4±12.2 | 77.9±12.4 | -0.45 (-3.84, 2.94) | 0.79 |
| Height (cm) | 171.0±6.9 | 171.4±11.3 | 0.41 (-2.19, 3.02) | 0.75 |
| Body mass index (BMI) (kg/m2) | 26.75±3.44 | 26.70±4.9 | -0.05 (-1.23, 1.11) | 0.92 |
| Waist circumferences (cm) | 94.02±8.7 | 89.35±12.1 | -4.66 (-7.69, -1.63) | 0.003 |
| Total (n=171) | ||||
| Weight (kg) | 72.8±13.4 | 72.3±13.6 | -0.51 (-3.42, 2.39) | 0.72 |
| Height (cm) | 166.1±8.7 | 166.9±11.04 | 0.75 (-1.37, 2.88) | 0.48 |
| Body mass index (BMI) (kg/m2) | 26.2±3.7 | 25.9±4.6 | -0.28 (-1.19, 0.63) | 0.19 |
| Waist circumferences (cm) | 90.9±9.8 | 86.5±11.5 | -4.38 (-6.78, -1.97) | ?0.001 |
aMeasured - self reported data. bIndependent Student’s t test
Correlation coefficients between self-reported data and actually measured ones are provided in Figure 1. Self-reported height (r = 0.83, P < 0.001), weight (r = 0.95, P < 0.001), BMI (r = 0.70, P < 0.001), and WC (r = 0.60, P < 0.001) were highly correlated with actually measured ones. In gender stratified analyses, there was a good correlation between self-reported and actually measured height in males (r = 0.75, P < 0.001) and females (r = 0.89, P < 0.001). This was also the case for weight [in males: r = 0.94, P < 0.001 and in females: r = 0.94, P < 0.001], BMI [in males: 0.56, P < 0.001 and in females: r = 0.93, P < 0.001], and WCs [in men: 0.51, P < 0.001 and in females: r = 0.67, P < 0.001).
Figure 1.

Correlation coefficients for self- reported data with measured ones
Table 3 provides ICCs between self-reported data and actually measured ones. We found relatively high ICCs for weight (0.979, 95% confidence interval (CI): 0.971– 0.98), height (0.89, 95% CI: 0.85–0.92), BMI (0.81, 95% CI: 0.74–0.86), and WC (0.71, 95% CI: 0.51–0.81). The same findings were obtained when data were analyzed by gender.
Table 3.
Intra-class correlation coefficients (ICCs) for self-reported data with measured ones
| Intra-class correlation coefficient | |||
|---|---|---|---|
|
| |||
| Female ICC (95% CI) | Male ICC (95% CI) | Total ICC (95% CI) | |
| Weight (kg) | 0.96 (0.94-0.98)* | 0.97 (0.95-0.98)* | 0.979 (0.971-0.98)* |
| Height (cm) | 0.93 (0.85-0.96)* | 0.80 (0.70-0.86)* | 0.89 (0.85-0.92)* |
| Body mass index (BMI) (kg/m2) | 0.95 (0.90-0.97)* | 0.69 (0.54-0.79)* | 0.81 (0.74-0.86)* |
| Waist circumferences (cm) | 0.76 (0.53-0.87)* | 0.61 (0.35-0.76)* | 0.71 (0.51-0.81)* |
*P?0.001. ICC: intraclass correlation coefficient; CI: confidence interval
The percentage of individuals with different weight status based on actually measured and self-reported data are shown in Figure 2. In the whole population, 80% and 65% of participants who were diagnosed with overweight and obesity, respectively, based on actually measured data were correctly diagnosed with overweight and obesity, respectively, based on self-reported data. In gender-stratified analysis, we found that 80% and 67% of men and 80% and 60% of women, who were diagnosed with overweight and obesity, respectively, based on actually measured data were correctly diagnosed with overweight and obesity, respectively, based on self-reported ones.
Figure 2.
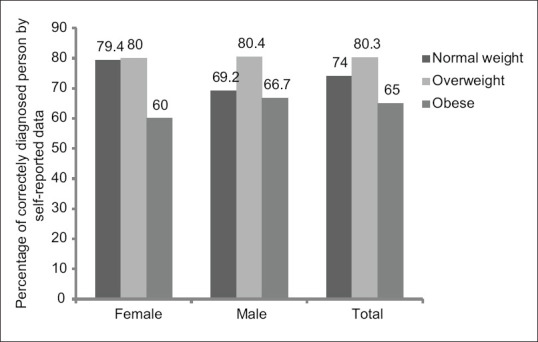
Percentage of individuals with different weight situations based on actually measured data who were correctly diagnosed based on self-reported data (n = 171). Normal weight (<25 kg/m2), Overweight (25-29.99 kg/m2), Obese (30 ≤ kg/m2)
Figure 3 shows the percentage of individuals with abdominal obesity based on actually measured data who were correctly diagnosed with abdominal obesity according to self-reported data. Fifty-seven percent of participants who were diagnosed with abdominal obesity according to actually measured data were correctly diagnosed with abdominal obesity according to self-reported data. Also, 47% and 69% of men and women, respectively, who were diagnosed with abdominal obesity according to actually measured data were correctly diagnosed with abdominal obesity according to self-reported ones.
Figure 3.
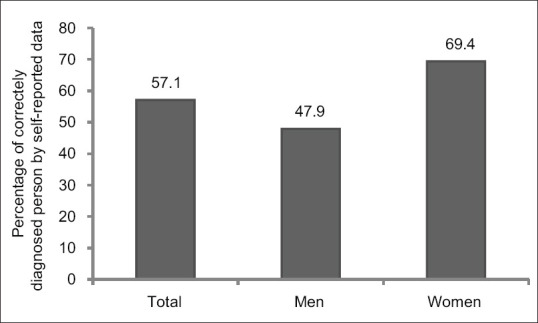
Percentage of individuals with abdominal obesity based on actually measured data who were diagnosed with abdominal obesity based on self-reported data (n = 171)
The Kappa coefficients for the concordance of weight status (normal weight, overweight, and obesity) obtained from self-reported data and actually measured data were 0.59 (P < 0.001) in the whole population. The corresponding estimate in females was 0.61 (P < 0.001) and in males was 0.57 (P < 0.001). With regard to abdominal obesity, the Kappa coefficients were 0.32 (P < 0.001) in the whole population; 0.19 (P < 0.001) in females; and 0.45 (P < 0.001) in males.
Discussion
Due to the linkage of obesity with several chronic diseases, the trend of obesity needs to be consistently monitored in national surveys. In this study, we investigated the validity of self-reported data on height, weight, BMI, and WC for the first time in middle-age staff of Isfahan University of Medical Sciences. We found good correlations between self-reported anthropometric data and the actually measured ones. These findings suggest that self-reported anthropometric data can be relied on among literate government employees in Iran. Nevertheless, for abdominal obesity, especially in men, the correlation between self-reported and actually measured data was not so strong and needs to be further examined in large samples. It should be considered that our findings were based on a relatively small sample size, compared with similar studies done in the world.[9,10,11,12] A large sample size in future studies might accurately reflect the validity of these indicators based on self-reported data.
We found that the correlations between actually measured and self-reported data were higher for weight (r = 0.95, ICC = 0.979) and height (r = 0.83, ICC = 0.89) than for BMI (r = 0.70, ICC =0.81) and WC (r = 0.60, ICC =0.71). This finding was in line with other studies, in which higher correlations were reported for weight (r = 0.93) and height (r = 0.84) than for WCs (r = 0.78).[19]
The correlation between self-reported height and measured values was high (r = 0.83, ICC =0.89) both in males (r = 0.75, ICC =0.80) and females (r = 0.89, ICC = 0.93) in this study. The corresponding figure in Mexico was 0.84. In Thai and Japanese population, the researchers reported a correlation of 0.94 and 0.95, respectively, for height.[19,20] Several studies have stated that both men and women usually overreport their height.[8,21] In our study, participants overreported their height at the level of 0.80 cm. Lee et al. found that Korean men reported their height as 0.41 cm higher than actual values.[22] In a systematic review, it was reported that in 27 studies, out of 29, men tended to overreport their height at the level of 0.1 to 5 cm. In two small studies, men underestimated their height at the level of 0.7 to 1.3 cm.[23] Women also tended to overreport their height in various studies, varying from 0.6 to 2.2 cm.[19,20,24] It seems that short people tend to be looked taller and this tendency is more common in men. Also, older people report their height taller. Merrill et al. reported that as people aged (older than 50 and 60 years in men and women, respectively), they get more likely to overreport their height.[25] Height loss occurs during the ageing process. Adults generally lose about 1 cm every decade after they get older than 40 years.[26]
People in this study underreported their weight at the level of 0.5 kg, however, this difference was not significant statistically. The difference between self-reported weight and measured values were varied from -0.1 to -2.7 kg in previous investigations.[27,28] However, in some studies, participants overreported their weight from 0.3 to 0.6 kg.[12,22] People, who are taller and thinner, tend to overreport their weight. There was also a gender difference in weight self-reporting in some previous studies. Men tend to overreport while women tend to underreport their weight.[25,28]
Our findings revealed a good correlations between self-reported BMI and measured ones in whole population (r = 0.93, ICC = 0.81) and in females (r = 0.70, ICC = 0.95). However, the same correlations in men was not so high (r = 0.56, ICC = 0.69). In addition, 80% and 67% of men and 80% and 60% of women, who were diagnosed with overweight and obesity, respectively, based on actually measured data were correctly diagnosed with overweight and obesity, respectively, based on self-reported ones. This finding was in line with previous investigations.[19] Underreporting of weight along with overreporting of height can result in underestimation of BMI. Based on the abovementioned points, this underestimation could be larger in women than that in men. BMI is considerably overestimated in men largely due to their overreported weight.[22]
Although a significant correlation was seen between self-reported WC and measured ones in our study, subjects underreported their WC at the level of 4.38 cm. Females and males underreported their WC at the level of 3.84 and 4.66 cm, respectively. In addition, we found that 52.1% of men and 30.6% of women who were abdominally obese were not correctly diagnosed based on self-reported data. This finding indicates that self-reported data for WC might require further examination and cannot be strongly relied on, in particular, among men. Consistent with our study, Khunti et al. reported that the participant's self-reported WC was 6.8 cm lower than the measured ones.[12] However, some studies have suggested that self-reported WC is a valid method for determining abdominal obesity.[13,19,29] It must be kept in mind that in cohort studies with a long duration of follow-up, repeated anthropometric measurements during a time interval make the people aware of their health condition and actual values of their anthropometric measurements.[30]
This was the first investigation to evaluate the validity of self-reported anthropometric measurements in Iran. As large-scale cohort studies are initiating in the country, the usage of valid self-reported indicators in these surveys could help saving time and money. However, there are some limitations that should be taken into account. The first limitation is our small sample size. This study was conducted on 171 people working in Isfahan University of Medical Sciences. Larger sample size reveals better and more precise relationship, especially for BMI and WC. Second, we used a convenience sampling method in this study, which may not include different categories of age. Third, it must be noted that people in our survey were middle-aged adults. Therefore, the findings cannot be generalized to all age groups, including children and elderly people. Fourth, people working in a medical university are more likely to be aware of their health condition. Therefore, extrapolating these findings should be done cautiously. Fifth, the study population had sedentary jobs, which might influence the findings. Sixth, we did not collect information about the health status of participants in detail. Seventh, weight was measured using a scale to the nearest 500 g, which might be considered as an additional limitation.
In conclusion, we found that self-reported data on anthropometric measures are reasonable in middle-age staff of Isfahan University of Medical Sciences. Nevertheless, self-reported data on WC should be cautiously relined on, in particular among men. This method of assessment, if applied in large-scale epidemiologic studies among literate government employees, might provide acceptable data compared with the actually measures values. This will minimize costs in epidemiological studies.
Financial support and sponsorship
Nil.
Conflicts of interest
There are no conflicts of interest.
Acknowledgments
We thank the Food Security Research Center of Isfahan University of Medical Sciences to support this study.
References
- 1.Spencer EA, Appleby PN, Davey GK, Key TJ. Validity of self-reported height and weight in 4808 EPIC–Oxford participants. Public Health Nutr. 2002;5:561–5. doi: 10.1079/PHN2001322. [DOI] [PubMed] [Google Scholar]
- 2.Burton NW, Brown W, Dobson A. Accuracy of body mass index estimated from self-reported height and weight in mid-aged Australian women. Aust N Z J Public Health. 2010;34:620–3. doi: 10.1111/j.1753-6405.2010.00618.x. [DOI] [PubMed] [Google Scholar]
- 3.Gorber SC, Tremblay MS. The bias in self-reported obesity from 1976 to 2005: A Canada–US comparison. Obesity. 2010;18:354–61. doi: 10.1038/oby.2009.206. [DOI] [PubMed] [Google Scholar]
- 4.Zhou X, Dibley MJ, Cheng Y, Ouyang X, Yan H. Validity of self-reported weight, height and resultant body mass index in Chinese adolescents and factors associated with errors in self-reports. BMC Public Health. 2010;10:190. doi: 10.1186/1471-2458-10-190. [DOI] [PMC free article] [PubMed] [Google Scholar]
- 5.Krul AJ, Daanen HA, Choi H. Self-reported and measured weight, height and body mass index (BMI) in Italy, the Netherlands and North America. Eur J Public Health. 2010;21:414–9. doi: 10.1093/eurpub/ckp228. [DOI] [PubMed] [Google Scholar]
- 6.Elgar FJ, Stewart JM. Validity of self-report screening for overweight and obesity: Evidence from the Canadian community health survey. Can J Public Health. 2008:423–7. doi: 10.1007/BF03405254. [DOI] [PMC free article] [PubMed] [Google Scholar]
- 7.Park JY, Mitrou PN, Keogh RH, Luben RN, Wareham NJ, Khaw KT. Effects of body size and sociodemographic characteristics on differences between self-reported and measured anthropometric data in middle-aged men and women: The EPIC-Norfolk study. Eur J Clin Nutr. 2011;65:357–67. doi: 10.1038/ejcn.2010.259. [DOI] [PubMed] [Google Scholar]
- 8.Wen M, Kowaleski-Jones L. Sex and ethnic differences in validity of self-reported adult height, weight and body mass index. Ethn Dis. 2012;22:72–8. [PMC free article] [PubMed] [Google Scholar]
- 9.Stommel M, Schoenborn CA. Accuracy and usefulness of BMI measures based on self-reported weight and height: Findings from the NHANES & NHIS 2001-2006. BMC Public Health. 2009;9:421. doi: 10.1186/1471-2458-9-421. [DOI] [PMC free article] [PubMed] [Google Scholar]
- 10.Nyholm M, Gullberg B, Merlo J, Lundqvist-Persson C, Råstam L, Lindblad U. The validity of obesity based on self-reported weight and height: Implications for population studies. Obesity (Silver Spring) 2007;15:197–208. doi: 10.1038/oby.2007.536. [DOI] [PubMed] [Google Scholar]
- 11.Dhaliwal SS, Howat P, Bejoy T, Welborn TA. Self-reported weight and height for evaluating obesity control programs. Am J Health Behav. 2010;34:489–99. doi: 10.5993/ajhb.34.4.10. [DOI] [PubMed] [Google Scholar]
- 12.Khunti K, Taub N, Webb D, Srinivasan B, Stockman J, Griffin S, et al. Validity of self-assessed waist circumference in a multi-ethnic UK population. Diabet Med. 2012;29:404–9. doi: 10.1111/j.1464-5491.2011.03478.x. [DOI] [PubMed] [Google Scholar]
- 13.Lim LY, Seubsman SA, Sleigh A, Bain C. Validity of self-reported abdominal obesity in Thai adults: A comparison of waist circumference, waist-to-hip ratio and waist-to-stature ratio. Nutr Metabol Cardiovasc Dis. 2012;22:42–9. doi: 10.1016/j.numecd.2010.04.003. [DOI] [PubMed] [Google Scholar]
- 14.Bland JM, Altman D. Statistical methods for assessing agreement between two methods of clinical measurement. Lancet. 1986;327:307–10. [PubMed] [Google Scholar]
- 15.Ross R, Berentzen T, Bradshaw AJ, Janssen I, Kahn HS, Katzmarzyk PT, et al. Does the relationship between waist circumference, morbidity and mortality depend on measurement protocol for waist circumference? Obes Rev. 2008;9:312–25. doi: 10.1111/j.1467-789X.2007.00411.x. [DOI] [PubMed] [Google Scholar]
- 16.Mirmiran PA, Esmaillzadeh A, Azizi F. Detection of cardiovascular risk factors by anthropometric measures in Tehranian adults: Receiver operating characteristic (ROC) curve analysis. Eur J Clin Nutr. 2004;58:1110–8. doi: 10.1038/sj.ejcn.1601936. [DOI] [PubMed] [Google Scholar]
- 17.Misra A, Chowbey P, Makkar BM, Vikram NK, Wasir JS, Chadha D, et al. Consensus statement for diagnosis of obesity, abdominal obesity and the metabolic syndrome for Asian Indians and recommendations for physical activity, medical and surgical management. J Assoc Physicians India. 2009;57:163–70. [PubMed] [Google Scholar]
- 18.Alberti G, Zimmet P. The IDF consensus worldwide definition of the metabolic syndrome. International Diabetes Federation. 2006. [Last accessed on 2019 Jan 03]. Available from: http://www.idf.org/metabolic-syndrome .
- 19.Ortiz-Panozo E, Yunes-Díaz E, Lajous M, Romieu I, Monge A, López-Ridaura R. Validity of self-reported anthropometry in adult Mexican women. Salud Pública Méx. 2017;59:266–75. doi: 10.21149/7860. [DOI] [PubMed] [Google Scholar]
- 20.Ikeda N. Validity of self-reports of height and weight among the general adult population in Japan: Findings from National Household Surveys, 1986. PLoS One. 2016;11:e0148297. doi: 10.1371/journal.pone.0148297. [DOI] [PMC free article] [PubMed] [Google Scholar]
- 21.Bae J, Joung H, Kim JY, Kwon KN, Kim Y, Park SW. Validity of self-reported height, weight, and body mass index of the Korea Youth Risk Behavior Web-based Survey questionnaire. J Prev Med Public Health. 2010;43:396–402. doi: 10.3961/jpmph.2010.43.5.396. [DOI] [PubMed] [Google Scholar]
- 22.Lee D-H, Shin A, Kim J, Yoo K-Y, Sung J. Validity of self-reported height and weight in a Korean population. J Epidemiol. 2011;21:30–6. doi: 10.2188/jea.JE20100058. [DOI] [PMC free article] [PubMed] [Google Scholar]
- 23.Gorber SC, Tremblay M, Moher D, Gorber B. A comparison of direct vs.self-report measures for assessing height, weight and body mass index: A systematic review. Obes Rev. 2007;8:307–26. doi: 10.1111/j.1467-789X.2007.00347.x. [DOI] [PubMed] [Google Scholar]
- 24.Palta M, Prineas RJ, Berman R, Hannan P. Comparison of self-reported and measured height and weight. Am J Epidemiol. 1982;115:223–30. doi: 10.1093/oxfordjournals.aje.a113294. [DOI] [PubMed] [Google Scholar]
- 25.Merrill RM, Richardson JS. Peer reviewed: Validity of self-reported height, weight, and body mass index: Findings from the National Health and Nutrition Examination Survey, 2001-2006. Prev Chronic Dis. 2009;6:A121. [PMC free article] [PubMed] [Google Scholar]
- 26.MedlinePlus Medical Encyclopedia: Aging Changes in Body Shape. Bethesda (MD): National Institutes of Health. [Last accessed on 2008 Feb 06]. Available from: http://www.nlm.nih.gov/medlineplus/ency/article/003998.htm .
- 27.Kuczmarski MF, Kuczmarski RJ, Najjar M. Effects of age on validity of self-reported height, weight, and body mass index: Findings from the Third National Health and Nutrition Examination Survey, 1988–1994. J Am Diet Assoc. 2001;101:28–34. doi: 10.1016/S0002-8223(01)00008-6. [DOI] [PubMed] [Google Scholar]
- 28.Craig BM, Adams AK. Accuracy of body mass index categories based on self-reported height and weight among women in the United States. Matern Child Health J. 2009;13:489–96. doi: 10.1007/s10995-008-0384-7. [DOI] [PMC free article] [PubMed] [Google Scholar]
- 29.Wright FL, Green J, Reeves G, Beral V, Cairns BJ. Validity over time of self-reported anthropometric variables during follow-up of a large cohort of UK women. BMC Med Res Methodol. 2015;15:81. doi: 10.1186/s12874-015-0075-1. [DOI] [PMC free article] [PubMed] [Google Scholar]
- 30.Karahalios A, Baglietto L, Carlin JB, English DR, Simpson JA. A review of the reporting and handling of missing data in cohort studies with repeated assessment of exposure measures. BMC Med Res Methodol. 2012;12:96. doi: 10.1186/1471-2288-12-96. [DOI] [PMC free article] [PubMed] [Google Scholar]