

Abstract
Maternal brain adaptations occur in response to pregnancy, but little is known about how parity impacts white matter and white matter ageing trajectories later in life. Utilising global and regional brain age prediction based on multi‐shell diffusion‐weighted imaging data, we investigated the association between previous childbirths and white matter brain age in 8,895 women in the UK Biobank cohort (age range = 54–81 years). The results showed that number of previous childbirths was negatively associated with white matter brain age, potentially indicating a protective effect of parity on white matter later in life. Both global white matter and grey matter brain age estimates showed unique contributions to the association with previous childbirths, suggesting partly independent processes. Corpus callosum contributed uniquely to the global white matter association with previous childbirths, and showed a stronger relationship relative to several other tracts. While our findings demonstrate a link between reproductive history and brain white matter characteristics later in life, longitudinal studies are required to establish causality and determine how parity may influence women's white matter trajectories across the lifespan.
Keywords: ageing, brain, diffusion tensor imaging, parturition, pregnancy, white matter
Utilising global and regional brain age prediction based on multi‐shell diffusion‐weighted imaging data, we investigated the association between previous childbirths and white matter brain age in 8,895 women in the UK Biobank cohort (age range = 54–81 years). The results showed that number of previous childbirths was negatively associated with white matter brain age, potentially indicating a protective effect of parity on white matter later in life. Corpus callosum contributed uniquely to this association, and showed a stronger relationship relative to several other tracts.
1. INTRODUCTION
Maternal brain adaptations have been shown during pregnancy and postpartum, with dynamic alterations across brain regions at different time windows since pregnancy (Duarte‐Guterman, Leuner, & Galea, 2019; Hoekzema et al., 2017; Kim et al., 2010; Kim, Dufford, & Tribble, 2018; Luders et al., 2020). Some of these alterations involve regions implicated in empathy, mentalising, and emotion regulation, and may thus represent adaptations to meet the needs and demands of the offspring, and to secure adequate expression of maternal caregiving (Barha & Galea, 2017; Djalovski, Dumas, Kinreich, & Feldman, 2021; Feldman, 2016; Ho & Swain, 2017; Hoekzema et al., 2020). Recent studies also indicate that some effects of pregnancy may be long‐lasting (Duarte‐Guterman et al., 2019; Hoekzema et al., 2017), potentially influencing brain trajectories later in life (Barha et al., 2016; de Lange et al., 2019; Ning et al., 2020; Pawluski, Lambert, & Kinsley, 2016). However, neuroimaging studies of the maternal brain have largely focused on grey matter (GM) volume (de Lange et al., 2019; de Lange, Barth, Kaufmann, Anatürk, et al., 2020; Hoekzema et al., 2017; Lisofsky et al., 2016; Lisofsky, Gallinat, Lindenberger, & Kühn, 2019; Luders et al., 2020; Zhang, Wang, Zhang, Du, & Chen, 2019) and cortical thickness (Kim et al., 2018; Orchard et al., 2020), and less is known about the effects of pregnancy on brain white matter (WM).
Emerging evidence from animal models suggests that pregnancy may induce WM plasticity (Chan et al., 2015; Gregg et al., 2007; Kalakh & Mouihate, 2019). Specifically, pregnant mice exhibit increases in oligodendrocyte progenitor cell proliferation, oligodendrocyte generation, and in the number of myelinated axons, indicating an enhanced capacity for myelination in the maternal brain (Gregg et al., 2007). Pregnancy‐induced remyelination may partly explain why pregnancy seem to cause remission of multiple sclerosis (MS), an autoimmune disease that attacks the myelin sheath (Confavreux et al., 1998). In line with this, slower disability progression has been found in parous MS patients after 18 years, compared with nulliparous patients (D'hooghe & Nagels, 2010). This effect was strongest in patients that gave birth after disease onset, indicating favourable effects of pregnancy‐related adaptations on disease mechanisms in MS.
While the influence of childbirth on WM trajectories in healthy women is largely unknown, one study reported larger regional WM volumes in mothers compared to non‐mothers, as well as maternal WM increases that were linked to changes in empathetic abilities during the postpartum period (Zhang et al., 2019). In line with these findings, a diffusion tensor imaging (DTI) (Basser, Mattiello, & LeBihan, 1994) study in rats found that fractional anisotropy (FA), which quantifies the degree of diffusion directionality, increased significantly in the dentate gyrus during pregnancy. However, whole‐brain diffusivity also increased in pregnant rats compared to nulliparous rats (Chan et al., 2015), indicating global changes in the characteristics of molecular water movement—potentially linked to increased extracellular water in the brain during pregnancy (Oatridge et al., 2002).
Recent research assessing longitudinal changes in human brain morphology during pregnancy found no WM changes in mothers (Hoekzema et al., 2017), nor in female adolescents in a follow‐up study comparing longitudinal changes in mothers and two years of pubertal development (Carmona et al., 2019). However, as adolescence is known to involve substantial WM remodelling (Asato, Terwilliger, Woo, & Luna, 2010; Barnea‐Goraly et al., 2005; Giorgio et al., 2008; Giorgio et al., 2010; Paus, 2010), the lack of effects could possibly reflect insensitivity of the methods used to assess WM changes (T1‐weighted estimation of WM volume (Hoekzema et al., 2017) and gyral WM thickness (Carmona et al., 2019)). In development and ageing studies, WM is commonly investigated using DTI (Basser et al., 1994), which yields metrics that are highly sensitive to age (Cox et al., 2016). However, the accuracy of the DTI approach is limited by factors such as crossing fibres. These obstacles have motivated the development of advanced biophysical diffusion models including WM tract integrity (WMTI) (Fieremans, Jensen, & Helpern, 2011), which is derived from diffusion kurtosis imaging (DKI) (Jensen, Helpern, Ramani, Lu, & Kaczynski, 2005), and spherical mean technique (SMT) (Kaden, Kelm, Carson, Does, & Alexander, 2016; Kaden, Kruggel, & Alexander, 2016). In contrast to DTI, the DKI model yields metrics estimating the degree of non‐Gaussian diffusion, believed to better reflect the complexity of WM tissue structure (Jelescu & Budde, 2017; Jensen et al., 2005). Based on assumptions about the underlying tissue architecture, the WMTI and SMT models enable estimation of the separable contribution of diffusion in the intra‐ and extra‐axonal space (Novikov, Kiselev, & Jespersen, 2018). This may provide higher biological specificity, that is, additional information about the microstructural environment (Jelescu & Budde, 2017). However, the WMTI model does not consider the non‐straight and non‐parallel nature of fibre crossings and orientation dispersion, something that is factored out in the SMT model to overcome this limitation (Kaden, Kelm, et al., 2016; Kaden, Kruggel, & Alexander, 2016).
In the current study, we utilised four diffusion models (DTI, DKI, WMTI, SMT) to predict WM brain age, and investigated associations between brain age estimates and previous childbirths in a sample of 8,895 UK Biobank women (mean age ± SD = 62.45 ± 7.26). In line with studies suggesting that distinct and regional brain age estimates may provide additional detail (de Lange, Barth, Kaufmann, Anatürk, et al., 2020; Eavani et al., 2018; Kaufmann et al., 2019; Smith et al., 2020), we estimated (a) global WM brain age, (b) global GM brain age to test for modality‐specific contributions, and (c) WM brain age in 12 major WM tracts in order to identify regions of particular importance.
2. MATERIALS AND METHODS
2.1. Sample characteristics
The initial sample was drawn from the UK Biobank (www.ukbiobank.ac.uk), and included 9,899 women. Then, 899 participants with known brain disorders were excluded based on ICD10 diagnoses (Chapters V and VI, field F; mental and behavioural disorders, including F00–F03 for Alzheimer's disease and dementia, and F06.7 “Mild cognitive disorder,” and field G; diseases of the nervous system, including inflammatory and neurodegenerative diseases (except G55‐59; “Nerve, nerve root and plexus disorders”). An overview of the diagnoses is provided in the UK Biobank online resources (http://biobank.ndph.ox.ac.uk/showcase/field.cgi?id=41270), and the diagnostic criteria are listed in the ICD10 diagnostic manual (https://www.who.int/classifications/icd/icdonlineversions). In addition, 99 participants were excluded based on magnetic resonance imaging (MRI) outliers (see Section 2.2) and 11 participants were excluded based on missing data on the number of previous childbirths, yielding a total of 8,895 participants that were included in the study. Sample demographics are provided in Table 1.
TABLE 1.
Sample demographics. For variables with missing data, sample size (N) is indicated in parentheses
| Total N | 8,895 |
|---|---|
| Age | |
| Mean ± SD | 62.40 ± 7.25 |
| Range (years) | 45.13–80.66 |
| Number of childbirths (live) | |
| Mean ± SD | 1.74 ± 1.15 |
| Range | 0–8 |
| N in each group: | |
| 0 = 1,825 | 1 = 1,190 | 2 = 3,911 | |
| 3 = 1,535 | 4 = 348 | 5 = 55 | |
| 6 = 26 | 7 = 4 | 8 = 1 | |
| Age at first birth (N = 7,066) | |
| Mean ± SD | 26.82 ± 4.99 |
| Range | 14–47 |
| Years since last birth (N = 5,875) | |
| Mean ± SD | 32.41 ± 9.21 |
| Range | 6.77–55.19 |
| Menopausal status (N = 8,888) | |
| Yes | 2,745 |
| No | 4,767 |
| Not sure, had hysterectomy | 925 |
| Not sure, other reason | 451 |
| Ethnic background (N = 8,872) | |
| % White | 97.59 |
| % Black | 0.54 |
| % Mixed | 0.50 |
| % Asian | 0.62 |
| % Chinese | 0.35 |
| % Other | 0.38 |
| % Do not know | 0.02 |
| Education (N = 8,868) | |
| % University/college degree | 42.04 |
| % A levels or equivalent | 13.97 |
| % O levels/GCSE or equivalent | 22.62 |
| % NVQ or equivalent | 3.23 |
| % Professional qualification | 5.79 |
| % None of the above | 6.47 |
| Assessment location (imaging) | |
| Newcastle | 1,419 |
| Cheadle | 7,476 |
Abbreviations: GCSE, General Certificate of Secondary Education; NVQ, National Vocational Qualification; SD, standard deviation.
2.2. MRI data acquisition and processing
A detailed overview of the UK Biobank data acquisition and protocols is available in Alfaro‐Almagro et al. (2018) and Miller et al. (2016). For the diffusion‐weighted MRI data, a conventional Stejskal‐Tanner monopolar spin‐echo echo‐planar imaging sequence was used with multiband factor 3. Diffusion weightings were 1,000 and 2,000 s/mm2 and 50 non‐coplanar diffusion directions per each diffusion shell. The spatial resolution was 2 mm3 isotropic, and five anterior–posterior versus three anterior–posterior images with b = 0 s/mm2 were acquired. All diffusion data were processed using an optimised diffusion pipeline (Maximov, Alnaes, & Westlye, 2019) consisting of six steps: noise correction (Veraart, Novikov, et al., 2016; Veraart, Fieremans, & Novikov, 2016), Gibbs‐ringing correction (Kellner, Dhital, Kiselev, & Reisert, 2016), estimation of echo‐planar imaging distortions, motion, eddy‐current and susceptibility‐induced distortion corrections (Andersson, Graham, Zsoldos, & Sotiropoulos, 2016; Andersson & Sotiropoulos, 2016), spatial smoothing using fslmaths from FSL (version 6.0.1) (Smith et al., 2004) with a Gaussian kernel of 1 mm3, and diffusion metrics estimation. DTI and DKI derived metrics were estimated using MATLAB R2017a (MathWorks, Natick, MA) as proposed by Veraart, Sijbers, Sunaert, Leemans, and Jeurissen (2013). The DTI metrics included mean diffusivity (MD), FA, axial diffusivity (AD), and radial diffusivity (RD) (Basser et al., 1994). The DKI metrics included mean kurtosis, axial kurtosis, and radial kurtosis (Jensen et al., 2005). WMTI metrics included axonal water fraction, extra‐axonal AD, and extra‐axonal RD (radEAD) (Fieremans et al., 2011). SMT metrics included intra‐neurite volume fraction, extra‐neurite MD, and extra‐neurite RD (Kaden, Kelm, et al., 2016). See Maximov et al. (2019) for details on the processing pipeline.
Tract‐based spatial statistics (TBSS) was used to extract diffusion metrics in WM (Smith et al., 2006). Initially, all maps were aligned to the FMRIB58_FA template supplied by FSL, using non‐linear transformation in FNIRT (Andersson, Jenkinson, & Smith, 2007). Next, a mean FA image of 18,600 UK Biobank subjects was obtained and thinned to create a mean FA skeleton. The number N = 18,600 was obtained from the processing of the two first UKB data releases. The maximal FA values for each subject were then projected onto the skeleton to minimise confounding effects due to partial volumes and any residual misalignments. Finally, all diffusion metrics were projected onto the subject‐specific skeletons. WM features were extracted based on John Hopkins University atlases for WM tracts and labels (with 0 thresholding) (Mori, Wakana, van Zijl, & Nagae‐Poetscher, 2005), yielding a total of 910 WM features including mean values and regional measures for each of the diffusion model metrics. For the region‐specific brain age models, 12 tracts of interest used in previous ageing and development studies were extracted (Krogsrud et al., 2016; Westlye et al., 2010); anterior thalamic radiation (ATR), corticospinal tract (CST) cingulate gyrus (CG), cingulum hippocampus (CING), forceps major (FMAJ), forceps minor (FMIN), inferior fronto‐occipital fasciculus (IFOF), inferior longitudinal fasciculus (ILF) superior longitudinal fasciculus (SLF), uncinate fasciculus (UF), superior longitudinal fasciculus temporal (SLFT), and corpus callosum (CC). The diffusion MRI data passed TBSS post‐processing quality control using the YTTRIUM algorithm (Maximov et al., 2021), and were residualised with respect to scanning site using linear models.
For the GM data, raw T1‐weighted MRI data for all participants were processed using a harmonised analysis pipeline, including automated surface‐based morphometry and subcortical segmentation. In line with recent brain age studies (de Lange et al., 2019; de Lange, Anatürk, Kaufmann, Cole, et al., 2020; de Lange, Barth, Kaufmann, Maximov, et al., 2020; Kaufmann et al., 2019), we utilised a fine‐grained cortical parcellation scheme (Glasser et al., 2016) to extract cortical thickness, area, and volume for 180 regions of interest per hemisphere, in addition to the classic set of subcortical and cortical summary statistics from FreeSurfer (version 5.3) (Fischl et al., 2002). This yielded a total set of 1,118 structural brain imaging features (360/360/360/38 for cortical thickness/area/volume, as well as cerebellar/subcortical and cortical summary statistics, respectively). Linear models were used to residualise the T1‐weighted MRI data with respect to scanning site, intracranial volume (Voevodskaya et al., 2014), and data quality using Euler numbers (Rosen et al., 2018) extracted from FreeSurfer. To remove poor‐quality data likely due to motion, participants with Euler numbers of SD ± 4 were identified and excluded (n = 80). In addition, participants with SD ± 4 on the global MRI measures mean FA, mean cortical GM volume, and/or subcortical GM volume were excluded (n = 10, n = 5, and n = 4, respectively), yielding a total of 8,895 participants with both WM (diffusion‐weighted) and GM (T1‐weighted) MRI data.
2.3. Brain age prediction
Brain age prediction is a method in which a machine learning algorithm estimates an individual's age based on their brain characteristics (Cole et al., 2017). This estimation is then compared to the individual's chronological age to estimate each individual's brain age gap (BAG), which is used to identify degrees of deviation from normative ageing trajectories. Such deviations have been associated with a range of clinical risk factors (Cole, 2020; de Lange, Anatürk, et al., 2020; Smith et al., 2020) as well as neurological and neuropsychiatric diseases (Cole et al., 2019; Cole, Marioni, Harris, & Deary, 2019; Franke & Gaser, 2019; Kaufmann et al., 2019). They have also been assessed in previous studies of parity and brain age (de Lange et al., 2019; de Lange, Barth, Kaufmann, Anatürk, et al., 2020; de Lange, Barth, Kaufmann, Maximov, et al., 2020; Ning et al., 2020).
Separate brain age prediction models were run for global WM and GM, and for each of the WM tracts using the XGBoost regressor model, which is based on a decision‐tree ensemble algorithm (https://xgboost.readthedocs.io/en/latest/python). XGBoost includes advanced regularisation to reduce over‐fitting (Chen & Guestrin, 2016), and uses a gradient boosting framework where the final model is based on a collection of individual models (https://github.com/dmlc/xgboost). For the global WM and GM models, principal component analyses (PCAs) were run on the features to reduce computational time. The top 200 PCA components, explaining 97.84% of the total variance, were used as input for the WM model, and the top 700 components, explaining 98.07% of the variance, were used as input for the GM model. The model parameters were set to maximum depth = 4, number of estimators = 140, and learning rate = 0.1 for the global and tract‐specific WM models, and maximum depth = 5, number of estimators = 140, and learning rate = 0.1 for the global GM model, based on randomised searches with 10 folds and 10 iterations for hyper‐parameter optimisation.
The models were run using 10‐fold cross‐validation, which splits the sample into subsets (folds) and trains the model on all subsets but one, which is used for evaluation. The process is repeated 10 times with a different subset reserved for evaluation each time. Predicted age estimates for each participant were derived using the Scikit‐learn library (https://scikit-learn.org), and BAG values were calculated using (predicted – chronological age). To validate the models, the 10‐fold cross validations were repeated 10 times, and average R 2, root mean square error, and mean absolute error were calculated across folds and repetitions.
2.4. Statistical analyses
The statistical analyses were conducted using Python 3.7.6. All variables were standardised (subtracting the mean and dividing by the SD) before entered into the analyses; and p‐values were corrected for multiple comparisons using false discovery rate correction (Benjamini & Hochberg, 1995). Chronological age was included as a covariate in all analyses, adjusting for age‐bias in the brain age predictions as well as age dependence in number of childbirths (de Lange & Cole, 2020; Le et al., 2018).
2.4.1. Previous childbirths and global WM brain age
To investigate associations between number of previous childbirths and global WM brain age, a linear regression analysis was run using global WM BAG as the dependent variable, and number of childbirths as the independent variable. To control for potential confounding factors, the analysis was rerun including variables known to influence brain structure in ageing or number of childbirths; assessment location (Takao, Hayashi, & Ohtomo, 2011), education (Cox et al., 2018; Ho et al., 2011), IQ (fluid intelligence) (Cox et al., 2018), ethnic background (Farrer et al., 1997), body mass index (BMI) (Ho et al., 2011), diabetic status (Beck et al., 2021; de Lange, Anatürk, et al., 2020), hypertension (Beck, de Lange, Pedersen, et al., 2021; de Lange, Anatürk, et al., 2020), smoking and alcohol intake (Beck, de Lange, Pedersen, et al., 2021; de Lange, Anatürk, et al., 2020), menopausal status (‘yes,” ‘no,” “not sure, had hysterectomy,” and “not sure, other reason”) (Brinton, Yao, Yin, Mack, & Cadenas, 2015; Fjell et al., 2009), oral contraceptive (OC) (De Bondt et al., 2013; Fox, Berzuini, & Knapp, 2013) and hormonal replacement therapy (HRT) status (previous or current user vs. never used) (Fox et al., 2013; Kantarci et al., 2016; Resnick et al., 2009), and experience with stillbirth, miscarriage, or pregnancy termination (“yes,” “no”) (Fox, Berzuini, Knapp, & Glynn, 2018; Laisk et al., 2020) as covariates. In total, 6,977 women had data on all variables and were included in these analyses. To test for potential non‐linear associations, we added number of childbirths squared as an additional independent variable to the previously defined multiple linear regression model. In addition, we tested for differences in WM BAG by number of childbirths by fitting another linear regression model with WM BAG as the dependent variable and number of childbirths (0, 1, 2, 3, 4, 5–8) as a fixed factor instead of continuous variable (adjusting for age). Women with zero childbirth served as the reference group. Women with 5–8 childbirths were merged due to low numbers in each group (5 = 55, 6 = 26, 7 = 4, 8 = 1). Cohen's d effect sizes (Cohen, 1988) were estimated for each comparison.
2.4.2. Previous childbirths and WM versus GM brain age
To compare the contributions of global WM and GM brain age to the association with previous childbirths, a multiple regression analysis was run with both WM and GM based BAG estimates as independent variables and number of childbirths as the dependent variable, before eliminating one modality at a time to compare the log‐likelihood of the full and reduced models. The significance of model differences was calculated using Wilk's theorem (Wilks, 1938) as , where ; the difference in log‐likelihood between the reduced model () and the full model ().
Next, we tested for differences between the GM and WM BAG associations with number of previous childbirths using a test for correlated samples (Zimmerman, 2012):
| (1) |
where m1 is Model 1 (WM); m2 is Model 2 (GM); indicates the beta coefficients from the linear regressions between number of childbirths and each model; is the SEs of the beta coefficients; and is the age‐adjusted correlation between the modality‐specific BAG estimates. As a follow‐up, we tested the associations between previous childbirths and mean FA, mean MD, and total GM volume.
2.4.3. Previous childbirths and regional WM tracts
To test for unique contributions by each tract to the global WM association with previous childbirths, a multiple regression analysis was run with all tract‐specific BAG estimates as independent variables and number of childbirths as the dependent variable, before eliminating the tracts one at a time to compare the log‐likelihood of the full and reduced models. The significance of model differences was calculated using Wilk's theorem as described in Section 2.4.2. In addition, the reduced values for each of the models were calculated to account for the difference in number of input variables to the full and reduced models (13 for the full model including 12 tracts age, vs. 11 for the reduced models where each of the tracts were eliminated one by one). Next, we performed separate regression analyses for each tract‐specific BAG estimate versus number of childbirths, before testing for differences between the associations using pairwise tests for correlated samples (Equation (1); Section 2.4.2).
3. RESULTS
The age prediction accuracies for the global WM and GM models, as well as each of the tract‐specific WM models are shown in Table 2. The correlations between predicted and chronological age for the global models are shown in Supplementary Information (SI) Figure 1. The associations between number of previous childbirths and BAG estimates based on each of the predictions are shown in Table 3.
TABLE 2.
Average R 2, RMSE, MAE, and correlation (r) between predicted and chronological age for the age prediction models
| R 2 | RMSE | MAE | r [95% CI] | p | |
|---|---|---|---|---|---|
| Global predictions | |||||
| Modality | |||||
| WM | .51 ± .02 | 5.06 ± 0.11 | 4.10 ± 0.09 | .72 [0.71, 0.73] | <.001 |
| GM | .32 ± .02 | 5.98 ± 0.13 | 4.97 ± 0.11 | .57 [0.55, 0.58] | <.001 |
| Predictions for each WM tract | |||||
| Tract | |||||
| ATR | .31 ± .02 | 6.03 ± 0.13 | 4.92 ± 0.12 | .56 [0.54, 0.57] | <.001 |
| CST | .15 ± .02 | 6.69 ± 0.14 | 5.53 ± 0.13 | .38 [0.37, 0.40] | <.001 |
| CG | .19 ± .02 | 6.54 ± 0.13 | 5.38 ± 0.12 | .44 [0.42, 0.45] | <.001 |
| CING | .12 ± .02 | 6.81 ± 0.14 | 5.64 ± 0.12 | .34 [0.32, 0.36] | <.001 |
| FMAJ | .14 ± .02 | 6.71 ± 0.13 | 5.55 ± 0.12 | .38 [0.37, 0.41] | <.001 |
| FMIN | .26 ± .02 | 6.24 ± 0.13 | 5.09 ± 0.12 | .51 [0.49, 0.52] | <.001 |
| IFOF | .25 ± .02 | 6.29 ± 0.13 | 5.16 ± 0.12 | .50 [0.48, 0.51] | <.001 |
| ILF | .18 ± .02 | 6.55 ± 0.14 | 5.40 ± 0.13 | .43 [0.41, 0.44] | <.001 |
| SLF | .18 ± .02 | 6.54 ± 0.13 | 5.40 ± 0.12 | .43 [0.41, 0.45] | <.001 |
| UF | .18 ± .03 | 6.56 ± 0.13 | 5.42 ± 0.12 | .42 [0.40, 0.44] | <.001 |
| SLFT | .17 ± .02 | 6.58 ± 0.14 | 5.42 ± 0.13 | 0.42 [0.41, 0.44] | <.001 |
| CC | .25 ± .02 | 6.26 ± 0.13 | 5.13 ± 0.12 | .50 [0.49, 0.52] | <.001 |
Abbreviations: ATR, anterior thalamic radiation; CC, corpus callosum; CG, cingulate gyrus; CI, confidence interval; CING, cingulum hippocampus; CST, corticospinal tract; FMAJ, forceps major; FMIN, forceps minor; GM, grey matter; IFOF, inferior fronto‐occipital fasciculus; ILF, inferior longitudinal fasciculus; MAE, mean absolute error; RMSE, root mean square error; SLF, superior longitudinal fasciculus; SLFT, superior longitudinal fasciculus temporal; UF, uncinate fasciculus; WM, white matter.
TABLE 3.
Associations between each of the brain‐age gap estimates and number of previous childbirths (β CB, SE, t, p, and p corr). Chronological age was included in the analyses for covariate purposes and p‐values are reported before and after correction for multiple comparisons, with corrected p‐values <.05 highlighted in bold
| β CB | SE | t | p | p corr | |
|---|---|---|---|---|---|
| Global associations | |||||
| Modality | |||||
| WM | −.037 | 0.007 | −5.44 | 5.46 × 10⁻⁸ | 2.31×10 −7 |
| GM | −.029 | 0.005 | −5.41 | 6.43 × 10⁻⁸ | 2.31×10 −7 |
| Associations for each WM tract | |||||
| Tract | |||||
| ATR | − .022 | 0.006 | − 3.66 | 2.51 × 10⁻⁴ | 5.03×10 −4 |
| CST | − .006 | 0.004 | − 1.44 | .15 | .16 |
| CG | − .013 | 0.005 | − 2.73 | .01 | .01 |
| CING | − .013 | 0.004 | − 3.17 | .00 | .00 |
| FMAJ | − .009 | 0.005 | − 2.02 | .04 | .06 |
| FMIN | − .021 | 0.006 | − 3.73 | 1.90 × 10⁻⁴ | 4.26×10 −4 |
| IFOF | − .012 | 0.006 | − 2.24 | .03 | .04 |
| ILF | − .008 | 0.005 | − 1.59 | .11 | .14 |
| SLF | − .006 | 0.005 | − 1.18 | .24 | .24 |
| UF | − .007 | 0.005 | − 1.46 | .14 | .16 |
| SLFT | − .011 | 0.005 | − 2.15 | .03 | .04 |
| CC | − .029 | 0.006 | − 5.25 | 1.60 × 10⁻⁷ | 4.81×10 −7 |
Abbreviations: ATR, anterior thalamic radiation; CC, corpus callosum; CG, cingulate gyrus; CING, cingulum hippocampus; CST, corticospinal tract; FMAJ, forceps major; FMIN, forceps minor; GM, grey matter; IFOF, inferior fronto‐occipital fasciculus; ILF, inferior longitudinal fasciculus; SE, standard error; SLF, superior longitudinal fasciculus; SLFT, superior longitudinal fasciculus temporal; UF, uncinate fasciculus; WM, white matter.
3.1. Previous childbirths and global WM brain age
Global WM BAG showed a negative association with number of previous childbirths, indicating a younger‐looking brain in parous women (see Table 3). As shown in Figure 1, mean WM BAG was positive in nulliparous and primiparous women (0.39 and 0.03, respectively) and negative in multiparous women (−0.13). The model including potential confounding factors showed a corresponding association of , , indicating that assessment location, education, IQ, ethnic background, BMI, diabetic status, hypertension, smoking and alcohol intake, menopausal status, and OC and HRT use could not fully explain the association between number of childbirths and global WM BAG. The correlations between global WM BAG and demographics, covariates, and number of childbirths are shown in SI Figure 2. Number of previous childbirths and age at first birth correlated (adjusted for age). To test for an association with global WM brain age, an analysis was run with WM BAG as the dependent variable and age at first birth as independent variable, including all covariates (assessment location, education, IQ, ethnic background, BMI, diabetic status, hypertension, smoking and alcohol intake, menopausal status, and OC and HRT use). No association was found (, N = 5,515). In addition to a linear effect, we also found evidence for a non‐linear association between number of childbirths and global WM BAG: Differences in WM BAG were found between nulliparous women and women with one, two, or three previous childbirths. The differences were not significant for women with four or more childbirths (shown in Figure 1 and Table 4).
FIGURE 1.
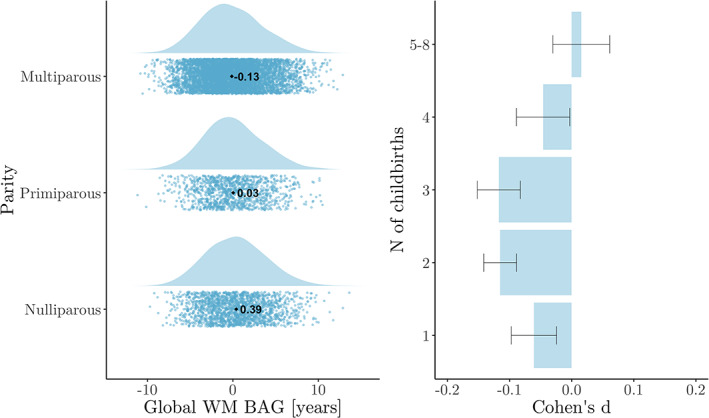
Global white matter (WM) brain age gap (BAG) for groups of women based on number of previous childbirths. Left plot: WM BAG in nulliparous, primiparous, and multiparous women are displayed as raincloud plots, which combines raw data points (scatterplot) and the distributions of the data (histogram) using split‐half violins. The mean for each group is displayed as a dot and text. Right plot: Cohen's d effect sizes for differences between each group of parous women (1, 2, 3, 4, 5–8) versus nulliparous women
TABLE 4.
Differences in global WM BAG by number of childbirths (β, SE, t, p, and Cohen's d ± SE), based on a regression model with WM BAG as the dependent variable and number of childbirths as a fixed factor, where 0 childbirths served as the reference group. Chronological age was included in the analyses for covariate purposes
| Childbirths | β | SE | t | p | d | N |
|---|---|---|---|---|---|---|
| 0 (intercept) | −.118 | 0.327 | 0.36 | .72 | — | 1825 |
| 1 | −.368 | 0.132 | − 2.80 | 5.14 × 10⁻³ | − 0.06 ± 0.04 | 1190 |
| 2 | −.510 | 0.101 | − 5.06 | 4.35 × 10⁻⁷ | − 0.12 ± 0.03 | 3911 |
| 3 | −.680 | 0.123 | − 5.51 | 3.72 × 10⁻⁸ | − 0.12 ± 0.02 | 1535 |
| 4 | −.330 | 0.208 | − 1.59 | .11 | − 0.05 ± 0.04 | 348 |
| 5‐8 | −.117 | 0.390 | 0.30 | .76 | − 0.02 ± 0.05 | 86 |
Abbreviations: BAG, brain age gap; SE, standard error; WM, white matter.
3.2. Previous childbirths and WM versus GM brain age
The age prediction based on the WM model showed higher accuracy compared to the GM prediction (R 2 of .51 vs. .32), as shown in Table 3. To directly compare the model predictions, a post hoc test for correlated samples (Equation (1); Section 2.4.2) was run on the model‐specific fits of predicted versus chronological age (Pearson's values). The result showed a significant difference in model performance in favour of the WM model; = −11.90, .
When comparing regression models including both WM and GM‐based BAG estimates to models including only one of the modalities, both the WM‐based and the GM‐based estimates were found to contribute uniquely to the association with number of previous childbirths, as shown in Table 5. The test for differences in associations (Equation (1); Section 2.4.2) revealed similar associations between number of childbirths and WM‐based versus GM‐based BAG estimates, as shown in Table 6. The follow‐up tests of mean FA, mean MD, and total GM volume showed positive associations between number of childbirths and mean FA as well as total GM volume, and a negative association with mean MD, as shown in SI Table 1. Only the association with MD was significant after adjusting for multiple comparisons.
TABLE 5.
Difference in log‐likelihood (ΔLL) between regression analyses where GM and WM‐based brain age gap estimates were eliminated one by one, compared to a model where both were included. The log likelihood (LL) value for the model including both modalities was −12,471. Reported are values before and after correction for multiple comparisons, with corrected p‐values <.05 highlighted in bold
| Left‐out modality | LL | ΔLL | Z | p | p corr |
|---|---|---|---|---|---|
| WM | −12,479 | 7.75 | 3.94 | 3.44 × 10⁻⁴ | 4.03×10 −4 |
| GM | −12,479 | 7.59 | 3.90 | 4.03 × 10⁻⁴ | 4.03×10 −4 |
Abbreviations: GM, grey matter; WM, white matter.
TABLE 6.
Difference in the associations (β) between number of previous childbirths and WM vs. GM‐based brain age estimates (Equation (1))
| βWM ± SE | βGM ± SE | Z | p |
|---|---|---|---|
| −.037 ± 0.007 | −.029 ± 0.005 | 1.04 | .30 |
Abbreviations: GM, grey matter; SE, standard error; WM, white matter.
3.3. Previous childbirths and regional WM tracts
Significant (p < .05) negative associations between number of previous childbirths and WM BAG estimates were found for ATR, CG, CING, FMIN, IFOF, SLFT, and CC, as shown in Table 3. The correlations between the tract‐specific BAG estimates are shown in Figure 2. CC contributed uniquely to the global WM association with number of previous childbirths, as shown in Table 7. Pairwise tests for differences in associations revealed that ATR and FMIN had significantly stronger associations with previous childbirths compared to SLF, while CC was more strongly associated with previous childbirths than CST, CG, FMAJ, IFOF, ILF, SLF, UF, and SLFT, as shown in Figure 3. As CC showed the most prominent contribution to the association with previous childbirths, we extracted the feature importance ranking from the CC‐specific age prediction. WMTI‐radEAD showed the highest gain (SI Table 2), indicating that this diffusion metric was most important for generating the prediction.
FIGURE 2.
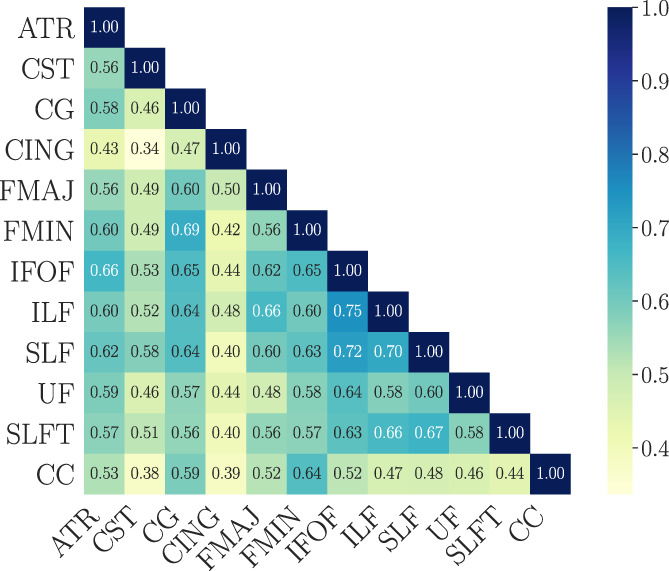
The correlations (Pearson's ) between tract‐specific brain age gap (BAG) estimates. The BAG values were first corrected for chronological age using linear models (Le et al., 2018), and the residuals were used in the correlation analysis. ATR, anterior thalamic radiation; CC, corpus callosum; CG, cingulate gyrus; CING, cingulum hippocampus; CST, corticospinal tract; FMAJ, forceps major; FMIN, forceps minor; IFOF, inferior fronto‐occipital fasciculus; ILF, inferior longitudinal fasciculus; SLF, superior longitudinal fasciculus; SLFT, superior longitudinal fasciculus temporal; UF, uncinate fasciculus
TABLE 7.
Difference in log‐likelihood (ΔLL) between regression analyses against number of previous childbirths (including age as a covariate). The difference is calculated between models where all tracts are included and models where single tracts are left out one at a time. Reported are p‐values before and after correction for multiple comparisons, with corrected p‐values < .05 highlighted in bold. = reduced chi‐squared values for each reduced model. For the full model, = 0.9686
| Left‐out tract | ΔLL | Z | p | p corr |
|
|
|---|---|---|---|---|---|---|
| ATR | 1.86 | 1.93 | .13 | .65 | 0.9689 | |
| CST | 0.08 | 0.41 | .74 | .78 | 0.9685 | |
| CG | 0.02 | 0.22 | .78 | .78 | 0.9685 | |
| CING | 1.56 | 1.79 | .16 | .65 | 0.9688 | |
| FMAJ | 0.39 | 0.88 | .54 | .78 | 0.9686 | |
| FMIN | 0.64 | 1.14 | .42 | .78 | 0.9686 | |
| IFOF | 0.02 | 0.19 | .78 | .78 | 0.9685 | |
| ILF | 0.25 | 0.71 | .62 | .78 | 0.9685 | |
| SLF | 1.08 | 1.47 | .27 | .68 | 0.9687 | |
| UF | 1.03 | 1.44 | .29 | .68 | 0.9687 | |
| SLFT | 0.28 | 0.75 | .60 | .78 | 0.9686 | |
| CC | 6.00 | 3.46 | .00 | .02 | 0.9698 |
Abbreviations: ATR, anterior thalamic radiation; CC, corpus callosum; CG, cingulate gyrus; CING, cingulum hippocampus; CST, corticospinal tract; FMAJ, forceps major; FMIN, forceps minor; IFOF, inferior fronto‐occipital fasciculus; ILF, inferior longitudinal fasciculus; SLF, superior longitudinal fasciculus; SLFT, superior longitudinal fasciculus temporal; UF, uncinate fasciculus.
FIGURE 3.
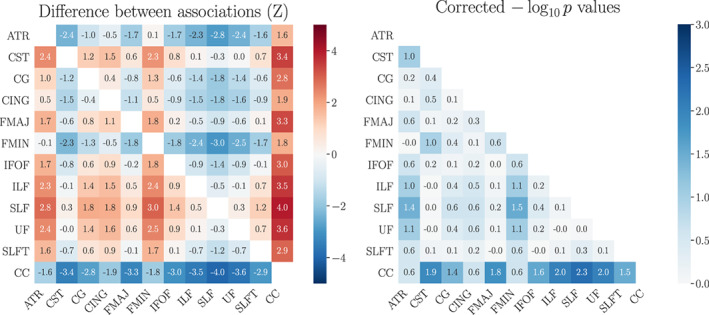
The differences () between tract‐specific associations with previous childbirths. Left plot: the values indicate the association with the tract on the y‐axis minus the association with the tract on the x‐axis (Equation (1); Section 2.4.2). The beta values for each association are provided in Table 3. Right plot: p‐values for the differences between associations, reported as the common logarithm () and corrected for multiple comparisons. A value of corresponds to . ATR, anterior thalamic radiation; CC, corpus callosum; CG, cingulate gyrus; CING, cingulum hippocampus; CST, corticospinal tract; FMAJ, forceps major; FMIN, forceps minor; IFOF, inferior fronto‐occipital fasciculus; ILF, inferior longitudinal fasciculus; SLF, superior longitudinal fasciculus; SLFT, superior longitudinal fasciculus temporal; UF, uncinate fasciculus
4. DISCUSSION
The current study investigated the association between previous childbirths and WM brain age by utilising global and region‐specific brain age prediction. The results showed that a higher number of previous childbirths was associated with lower brain age in global WM, as well as in WM tracts including ATR, CG, CING, FMAJ, FMIN, IFOF, SLFT, and CC. CC contributed uniquely to the global WM association with previous childbirths, and showed a stronger relationship with previous childbirths relative to several other tracts. When assessing global WM compared to GM brain age estimates, both modalities showed unique contributions to the association with previous childbirths. Taken together, these results indicate an association between previous childbirths and global WM ageing later in life, with regional effects that may be particularly prominent in CC.
4.1. Previous childbirths and global WM age
During pregnancy, several adaptations in the female body and brain take place in order to meet the needs and demands of the offspring, and to secure adequate expression of maternal caregiving (Barha & Galea, 2017; Feldman, 2016). Maternal adaptation in WM may thus be induced to meet these new demands, by promoting myelination to ensure increased efficiency of neural transmission in relevant WM tracts. While speculative, our results may reflect a long‐term benefit of pregnancy‐induced WM plasticity, potentially promoting favourable WM trajectories later in life (Hill, Li, & Grutzendler, 2018). In support of long‐term positive effects of childbirth on WM health, parity is associated with protective effects on age‐related decline in learning, memory, and brain health in rats (Gatewood et al., 2005). Further evidence for beneficial effects of parity on brain ageing stems from a study showing that telomeres are significantly elongated in parous relative to nulliparous women (Barha et al., 2016), suggesting that parity may slow down the pace of cellular ageing.
The current results are also in line with previous studies in MS patients showing beneficial effects of pregnancy on WM health (Chan et al., 2015; D'hooghe & Nagels, 2010; Gregg et al., 2007; Kalakh & Mouihate, 2019; Zhang et al., 2019). Oestradiol, a type of oestrogen that increases 300‐fold during pregnancy (Schock et al., 2016), has been linked to pregnancy‐induced MS remission (Voskuhl, 2003), likely due to its anti‐inflammatory and neuroplastic properties (Barha & Galea, 2010). Further evidence for protective effects of oestradiol stems from hormonal replacement studies in postmenopausal women: long‐term oestrogen use has been associated with greater WM volumes (Ha, Xu, & Janowsky, 2007), indicating a protective effect on WM loss in ageing. Postnatally, oestradiol levels drop rapidly and may promote a pro‐inflammatory immune environment (Pfeilschifter, Kditz, Pfohl, & Schatz, 2002), which has been linked to a risk of relapse or worsening of symptoms in women suffering from MS (Langer‐Gould et al., 2009; Tutuncu et al., 2013). However, in a long‐term perspective, pregnancy does not increase the risk of exacerbated disability (Dobson et al., 2019), and some evidence suggests that long‐term disability progression improves in MS patients following childbirth (D'hooghe & Nagels, 2010). Any influence of pregnancy‐related oestrogen fluctuations (i.e., perinatal surge, postpartum drop) on brain ageing is likely to involve a complex interplay of neurobiological processes, and evidence suggests that genetic factors may modulate how oestrogen exposure affects brain health (de Lange, Barth, Kaufmann, Maximov, et al., 2020; Manly et al., 2000; Yaffe, Haan, Byers, Tangen, & Kuller, 2000). Beside oestrogen, other hormones such as progesterone, prolactin, oxytocin, and cortisol also fluctuate during pregnancy and may regulate WM plasticity (Barth & de Lange, 2020; Baulieu & Schumacher, 1997; Gregg, 2009). For instance, emerging evidence from animal models suggests protective effects of progesterone and prolactin on WM structure due to its pro‐myelinating properties (Baulieu & Schumacher, 1997; Faheem et al., 2019; Liu et al., 2020). Prolactin signalling during pregnancy has been linked to increases in oligodendrocyte precursor cells and oligodendrocyte production in the maternal central nervous system, resulting in an enhanced ability to regenerate WM damage (Gregg, 2009). While the influence of hormone exposure on brain ageing trajectories is currently unclear, other pregnancy‐induced adaptations such as the proliferation of regulatory T cells or foetal microchimerism may also represent mechanisms underlying potential long‐term benefits of pregnancy on brain ageing (for a review, see Barth & de Lange, 2020). Future studies should target the links between hormone‐ and immune‐related neuroplasticity in pregnancy, and the potential effect of these processes on women's brain ageing trajectories.
Experience‐dependent brain plasticity due to parenting is another possible mechanism that may underlie individual differences in WM BAG between parous and nulliparous women. Becoming a parent represents a significant transition in life, including extensive lifestyle changes and brain adaptations in regions relevant for caregiving behaviour (Barha & Galea, 2017; Djalovski et al., 2021; Feldman, 2016; Ho & Swain, 2017; Hoekzema et al., 2020; Langer‐Gould et al., 2009; Pfeilschifter et al., 2002). For instance, studies have found a link between caregiving behaviour, altered brain activation, and levels of oxytocin in both fathers and mothers (Abraham et al., 2014), and parity has been associated with brain age and cognitive function in both men and women (Ning et al., 2020). While experience‐dependent brain plasticity related to parenting may influence WM trajectories later in life, animal research has demonstrated that WM adaptations are also induced by pregnancy itself (Chan et al., 2015;Gregg et al., 2007; Kalakh & Mouihate, 2019). Hence, pregnancy‐ and parental experience‐induced plasticity are not mutually exclusive, and may together shape WM brain trajectories later in life. To disentangle the effects of pregnancy and parental experience on WM brain ageing trajectories, further research may aim to include fathers as well as women who have experienced adoption (parenting experience without the pregnancy experience) and stillbirth (pregnancy experience without the parenting experience).
While the results showed a negative linear relationship between parity and brain age estimates, follow‐up analyses also indicated a quadratic effect in line with what we observed in one of our previous studies based on GM brain age (de Lange et al., 2019). However, this non‐linear GM effect was not replicated in a follow‐up study conducted in 8,800 new UK Biobank participants (de Lange, Barth, Kaufmann, Anatürk, et al., 2020), and given the small number of women with >4 children, further studies are needed to conclude on whether any protective effects of parity may be less pronounced in grand‐parous women.
Previous childbirths also showed associations with mean FA, mean MD, and total GM volume, but with lower values compared to the associations with BAG. Relative to more traditional MRI summary measures, age prediction models have the advantage of encoding normative trajectories of brain differences across age, and condensing a rich variety of brain characteristics into single estimates per individual. Hence, brain age prediction provides a useful summary measure that may serve as a proxy for brain integrity across normative and clinical populations (Cole & Franke, 2017; Cole, Marioni, et al., 2019; Kaufmann et al., 2019; Rokicki et al., 2020; Smith et al., 2020).
4.2. Modality‐specific and regional effects
In line with recent studies demonstrating high age prediction accuracy based on diffusion‐weighted imaging data (Beck et al., 2021; Cole, Marioni, et al., 2019; Richard et al., 2018; Smith et al., 2020; Tønnesen et al., 2020), the WM prediction showed higher accuracy compared to the GM model, of which the accuracy corresponded to our previous UK Biobank studies (de Lange et al., 2019; de Lange, Barth, Kaufmann, Anatürk, et al., 2020; de Lange, Barth, Kaufmann, Maximov, et al., 2020). Importantly, we found unique contributions by both models, suggesting that the diffusion‐based WM model may pick up variance not explained by the T1‐based GM model. These findings highlight the relevance of assessing brain characteristics using different MRI modalities to increase our understanding of possible long‐term effects of pregnancy on the brain.
The most prominent regional WM effect of childbirth was seen in the CC, showing both a unique contribution and a stronger association relative to several other tracts, potentially indicating regional variations. While the volume of most WM tracts increase from childhood to young adulthood, peaks around the fifties, and subsequently declines (Cox et al., 2016; Davis et al., 2009; Krogsrud et al., 2016; Storsve, Fjell, Yendiki, & Walhovd, 2016; Tamnes, Roalf, Goddings, & Lebel, 2018; Westlye et al., 2010), CC volume has been shown to peak already in the beginning of the thirties, exhibiting an earlier onset of age‐related decline relative to other WM tracts (Westlye et al., 2010). Sex differences have also been found in CC ageing, with steeper volumetric decline in men relative to women (Armstrong et al., 2019). Although speculative, our findings could potentially reflect a mitigating effect of parity on age‐related CC volumetric decline. While little is known about pregnancy‐induced alterations in specific WM regions, an increased number of myelinated axons in the CC have been found in healthy pregnant rats (Gregg et al., 2007), and increased CC remyelination has been observed in pregnant rat models of demyelination (Gregg et al., 2007; Kalakh & Mouihate, 2019). Interestingly, radEAD from the WMTI diffusion model was found to be the most important feature for the CC‐specific WM age prediction. WMTI‐radEAD has been related to degree of myelination in both ex vivo (Kelm et al., 2016) and in vivo animal histology models (Jelescu et al., 2016), as well as in an ex vivo human model of CC (Zhou et al., 2020). While this may potentially indicate that the CC association with previous childbirths could be driven by individual differences in myelin‐related ageing processes, the precise underlying neural substrates of diffusion metrics remain to be clarified. Furthermore, CC is also the most accessible WM structure to investigate given its size and location in the brain, and the relative simple and coherent microstructural milieu may be easier to resolve using diffusion MRI compared to other pathways with more complex tissue structure. The tract extraction procedure could thus result in higher signal‐to‐noise ratio for the CC than for the remaining tracts, rendering it more sensitive to tests of WM associations with childbirth.
4.3. Study limitations
The cross‐sectional design of the current study represents a major limitation, and longitudinal studies following women through pregnancy, postpartum, and into midlife and older age are required to infer causality between the observed associations. Furthermore, a complex interplay of numerous underlying processes likely influence the link between parity and WM trajectories. While the current study controls for a range of confounding factors including neurological disease, mental disorders, education, lifestyle behaviours, and cardiovascular risk, the number of children a woman gives birth to, as well as their brain health across the lifespan, may also depend on genetic predispositions, life circumstances, and additional aspects of general health. While information on breastfeeding was not available in the current dataset, this factor is relevant for future studies as it is known to influence oestrogen exposure (Bernstein, 2002) and maternal health (Ciampo & Ciampo, 2018).
Our results could potentially reflect long‐term effects of pregnancy‐related processes such as myelination. However, the exact neurobiological underpinnings of diffusion metrics cannot be directly inferred, and although we utilised advanced diffusion modelling which is sensitive to biophysical tissue properties (Jelescu & Budde, 2017), the biological substrates underlying these metrics remain to be elucidated by future studies. In addition, controlling for the effect of extracellular water or indices of hydration (Jones & Cercignani, 2010) as well as including measures of WM hyper‐intensities (Anatürk et al., 2020; Habes et al., 2016) could potentially provide more accurate models of WM ageing.
The effect sizes for differences between groups of parous and nulliparous women ranged from 0.06 to 0.12, which is generally considered small. Small effects are common in large datasets (Dick et al., 2021; Paulus & Thompson, 2019), and while parity may explain only a small portion of the variance in brain age, our findings emphasise the importance of including female‐specific variables in studies of women's brain ageing, as well as sex differences in risk factors and disease (de Lange, Jacobs, & Galea, 2021). While the UK Biobank dataset enables detection of subtle effects due to its large sample size, the cohort is homogeneous with regard to ethnic background (97% white participants in the current study), preventing any conclusion about associations between reproductive history and WM ageing across ethnic groups. The cohort is also homogeneous with regard to education level and residing in the United Kingdom. Since access to healthcare, social welfare benefits, and maternity leave policies differ significantly across the world, such factors are important to address in future studies including multiple cohorts. The UK Biobank is also characterised by a “healthy volunteer effect” (Fry et al., 2017), suggesting that it is not representative of the general population (Keyes & Westreich, 2019). Hence, the presented results may not apply to populations beyond those represented in this cohort. However, in context of the historical lack of research on women's brain health (Taylor, Pritschet, Yu, & Jacobs, 2019), the current results may prompt further study into how female‐specific factors such as pregnancy influences neural processes involved in normal ageing—as well as autoimmune conditions and Alzheimer's disease, of which the risks are higher for women relative to men (Natri, Garcia, Buetow, Trumble, & Wilson, 2019; Nichols et al., 2019).
4.4. Conclusion
In summary, the current study found an association between a higher number of previous childbirths and lower WM brain age, in line with previous studies showing relationships between parity and brain characteristics in midlife and older age (de Lange, Barth, Kaufmann, Anatürk, et al., 2020; Ning et al., 2020; Orchard et al., 2020). As outlined above, a complex interplay of numerous underlying processes likely influence the link between previous childbirths and brain health in older age. Thus, while our results may suggest that reproductive history influences women's WM ageing trajectories, prospective longitudinal studies assessing this multi‐factorial relationship are greatly needed to increase the knowledge about women's brain health across the lifespan.
AUTHOR CONTRIBUTIONS
Irene Voldsbekk, Lars T. Westlye, and Ann‐Marie G. de Lange: Designed the study. Ivan I. Maximov, Tobias Kaufmann, Claudia Barth, and Ann‐Marie G. de Lange: Processed the data. Irene Voldsbekk, Dani Beck, and Ann‐Marie G. de Lange: Performed the data analyses. Irene Voldsbekk, Claudia Barth, Ivan I. Maximov, Tobias Kaufmann, Dani Beck, Genevieve Richard, Torgeir Moberget, Lars T. Westlye, and Ann‐Marie G. de Lange: Interpreted the data. Irene Voldsbekk and Ann‐Marie G. de Lange: Drafted and finalised the manuscript. Claudia Barth, Ivan I. Maximov, Tobias Kaufmann, Dani Beck, Genevieve Richard, Torgeir Moberget, and Lars T. Westlye: Critically revised the first draft and approved the final manuscript.
Supporting information
Appendix S1: Supplementary Information
ACKNOWLEDGEMENTS
This research has been conducted using the UK Biobank under Application 27412. The work was performed on the Service for Sensitive Data (TSD) platform, owned by the University of Oslo, operated and developed by the TSD service group at the University of Oslo IT‐Department (USIT). Computations were also performed using resources provided by UNINETT Sigma2 the National Infrastructure for High Performance Computing and Data Storage in Norway. While working on this study, the authors received funding from the Research Council of Norway (I. V.; Student scholarship; T. K.; 276082; L. T. W.; 273345, 249795, 298646, 300768, 223273; C. B.; 250358), the South‐East Norway Regional Health Authority (L. T. W.; 2018076, 2019101), the European Research Council under the European Unions Horizon 2020 research and innovation programme (L. T. W.; 802998), and the Swiss National Science Foundation (A. M.G. de L.; PZ00P3_193658). Open Access funding enabled and organized by ProjektDEAL.
Voldsbekk, I., Barth, C., Maximov, I. I., Kaufmann, T., Beck, D., Richard, G., Moberget, T., Westlye, L. T., & de Lange, A.‐M. G. (2021). A history of previous childbirths is linked to women's white matter brain age in midlife and older age. Human Brain Mapping, 42(13), 4372–4386. 10.1002/hbm.25553
[Corrections added after online publication, 25 June, 2021: The first name of Dr. Genevieve Richard was incorrectly spelled in the initial publication. It has been corrected.]
Funding information H2020 European Research Council, Grant/Award Number: 802998; Helse Sør‐Øst RHF, Grant/Award Numbers: 2018076, 2019101; Norges Forskningsråd, Grant/Award Numbers: 223273, 249795, 250358, 273345, 276082, 286838, 298646, 300768; Schweizerischer Nationalfonds zur Förderung der Wissenschaftlichen Forschung, Grant/Award Number: PZ00P3_193658
DATA AVAILABILITY STATEMENT
The data that support the findings of this study are available through the UK Biobank data access procedures (https://www.ukbiobank.ac.uk/researchers).
REFERENCES
- Abraham, E., Hendler, T., Shapira‐Lichter, I., Kanat‐Maymon, Y., Zagoory‐Sharon, O., & Feldman, R. (2014). Father's brain is sensitive to childcare experiences. Proceedings of the National Academy of Sciences of the United States of America, 111, 9792–9797. [DOI] [PMC free article] [PubMed] [Google Scholar]
- Alfaro‐Almagro, F., Jenkinson, M., Bangerter, N. K., Andersson, J. L., Griffanti, L., Douaud, G., … Smith, S. M. (2018). Image processing and quality control for the first 10,000 brain imaging datasets from UK Biobank. NeuroImage, 166, 400–424. [DOI] [PMC free article] [PubMed] [Google Scholar]
- Anatürk, M., Kaufmann, T., Cole, J. H., Suri, S., Griffanti, L., Zsoldos, E., … de Lange, A.‐M.G. (2020). Prediction of brain age and cognitive age: Quantifying brain and cognitive maintenance in aging. Human Brain Mapping, 42(6), 1626–1640. [DOI] [PMC free article] [PubMed] [Google Scholar]
- Andersson, J. L., Graham, M. S., Zsoldos, E., & Sotiropoulos, S. N. (2016). Incorporating outlier detection and replacement into a non‐parametric framework for movement and distortion correction of diffusion MR images. NeuroImage, 141, 556–572. [DOI] [PubMed] [Google Scholar]
- Andersson, J. L., & Sotiropoulos, S. N. (2016). An integrated approach to correction for off‐resonance effects and subject movement in diffusion MR imaging. NeuroImage, 125, 1063–1078. [DOI] [PMC free article] [PubMed] [Google Scholar]
- Andersson, J. L. R., Jenkinson, M., & Smith, S. (2007). Non‐linear optimisation, FMRIB Technical Report TR07JA1. FMRIB Analysis Group, Oxford University. Retrieved from http://www.fmrib.ox.ac.uk/analysis/techrep
- Armstrong, N. M., An, Y., Beason‐Held, L., Doshi, J., Erus, G., Ferrucci, L., … Resnick, S. M. (2019). Sex differences in brain aging and predictors of neurodegeneration in cognitively healthy older adults. Neurobiology of Aging, 81, 146–156. [DOI] [PMC free article] [PubMed] [Google Scholar]
- Asato, M., Terwilliger, R., Woo, J., & Luna, B. (2010). White matter development in adolescence: A DTI study. Cerebral Cortex, 20, 2122–2131. [DOI] [PMC free article] [PubMed] [Google Scholar]
- Barha, C. K., & Galea, L. A. (2010). Influence of different estrogens on neuroplasticity and cognition in the hippocampus. Biochimica et Biophysica Acta (BBA)‐General Subjects, 1800, 1056–1067. [DOI] [PubMed] [Google Scholar]
- Barha, C. K., & Galea, L. A. (2017). The maternal ‘baby brain’ revisited. Nature Neuroscience, 20, 134–135. [DOI] [PubMed] [Google Scholar]
- Barha, C. K., Hanna, C. W., Salvante, K. G., Wilson, S. L., Robinson, W. P., Altman, R. M., & Nepomnaschy, P. A. (2016). Number of children and telomere length in women: A prospective, longitudinal evaluation. PLoS One, 11(1), e0146424. [DOI] [PMC free article] [PubMed] [Google Scholar]
- Barnea‐Goraly, N., Menon, V., Eckert, M., Tamm, L., Bammer, R., Karchemskiy, A., … Reiss, A. L. (2005). White matter development during childhood and adolescence: A cross‐sectional diffusion tensor imaging study. Cerebral Cortex, 15, 1848–1854. [DOI] [PubMed] [Google Scholar]
- Barth, C., & de Lange, A.‐M. G. (2020). Towards an understanding of womens brain aging: The immunology of pregnancy and menopause. Frontiers in Neuroendocrinology, 58, 100850. [DOI] [PubMed] [Google Scholar]
- Basser, P. J., Mattiello, J., & LeBihan, D. (1994). MR diffusion tensor spectroscopy and imaging. Biophysical Journal, 66, 259–267. [DOI] [PMC free article] [PubMed] [Google Scholar]
- Baulieu, E., & Schumacher, M. (1997). Neurosteroids, with special reference to the effect of progesterone on myelination in peripheral nerves. Multiple Sclerosis Journal, 3, 105–112. [DOI] [PubMed] [Google Scholar]
- Beck, D., de Lange, A.‐M., Maximov, I. I., Richard, G., Andreassen, O. A., Nordvik, J. E., & Westlye, L. T. (2021). White matter microstructure across the adult lifespan: A mixed longitudinal and cross‐sectional study using advanced diffusion models and brain‐age prediction. NeuroImage, 224, 117441. [DOI] [PubMed] [Google Scholar]
- Beck, D., de Lange, A.‐M. G., Pedersen, M. L., Alnæs, D., Maximov, I. I., Voldsbekk, I., … Westlye, L. T. (2021). Cardiometabolic risk factors associated with brain age and accelerate brain ageing. medRxiv. [DOI] [PMC free article] [PubMed] [Google Scholar]
- Benjamini, Y., & Hochberg, Y. (1995). Controlling the false discovery rate: A practical and powerful approach to multiple testing. Journal of the Royal Statistical Society: Series B (Methodological), 57, 289–300. [Google Scholar]
- Bernstein, L. (2002). Epidemiology of endocrine‐related risk factors for breast cancer. Journal of Mammary Gland Biology and Neoplasia, 7, 3–15. [DOI] [PubMed] [Google Scholar]
- Brinton, R. D., Yao, J., Yin, F., Mack, W. J., & Cadenas, E. (2015). Perimenopause as a neurological transition state. Nature Reviews Endocrinology, 11, 393–405. [DOI] [PMC free article] [PubMed] [Google Scholar]
- Carmona, S., Martnez‐Garca, M., Paternina‐Die, M., Barba‐Müller, E., Wierenga, L. M., Aleman‐Gomez, Y., … Hoekzema, E. (2019). Pregnancy and adolescence entail similar neuroanatomical adaptations: A comparative analysis of cerebral morphometric changes. Human Brain Mapping, 40, 2143–2152. [DOI] [PMC free article] [PubMed] [Google Scholar]
- Chan, R. W., Ho, L. C., Zhou, I. Y., Gao, P. P., Chan, K. C., & Wu, E. X. (2015). Structural and functional brain remodeling during pregnancy with diffusion tensor MRI and resting‐state functional MRI. PLoS One, 10, e0144328. [DOI] [PMC free article] [PubMed] [Google Scholar]
- Chen, T., & Guestrin, C., (2016). Xgboost: A scalable tree boosting system. In Proceedings of the 22nd ACM SIGKDD international conference on knowledge discovery and data mining.
- Ciampo, L. A. D., & Ciampo, I. R. L. D. (2018). Breastfeeding and the benefits of lactation for women's health. Revista Brasileira de Ginecologia e Obstetrcia, 40, 354–359. [DOI] [PMC free article] [PubMed] [Google Scholar]
- Cohen, J. (1988). Statistical power analysis for the behavioral sciences (2nd ed.). New York, NY: Academic Press. [Google Scholar]
- Cole, J., Raffel, J., Friede, T., Eshaghi, A., Brownlee, W., Chard, D., … on behalf of the MAGNIMS study group . (2019). Accelerated brain ageing and disability in multiple sclerosis. bioRxiv, 584888. [Google Scholar]
- Cole, J. H. (2020). Multi‐modality neuroimaging brain‐age in UK Biobank: and cognitive factors. Neurobiology of Aging, 92, 34–42. [DOI] [PMC free article] [PubMed] [Google Scholar]
- Cole, J. H., & Franke, K. (2017). Predicting age using neuroimaging: Innovative brain ageing biomarkers. Trends in Neurosciences, 40, 681–690. [DOI] [PubMed] [Google Scholar]
- Cole, J. H., Marioni, R. E., Harris, S. E., & Deary, I. J. (2019). Brain age and other bodily ages: Implications for neuropsychiatry. Molecular Psychiatry, 24, 266–281. [DOI] [PMC free article] [PubMed] [Google Scholar]
- Cole, J. H., Poudel, R. P., Tsagkrasoulis, D., Caan, M. W., Steves, C., Spector, T. D., & Montana, G. (2017). Predicting brain age with deep learning from raw imaging data results in a reliable and heritable biomarker. NeuroImage, 163, 115–124. [DOI] [PubMed] [Google Scholar]
- Confavreux, C., Hutchinson, M., Hours, M. M., Cortinovis‐Tourniaire, P., Moreau, T., & the Pregnancy in Multiple Sclerosis Group . (1998). Rate of pregnancy‐related relapse in multiple sclerosis. New England Journal of Medicine, 339, 285–291. [DOI] [PubMed] [Google Scholar]
- Cox, S. R., Bastin, M. E., Ritchie, S. J., Dickie, D. A., Liewald, D. C., Maniega, S. M., … Deary, I. J. (2018). Brain cortical characteristics of lifetime cognitive ageing. Brain Structure and Function, 223, 509–518. [DOI] [PMC free article] [PubMed] [Google Scholar]
- Cox, S. R., Ritchie, S. J., Tucker‐Drob, E. M., Liewald, D. C., Hagenaars, S. P., Davies, G., … Deary, I. J. (2016). Ageing and brain white matter structure in 3,513 UK Biobank participants. Nature Communications, 7, 1–13. [DOI] [PMC free article] [PubMed] [Google Scholar]
- Davis, S. W., Dennis, N. A., Buchler, N. G., White, L. E., Madden, D. J., & Cabeza, R. (2009). Assessing the effects of age on long white matter tracts using diffusion tensor tractography. NeuroImage, 46, 530–541. [DOI] [PMC free article] [PubMed] [Google Scholar]
- de Bondt, T., van Hecke, W., Veraart, J., Leemans, A., Sijbers, J., Sunaert, S., … Parizel, P. M. (2013). Does the use of hormonal contraceptives cause microstructural changes in cerebral white matter? Preliminary results of a DTI and tractography study. European Radiology, 23, 57–64. [DOI] [PubMed] [Google Scholar]
- de Lange, A.‐M. G., Anatürk, M., Kaufmann, T., Cole, J. H., Griffanti, L., Zsoldos, E., … Ebmeier, K. P. (2020). Multimodal brain‐age prediction and cardiovascular risk: The Whitehall II MRI sub‐study. NeuroImage, 222, 117292. [DOI] [PMC free article] [PubMed] [Google Scholar]
- de Lange, A.‐M. G., Barth, C., Kaufmann, T., Anatürk, M., Suri, S., Ebmeier, K. P., & Westlye, L. T. (2020). The maternal brain: Region‐specific patterns of brain aging are traceable decades after childbirth. Human Brain Mapping, 41, 4718–4729. [DOI] [PMC free article] [PubMed] [Google Scholar]
- de Lange, A.‐M. G., Barth, C., Kaufmann, T., Maximov, I. I., van der Meer, D., Agartz, I., & Westlye, L. T. (2020). Women's brain aging: Effects of sex‐hormone exposure, pregnancies, and genetic risk for Alzheimer's disease. Human Brain Mapping, 41, 5141–5150. [DOI] [PMC free article] [PubMed] [Google Scholar]
- de Lange, A.‐M. G., & Cole, J. H. (2020). Commentary: Correction procedures in brain‐age prediction. NeuroImage: Clinical, 26, 102229. [DOI] [PMC free article] [PubMed] [Google Scholar]
- de Lange, A.‐M. G., Jacobs, E. G., & Galea, L. A. (2021). The scientific body of knowledge: Whose body does it serve? A spotlight on women's brain health. Frontiers in Neuroendocrinology, 60, 100898. [DOI] [PubMed] [Google Scholar]
- de Lange, A.‐M. G., Kaufmann, T., van der Meer, D., Maglanoc, L. A., Alnæs, D., Moberget, T., … Westlye, L. T. (2019). Population‐based neuroimaging reveals traces of childbirth in the maternal brain. Proceedings of the National Academy of Sciences of the United States of America, 116(44), 22341–22346. [DOI] [PMC free article] [PubMed] [Google Scholar]
- D'hooghe, M. B., & Nagels, G. (2010). Long‐term effects of childbirth in MS. Journal of Neurology, Neurosurgery & Psychiatry, 81, 38–41. [DOI] [PubMed] [Google Scholar]
- Dick, A. S., Lopez, D. A., Watts, A. L., Heeringa, S. G., Reuter, C., Bartsch, H., … Thompson, W. K. (2021). Meaningful effects in the adolescent brain cognitive development study. BioRxiv. [DOI] [PMC free article] [PubMed] [Google Scholar]
- Djalovski, A., Dumas, G., Kinreich, S., & Feldman, R. (2021). Human attachments shape interbrain synchrony toward efficient performance of social goals. NeuroImage, 226, 117600. [DOI] [PubMed] [Google Scholar]
- Dobson, R., Dassan, P., Roberts, M., Giovannoni, G., Nelson‐Piercy, C., & Brex, P. A. (2019). UKconsensus on pregnancy in multiple sclerosis: Association of British neurologists guidelines. Practical Neurology, 19, 106–114. [DOI] [PubMed] [Google Scholar]
- Duarte‐Guterman, P., Leuner, B., & Galea, L. A. (2019). The long and short term effects of motherhood on the brain. Frontiers in Neuroendocrinology, 53, 100740. [DOI] [PubMed] [Google Scholar]
- Eavani, H., Habes, M., Satterthwaite, T. D., An, Y., Hsieh, M.‐K., Honnorat, N., … Davatzikos, C. (2018). Heterogeneity of structural and functional imaging patterns of advanced brain aging revealed via machine learning methods. Neurobiology of Aging, 71, 41–50. [DOI] [PMC free article] [PubMed] [Google Scholar]
- Faheem, H., Mansour, A., Elkordy, A., Rashad, S., Shebl, M., Madi, M., … Tominaga, T. (2019). Neuroprotective effects of minocycline and progesterone on white matter injury after focal cerebral ischemia. Journal of Clinical Neuroscience, 64, 206–213. [DOI] [PubMed] [Google Scholar]
- Farrer, L. A., Cupples, L. A., Haines, J. L., Hyman, B., Kukull, W. A., Mayeux, R., … van Duijn, C. M. (1997). Effects of age, sex, and ethnicity on the association between apolipoprotein e genotype and Alzheimer disease: A meta‐analysis. JAMA, 278, 1349–1356. [PubMed] [Google Scholar]
- Feldman, R. (2016). The neurobiology of mammalian parenting and the biosocial context of human caregiving. Hormones and Behavior, 77, 3–17. [DOI] [PubMed] [Google Scholar]
- Fieremans, E., Jensen, J. H., & Helpern, J. A. (2011). White matter characterization with diffusional kurtosis imaging. NeuroImage, 58, 177–188. [DOI] [PMC free article] [PubMed] [Google Scholar]
- Fischl, B., Salat, D. H., Busa, E., Albert, M., Dieterich, M., Haselgrove, C., … Dale, A. M. (2002). Whole brain segmentation: Automated labeling of neuroanatomical structures in the human brain. Neuron, 33, 341–355. [DOI] [PubMed] [Google Scholar]
- Fjell, A. M., Westlye, L. T., Amlien, I., Espeseth, T., Reinvang, I., Raz, N., … Walhovd, K. B. (2009). High consistency of regional cortical thinning in aging across multiple samples. Cerebral Cortex, 19, 2001–2012. [DOI] [PMC free article] [PubMed] [Google Scholar]
- Fox, M., Berzuini, C., & Knapp, L. A. (2013). Cumulative estrogen exposure, number of menstrual cycles, and Alzheimer's risk in a cohort of British women. Psychoneuroendocrinology, 38, 2973–2982. [DOI] [PubMed] [Google Scholar]
- Fox, M., Berzuini, C., Knapp, L. A., & Glynn, L. M. (2018). Women's pregnancy life history and Alzheimer's risk: Can immunoregulation explain the link? American Journal of Alzheimer's Disease & Other Dementias, 33, 516–526. [DOI] [PMC free article] [PubMed] [Google Scholar]
- Franke, K., & Gaser, C. (2019). Ten years of brainage as a neuroimaging biomarker of brain aging: What insights have we gained? Frontiers in Neurology, 10, 789. [DOI] [PMC free article] [PubMed] [Google Scholar]
- Fry, A., Littlejohns, T. J., Sudlow, C., Doherty, N., Adamska, L., Sprosen, T., … Allen, N. E. (2017). Comparison of sociodemographic and health‐related characteristics of UK Biobank participants with those of the general population. American Journal of Epidemiology, 186, 1026–1034. [DOI] [PMC free article] [PubMed] [Google Scholar]
- Gatewood, J. D., Morgan, M. D., Eaton, M., McNamara, I. M., Stevens, L. F., Macbeth, A. H., … Kinsley, C. H. (2005). Motherhood mitigates aging‐related decrements in learning and memory and positively affects brain aging in the rat. Brain Research Bulletin, 66, 91–98. [DOI] [PubMed] [Google Scholar]
- Giorgio, A., Watkins, K. E., Chadwick, M., James, S., Winmill, L., Douaud, G., … James, A. C. (2010). Longitudinal changes in grey and white matter during adolescence. NeuroImage, 49, 94–103. [DOI] [PubMed] [Google Scholar]
- Giorgio, A., Watkins, K. E., Douaud, G., James, A., James, S., de Stefano, N., … Johansen‐Berg, H. (2008). Changes in white matter microstructure during adolescence. NeuroImage, 39, 52–61. [DOI] [PubMed] [Google Scholar]
- Glasser, M. F., Coalson, T. S., Robinson, E. C., Hacker, C. D., Harwell, J., Yacoub, E., … van Essen, D. C. (2016). A multi‐modal parcellation of human cerebral cortex. Nature, 536, 171–178. [DOI] [PMC free article] [PubMed] [Google Scholar]
- Gregg, C. (2009). Pregnancy, prolactin and white matter regeneration. Journal of the Neurological Sciences, 285, 22–27. [DOI] [PubMed] [Google Scholar]
- Gregg, C., Shikar, V., Larsen, P., Mak, G., Chojnacki, A., Yong, V. W., & Weiss, S. (2007). White matter plasticity and enhanced remyelination in the maternal cns. Journal of Neuroscience, 27, 1812–1823. [DOI] [PMC free article] [PubMed] [Google Scholar]
- Ha, D. M., Xu, J., & Janowsky, J. S. (2007). Preliminary evidence that long‐term estrogen use reduces white matter loss in aging. Neurobiology of Aging, 28, 1936–1940. [DOI] [PMC free article] [PubMed] [Google Scholar]
- Habes, M., Erus, G., Toledo, J. B., Zhang, T., Bryan, N., Launer, L. J., … Davatzikos, C. (2016). White matter hyperintensities and imaging patterns of brain ageing in the general population. Brain, 139, 1164–1179. [DOI] [PMC free article] [PubMed] [Google Scholar]
- Hill, R. A., Li, A. M., & Grutzendler, J. (2018). Lifelong cortical myelin plasticity and age‐related degeneration in the live mammalian brain. Nature Neuroscience, 21, 683–695. [DOI] [PMC free article] [PubMed] [Google Scholar]
- Ho, A. J., Raji, C. A., Becker, J. T., Lopez, O. L., Kuller, L. H., Hua, X., … Thompson, P. M. (2011). The effects of physical activity, education, and body mass index on the aging brain. Human Brain Mapping, 32, 1371–1382. [DOI] [PMC free article] [PubMed] [Google Scholar]
- Ho, S. S., & Swain, J. E. (2017). Depression alters maternal extended amygdala response and functional connectivity during distress signals in attachment relationship. Behavioural Brain Research, 325, 290–296. [DOI] [PMC free article] [PubMed] [Google Scholar]
- Hoekzema, E., Barba‐Müller, E., Pozzobon, C., Picado, M., Lucco, F., Garca‐Garca, D., … Vilarroya, O. (2017). Pregnancy leads to long‐lasting changes in human brain structure. Nature Neuroscience, 20, 287–296. [DOI] [PubMed] [Google Scholar]
- Hoekzema, E., Tamnes, C. K., Berns, P., Barba‐Müller, E., Pozzobon, C., Picado, M., … Carmona, S. (2020). Becoming a mother entails anatomical changes in the ventral striatum of the human brain that facilitate its responsiveness to offspring cues. Psychoneuroendocrinology, 112, 104507. [DOI] [PubMed] [Google Scholar]
- Jelescu, I. O., & Budde, M. D. (2017). Design and validation of diffusion MRI models of white matter. Frontiers in Physics, 5, 61. [DOI] [PMC free article] [PubMed] [Google Scholar]
- Jelescu, I. O., Zurek, M., Winters, K. V., Veraart, J., Rajaratnam, A., Kim, N. S., … Fieremans, E. (2016). In vivo quantification of demyelination and recovery using compartment‐specific diffusion MRI metrics validated by electron microscopy. NeuroImage, 132, 104–114. [DOI] [PMC free article] [PubMed] [Google Scholar]
- Jensen, J. H., Helpern, J. A., Ramani, A., Lu, H., & Kaczynski, K. (2005). Diffusional kurtosis imaging: The quantification of non‐Gaussian water diffusion by means of magnetic resonance imaging. Magnetic Resonance in Medicine, 53, 1432–1440. [DOI] [PubMed] [Google Scholar]
- Jones, D. K., & Cercignani, M. (2010). Twenty‐five pitfalls in the analysis of diffusion MRI data. NMR in Biomedicine, 23, 803–820. [DOI] [PubMed] [Google Scholar]
- Kaden, E., Kelm, N. D., Carson, R. P., Does, M. D., & Alexander, D. C. (2016). Multi‐compartment microscopic diffusion imaging. NeuroImage, 139, 346–359. [DOI] [PMC free article] [PubMed] [Google Scholar]
- Kaden, E., Kruggel, F., & Alexander, D. C. (2016). Quantitative mapping of the per‐axon diffusion coefficients in brain white matter. Magnetic Resonance in Medicine, 75, 1752–1763. [DOI] [PMC free article] [PubMed] [Google Scholar]
- Kalakh, S., & Mouihate, A. (2019). Enhanced remyelination during late pregnancy: Involvement of the gabaergic system. Scientific Reports, 9, 1–16. [DOI] [PMC free article] [PubMed] [Google Scholar]
- Kantarci, K., Tosakulwong, N., Lesnick, T. G., Zuk, S. M., Gunter, J. L., Gleason, C. E., … Miller, V. M. (2016). Effects of hormone therapy on brain structure: A randomized controlled trial. Neurology, 87, 887–896. [DOI] [PMC free article] [PubMed] [Google Scholar]
- Kaufmann, T., van der Meer, D., Doan, N. T., Schwarz, E., Lund, M. J., Agartz, I., … Westlye, L. T. (2019). Common brain disorders are associated with heritable patterns of apparent aging of the brain. Nature Neuroscience, 22, 1617–1623. [DOI] [PMC free article] [PubMed] [Google Scholar]
- Kellner, E., Dhital, B., Kiselev, V. G., & Reisert, M. (2016). Gibbs‐ringing artifact removal based on local subvoxel‐shifts. Magnetic Resonance in Medicine, 76, 1574–1581. [DOI] [PubMed] [Google Scholar]
- Kelm, N. D., West, K. L., Carson, R. P., Gochberg, D. F., Ess, K. C., & Does, M. D. (2016). Evaluation of diffusion kurtosis imaging in ex vivo hypomyelinated mouse brains. NeuroImage, 124, 612–626. [DOI] [PMC free article] [PubMed] [Google Scholar]
- Keyes, K. M., & Westreich, D. (2019). UK Biobank, big data, and the consequences of non‐representativeness. The Lancet, 393, 1297. [DOI] [PMC free article] [PubMed] [Google Scholar]
- Kim, P., Dufford, A. J., & Tribble, R. C. (2018). Cortical thickness variation of the maternal brain in the first 6 months postpartum: Associations with parental self‐efficacy. Brain Structure and Function, 223, 3267–3277. [DOI] [PMC free article] [PubMed] [Google Scholar]
- Kim, P., Leckman, J. F., Mayes, L. C., Feldman, R., Wang, X., & Swain, J. E. (2010). The plasticity of human maternal brain: Longitudinal changes in brain anatomy during the early postpartum period. Behavioral Neuroscience, 124, 695–700. [DOI] [PMC free article] [PubMed] [Google Scholar]
- Krogsrud, S. K., Fjell, A. M., Tamnes, C. K., Grydeland, H., Mork, L., Due‐Tønnessen, P., … Walhovd, K. B. (2016). Changes in white matter microstructure in the developing brain—A longitudinal diffusion tensor imaging study of children from 4 to 11 years of age. NeuroImage, 124, 473–486. [DOI] [PMC free article] [PubMed] [Google Scholar]
- Laisk, T., Soares, A. L. G., Ferreira, T., Painter, J. N., Censin, J. C., Laber, S., … Lindgren, C. M. (2020). The genetic architecture of sporadic and multiple consecutive miscarriage. Nature Communications, 11, 1–12. [DOI] [PMC free article] [PubMed] [Google Scholar]
- Langer‐Gould, A., Huang, S. M., Gupta, R., Leimpeter, A. D., Greenwood, E., Albers, K. B., … Nelson, L. M. (2009). Exclusive breastfeeding and the risk of postpartum relapses in women with multiple sclerosis. Archives of Neurology, 66, 958–963. [DOI] [PMC free article] [PubMed] [Google Scholar]
- Le, T. T., Kuplicki, R. T., McKinney, B. A., Yeh, H.‐W., Thompson, W. K., Paulus, M. P., & Tulsa 1000 Investigators . (2018). A nonlinear simulation framework supports adjusting for age when analyzing brainage. Frontiers in Aging Neuroscience, 10, 317. [DOI] [PMC free article] [PubMed] [Google Scholar]
- Lisofsky, N., Gallinat, J., Lindenberger, U., & Kühn, S. (2019). Postpartal neural plasticity of the maternal brain: Early renormalization of pregnancy‐related decreases? Neurosignals, 27, 12–24. [DOI] [PubMed] [Google Scholar]
- Lisofsky, N., Wiener, J., de Condappa, O., Gallinat, J., Lindenberger, U., & Kühn, S. (2016). Differences in navigation performance and postpartal striatal volume associated with pregnancy in humans. Neurobiology of Learning and Memory, 134, 400–407. [DOI] [PubMed] [Google Scholar]
- Liu, G., Yan, Y., Shi, B., Huang, J., Mu, H., Li, C., … Zhu, Z. (2020). Benefits of progesterone on brain immaturity and white matter injury induced by chronic hypoxia in neonatal rats. The Journal of Thoracic and Cardiovascular Surgery, 160, e55–e66. [DOI] [PubMed] [Google Scholar]
- Luders, E., Kurth, F., Gingnell, M., Engman, J., Yong, E.‐L., Poromaa, I. S., & Gaser, C. (2020). From baby brain to mommy brain: Widespread gray matter gain after giving birth. Cortex, 126, 334–342. [DOI] [PubMed] [Google Scholar]
- Manly, J., Merchant, C., Jacobs, D., Small, S., Bell, K., Ferin, M., & Mayeux, R. (2000). Endogenous estrogen levels and Alzheimer's disease among postmenopausal women. Neurology, 54, 833–837. [DOI] [PubMed] [Google Scholar]
- Maximov, I. I., Alnaes, D., & Westlye, L. T. (2019). Towards an optimised processing pipeline for diffusion magnetic resonance imaging data: Effects of artefact corrections on diffusion metrics and their age associations in UK Biobank. Human Brain Mapping, 40, 4146–4162. [DOI] [PMC free article] [PubMed] [Google Scholar]
- Maximov, I. I., van der Meer, D., de Lange, A.‐M., Kaufmann, T., Shadrin, A., Frei, O., … Westlye, L. T. (2021). Fast quality control method for derived diffusion metrics (YTTRIUM) in big data analysis: UK Biobank 18608 example. Human Brain Mapping. 10.1002/hbm.25424 [DOI] [PMC free article] [PubMed] [Google Scholar]
- Miller, K. L., Alfaro‐Almagro, F., Bangerter, N. K., Thomas, D. L., Yacoub, E., Xu, J., … Smith, S. M. (2016). Multimodal population brain imaging in the UK Biobank prospective epidemiological study. Nature Neuroscience, 19, 1523–1536. [DOI] [PMC free article] [PubMed] [Google Scholar]
- Mori, S., Wakana, S., van Zijl, P. C., & Nagae‐Poetscher, L. (2005). MRI atlas of human white matter. Amsterdam, The Netherlands: Elsevier. [Google Scholar]
- Natri, H., Garcia, A. R., Buetow, K. H., Trumble, B. C., & Wilson, M. A. (2019). The pregnancy pickle: Evolved immune compensation due to pregnancy underlies sex differences in human diseases. Trends in Genetics, 35, 478–488. [DOI] [PMC free article] [PubMed] [Google Scholar]
- Nichols, E., Szoeke, C. E., Vollset, S. E., Abbasi, N., Abd‐Allah, F., Abdela, J., et al. (2019). Global, regional, and national burden of Alzheimer's disease and other dementias, 1990–2016: A systematic analysis for the global burden of disease study 2016. The Lancet Neurology, 18, 88–106. [DOI] [PMC free article] [PubMed] [Google Scholar]
- Ning, K., Zhao, L., Franklin, M., Matloff, W., Batta, I., Arzouni, N., … Toga, A. W. (2020). Parity is associated with cognitive function and brain age in both females and males. Scientific Reports, 10, 1–9. [DOI] [PMC free article] [PubMed] [Google Scholar]
- Novikov, D. S., Kiselev, V. G., & Jespersen, S. N. (2018). On modeling. Magnetic Resonance in Medicine, 79, 3172–3193. [DOI] [PMC free article] [PubMed] [Google Scholar]
- Oatridge, A., Holdcroft, A., Saeed, N., Hajnal, J. V., Puri, B. K., Fusi, L., & Bydder, G. M. (2002). Change in brain size during and after pregnancy: Study in healthy women and women with preeclampsia. American Journal of Neuroradiology, 23, 19–26. [PMC free article] [PubMed] [Google Scholar]
- Orchard, E. R., Ward, P. G., Sforazzini, F., Storey, E., Egan, G. F., & Jamadar, S. D. (2020). Relationship between parenthood and cortical thickness in late adulthood. Plos One, 15(7), e0236031. 10.1371/journal.pone.0236031. [DOI] [PMC free article] [PubMed] [Google Scholar]
- Paulus, M. P., & Thompson, W. K. (2019). The challenges and opportunities of small effects: The new normal in academic psychiatry. JAMA Psychiatry, 76, 353–354. [DOI] [PubMed] [Google Scholar]
- Paus, T. (2010). Growth of white matter in the adolescent brain: Myelin or axon? Brain and Cognition, 72, 26–35. [DOI] [PubMed] [Google Scholar]
- Pawluski, J. L., Lambert, K. G., & Kinsley, C. H. (2016). Neuroplasticity in the maternal hippocampus: Relation to cognition and effects of repeated stress. Hormones and Behavior, 77, 86–97. [DOI] [PubMed] [Google Scholar]
- Pfeilschifter, J., Kditz, R., Pfohl, M., & Schatz, H. (2002). Changes in proinflammatory cytokine activity after menopause. Endocrine Reviews, 23, 90–119. [DOI] [PubMed] [Google Scholar]
- Resnick, S. M., Espeland, M. A., Jaramillo, S. A., Hirsch, C., Stefanick, M. L., Murray, A. M., … For the Women's Health Initiative Memory Study . (2009). Postmenopausal hormone therapy and regional brain volumes: The WHIMS‐MRI study. Neurology, 72, 135–142. [DOI] [PMC free article] [PubMed] [Google Scholar]
- Richard, G., Kolskår, K., Sanders, A.‐M., Kaufmann, T., Petersen, A., Doan, N. T., … Westlye, L. T. (2018). Assessing distinct patterns of cognitive aging using tissue‐specific brain age prediction based on diffusion tensor imaging and brain morphometry. PeerJ, 6, e5908. [DOI] [PMC free article] [PubMed] [Google Scholar]
- Rokicki, J., Wolfers, T., Nordhøy, W., Tesli, N., Quintana, D. S., Alnæs, D., … Westlye, L. T. (2020). Multimodal imaging improves brain age prediction and reveals distinct abnormalities in patients with psychiatric and neurological disorders. Human Brain Mapping, 42(6), 1714–1726. [DOI] [PMC free article] [PubMed] [Google Scholar]
- Rosen, A. F., Roalf, D. R., Ruparel, K., Blake, J., Seelaus, K., Villa, L. P., … Satterthwaite, T. D. (2018). Quantitative assessment of structural image quality. NeuroImage, 169, 407–418. [DOI] [PMC free article] [PubMed] [Google Scholar]
- Schock, H., Zeleniuch‐Jacquotte, A., Lundin, E., Grankvist, K., Lakso, H.‐Å., Idahl, A., … Fortner, R. T. (2016). Hormone concentrations throughout uncomplicated pregnancies: A longitudinal study. BMC Pregnancy and Childbirth, 16, 146. [DOI] [PMC free article] [PubMed] [Google Scholar]
- Smith, S. M., Elliott, L. T., Alfaro‐Almagro, F., McCarthy, P., Nichols, T. E., Douaud, G., & Miller, K. L. (2020). Brain aging comprises multiple modes of structural and functional change with distinct genetic and biophysical associations. eLife, 9, e52677. [DOI] [PMC free article] [PubMed] [Google Scholar]
- Smith, S. M., Jenkinson, M., Johansen‐Berg, H., Rueckert, D., Nichols, T. E., Mackay, C. E., … Behrens, T. E. (2006). Tract‐based spatial statistics: Voxelwise analysis of multi‐subject diffusion data. NeuroImage, 31, 1487–1505. [DOI] [PubMed] [Google Scholar]
- Smith, S. M., Jenkinson, M., Woolrich, M. W., Beckmann, C. F., Behrens, T. E., Johansen‐Berg, H., … Matthews, P. M. (2004). Advances in functional and structural MR image analysis and implementation as FSL. NeuroImage, 23, S208–S219. [DOI] [PubMed] [Google Scholar]
- Storsve, A. B., Fjell, A. M., Yendiki, A., & Walhovd, K. B. (2016). Longitudinal changes in white matter tract integrity across the adult lifespan and its relation to cortical thinning. PLoS One, 11, e0156770. [DOI] [PMC free article] [PubMed] [Google Scholar]
- Takao, H., Hayashi, N., & Ohtomo, K. (2011). Effect of scanner in longitudinal studies of brain volume changes. Journal of Magnetic Resonance Imaging, 34, 438–444. [DOI] [PubMed] [Google Scholar]
- Tamnes, C. K., Roalf, D. R., Goddings, A.‐L., & Lebel, C. (2018). Diffusion MRI of white matter microstructure development in childhood and adolescence: Methods, challenges and progress. Developmental Cognitive Neuroscience, 33, 161–175. [DOI] [PMC free article] [PubMed] [Google Scholar]
- Taylor, C., Pritschet, L., Yu, S., & Jacobs, E. G. (2019). Applying a women's health lens to the study of the aging brain. Frontiers in Human Neuroscience, 13, 224. [DOI] [PMC free article] [PubMed] [Google Scholar]
- Tønnesen, S., Kaufmann, T., de Lange, A.‐M., Richard, G., Doan, N. T., Alnaes, D., … Westlye, L. T. (2020). Brain age prediction reveals aberrant brain white matter in schizophrenia and bipolar disorder: A multi‐sample diffusion tensor imaging study. Biological Psychiatry: Cognitive Neuroscience and Neuroimaging, 5(12), 1095–1103. [DOI] [PubMed] [Google Scholar]
- Tutuncu, M., Tang, J., Zeid, N. A., Kale, N., Crusan, D. J., Atkinson, E. J., … Kantarci, O. H. (2013). Onset of progressive phase is an age‐dependent clinical milestone in multiple sclerosis. Multiple Sclerosis Journal, 19, 188–198. [DOI] [PMC free article] [PubMed] [Google Scholar]
- Veraart, J., Fieremans, E., & Novikov, D. S. (2016). Diffusion MRI noise mapping using random matrix theory. Magnetic Resonance in Medicine, 76, 1582–1593. [DOI] [PMC free article] [PubMed] [Google Scholar]
- Veraart, J., Novikov, D. S., Christiaens, D., Ades‐Aron, B., Sijbers, J., & Fieremans, E. (2016). Denoising of diffusion MRI using random matrix theory. NeuroImage, 142, 394–406. [DOI] [PMC free article] [PubMed] [Google Scholar]
- Veraart, J., Sijbers, J., Sunaert, S., Leemans, A., & Jeurissen, B. (2013). Weighted linear least squares estimation of diffusion MRI parameters: Strengths, limitations, and pitfalls. NeuroImage, 81, 335–346. [DOI] [PubMed] [Google Scholar]
- Voevodskaya, O., Simmons, A., Nordenskjöld, R., Kullberg, J., Ahlström, H., Lind, L., … Alzheimer's Disease Neuroimaging Initiative . (2014). The effects of intracranial volume adjustment approaches on multiple regional MRI volumes in healthy aging and Alzheimer's disease. Frontiers in Aging Neuroscience, 6, 264. [DOI] [PMC free article] [PubMed] [Google Scholar]
- Voskuhl, R. (2003). Hormone‐based therapies in MS. International MS Journal, 10, 60–66. [PubMed] [Google Scholar]
- Westlye, L. T., Walhovd, K. B., Dale, A. M., Bjørnerud, A., Due‐Tønnessen, P., Engvig, A., … Fjell, A. M. (2010). Life‐span changes of the human brain white matter: Diffusion tensor imaging (DTI) and volumetry. Cerebral Cortex, 20, 2055–2068. [DOI] [PubMed] [Google Scholar]
- Wilks, S. S. (1938). The large‐sample distribution of the likelihood ratio for testing composite hypotheses. The Annals of Mathematical Statistics, 9, 60–62. [Google Scholar]
- Yaffe, K., Haan, M., Byers, A., Tangen, C., & Kuller, L. (2000). Estrogen use, apoe, and cognitive decline: Evidence of gene–environment interaction. Neurology, 54, 1949–1954. [DOI] [PubMed] [Google Scholar]
- Zhang, K., Wang, M., Zhang, J., Du, X., & Chen, Z. (2019). Brain structural plasticity associated with maternal caregiving in mothers: A voxel‐and surface‐based morphometry study. Neurodegenerative Diseases, 19, 192–203. [DOI] [PubMed] [Google Scholar]
- Zhou, Z., Tong, Q., Zhang, L., Ding, Q., Lu, H., Jonkman, L. E., … Zhong, J. (2020). Evaluation of the diffusion mri white matter tract integrity model using myelin histology and Monte‐Carlo simulations. NeuroImage, 223, 117313. [DOI] [PubMed] [Google Scholar]
- Zimmerman, D. W. (2012). Correcting two‐sample “z” and “t” tests for correlation: An alternative to one‐sample tests on difference scores. Psicologica: International Journal of Methodology and Experimental Psychology, 33, 391–418. [Google Scholar]
Associated Data
This section collects any data citations, data availability statements, or supplementary materials included in this article.
Supplementary Materials
Appendix S1: Supplementary Information
Data Availability Statement
The data that support the findings of this study are available through the UK Biobank data access procedures (https://www.ukbiobank.ac.uk/researchers).