Abstract
Human brain atlases are essential for research and surgical treatment of Parkinson's disease (PD). For example, deep brain stimulation for PD often requires human brain atlases for brain structure identification. However, few atlases can provide disease‐specific subcortical structures for PD, and most of them are based on T1w and T2w images. In this work, we construct a HybraPD atlas using fused quantitative susceptibility mapping (QSM) and T1w images from 87 patients with PD. The constructed HybraPD atlas provides a series of templates, that is, T1w, GRE magnitude, QSM, R2*, and brain tissue probabilistic maps. Then, we manually delineate a parcellation map with 12 bilateral subcortical nuclei, which are highly related to PD pathology, such as sub‐regions in globus pallidus and substantia nigra. Furthermore, we build a whole‐brain parcellation map by combining existing cortical parcellation and white‐matter segmentation with the proposed subcortical nuclei map. Considering the multimodality of the HybraPD atlas, the segmentation accuracy of each nucleus is evaluated using T1w and QSM templates, respectively. The results show that the HybraPD atlas provides more accurate segmentation than existing atlases. Moreover, we analyze the metabolic difference in subcortical nuclei between PD patients and healthy control subjects by applying the HybraPD atlas to calculate uptake values of contrast agents on positron emission tomography (PET) images. The atlas‐based analysis generates accurate disease‐related brain nuclei segmentation on PET images. The newly developed HybraPD atlas could serve as an efficient template to study brain pathological alterations in subcortical regions for PD research.
Keywords: brain, globus pallidus, magnetic resonance imaging, neuroimaging, Parkinson's disease, substantia nigra
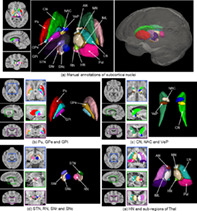
We construct a HybraPD atlas using fused quantitative susceptibility mapping (QSM) and T1w images from 87 patients with PD. Based on the proposed templates, we manually delineate a parcellation map with 12 bilateral subcortical nuclei, which are highly related to PD pathology, such as globus pallidus (GP) and substantia nigra (SN). We also analyze the metabolic difference in subcortical nuclei between PD patients and healthy control subjects by applying the HybraPD atlas to calculate uptake values of contrast agents on PET images.
1. INTRODUCTION
Parkinson's disease (PD) is one of the most common age‐related degenerative movement disorders that is characterized by the loss of dopaminergic cells in the substantia nigra (Hindle, 2010; McGeer & McGeer, 2004; Ofori et al., 2015). The mechanisms leading to neuronal population degeneration remain unclear, one potential factor is the oxidative stress due to excessive iron accumulation in the aging brain (Acosta‐Cabronero et al., 2017; Barbosa et al., 2015; Langkammer et al., 2016). Iron overload causes oxidative stress‐mediated cell death by altering the valence state between ferrous (Fe2+) and ferric (Fe3+) (Barnham, Masters, & Bush, 2004). Previous studies have demonstrated the theoretical impact of iron on the aggregation of alpha‐synuclein (Bardinet et al., 2009; He et al., 2011; Li, Jiang, Song, & Xie, 2010) and the induction of Lewy body deposition in PD (Castellani, Siedlak, Perry, & Smith, 2000). These are thought to occur early in the brainstem, gradually spreading across vulnerable sites in the allocortex and temporal paralimbic cortex before reaching the prefrontal and sensory‐association isocortex (Braak, Ghebremedhin, Rüb, Bratzke, & Del Tredici, 2004). It is postulated that projection neurons with disproportionally long, thin, and poorly myelinated axons are particularly susceptible to degeneration in PD (Braak et al., 2004), of which the most studied to date have been the neuromelanin‐pigmented dopaminergic neurons of the basal ganglia.
Magnetic resonance imaging (MRI)‐based estimation of brain iron deposition in vivo is particularly important for early PD patients due to the ubiquitous involvement of iron accumulation in the dopaminergic neuron degeneration process. Gradient‐echo (GRE) imaging approaches, for example, T2*‐weighted (T2*w) magnitude, phase, R2*, susceptibility‐weighted image (SWI), quantitative susceptibility mapping (QSM), have been used to characterize magnetic susceptibility changes that are caused by iron overload in PD at different disease stages (Du et al., 2011; Kosta, Argyropoulou, Markoula, & Konitsiotis, 2006; Lewis et al., 2013; Martin, Wieler, & Gee, 2008; Wallis et al., 2008). Meanwhile, diffusion‐based MR imaging techniques (e.g., diffusion tensor imaging, diffusion kurtosis imaging, neurite orientation dispersion and density imaging, etc.) have been widely studied to examine the nigrostriatal degeneration in PD (Kamagata, Hatano, & Aoki, 2016; Nilsson, Szczepankiewicz, van Westen, & Hansson, 2015; Zheng et al., 2014). Diffusion‐based imaging is sensitive to the diffusion of water molecules within neural tissue (Basser, Mattiello, & LeBihan, 1994). Alternations in the scalar measurements of diffusion (e.g., fractional anisotropy and mean diffusivity) acted as imaging markers for PD‐related white matter (WM) microstructure variations and were linked to cognitive impairments involved in PD (Péran et al., 2010). In advanced PD, severe degeneration of dopaminergic neurons leads to tissue atrophy in substantia nigra and thus further yields morphological changes in structural MR image modality such as T1‐weighted (T1w) (Schwarz et al., 2011). Volume estimation techniques such as voxel‐based‐morphometry (VBM) were used to identify pathological differences in gray matter (GM) volume in PD compared with healthy controls (Feldmann et al., 2008). Therefore, it is helpful to involve multimodality MRI techniques for revealing the intrinsic pathological changes in PD.
Human brain atlases are essential for the research of PD and provide disease‐specific information for interventional therapy purposes, for example, guiding deep brain stimulation (DBS) (Chen, Sha, Ma, He, & Feng, 2018; Deuschl et al., 2006; Follett et al., 2010) by serving as references to identify target structures. Most existing atlases are constructed based on T1w and T2w. For example, the commonly used MNI space plays a vital role in neuroscience and provides a series of atlases. The MNI152 linear atlas is the standard anatomy chosen by the International Consortium of Brain Mapping (ICBM). The MNI152 nonlinear sixth generation atlas and the original Collin27 atlas only provide T1w templates (Grabner et al., 2006; Holmes et al., 1998; Mazziotta et al., 2001). For example, in the more recent versions, the MNI152 nonlinear 2009 atlas and the Collin27 high‐resolution 2008 atlas include T1w, T2w, and proton density‐weighted templates (Aubert‐Broche, Evans, & Collins, 2006; Fonov et al., 2011). However, it is challenging to differentiate the subtle tissue contrast changes between deep gray matters and their surroundings on T1w images. Thus, the existing T1w atlases based on a healthy population may not provide accurate structural information of PD in subcortical regions due to the lack of image contrast in the corresponding regions.
There have been several atlases constructed with specific emphasis on the localization of human brain subcortical nuclei. For example, the DBS intrinsic template atlas (DISTAL atlas) provides subcortical anatomy on the MNI152 nonlinear 2009b templates (Ewert et al., 2018). The California Institute of Technology (CIT168) atlas provides probabilistic anatomical subcortical nuclei labels using reinforcement learning (Pauli, Nili, & Tyszka, 2018). In the CerebrA atlas, the authors manually corrected the sub‐cortical labels to complete the labeling adaption for the MNI152 nonlinear 2009c templates (Manera, Dadar, Fonov, & Collins, 2020). However, these atlases are all based on T1w or T2w images of healthy junior subjects. The DISTAL atlas (MNI152 nonlinear 2009b) and the CerebrA atlas (MNI152 nonlinear 2009c) are derived from the average anatomy of the age range 4.5–18.5 years, while the CIT168 atlas uses structural images from 168 healthy adults between 22 and 35 years old. The age distribution of these atlases does not match the typical range of PD patients (>50 years old) (Dorsey et al., 2018).
QSM is a relatively new MRI technique based on the GRE MRI phase signal. For elder population, especially for PD patients, iron accumulation evolves with aging in the dopaminergic system (Chen et al., 2019). QSM measures the spatial distribution of magnetic susceptibility, which is mainly affected by neuronal myelination (diamagnetic) and iron content (paramagnetic) in human brain (Lotfipour et al., 2012). QSM provides superior image contrast between iron‐rich subcortical nuclei and surroundings (Cobzas et al., 2015; Li et al., 2016; Sun et al., 2015). A longitudinal age‐dependent QSM atlas, namely Zhang atlas in this article, has provided an efficient tool for segmenting brain subcortical structures. However, the atlas is constructed based on healthy subjects of age 1–83 years old (Zhang et al., 2018). It has been commonly recognized that PD pathological neuronal loss in iron‐rich nuclei greatly affected QSM contrast. Thus, QSM atlas built from healthy subjects might not be proper for the accurate localization of PD‐related subcortical regions. Xiao et al. (2015) proposed to perform multi‐modality MR contrasts including T1w, T2*w, T1–T2* fusion, phase and R2* maps for templates generation, and constructed MNI PD25 atlas based on scans of 25 PD patients to guide segmentation of subcortical nuclei (Xiao et al., 2017). The authors fused T1w and T2*w images to enhance the tissue contrast in subcortical nuclei in the generated hybrid image. Comparing with T1w image, relatively clear image contrast in subcortical nuclei has been demonstrated in T2*w images. Both T2* and QSM are affected by variations in magnetic susceptibility of the brain tissue. T2* decreases proportionally to the concentration of both iron and myelin (Langkammer et al., 2010). However, iron and myelin have opposing effects on the magnetic susceptibility maps, as iron is paramagnetic and myelin lipids are relatively diamagnetic (Deistung et al., 2013; Li et al., 2019). QSM therefore provides better image contrast between iron‐rich brain nuclei and surrounding white matter fiber bundles than T2* images. Inspired by the image fusion idea in (Xiao et al., 2017), rather than using a single imaging modality, the fusion of multimodalities can involve complementary information from different imaging techniques to investigate brain functional, structural, or anatomical properties (Qi et al., 2019). Therefore, in this study, we present a subcortical atlas constructed for PD population based on hybrid multi‐modal images to precisely define the PD‐related subcortical nuclei structural changes.
In this work, we construct a human brain atlas including templates of multiple MRI contrasts, that is, T1w, QSM, GRE magnitude, R2*, and tissue probability maps (WM; GM; CSF, cerebrospinal fluid). We construct a hybrid template using fused QSM and T1w images from 87 subjects with PD, and generate multi‐modality templates by applying the same deformation fields on different image modalities. In the proposed atlas space, we manually segment 12 bilateral subcortical structures and build a whole‐brain parcellation map by combining with existing cortical gray and white matter atlases. To access the feasibility, we segment 15 individual subjects with PD using several proposed atlases and then calculate quantitative parameters by comparing segmentation results with ground truth manual annotations. The results show that our HybraPD atlas provides more accurate segmentation than other comparison atlases. By applying the proposed atlas on positron emission tomography (PET) images, we study the metabolic difference in subcortical nuclei between PD patients and healthy control subjects. The atlas‐based analysis enables identifying small subcortical nuclei, which are difficult to be manually annotated in PET images due to the limited spatial resolution. It is envisioned that the newly developed HybraPD atlas may serve as an efficient template for studying brain pathological alterations in subcortical regions for PD.
2. MATERIALS AND METHODS
The summarized workflow of this work is illustrated in Figure 1.
FIGURE 1.
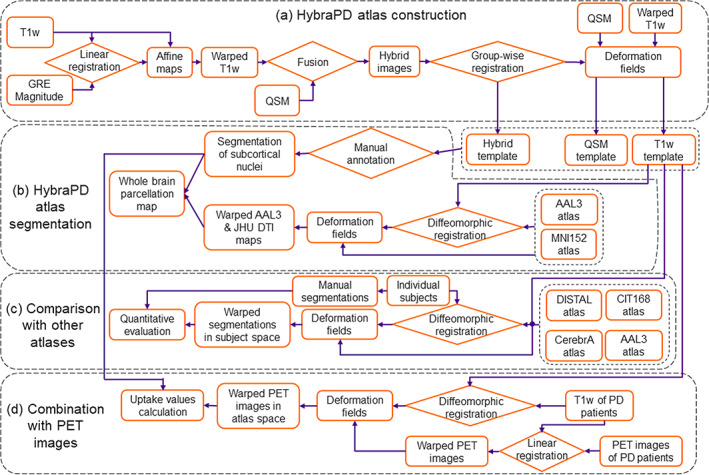
Workflow for the HybraPD atlas construction, subcortical nuclei segmentation and accuracy evaluation, as well as a combined analysis with PET images from PD patients
2.1. Magnetic resonance imaging acquisition and reconstruction
2.1.1. Data acquisition
Magnetic resonance imaging (MRI) scans of 87 subjects with PD (56.9 ± 10.0 years old, 48 female, 39 male) were conducted on a 3.0‐Tesla MR system (GE 750 Medical Systems, Milwaukee, Wisconsin). For each participant, foam padding was applied to prevent head movement, and earplugs were provided to reduce scanner noise. Structural T1w images were acquired using a fast‐spoiled gradient recalled sequence: repetition time (TR) = 7.336 ms; echo time (TE) = 3.036 ms; flip angle = 11°; field of view (FOV) = 260 × 260 mm2; matrix size = 256 × 256; slice thickness = 1.2 mm; 196 continuous sagittal slices. A three‐dimensional multi‐echo GRE sequence was utilized to obtain T2*w images with following parameters: TR/TE1/TE spacing = 33.7/4.56/3.65 ms, number of echoes = 8, flip angle = 20°, FOV = 240 × 240 mm2, matrix size = ;416 × 384, slice thickness = 2 mm, resolution = 0.47 × 0.47 × 2.0 mm3. All the images were resampled to the same resolution of 1 × 1 × 1 mm3 through operations in k‐space. The raw phase was unwrapped using the Laplacian‐based phase unwrapping, and the normalized background phase was removed by V‐SHARP (Wu, Li, Guidon, & Liu, 2012). The susceptibility maps were determined by the STAR‐QSM algorithm (Wei et al., 2015). GRE magnitude and R2* were derived from the same MR sequence as QSM. R2* maps were calculated by fitting the signal intensity decay with a mono‐exponential model using the following expression:
| (1) |
where, is the signal intensity at time , is the initial signal intensity, TE is echo time and is the offset.
2.1.2. Data for segmentation accuracy evaluation
The 15 individual subjects with PD (58.1 ± 6.0 years old, 8 female, 7 male) for validation were obtained on a 3.0‐Tesla MRI scanner (GE 750 Medical Systems, Milwaukee, Wisconsin). T1w images were acquired using the following parameters: TR = 2,300 ms; TE = 1.95 ms; flip angle = 9°; FOV = 256 × 256 mm2; matrix size = 256 × 256; slice thickness = 1 mm; 152 continuous sagittal slices. QSM was performed using 3D multiecho GRE sequence: TR/TE1/TE spacing = 41.6/3.2/2.2 ms, number of echoes = 16, flip angle = 12°, FOV = 256 × 256 mm2, matrix size = 256 × 256, slice thickness = 1 mm. The susceptibility maps were calculated by the STAR‐QSM algorithm (Wei et al., 2015).
2.1.3. PET data for metabolic analysis
Thirty subjects (63.6 ± 4.2 years old) with 15 PD patients (64.2 ± 4.5 years old, 7 female, 8 male) and 15 health controls (62.9 ± 3.8 years old, 6 female, 9 male) were scanned both on MRI and PET scanners. MRI data were collected on the same 3.0 T GE 750 Medical Systems and PET images were acquired using a Siemens Biograph 64 PET/CT scanner (Siemens, Munich, Germany) in 3D mode. A CT transmission scan was first performed for attenuation correction. For dopaminergic imaging, the distribution of dopamine transporter was measured 60 min after the intravenous injection of 370 MBq of 11C‐CFT and lasted for 15 min. The image volume consisted of 148 axial images, with a matrix size of 168 × 168 covering a FOV of 342 × 342 mm2.
2.2. HybraPD atlas construction
The skull was removed from the T1w images using FSL BET (Smith et al., 2004). As illustrated in Figure 2, the T1w images were then normalized to the intensity range [0, 255] and co‐registered to the magnitude images using FSL FLIRT (Smith et al., 2004). The hybrid images were calculated by fusing QSM and warped T1w images depending on the formula:
| (2) |
where, is a scalar coefficient (Zhang et al., 2018).
FIGURE 2.
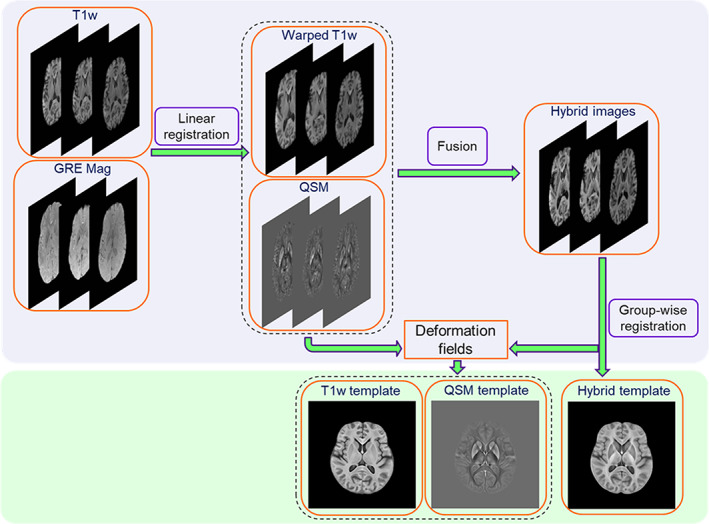
HybraPD atlas construction including generations of the Hybrid template, the T1w template, and the QSM template
The hybrid brain template was generated from all the hybrid images based on the symmetric group‐wise normalization (SyGN) method achieved by advanced normalization tools (ANTs) (Avants et al., 2010). The SyGN algorithm optimized the template appearance and template shape iteratively to guarantee a fully unbiased result. The detailed construction framework of the SyGN algorithm is described in the Appendix. It was performed on individual hybrid images and generated the hybrid standard template space. The deformation fields during the template generation were then applied to the original QSM, R2* and normalized T1w images, respectively, to obtain the multiple templates in the proposed HybraPD atlas space (shown as Figure 2). Thus, brain tissue probabilistic maps based on the segmentation on T1w images were in the same space. Detailed generation processes for these contrasts are illustrated in Figure 2.
Besides, we calculated the contrast‐to‐noise ratio (CNR) to quantify the benefits of using different modalities to generate the templates. Because the intensity values were totally zero at the region outside of brain tissue in all the multi‐modality templates, there was no strict sense of background to calculate the standard deviation of noise for the CNR. Therefore, we used the definition introduced in (Bechara et al., 2012),
| (3) |
where, , , , and are the average intensity values and standard deviations of two region of interests (ROI). In this work, and were calculated from different subcortical nuclei, and were from the white matter segmented by the JHU DTI‐based atlas (Mori, Wakana, Van Zijl, & Nagae‐Poetscher, 2005).
2.3. HybraPD atlas segmentation
In this section, we manually segmented 12 subcortical nuclei based on the constructed templates and then generated a whole‐brain parcellation map by fusing with two reported cortical gray and white matter atlases.
2.3.1. Subcortical nuclei segmentation
Three experienced radiologists independently delineated all the 12 subcortical nuclei using ITK‐SNAP 3.8.0 (Yushkevich et al., 2006) based on the generated hybrid, QSM and T1w templates. These subcortical nuclei included: putamen (Pu), caudate nucleus (CN), nucleus accumbens (NAC), ventral pallidum (VeP), internal and external globus pallidus (GPi and GPe), pars reticulata and pars compacta of substantia nigra (SNr and SNc), red nucleus (RN), subthalamic nucleus (STN), habenular nuclei (HN), and thalamus (Thal). The thalamus was further segmented into 5 sub‐regions, that is, anterior nuclei (AN), median nuclei (MN), internal medullary lamina (IML), lateral nuclei (LN), and pulvinar (Pul). Then, the majority voting of three annotations was defined as the subcortical nuclei map for the HybraPD atlas. More details about the manual segmentation are discussed in the next section.
2.3.2. Whole brain parcellation map
The AAL3 atlas (Rolls, Huang, Lin, Feng, & Joliot, 2020) and the MNI152 atlas (Fonov, Evans, McKinstry, Almli, & Collins, 2009) were registered to the HybraPD atlas via T1w templates using symmetric normalization by ANTs (Avants et al., 2010). The deformation fields were applied to the AAL3 parcellation map (Rolls et al., 2020) and the JHU DTI‐based white‐matter atlas (Mori et al., 2005) warping the cortical structures into HybraPD atlas space. It should be noted that the AAL3 parcellation map has given some subcortical structures such as Pu, CN, GP, NAC, SNr, SNc, RN, and 15 sub‐regions of the thalamus (Rolls et al., 2020). However, we removed these subcortical structures from the warped AAL3 parcellation map considering the weak contrast of subcortical nuclei in T1w images, and the specific quantitative analysis was discussed in the following section. Finally, we merged the subcortical nuclei map and the two warped maps to get the whole brain parcellation map (Figure 3).
FIGURE 3.
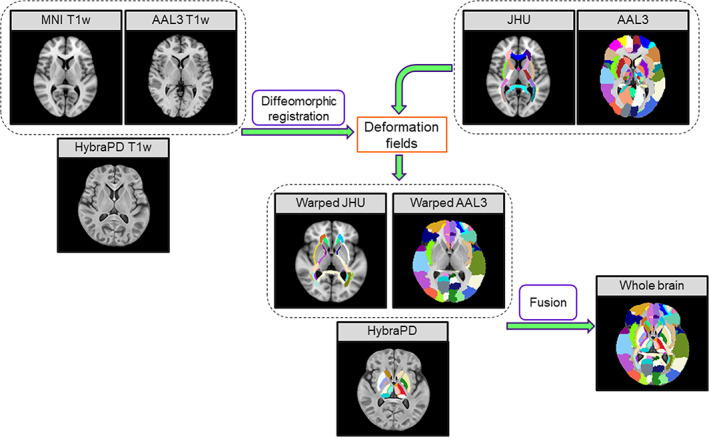
Creation of the whole brain parcellation map using the HybraPD atlas
2.4. Evaluation of subcortical nuclei segmentation
To assess the segmentation accuracy, the same 12 bilateral subcortical structures were manually annotated in individual subjects, and the labeled maps were taken as the ground truth in the validation analysis. Then, the evaluation parameters, such as Kappa coefficient, sensitivity, and average Hausdorff distance (AHD), were calculated between the atlases and the manual segmentation.
2.4.1. Manual segmentation
Three experienced radiologists used ITK‐SNAP 3.8.0 (Yushkevich et al., 2006) to delineate the 12 subcortical nuclei on 15 individual PD subjects. Both the QSM and T1w images of the same subjects were used during the manual segmentation. The QSM images were co‐registered to the T1w space using FSL FLIRT (Smith et al., 2004). The DICE coefficient was chosen to measure intra‐rater and inter‐rater reliability. For intra‐rater reliability, three raters were asked to draw the subcortical segmentation in 15 subjects twice with two‐week intervals. The DICE coefficient was calculated between two segmentations for the same subject by the same rater. To assess inter‐rater reliability, the DICE coefficient was computed between segmentations from three raters in two time‐points respectively, and then calculated the average. Finally, a voxel‐based majority voting of six segmentations for one subject by three raters was defined as the ground truth. A voxel would be annotated if at least two raters gave the same label.
2.4.2. Evaluation of atlases using T1w templates
Based on the symmetric normalization by ANTs (Avants et al., 2010), each subject was co‐registered to the proposed HybraPD atlas and four existing subcortical atlases, including the PD25 atlas (Xiao et al., 2017), the CIT168 atlas (Pauli et al., 2018), the CerebrA atlas (Manera et al., 2020) and the AAL3 atlas (Rolls et al., 2020), using the T1w templates. Then, these atlases were warped to the subject space by applying the inverse deformation fields (Figure 4). Regarding each subcortical structure as a ROI, several quantitative parameters were calculated to evaluate the segmentation reliability, for example, Kappa coefficient, sensitivity, specificity, and DICE coefficient. Also, we calculated the average Hausdorff distance, which was less sensitive to outliers and could provide appropriate similarity assessment for small ROIs considering label location and shape (Pauli et al., 2018). The calculation formulas of these parameters are described in the Appendix.
FIGURE 4.
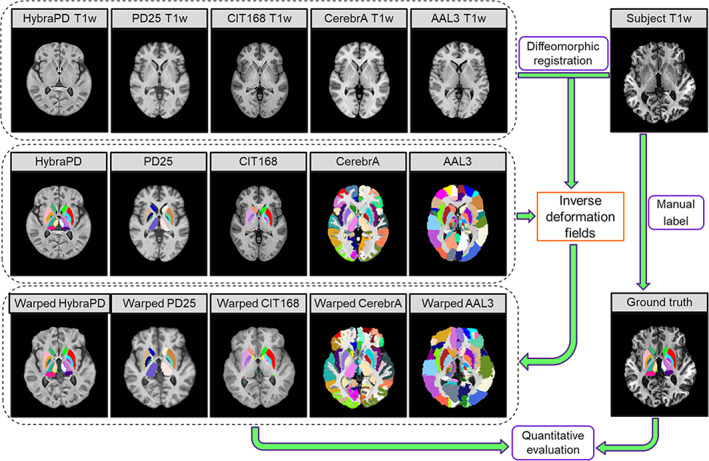
Registration between the subject and atlases using T1w templates for quantitative evaluation of segmentation
Within each subcortical ROI, we calculated the average volume (in mm3) and the average susceptibility (in ppm) from the QSM images. In the parcellation map of the HybraPD atlas, we labeled the subcortical nuclei by the left and right hemispheres. But for the quantitative analysis, this work would just give the results for the whole nuclei instead of two sub‐parts. The average volume of one nucleus was computed by the mean of the left and right hemispheres. We also calculated the regression coefficients (R 2) between the manual segmentation and the parcellation maps from atlases. The p‐values under .05 were considered as significant.
2.4.3. Evaluation of atlases using quantitative susceptibility mapping templates
In this section, we made a comparison between atlases and manual segmentation based on the registration using only QSM templates (Figure 5), performed by the symmetric normalization of ANTs (Avants et al., 2010). Because there were few atlases containing QSM templates, especially for subcortical nuclei, we just compared the HybraPD atlas and the Zhang atlas (Zhang et al., 2018). For the evaluation, we calculated the same quantitative parameters, such as Kappa coefficient, sensitivity, specificity, DICE coefficient, average Hausdorff distance, average volume, and average susceptibility.
FIGURE 5.
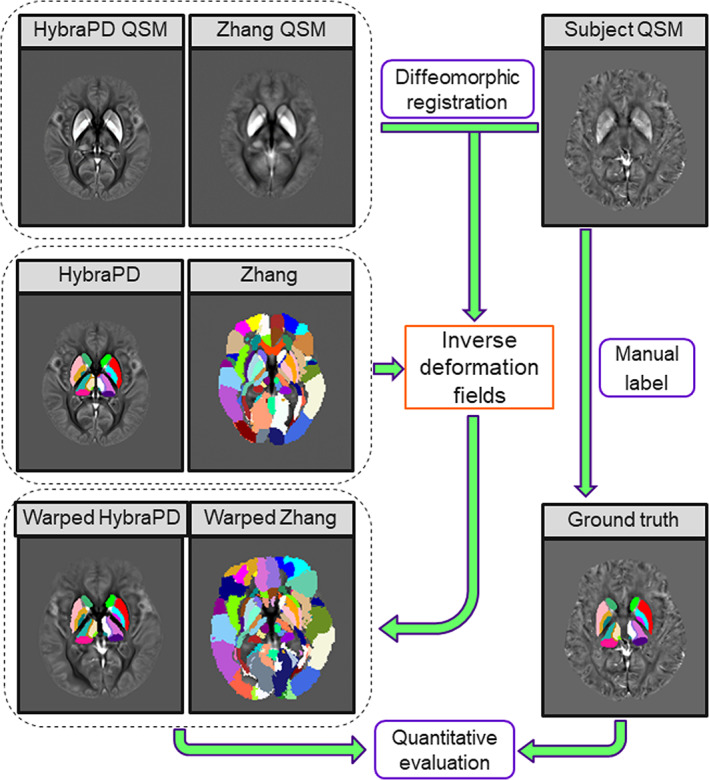
Registration between the subject and atlases using QSM templates for quantitative evaluation of segmentation
2.5. HybraPD atlas validation based on positron emission tomography images
To quantify PD pathological metabolic alterations in subcortical nuclei (Nurmi et al., 2003), the PET images were first co‐registered to the T1w images from the same subject using FSL FLIRT (Smith et al., 2004). Then, the HybraPD atlas labels were warped to the subject space via the T1w template using symmetric normalization by ANTs (Avants et al., 2010) (as shown in Figure 6). Next, we performed a semi‐quantitative analysis by calculating the standardized uptake value ratio (SUVR) of 2β‐carbomethoxy‐3β‐(4‐fluorophenyl) tropane (11C‐CFT) according to the following formula (Bu et al., 2018):
| (4) |
where, UVROI is the average uptake value in each ROI of subcortical nuclei, and UVREF is the average uptake value in a reference region. In this article, the reference region was selected as the superior occipital gyrus from the whole brain parcellation map.
FIGURE 6.
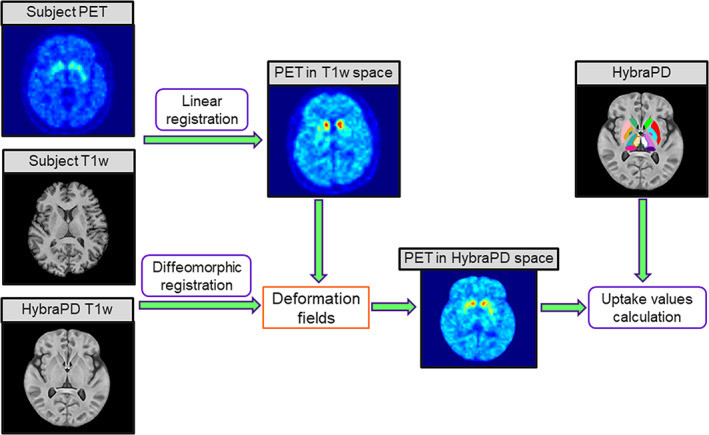
PET images processing based on the HybraPD atlas
The data of 15 PD patients and 15 healthy controls were analyzed. The SUVR was calculated and the mean value of each group was compared using the unpaired t‐test. The p‐values under .05 were considered as significant.
3. RESULTS
In this section, we present the results of the HybraPD atlas construction and tissue segmentation, the evaluation for the subcortical nuclei map and the simple analysis of PET data.
3.1. HybraPD atlas
Figure 7 illustrates the proposed HybraPD atlas, including T1w, QSM, hybrid templates, R2* templates, and brain tissue probabilistic maps. The enlarged views clearly illustrate the fine structure of the subcortical nuclei regions. Both the T1w and the hybrid templates provide a good performance of cortical contrast. Moreover, due to the fusion with QSM images, the hybrid template offers better contrast for the subcortical structures, for example, thalamus in the axial view, and substantia nigra in the sagittal view. Figure 8a shows the manual annotations of subcortical brain nuclei overlaid on the hybrid sections and the 3D rendering shown on the right. All the 12 labeled subcortical structures are displayed in the rendering image. Note that the thalamus is divided into five sub‐regions, so there are 16 labels in the rendering image. Figure 8b–e illustrate the labeled subcortical nuclei in details on sections of three views and give the corresponding screenshots of 3D rendering.
FIGURE 7.
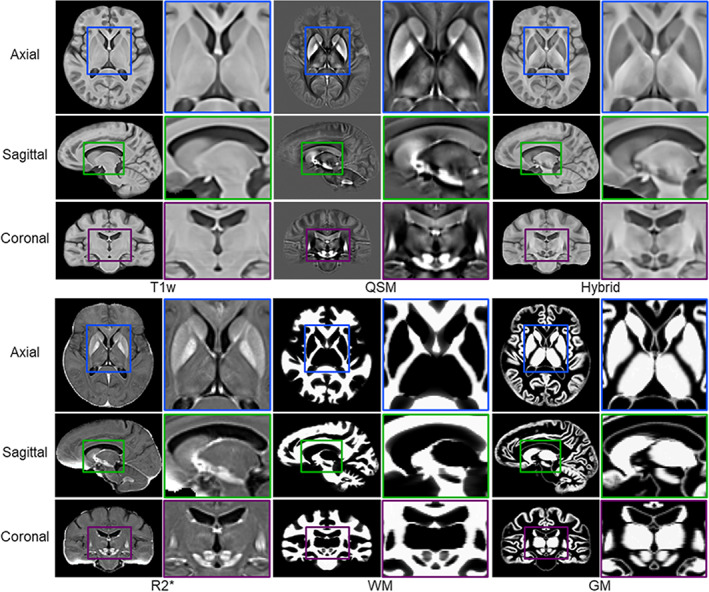
The HybraPD atlas exhibited via T1w, QSM, hybrid, R2* templates, and brain tissue probabilistic maps (WM and GM), with enlarged views to illustrate clear contrast in detail for the subcortical nuclei. The atlases are shown by representative sections in the axial, sagittal, and coronal views
FIGURE 8.
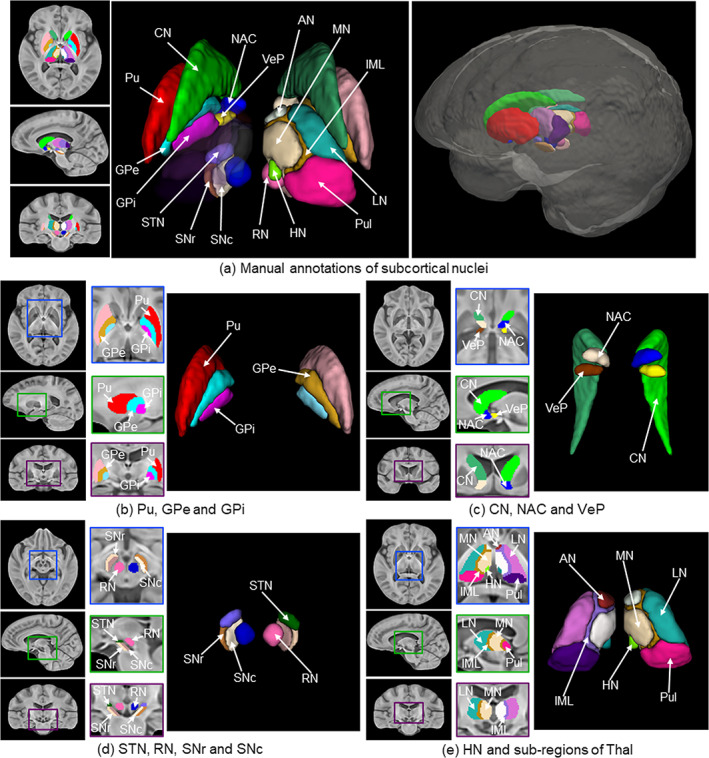
Manual annotations of subcortical brain nuclei. (a) Labeled segmentations overlaid on the sections of the axial, sagittal, and coronal views of the Hybrid template, as well as a 3D rendering of the annotations with the labels of subcortical structures; (b) Labeled Pu, GPe, and GPi on the sections of three views and the 3D rendering; (c) Labeled CN, NAC, and VeP on the sections of three views and the 3D rendering; (d) Labeled STN, RN, SNr and SNc on the sections of three views and the 3D rendering; (e) Labeled HN and five sub‐regions of Thal on the sections of three views and the 3D rendering
Table 1 lists the CNR calculated for the 12 subcortical nuclei from different image modalities (e.g., T1w, QSM, and R2*) in the HybraPD atlas. Depending on the results, the hybrid template provides higher CNR than the T1w template in all the subcortical nuclei. For GPe, GPi, SNr and SNc which are important in the research of PD pathology, the average CNR increased most dramatically from 0.15 in the T1w template to 2.18 in the hybrid template. For STN, HN, and Thal, the improvements on the CNR are limited, because these nuclei are still complicated to annotate despite the fusion of contrasts from QSM and T1w images.
TABLE 1.
Contrast‐to‐noise ratio for subcortical nuclei from different image modalities in the HybraPD atlas
| Name | T1w | QSM | Hybrid | R2* |
|---|---|---|---|---|
| Pu | 1.25 | 1.28 | 1.85 | 1.34 |
| CN | 1.61 | 1.69 | 2.3 | 0.98 |
| NAC | 1.46 | 1.49 | 1.97 | 0.91 |
| VeP | 0.31 | 2.47 | 2 | 3.75 |
| GPe | 0.15 | 3.13 | 2.56 | 3.24 |
| GPi | 0.19 | 2.66 | 1.89 | 3.13 |
| SNr | 0.12 | 2.3 | 1.73 | 2.12 |
| SNc | 0.13 | 3.58 | 2.56 | 2.74 |
| RN | 0.43 | 1.87 | 1.38 | 1.76 |
| STN | 0.75 | 1.25 | 0.94 | 2.13 |
| HN | 0.33 | 0.34 | 0.77 | 0.34 |
| Thal | 0.66 | 0.7 | 0.8 | 0.12 |
Abbreviations: CN, caudate nucleus; GPe and GPi, external and internal globus pallidus; HN, habenular nuclei; NAC, nucleus accumbens; Pu, putamen; RN, red nucleus; SNr and SNc, pars reticulata and pars compacta of substantia nigra; STN, subthalamic nucleus; Thal, thalamus; VeP, ventral pallidum.
3.2. Evaluation of subcortical nuclei segmentation
In this section, we report the reliability measurements for manual ‐segmentation, and evaluation parameters (e.g., Kappa coefficient, sensitivity, and average Hausdorff distance) calculated between the atlas‐based sub‐cortical nuclei segmentation and the ground truth nuclei labeled in each individual subject.
3.2.1. Reliability analysis
Table 2 shows the intra‐ and inter‐reliability DICE coefficients in 12 labeled subcortical nuclei between manual segmentations of 15 subjects by three raters. From the results of intra‐reliability, we can see that all the DICE coefficients are close to 0.90. Pu and CN provide average DICE coefficients of 0.95 and 0.94, higher than 0.90 and 0.89 from STN and HN. For the inter‐reliability, all the DICE coefficients are above 0.80. Similarly, Pu and CN show average DICE coefficients of 0.89 and 0.87 respectively, higher than 0.83 of both STN and HN. Checking Table 1, the CNRs for Pu and CN are 1.85 and 2.30, higher than 0.94 and 0.77 for STN and HN. All these results illustrate that STN and HN are more difficult to delineate manually compared with Pu and CN. Besides, the total average DICE coefficient of intra‐reliability is 0.91 and that of inter‐reliability is 0.85, indicating that the manual segmentations by three raters are reliable.
TABLE 2.
Average DICE coefficients in subcortical nuclei between manual segmentations to assess intra‐rater and inter‐rater reliability
| Name | Intra‐rater reliability | Inter‐rater reliability | ||||
| Rater 1 | Rater 2 | Rater 3 | Raters 1 and 2 | Raters 1 and 3 | Raters 2 and 3 | |
| Pu | 0.95 ± 0.01 | 0.94 ± 0.01 | 0.95 ± 0.01 | 0.89 ± 0.03 | 0.89 ± 0.03 | 0.88 ± 0.03 |
| CN | 0.93 ± 0.01 | 0.94 ± 0.02 | 0.95 ± 0.01 | 0.88 ± 0.03 | 0.88 ± 0.03 | 0.86 ± 0.04 |
| NAC | 0.92 ± 0.02 | 0.93 ± 0.02 | 0.92 ± 0.02 | 0.84 ± 0.05 | 0.85 ± 0.06 | 0.83 ± 0.06 |
| VeP | 0.90 ± 0.02 | 0.88 ± 0.03 | 0.89 ± 0.02 | 0.83 ± 0.05 | 0.83 ± 0.05 | 0.82 ± 0.06 |
| GPe | 0.93 ± 0.02 | 0.91 ± 0.02 | 0.91 ± 0.03 | 0.86 ± 0.04 | 0.87 ± 0.03 | 0.84 ± 0.05 |
| GPi | 0.91 ± 0.02 | 0.92 ± 0.02 | 0.92 ± 0.02 | 0.85 ± 0.04 | 0.85 ± 0.04 | 0.83 ± 0.06 |
| SNr | 0.90 ± 0.03 | 0.89 ± 0.03 | 0.90 ± 0.03 | 0.84 ± 0.04 | 0.86 ± 0.04 | 0.82 ± 0.05 |
| SNc | 0.91 ± 0.02 | 0.90 ± 0.03 | 0.89 ± 0.02 | 0.83 ± 0.04 | 0.85 ± 0.05 | 0.82 ± 0.06 |
| RN | 0.92 ± 0.02 | 0.91 ± 0.02 | 0.90 ± 0.02 | 0.87 ± 0.05 | 0.88 ± 0.04 | 0.85 ± 0.05 |
| STN | 0.90 ± 0.03 | 0.88 ± 0.02 | 0.91 ± 0.03 | 0.83 ± 0.06 | 0.84 ± 0.06 | 0.81 ± 0.05 |
| HN | 0.91 ± 0.02 | 0.89 ± 0.02 | 0.88 ± 0.02 | 0.84 ± 0.06 | 0.84 ± 0.05 | 0.82 ± 0.06 |
| Thal | 0.95 ± 0.01 | 0.94 ± 0.01 | 0.94 ± 0.01 | 0.89 ± 0.03 | 0.89 ± 0.03 | 0.87 ± 0.03 |
Abbreviations: CN, caudate nucleus; GPe and GPi, external and internal globus pallidus; HN, habenular nuclei; NAC, nucleus accumbens; Pu, putamen; RN, red nucleus; SNr and SNc, pars reticulata and pars compacta of substantia nigra; STN, subthalamic nucleus; Thal, thalamus; VeP, ventral pallidum.
3.2.2. Evaluation of atlases using T1w templates
For qualitative evaluation of T1w templates, Figure 9 presents the registration results of HybraPD, PD25, CIT168, CerebrA, and AAL3 atlases in one subject space for qualitative evaluation of T1w templates. From the enlarged pictures of three viewpoints, the T1w templates of these atlases could provide visible structures of Pu, CN, and GP, while it is difficult to distinguish other subcortical nuclei, for example, SN, RN, and sub‐regions of thalamus. For quantification, the error‐bar charts in Figure 10 demonstrate evaluation parameter statistics of 12 subcortical ROIs for the 5 state‐of‐the‐art T1w atlases. Because not all the atlases annotate the same subcortical nuclei as we labeled in the HybraPD atlas, there are blanks in the charts of some ROIs. For the thalamus, the PD25 atlas and the CerebrA atlas only labeled the whole ROI instead of sub‐regions, and the AAL3 segmented 15 sub‐regions which was too detailed. Therefore, we consider the thalamus as just one ROI when making a comparison among atlases. Besides, we check the unpaired t‐test analysis of quantitative parameters between 5 atlases and 12 subcortical ROIs. We find that almost all the p‐values are less than 0.05. All these statistical data are put in the Table S1.
FIGURE 9.
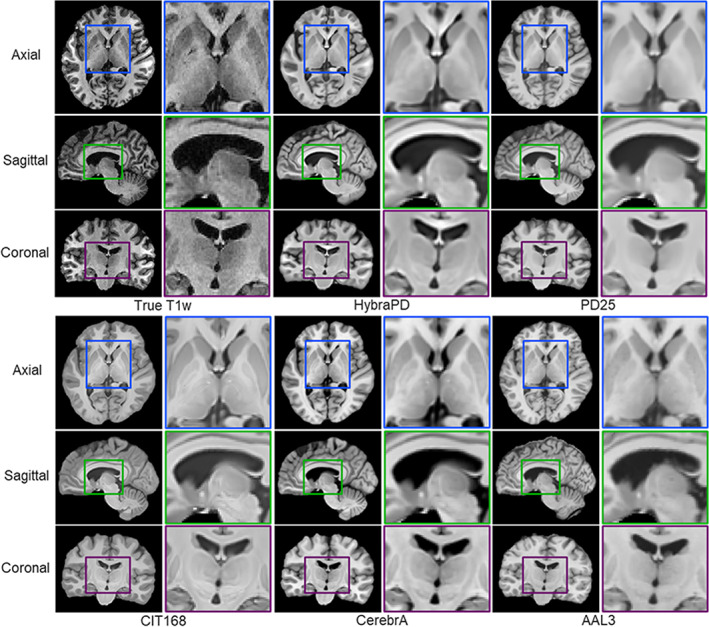
Qualitative evaluation of T1w templates for HybraPD, PD25, CIT168, CerebrA, and AAL3 atlases after being co‐registered to one subject space. The images are shown by representative sections in the axial, sagittal, and coronal views
FIGURE 10.
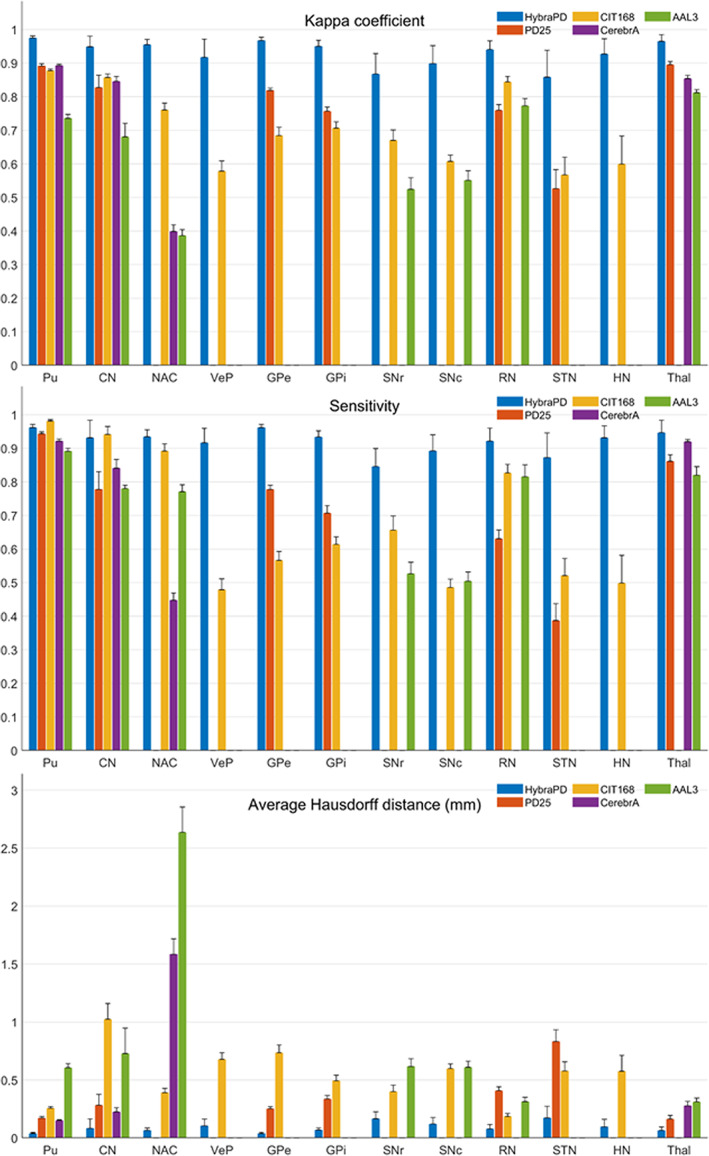
Evaluation parameters showing the accuracy of segmentation among five co‐registered atlases. (a) Kappa coefficient; (b) sensitivity; and (c) average Hausdorff distance
The average and SD of Kappa coefficient, sensitivity, and average Hausdorff distance for each of the 12 subcortical nuclei in 15 individual subjects are plotted in Figure 10a–c, respectively. The ranges of Kappa coefficients denote the agreement levels of segmentations between the ground truth and the labels propagated from the atlases. For instance, a value of 0.61–0.80 represents “substantial” and 0.81–1.00 denotes “almost perfect” label unifications (Landis & Koch, 1977). In Figure 10a, we can see that the HybraPD atlas provide the highest Kappa coefficients among the five atlases for all the subcortical ROIs. Most of the Kappa coefficients of the HybraPD atlas are bigger than 0.86 (“almost perfect” level). Pu has the largest coefficient of 0.97, while STN which is difficult to segment shows the minimum value of 0.86.
The sensitivity, also named the true positive rate, measures the proportion of actual regions compared with the ground truth. As shown in Figure 10b, the HybraPD atlas still has the most considerable sensitivity for most ROIs labeled in the ground truth, except for Pu and CN where the CIT168 atlas gives the sensitivity of 98 and 94%, respectively. And the sensitivity from the HybraPD atlas for most subcortical nuclei is higher than 85%. Meanwhile, we compute the specificity which measures the proportion of correctly identified negatives, and the DICE coefficient which is widely used in the evaluation of image segmentation. The plots of them are not shown in Figure 10, because the specificity from all the atlases for each ROI is close to 100%, and the DICE coefficient is equal to the Kappa coefficient when keeping four decimal places in our case. In addition, all the specific calculated parameters will be given in the Appendix S1.
The average Hausdorff distance has frequent application in object matching by considering the context of relocating the target. The HybraPD atlas shows the best performance of the AHD for all the subcortical ROIs compared with the other four atlases in Figure 10c. Within the results of the HybraPD atlas, the AHD of STN, 0.17 mm, is relatively larger than other ROIs, while the smallest AHD is for Pu with the value of 0.04 mm.
Similarly, Figure 11 illustrates the evaluation of the segmentation for five sub‐regions of the thalamus: Kappa coefficient, sensitivity, and average Hausdorff distance. The parameters are calculated based on the manual segmentation and the HybraPD atlas which is the only one labeling these sub‐regions. The results show that the HybraPD atlas keep good consistency with the ground truth in the five sub‐regions of the thalamus.
FIGURE 11.
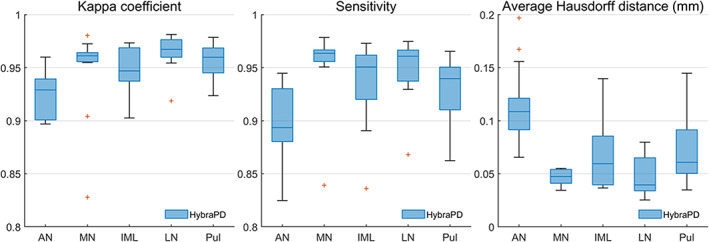
Evaluation parameters showing the accuracy of segmentation for five sub‐regions of the thalamus from the HybraPD atlas. From left to right: Kappa coefficient; Sensitivity; average Hausdorff distance
Tables 3 and 4 show the average volume and tissue susceptibility of subcortical nuclei calculated from the manual segmentation and co‐registered atlases. Tissue susceptibility is averaged within each subcortical ROI in the QSM images. Figures 12 and 13 illustrate the regression of the volume and average susceptibility between manual segmentation and atlas‐based labels of each ROI. The HybraPD atlas shows the best correlation lines with the ground truth for all the 12 subcortical nuclei. In Figure 12, we can see that the R 2 coefficients are higher in some nuclei such as Pu, CN, and Thal, compared with others, for example, VeP, STN, and HN. From the regression plots of the tissue susceptibility, most subcortical nuclei for all the atlases perform well except for STN. Checking the Table 4, the values of the average susceptibility of STN for all the atlases are close to the ground truth. However, there exit many fluctuations in susceptibility around the regression line for STN, as shown in Figure 13.
TABLE 3.
Volume (mm3) of subcortical nuclei calculated from the manual segmentation and co‐registered atlases
| Name | Manual annotation | HybraPD | PD25 | CIT168 | CerebrA | AAL3 |
|---|---|---|---|---|---|---|
| Pu | 4,338.6 ± 503.7 | 4,223.1 ± 495.7 | 4,842.0 ± 565.9 | 5,365.1 ± 631.4 | 4,620.1 ± 550.1 | 6,166.6 ± 685.1 |
| CN | 4,166.9 ± 468.3 | 4,018.0 ± 574.5 | 3,665.2 ± 496.8 | 5,000.0 ± 690.7 | 4,129.0 ± 595.3 | 5,441.5 ± 1,036.7 |
| NAC | 286.1 ± 22.1 | 273.8 ± 22.4 | # | 384.8 ± 32.1 | 356.8 ± 36.2 | 856.9 ± 89.1 |
| VeP | 142.9 ± 12.0 | 142.7 ± 13.1 | # | 93.4 ± 9.2 | # | # |
| GPe | 1,209.3 ± 155.6 | 1,194.4 ± 150.6 | 1,085.6 ± 133.2 | 790.6 ± 103.0 | # | # |
| GPi | 506.6 ± 66.1 | 488.7 ± 62.6 | 438.4 ± 47.5 | 372.8 ± 47.0 | # | # |
| SNr | 285.8 ± 27.1 | 272.0 ± 31.8 | # | 273.9 ± 30.6 | # | 287.9 ± 31.1 |
| SNc | 212.8 ± 21.9 | 209.7 ± 22.1 | # | 127.2 ± 14.8 | # | 176.8 ± 21.0 |
| RN | 290.9 ± 39.3 | 278.5 ± 33.7 | 191.5 ± 21.2 | 277.9 ± 31.4 | # | 321.4 ± 34.5 |
| STN | 144.4 ± 19.7 | 149.0 ± 18.4 | 67.0 ± 8.8 | 120.3 ± 16.0 | # | # |
| HN | 77.6 ± 10.9 | 78.1 ± 8.9 | # | 50.6 ± 5.4 | # | # |
| Thal | 5,888.1 ± 452.7 | 5,659.4 ± 530.3 | 5,439.3 ± 460.8 | # | 6,798.2 ± 556.9 | 6,002.7 ± 578.2 |
Note: “#” denotes the ROI of that row is not labeled in the atlas of the corresponding column.
Abbreviations: CN, caudate nucleus; GPe and GPi, external and internal globus pallidus; HN, habenular nuclei; NAC, nucleus accumbens; Pu, putamen; RN, red nucleus; SNr and SNc, pars reticulata and pars compacta of substantia nigra; STN, subthalamic nucleus; Thal, thalamus; VeP, ventral pallidum.
TABLE 4.
Tissue susceptibility (ppm) of subcortical nuclei calculated from the manual segmentation and co‐registered atlases
| Name | Manual annotation | HybraPD | PD25 | CIT168 | CerebrA | AAL3 |
|---|---|---|---|---|---|---|
| Pu | 0.032 ± 0.011 | 0.032 ± 0.011 | 0.027 ± 0.010 | 0.027 ± 0.009 | 0.029 ± 0.011 | 0.016 ± 0.007 |
| CN | 0.027 ± 0.003 | 0.027 ± 0.003 | 0.026 ± 0.002 | 0.023 ± 0.003 | 0.027 ± 0.003 | 0.019 ± 0.002 |
| NAC | −0.008 ± 0.007 | −0.008 ± 0.007 | # | −0.005 ± 0.007 | 0.003 ± 0.006 | −0.006 ± 0.005 |
| VeP | 0.088 ± 0.017 | 0.086 ± 0.016 | # | 0.095 ± 0.021 | # | # |
| GPe | 0.086 ± 0.019 | 0.085 ± 0.019 | 0.089 ± 0.020 | 0.093 ± 0.028 | # | # |
| GPi | 0.073 ± 0.027 | 0.072 ± 0.027 | 0.070 ± 0.027 | 0.072 ± 0.028 | # | # |
| SNr | 0.090 ± 0.018 | 0.089 ± 0.019 | # | 0.104 ± 0.021 | # | 0.099 ± 0.017 |
| SNc | 0.107 ± 0.015 | 0.107 ± 0.016 | # | 0.108 ± 0.016 | # | 0.095 ± 0.018 |
| RN | 0.068 ± 0.019 | 0.070 ± 0.020 | 0.085 ± 0.022 | 0.070 ± 0.020 | # | 0.049 ± 0.017 |
| STN | 0.064 ± 0.017 | 0.063 ± 0.015 | 0.064 ± 0.020 | 0.051 ± 0.017 | # | # |
| HN | −0.009 ± 0.016 | −0.010 ± 0.015 | # | −0.010 ± 0.016 | # | # |
| Thal | 0.001 ± 0.006 | 0.001 ± 0.006 | 0.001 ± 0.006 | # | −0.001 ± 0.005 | −0.002 ± 0.005 |
Note: “#” denotes the ROI of that row is not labeled in the atlas of the corresponding column.
Abbreviations: CN, caudate nucleus; GPe and GPi, external and internal globus pallidus; HN, habenular nuclei; NAC, nucleus accumbens; Pu, putamen; RN, red nucleus; SNr and SNc, pars reticulata and pars compacta of substantia nigra; STN, subthalamic nucleus; Thal, thalamus; VeP, ventral pallidum.
FIGURE 12.
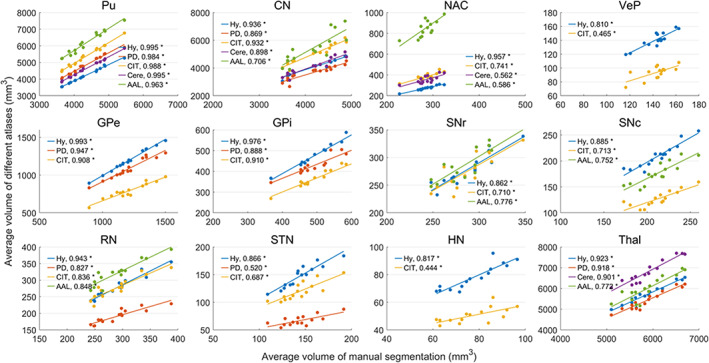
Regression of the average volume between manual segmentation and co‐registered atlases. Hy, HybraPD; PD, PD25; CIT, CIT168; Cere, CerebrA; AAL, AAL3. The R 2 coefficients are given in the image. “*”: p‐value <.05; “ns”: nonsignificant
FIGURE 13.
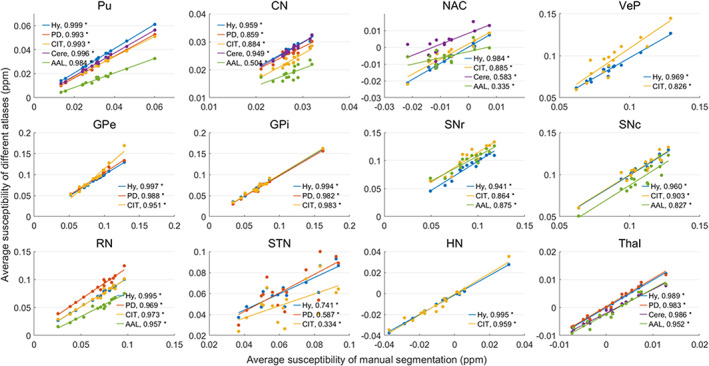
Regression of the average susceptibility between manual segmentation and co‐registered atlases. Hy, HybraPD; PD, PD25; CIT, CIT168; Cere, CerebrA; AAL, AAL3. The R 2 coefficients are given in the image. “*”: p‐value <.05; “ns”: nonsignificant
3.2.3. Evaluation of atlases using quantitative susceptibility mapping templates
Figure 14 illustrates the registration results of HybraPD and Zhang atlases in one subject space for qualitative evaluation of QSM templates. Visually, the QSM template of the HybraPD atlas provides clearer tissue boundaries than the Zhang atlas in gray and white matter regions. And it presents better edge details for subcortical nuclei which are helpful for accurate segmentation. Figure 15 illustrates the evaluation of the segmentation for the HybraPD and Zhang atlases. Since the Zhang atlas just labels GP and SN instead of GPe & GPi and SNr & SNc, again, we keep the same ROIs when computing parameters by merging sub‐regions. From the results, we can see that the HybraPD atlas provides better consistency with the ground truth than the Zhang atlas. For the six subcortical ROIs shown in Figure 15, the Kappa coefficients of the HybraPD atlas range from 0.80 to 0.91 and the values of sensitivity are from 86 to 91%, all of which are nearly doubled than those of the Zhang atlas. Especially, the average Hausdorff distance is substantially improved using the HybraPD atlas with the range 0.14–0.28 mm compared with 4.28–18.02 mm of the Zhang atlas.
FIGURE 14.
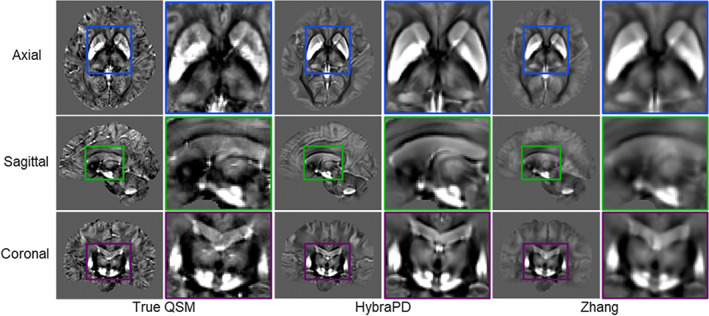
Qualitative evaluation of QSM templates for HybraPD and Zhang atlases after being co‐registered to one subject space. The images are shown by representative sections in the axial, sagittal, and coronal views
FIGURE 15.
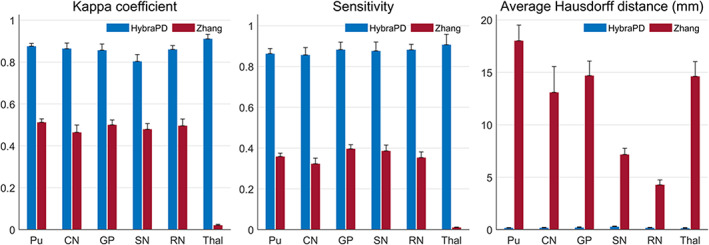
Quantitative statistics showing the accuracy of segmentation between the HybraPD and Zhang atlases. From left to right: Kappa coefficient; Sensitivity; average Hausdorff distance
Figures 16 and 17 illustrate the regression of the average volume and tissue susceptibility between manual segmentation and the two co‐registered atlases using QSM templates. The HybraPD atlas shows better correlation with the ground truth for most of the subcortical nuclei. In Figure 16, the R 2 coefficients of the average volume are larger for some nuclei such as Pu, CN, and Thal, compared with others, for example, GP, SN, and RN. From the regression plots of the tissue susceptibility, most subcortical nuclei for both the atlases perform well except the Thal of the Zhang atlas. Checking Figures 15, 16, 17, we can see that there is a big difference between the thalamus annotation of the Zhang atlas and the manual segmentation of our case.
FIGURE 16.
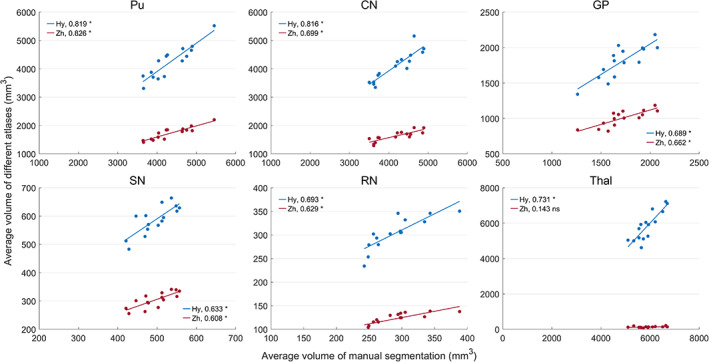
Regression of the average susceptibility between manual segmentation and co‐registered atlases. Hy, HybraPD; Zh, Zhang. The R 2 coefficients are given in the image. “*”: p‐value <.05; “ns”: nonsignificant
FIGURE 17.
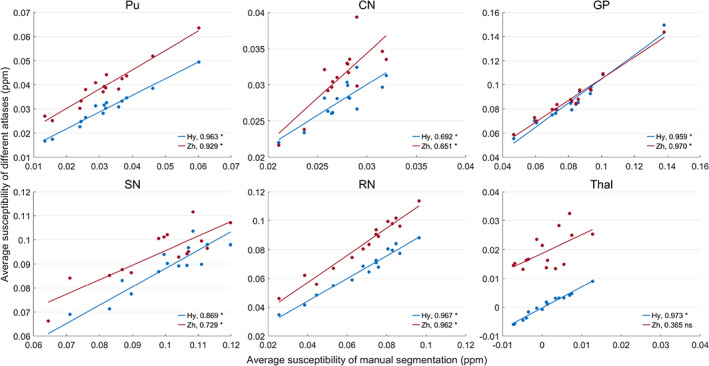
Regression of the average susceptibility between manual segmentation and co‐registered atlases. Hy, HybraPD; Zh, Zhang. The R 2 coefficients are given in the image. “*”: p‐value <.05; “ns”: nonsignificant
3.3. Validation of HybraPD atlas on positron emission tomography images
Using the HybraPD atlas, we calculate the SUVRs of 11C‐CFT in the subcortical nuclei for the PET images of 30 individual subjects, including 15 subjects for PD and 15 subjects for healthy control. Table 5 lists the SUVRs in 6 subcortical nuclei from 5 atlases, that is, Pu, CN, NAC, GP, SN, and STN. For all the atlases, we can see that the SUVRs of disease‐related subcortical nuclei from the PD subjects are significantly lower than those from the healthy subject, which might be caused by the degeneration of dopamine neurons (Nurmi et al., 2003). Focusing on the HybraPD atlas, for PD patients, the average SUVR in Pu is 69% lower than that for the healthy subjects. According to the calculated results, Pu varies the most among all the six sub‐cortical nuclei, followed by CN and GP with 53% lower SUVR values than healthy controls.
TABLE 5.
Standardized uptake value ratios for the PET images in subcortical ROIs from different atlases
| Atlas | Group | Pu* | CN* | NAC* | GP* | SN* | STN* |
| HybraPD | PD | 0.88 ± 0.08 | 0.95 ± 0.13 | 1.65 ± 0.15 | 0.56 ± 0.09 | 0.37 ± 0.09 | 0.36 ± 0.08 |
| Health | 2.81 ± 0.32 | 2.03 ± 0.30 | 2.20 ± 0.19 | 1.20 ± 0.15 | 0.64 ± 0.09 | 0.53 ± 0.07 | |
| PD25 | PD | 0.80 ± 0.07 | 0.99 ± 0.13 | # | 0.54 ± 0.09 | 0.33 ± 0.09 | 0.33 ± 0.07 |
| Health | 2.50 ± 0.27 | 2.02 ± 0.27 | # | 1.21 ± 0.15 | 0.57 ± 0.09 | 0.49 ± 0.07 | |
| CIT168 | PD | 0.77 ± 0.11 | 0.74 ± 0.11 | 1.38 ± 0.16 | 0.52 ± 0.09 | 0.30 ± 0.09 | 0.28 ± 0.07 |
| Health | 2.40 ± 0.27 | 1.64 ± 0.23 | 1.76 ± 0.11 | 1.01 ± 0.15 | 0.52 ± 0.10 | 0.42 ± 0.07 | |
| CerebrA | PD | 0.82 ± 0.08 | 0.74 ± 0.12 | 1.49 ± 0.14 | 0.51 ± 0.09 | # | # |
| Health | 2.55 ± 0.27 | 1.74 ± 0.29 | 2.04 ± 0.18 | 0.99 ± 0.12 | # | # | |
| AAL3 | PD | 0.67 ± 0.06 | 0.42 ± 0.10 | 1.21 ± 0.12 | 0.62 ± 0.09 | 0.32 ± 0.08 | # |
| Health | 2.15 ± 0.24 | 1.27 ± 0.31 | 1.71 ± 0.19 | 1.39 ± 0.18 | 0.56 ± 0.08 | # |
Note: “*”: p‐value <.05. “#” denotes the ROI of that row is not labeled in the atlas of the corresponding column.
4. DISCUSSION
In this work, we constructed a HybraPD atlas which was generated from the T1w and QSM images of 87 subjects with PD and mainly concentrated on the parcellation map for deep gray matter nuclei. Due to the difficulty of small deep brain nucleus localization, only a few MRI atlases depicted the subcortical nuclei (Ewert et al., 2018; Manera et al., 2020; Pauli et al., 2018; Rolls et al., 2020). However, these atlases were mostly generated from healthy young subjects using the T1w images, sometimes fused with T2*w or R2* maps. The limitation of T1w‐based processing and analyzing methods has been discussed in previous studies concerned with the low contrast in iron‐rich deep brain nuclei, especially for T1w images of healthy young adults brain (Acosta‐Cabronero et al., 2017; Cobzas et al., 2015; Lim et al., 2013). Previous studies have constructed histological atlases for the human basal ganglia and thalamus (Chakravarty, Bertrand, Hodge, Sadikot, & Collins, 2006; Yelnik et al., 2007) which is helpful for navigating deep brain stimulation surgery to target the subcortical nuclei for brain diseases treatment (Bardinet et al., 2009; Chakravarty, Sadikot, Germann, Bertrand, & Collins, 2008). However, the 2D histological data would suffer from artifacts from tearing, local compression, shearing, or stretching for 3D reconstruction (Chakravarty et al., 2008). Thus, the spatial location of subcortical nuclei in the histological atlases might not accurately match that in the standard template space due to the registration errors. Several recent studies have shown the feasibility of labeling the subcortical nuclei based on susceptibility contrast, either using the QSM images only or using the hybrid QSM/T1w images of healthy subjects (Hanspach et al., 2017; Li et al., 2019; Zhang et al., 2018). However, an atlas from PD patients is essential to investigate the disease‐specific anatomy by avoiding the registration bias between PD subjects and healthy templates (Xiao et al., 2017).
In the HybraPD atlas, we constructed a parcellation map for 12 subcortical nuclei by manual annotation. This map contained several deep gray nuclei which are rarely displayed in existing MRI atlases but highly related to PD pathology, for example, GPe, GPi, SNr, SNc, NAC, and STN. The thalamus was further divided into five sub‐regions through susceptibility contrast. Considering the multimodality of the HybraPD atlas, we verified the nucleus segmentation accuracy on PD brain images using T1w and QSM templates, respectively. As the ground truth, 15 individual PD subjects were segmented by three experienced experts for the same 12 subcortical nuclei. It should be noted that these 15 manually segmented subjects could be used as the ground truth not only in this article, but also in other studies related to the analysis of human subcortical nuclei or processing of PD MRI data. For instance, the automatic segmentation of subcortical structures based on the fusion of multiatlas information (Li et al., 2019), the Bayesian multiobject approach (Bazin, Alkemade, Mulder, Henry, & Forstmann, 2020), or deep learning classifier using U‐net (Wei et al., 2019), all needed the manual annotation as the reference.
After being co‐registered to the ground truth space using T1w templates, we first made a comparison among five atlases, that is, HybraPD, PD25, CIT168, CerebrA, and AAL3 (Manera et al., 2020; Pauli et al., 2018; Rolls et al., 2020; Xiao et al., 2017). According to the evaluation results, the HybraPD atlas shows the best consistency with human experts in terms of the Kappa coefficient (>0.86), the sensitivity (>85%), and the average Hausdorff distance (<0.17 mm). From the internal comparison, the HybraPD atlas provides better delineations for more prominent subcortical nuclei, for example, Pu, CN, Thal, GPe, and GPi, with the Kappa coefficient over 0.95. For the nuclei such as SNr, SNc, STN, and HN, the Kappa coefficient is relatively lower in the range of 0.86–0.93 but still larger than the other four atlases. Except for the HybraPD atlas, the PD25 and the CIT168 atlases also perform comparably to the ground truth for specific ROIs. The PD25 atlas provides more significant Kappa coefficients for GPe and GPi, while the CIT168 atlas is larger for RN and STN. Meanwhile, the CIT168 atlas shows higher sensitivity for Pu and CN, but with a larger average volume for these nuclei (see Table 1). It means that in these ROIs, the CIT168 atlas annotates not only more actual voxels, but also larger nontarget regions. Besides, the CerebrA atlas gives a good Kappa coefficient for Pu, CN, and Thal with a value of about 0.86, and the AAL3 atlas also has a Kappa coefficient of 0.77 for RN. However, these two atlases show quite large AHD for NAC, 1.59 mm for the CerebrA atlas, 2.64 mm for the AAL3 atlas, respectively.
Then, a similar comparison was made between the HybraPD and Zhang atlases (Zhang et al., 2018) based on the registration using QSM templates. The HybraPD atlas provides the QSM template which could be helpful for the case that only QSM images are available or QSM information needs to be analyzed individually (Deistung et al., 2013; Wei et al., 2019). The results show that the HybraPD atlas performs better than the Zhang atlas considering all the quantitative parameters. Meanwhile, it proves the feasibility of registration using QSM templates from the atlas to the subject space. However, if we compare the quantification of the HybraPD atlas using T1w and QSM templates, it can be found that the results of T1w templates improve a little than those of QSM templates. Taking RN as an example, the Kappa coefficient from the T1w template is 0.94 and the sensitivity is 82%, which are both bigger than 0.86 and 88% from the QSM template. And the AHD from the T1w template is 0.08 mm less than 0.17 mm from the QSM template. It probably means that when transforming from the same atlas to the subject space, the T1w contrast could help achieve better registration than the QSM contrast.
Besides, we analyzed the metabolic difference in subcortical nuclei between PD patients and healthy control subjects by applying the HybraPD atlas to calculate SUVRs on PET images. For all the atlases, the results show that the SUVRs of disease‐related subcortical nuclei from the PD subjects were significantly lower than those from healthy subjects. It is hard to judge the difference between the HybraPD atlas and others through the analysis of PET images, because the benefits of using multimodality contrasts are more apparent in structural images. We tend to provide one potential application for the subcortical nuclei segmentation. Here, we focus on the results calculated by the HybraPD atlas. Compared with previous researches calculating the 11C‐CFT SUVRs in the human brain, our average value of Pu for the PD group is 0.88 ± 0.08, lower than 1.16 ± 0.50 for the PD group of Sun et al. (2019) and higher than 0.69 ± 0.27 for multiple system atrophy parkinsonian type (MSA‐P) group of Bu et al. (2018). And for CN, our average SUVR for the PD group is 0.95 ± 0.13, lower than 1.16 ± 0.50 for the PD group of Sun et al. (2019) and 1.02 ± 0.39 for MSA‐P group of Bu et al. (2018). Meanwhile, our average SUVRs of Pu and CN for the health group are 2.81 ± 0.32 and 2.03 ± 0.30, higher than 1.98 ± 0.21 and 1.82 ± 0.24 of Sun et al. (2019), as well as 2.17 ± 0.18 and 1.84 ± 0.15 of Bu et al. (2018). The calculated SUVRs in our work and previous works are slightly different. Because the 11C‐CFT SUVRs are semi‐quantitative estimations, it varies with both acquisition parameter and reference selection. Thus, with different scanning protocols, the values slightly differ from each report. Also, in most previous studies, the subcortical nuclei are manually annotated based on PET or T1w contrast, which is either low resolution or show ambiguous contour on these ROIs. Despite the slight difference, the variations of 11C‐CFT SUVRs between PD patients and healthy subjects are significant and consistent with previous reports (Bu et al., 2018; Sun et al., 2019). These reductions might be caused by the degeneration of dopamine neurons within these nuclei due to the disease (Nurmi et al., 2003). It is envisioned that our proposed atlas provides efficient and reliable reference for PD‐related minor subcortical nucleus identification in PET images.
Despite the verification of the HybraPD atlas reliability, there are still limitations of this study. First, the number of ground truth is small, although we have used 15 labeled individual subjects, and there were similarly several manual annotations in some previous researches (Bazin et al., 2020; Lim et al., 2013; Pauli et al., 2018). Ewert et al. used 103 segmented brains to assess the segmentation of DBS target nuclei, but just for two ROIs, that is, GPi and STN (Ewert et al., 2019). The issue is that manual delineation is a quite time‐consuming and exhausting task, especially for subcortical nuclei with such small size. The segmentation experts need to be experienced, knowledgeable and familiar with the histological structure of the subcortical nuclei. Therefore, it takes time to accumulate more manual segmentations. Meanwhile, the registration methods will impact segmentation accuracy when transforming the parcellation map from the atlas space to the subject one. We used FSL FLIRT (Smith et al., 2004) and symmetric normalization by ANTs (Avants et al., 2010), which are recognized as practical tools for the MRI images registration. However, it is always a challenge to achieve 100% perfect registration. Moreover, we mainly consider the features like the location and the size of the subcortical nuclei on images. In fact, we should also check the association with other pathological information like the UPDRS score to stage PD (Hughes, Daniel, Kilford, & Lees, 1992). Besides, this study is based on the 3.0 Tesla MRI data with a spatial resolution of 1 × 1 × 1 mm3. Recently, Lau et al. has successfully used ultra‐high field 7.0 Tesla MRI data (Lau et al., 2017) for in vivo visualization of brain structures at the submillimeter scale (0.7 mm3 isotropic), for example, investigation of zona incerta, STN and RN (Lau et al., 2020). It might be an effective protocol for imaging the complex subregions of subcortical structures from the human brain in future.
5. CONCLUSION
This study presents the construction of the HybraPD atlas. This Parkinson's disease‐specific human brain atlas includes multi‐contrast templates (i.e., T1w, QSM, GRE magnitude, R2*, and tissue probabilistic maps), allowing us to accurately segment cortical white and gray matter and iron‐rich subcortical nuclei. Notably, the QSM template provides feasibility to delineate subcortical structures into fine sub‐regions. For instance, the globus pallidus is made of internal and external segments; the substantia nigra consists of pars reticulata and pars compacta; the thalamus is divided into five sub‐nuclei including anterior nuclei, median nuclei, internal medullary lamina, lateral nuclei, and pulvinar. Based on the templates, a parcellation map with 12 subcortical nuclei is manually annotated. Our HybraPD atlas presents the most accurate performance for leading individual PD subjects into atlas space compared with other four existing atlases. The HybraPD atlas is confirmed to be an efficient and reliable new tool for investigating PD pathological alterations.
CONFLICT OF INTERESTS
The authors declare no conflicts of interest.
Supporting information
Table S1 Evaluation parameters of subcortical nuclei calculated from the manual segmentation and five co‐registered atlases.
Table S2p‐values of the t‐test for the quantitative parameters in the same ROI between atlases.
Table S3R2 coefficients between average DICE coefficients for intra‐rater and inter‐rater reliability and average volume of subcortical nuclei from the manual segmentation.
Appendix S1 Supporting Information
ACKNOWLEDGMENTS
This study is supported by the National Natural Science Foundation of China (No. 62071299, 61901256, 91949120, 82021002, 81971641, 81671239, 82001767); Research project of Shanghai Health Commission (2020YJZX0111); Clinical Research Plan of SHDC (SHDC2020CR1038B); Natural Science Foundation of Zhejiang Province (No. LQ21H180008); China Postdoctoral Science Foundation (No. 2019M662082).
Symmetric group‐wise normalization method
The SyGN method follows the process below (Avants et al., 2010):
Before the first iteration, an initial template could be given or the algorithm will calculate one initialization by the Euclidean average obtained using affine alignment from the datasets.
- Taking the template as fixed, compute a set of deformed images and diffeomorphisms by the registration between the input images and the template using affine alignment and symmetric normalization, which optimizes the energy function (Avants et al., 2010):
where, and denote two images, is the time, and are two diffeomorphisms denoting the mapped image pair , the shape distance, the dissimilarity between images, the inner product, is the mean over a local window centered at the position .(A1) - If the template image is denoted by , the SyGN algorithm can be expressed by minimizing the energy function :
where, is a diffeomorphism representing the initial conditions of each . Then, the is minimized through optimizing the template appearance in term by a gradient‐based algorithm (Avants et al., 2010), and estimating Frechet mean (Fréchet, 1948) of the diffeomorphisms to minimize (Avants et al., 2010).(A2) Calculating the new template by applying the average diffeomorphism and repeat from the Step 2 until convergence.
Quantitative parameters for segmentation accuracy
If we denote the ground truth by , and the warped segmentation by , the True Positive (), True Negative (), False Positive (), and False Negative () are calculated by (Lim et al., 2013):
| (A3) |
If the segmented result is a binary image with the values of 0 and 1, the operator calculates the sum of nonzero elements in . Then, the sensitivity, the specificity, the Kappa coefficient, and the DICE coefficient could be given by:
| (A4) |
Due to the smaller regions of subcortical nuclei compared with cortical structures, the value of is far greater than that of , , or . Thus, the specificity will be approximate to 100%, and the formula of the Kappa coefficient can be rewritten by ignoring small terms without :
| (A5) |
which is the same as the DICE coefficient.
Starting from the ground truth and the warped segmentation , the average Hausdorff distance (AHD) is defined by (Taha & Hanbury, 2015):
| (A6) |
and is calculated by
| (A7) |
where, and are voxels in the images and , denotes distance formula, for example, Euclidean distance in this article.
Yu, B., Li, L., Guan, X., Xu, X., Liu, X., Yang, Q., Wei, H., Zuo, C., & Zhang, Y. (2021). HybraPD atlas: Towards precise subcortical nuclei segmentation using multimodality medical images in patients with Parkinson disease. Human Brain Mapping, 42(13), 4399–4421. 10.1002/hbm.25556
Funding information National Natural Science Foundation of China, Grant/Award Numbers: 62071299, 61901256, 91949120, 82021002, 81971641, 81671239, 82001767; Clinical Research Plan of SHDC, Grant/Award Number: 2020YJZX0111; Clinical Research Plan of SHDC, Grant/Award Number: SHDC2020CR1038B; Natural Science Foundation of Zhejiang Province, Grant/Award Number: LQ21H180008; China Postdoctoral Science Foundation, Grant/Award Number: 2019M662082
Contributor Information
Chuantao Zuo, Email: zuochuantao@fudan.edu.cn.
Yuyao Zhang, Email: zhangyy8@shanghaitech.edu.cn.
DATA AVAILABILITY STATEMENT
The data that support the findings of this study are available from the corresponding author upon reasonable request.
REFERENCES
- Acosta‐Cabronero, J., Cardenas‐Blanco, A., Betts, M. J., Butryn, M., Valdes‐Herrera, J. P., Galazky, I., & Nestor, P. J. (2017). The whole‐brain pattern of magnetic susceptibility perturbations in Parkinson's disease. Brain, 140(1), 118–131. 10.1093/brain/aww278 [DOI] [PubMed] [Google Scholar]
- Aubert‐Broche, B., Evans, A. C., & Collins, L. (2006). A new improved version of the realistic digital brain phantom. NeuroImage, 32(1), 138–145. [DOI] [PubMed] [Google Scholar]
- Avants, B. B., Yushkevich, P., Pluta, J., Minkoff, D., Korczykowski, M., Detre, J., & Gee, J. C. (2010). The optimal template effect in hippocampus studies of diseased populations. NeuroImage, 49(3), 2457–2466. 10.1016/j.neuroimage.2009.09.062 [DOI] [PMC free article] [PubMed] [Google Scholar]
- Barbosa, J. H. O., Santos, A. C., Tumas, V., Liu, M., Zheng, W., Haacke, E. M., & Salmon, C. E. G. (2015). Quantifying brain iron deposition in patients with Parkinson's disease using quantitative susceptibility mapping, R2 and R2. Magnetic Resonance Imaging, 33(5), 559–565. [DOI] [PubMed] [Google Scholar]
- Bardinet, E., Bhattacharjee, M., Dormont, D., Pidoux, B., Malandain, G., Schüpbach, M., … Yelnik, J. (2009). A three‐dimensional histological atlas of the human basal ganglia. II. Atlas deformation strategy and evaluation in deep brain stimulation for Parkinson disease. Journal of Neurosurgery, 110(2), 208–219. [DOI] [PubMed] [Google Scholar]
- Barnham, K. J., Masters, C. L., & Bush, A. I. (2004). Neurodegenerative diseases and oxidative stress. Nature Reviews Drug Discovery, 3(3), 205–214. [DOI] [PubMed] [Google Scholar]
- Basser, P. J., Mattiello, J., & LeBihan, D. (1994). MR diffusion tensor spectroscopy and imaging. Biophysical Journal, 66(1), 259–267. [DOI] [PMC free article] [PubMed] [Google Scholar]
- Bazin, P.‐L., Alkemade, A., Mulder, M., Henry, A. G., & Forstmann, B. (2020). Multi‐contrast anatomical subcortical structures parcellation. eLife, 9, e59430. [DOI] [PMC free article] [PubMed] [Google Scholar]
- Bechara, B., McMahan, C. A., Moore, W. S., Noujeim, M., Geha, H., & Teixeira, F. B. (2012). Contrast‐to‐noise ratio difference in small field of view cone beam computed tomography machines. Journal of Oral Science, 54(3), 227–232. [DOI] [PubMed] [Google Scholar]
- Braak, H., Ghebremedhin, E., Rüb, U., Bratzke, H., & Del Tredici, K. (2004). Stages in the development of Parkinson's disease‐related pathology. Cell and Tissue Research, 318(1), 121–134. [DOI] [PubMed] [Google Scholar]
- Bu, L. L., Liu, F. T., Jiang, C. F., Guo, S. S., Yu, H., Zuo, C. T., … Wang, J. (2018). Patterns of dopamine transporter imaging in subtypes of multiple system atrophy. Acta Neurologica Scandinavica, 138(2), 170–176. [DOI] [PubMed] [Google Scholar]
- Castellani, R. J., Siedlak, S. L., Perry, G., & Smith, M. A. (2000). Sequestration of iron by Lewy bodies in Parkinson's disease. Acta Neuropathologica, 100(2), 111–114. [DOI] [PubMed] [Google Scholar]
- Chakravarty, M. M., Bertrand, G., Hodge, C. P., Sadikot, A. F., & Collins, D. L. (2006). The creation of a brain atlas for image guided neurosurgery using serial histological data. NeuroImage, 30(2), 359–376. [DOI] [PubMed] [Google Scholar]
- Chakravarty, M. M., Sadikot, A. F., Germann, J., Bertrand, G., & Collins, D. L. (2008). Towards a validation of atlas warping techniques. Medical Image Analysis, 12(6), 713–726. [DOI] [PubMed] [Google Scholar]
- Chen, H., Sha, Z., Ma, H., He, Y., & Feng, T. (2018). Effective network of deep brain stimulation of subthalamic nucleus with bimodal positron emission tomography/functional magnetic resonance imaging in Parkinson's disease. CNS Neuroscience & Therapeutics, 24(2), 135–143. 10.1111/cns.12783 [DOI] [PMC free article] [PubMed] [Google Scholar]
- Chen, Q., Chen, Y., Zhang, Y., Wang, F., Yu, H., Zhang, C., … Luo, W. (2019). Iron deposition in Parkinson's disease by quantitative susceptibility mapping. BMC Neuroscience, 20(1), 1–8. [DOI] [PMC free article] [PubMed] [Google Scholar]
- Cobzas, D., Sun, H., Walsh, A. J., Lebel, R. M., Blevins, G., & Wilman, A. H. (2015). Subcortical gray matter segmentation and voxel‐based analysis using transverse relaxation and quantitative susceptibility mapping with application to multiple sclerosis. Journal of Magnetic Resonance Imaging, 42(6), 1601–1610. 10.1002/jmri.24951 [DOI] [PubMed] [Google Scholar]
- Deistung, A., Schafer, A., Schweser, F., Biedermann, U., Turner, R., & Reichenbach, J. R. (2013). Toward in vivo histology: A comparison of quantitative susceptibility mapping (QSM) with magnitude‐, phase‐, and R2*‐imaging at ultra‐high magnetic field strength. NeuroImage, 65, 299–314. 10.1016/j.neuroimage.2012.09.055 [DOI] [PubMed] [Google Scholar]
- Deuschl, G., Schade‐Brittinger, C., Krack, P., Volkmann, J., Schäfer, H., Bötzel, K., … Voges, J. (2006). A randomized trial of deep‐brain stimulation for Parkinson's disease. New England Journal of Medicine, 355(9), 896–908. 10.1056/NEJMoa060281 [DOI] [PubMed] [Google Scholar]
- Dorsey, E. R., Elbaz, A., Nichols, E., Abd‐Allah, F., Abdelalim, A., Adsuar, J. C., … Collado‐Mateo, D. (2018). Global, regional, and national burden of Parkinson's disease, 1990–2016: A systematic analysis for the global burden of disease study 2016. The Lancet Neurology, 17(11), 939–953. [DOI] [PMC free article] [PubMed] [Google Scholar]
- Du, G., Lewis, M. M., Styner, M., Shaffer, M. L., Sen, S., Yang, Q. X., & Huang, X. (2011). Combined R2* and diffusion tensor imaging changes in the substantia nigra in Parkinson's disease. Movement Disorders, 26(9), 1627–1632. [DOI] [PMC free article] [PubMed] [Google Scholar]
- Ewert, S., Horn, A., Finkel, F., Li, N., Kühn, A. A., & Herrington, T. M. (2019). Optimization and comparative evaluation of nonlinear deformation algorithms for atlas‐based segmentation of DBS target nuclei. NeuroImage, 184, 586–598. 10.1016/j.neuroimage.2018.09.061 [DOI] [PMC free article] [PubMed] [Google Scholar]
- Ewert, S., Plettig, P., Li, N., Chakravarty, M. M., Collins, D. L., Herrington, T. M., … Horn, A. (2018). Toward defining deep brain stimulation targets in MNI space: A subcortical atlas based on multimodal MRI, histology and structural connectivity. NeuroImage, 170, 271–282. 10.1016/j.neuroimage.2017.05.015 [DOI] [PubMed] [Google Scholar]
- Feldmann, A., Illes, Z., Kosztolanyi, P., Illes, E., Mike, A., Kover, F., … Nagy, F. (2008). Morphometric changes of gray matter in Parkinson's disease with depression: A voxel‐based morphometry study. Movement Disorders, 23(1), 42–46. [DOI] [PubMed] [Google Scholar]
- Follett, K. A., Weaver, F. M., Stern, M., Hur, K., Harris, C. L., Luo, P., … Reda, D. J. (2010). Pallidal versus subthalamic deep‐brain stimulation for Parkinson's disease. New England Journal of Medicine, 362(22), 2077–2091. 10.1056/NEJMoa0907083 [DOI] [PubMed] [Google Scholar]
- Fonov, V., Evans, A. C., Botteron, K., Almli, C. R., McKinstry, R. C., Collins, D. L., & Brain Development Cooperative Group (2011). Unbiased average age‐appropriate atlases for pediatric studies. NeuroImage, 54(1), 313–327. 10.1016/j.neuroimage.2010.07.033 [DOI] [PMC free article] [PubMed] [Google Scholar]
- Fonov, V., Evans, A. C., McKinstry, R. C., Almli, C. R., & Collins, D. L. (2009). Unbiased nonlinear average age‐appropriate brain templates from birth to adulthood. NeuroImage, 47, S102. 10.1016/S1053-8119(09)70884-5 [DOI] [Google Scholar]
- Fréchet, M. (1948). Les éléments aléatoires de nature quelconque dans un espace distancié. Paper presented at the Annales de l'institut Henri Poincaré.
- Grabner, G., Janke, A. L., Budge, M. M., Smith, D., Pruessner, J., & Collins, D. L. (2006). Symmetric atlasing and model based segmentation: An application to the hippocampus in older adults. Paper presented at the International Conference on Medical Image Computing and Computer‐Assisted Intervention. [DOI] [PubMed]
- Hanspach, J., Dwyer, M. G., Bergsland, N. P., Feng, X., Hagemeier, J., Bertolino, N., … Schweser, F. (2017). Methods for the computation of templates from quantitative magnetic susceptibility maps (QSM): Toward improved atlas‐ and voxel‐based analyses (VBA). Journal of Magnetic Resonance Imaging, 46(5), 1474–1484. 10.1002/jmri.25671 [DOI] [PMC free article] [PubMed] [Google Scholar]
- He, Q., Song, N., Xu, H., Wang, R., Xie, J., & Jiang, H. (2011). Alpha‐synuclein aggregation is involved in the toxicity induced by ferric iron to SK‐N‐SH neuroblastoma cells. Journal of Neural Transmission, 118(3), 397–406. [DOI] [PubMed] [Google Scholar]
- Hindle, J. V. (2010). Ageing, neurodegeneration and Parkinson's disease. Age and Ageing, 39(2), 156–161. [DOI] [PubMed] [Google Scholar]
- Holmes, C. J., Hoge, R., Collins, L., Woods, R., Toga, A. W., & Evans, A. C. (1998). Enhancement of MR images using registration for signal averaging. Journal of Computer Assisted Tomography, 22(2), 324–333. [DOI] [PubMed] [Google Scholar]
- Hughes, A. J., Daniel, S. E., Kilford, L., & Lees, A. J. (1992). Accuracy of clinical diagnosis of idiopathic Parkinson's disease: A clinico‐pathological study of 100 cases. Journal of Neurology, Neurosurgery & Psychiatry, 55, 181–184. 10.1136/jnnp.55.3.181 [DOI] [PMC free article] [PubMed] [Google Scholar]
- Kamagata, K., Hatano, T., & Aoki, S. (2016). What is NODDI and what is its role in Parkinson's assessment? Expert Review of Neurotherapeutics, 16(3), 241–243. [DOI] [PubMed] [Google Scholar]
- Kosta, P., Argyropoulou, M. I., Markoula, S., & Konitsiotis, S. (2006). MRI evaluation of the basal ganglia size and iron content in patients with Parkinson's disease. Journal of Neurology, 253(1), 26–32. [DOI] [PubMed] [Google Scholar]
- Landis, J. R., & Koch, G. G. (1977). The measurement of observer agreement for categorical data. Biometrics, 33, 159–174. [PubMed] [Google Scholar]
- Langkammer, C., Krebs, N., Goessler, W., Scheurer, E., Ebner, F., Yen, K., … Ropele, S. (2010). Quantitative MR imaging of brain iron: A postmortem validation study. Radiology, 257(2), 455–462. [DOI] [PubMed] [Google Scholar]
- Langkammer, C., Pirpamer, L., Seiler, S., Deistung, A., Schweser, F., Franthal, S., … Pendl, T. (2016). Quantitative susceptibility mapping in Parkinson's disease. PLoS One, 11(9), e0162460. [DOI] [PMC free article] [PubMed] [Google Scholar]
- Lau, J. C., MacDougall, K. W., Arango, M. F., Peters, T. M., Parrent, A. G., & Khan, A. R. (2017). Ultra‐high field template‐assisted target selection for deep brain stimulation surgery. World Neurosurgery, 103, 531–537. [DOI] [PubMed] [Google Scholar]
- Lau, J. C., Xiao, Y., Haast, R. A., Gilmore, G., Uludağ, K., MacDougall, K. W., … Khan, A. R. (2020). Direct visualization and characterization of the human zona incerta and surrounding structures. Human Brain Mapping, 41(16), 4500–4517. [DOI] [PMC free article] [PubMed] [Google Scholar]
- Lewis, M. M., Du, G., Kidacki, M., Patel, N., Shaffer, M. L., Mailman, R. B., & Huang, X. (2013). Higher iron in the red nucleus marks Parkinson's dyskinesia. Neurobiology of Aging, 34(5), 1497–1503. [DOI] [PMC free article] [PubMed] [Google Scholar]
- Li, W., Jiang, H., Song, N., & Xie, J. (2010). Dose‐and time‐dependent α‐synuclein aggregation induced by ferric iron in SK‐N‐SH cells. Neuroscience Bulletin, 26(3), 205–210. [DOI] [PMC free article] [PubMed] [Google Scholar]
- Li, X., Allen, R. P., Earley, C. J., Liu, H., Cruz, T. E., Edden, R. A. E., … van Zijl, P. C. M. (2016). Brain iron deficiency in idiopathic restless legs syndrome measured by quantitative magnetic susceptibility at 7 tesla. Sleep Medicine, 22, 75–82. 10.1016/j.sleep.2016.05.001 [DOI] [PMC free article] [PubMed] [Google Scholar]
- Li, X., Chen, L., Kutten, K., Ceritoglu, C., Li, Y., Kang, N., … Faria, A. V. (2019). Multi‐atlas tool for automated segmentation of brain gray matter nuclei and quantification of their magnetic susceptibility. NeuroImage, 191, 337–349. 10.1016/j.neuroimage.2019.02.016 [DOI] [PMC free article] [PubMed] [Google Scholar]
- Lim, I. A., Faria, A. V., Li, X., Hsu, J. T., Airan, R. D., Mori, S., & van Zijl, P. C. (2013). Human brain atlas for automated region of interest selection in quantitative susceptibility mapping: Application to determine iron content in deep gray matter structures. NeuroImage, 82, 449–469. 10.1016/j.neuroimage.2013.05.127 [DOI] [PMC free article] [PubMed] [Google Scholar]
- Lotfipour, A. K., Wharton, S., Schwarz, S. T., Gontu, V., Schäfer, A., Peters, A. M., … Bajaj, N. P. (2012). High resolution magnetic susceptibility mapping of the substantia nigra in Parkinson's disease. Journal of Magnetic Resonance Imaging, 35(1), 48–55. [DOI] [PubMed] [Google Scholar]
- Manera, A. L., Dadar, M., Fonov, V., & Collins, D. L. (2020). CerebrA: Accurate registration and manual label correction of Mindboggle‐101 atlas for MNI‐ICBM152 template. Scientific Data, 7(1), 1–9. [DOI] [PMC free article] [PubMed] [Google Scholar]
- Martin, W. W., Wieler, M., & Gee, M. (2008). Midbrain iron content in early Parkinson disease: A potential biomarker of disease status. Neurology, 70, 1411–1417. [DOI] [PubMed] [Google Scholar]
- Mazziotta, J., Toga, A., Evans, A., Fox, P., Lancaster, J., Zilles, K., … Pike, B. (2001). A probabilistic atlas and reference system for the human brain: International consortium for brain mapping (ICBM). Philosophical Transactions of the Royal Society of London Series B: Biological Sciences, 356(1412), 1293–1322. [DOI] [PMC free article] [PubMed] [Google Scholar]
- McGeer, P. L., & McGeer, E. G. (2004). Inflammation and neurodegeneration in Parkinson's disease. Parkinsonism & Related Disorders, 10, S3–S7. 10.1016/j.parkreldis.2004.01.005 [DOI] [PubMed] [Google Scholar]
- Mori, S., Wakana, S., Van Zijl, P. C., & Nagae‐Poetscher, L. (2005). MRI atlas of human white matter. Amsterdam, The Netherlands: Elsevier. [Google Scholar]
- Nilsson, M., Szczepankiewicz, F., van Westen, D., & Hansson, O. (2015). Extrapolation‐based references improve motion and eddy‐current correction of high B‐value DWI data: Application in Parkinson's disease dementia. PLoS One, 10(11), e0141825. [DOI] [PMC free article] [PubMed] [Google Scholar]
- Nurmi, E., Bergman, J., Eskola, O., Solin, O., Vahlberg, T., Sonninen, P., & Rinne, J. O. (2003). Progression of dopaminergic hypofunction in striatal subregions in Parkinson's disease using [18F] CFT PET. Synapse, 48(3), 109–115. [DOI] [PubMed] [Google Scholar]
- Ofori, E., Pasternak, O., Planetta, P. J., Li, H., Burciu, R. G., Snyder, A. F., … Vaillancourt, D. E. (2015). Longitudinal changes in free‐water within the substantia nigra of Parkinson's disease. Brain, 138, 2322–2331. 10.1093/brain/awv136 [DOI] [PMC free article] [PubMed] [Google Scholar]
- Pauli, W. M., Nili, A. N., & Tyszka, J. M. (2018). A high‐resolution probabilistic in vivo atlas of human subcortical brain nuclei. Scientific Data, 5, 180063. 10.1038/sdata.2018.63 [DOI] [PMC free article] [PubMed] [Google Scholar]
- Péran, P., Cherubini, A., Assogna, F., Piras, F., Quattrocchi, C., Peppe, A., … Stefani, A. (2010). Magnetic resonance imaging markers of Parkinson's disease nigrostriatal signature. Brain, 133(11), 3423–3433. [DOI] [PubMed] [Google Scholar]
- Qi, S., Sui, J., Chen, J., Liu, J., Jiang, R., Silva, R., … Calhoun, V. D. (2019). Parallel group ICA+ICA: Joint estimation of linked functional network variability and structural covariation with application to schizophrenia. Human Brain Mapping, 40(13), 3795–3809. 10.1002/hbm.24632 [DOI] [PMC free article] [PubMed] [Google Scholar]
- Rolls, E. T., Huang, C.‐C., Lin, C.‐P., Feng, J., & Joliot, M. (2020). Automated anatomical labelling atlas 3. Neuroimage, 206, 116189. 10.1016/j.neuroimage.2019.116189 [DOI] [PubMed] [Google Scholar]
- Schwarz, S. T., Rittman, T., Gontu, V., Morgan, P. S., Bajaj, N., & Auer, D. P. (2011). T1‐weighted MRI shows stage‐dependent substantia nigra signal loss in Parkinson's disease. Movement Disorders, 26(9), 1633–1638. [DOI] [PubMed] [Google Scholar]
- Smith, S. M., Jenkinson, M., Woolrich, M. W., Beckmann, C. F., Behrens, T. E., Johansen‐Berg, H., … Flitney, D. E. (2004). Advances in functional and structural MR image analysis and implementation as FSL. NeuroImage, 23, S208–S219. [DOI] [PubMed] [Google Scholar]
- Sun, H., Walsh, A. J., Lebel, R. M., Blevins, G., Catz, I., Lu, J.‐Q., … Wilman, A. H. (2015). Validation of quantitative susceptibility mapping with Perls' iron staining for subcortical gray matter. NeuroImage, 105, 486–492. 10.1016/j.neuroimage.2014.11.010 [DOI] [PubMed] [Google Scholar]
- Sun, X., Liu, F., Liu, Q., Gai, Y., Ruan, W., Wimalarathne, D. N., … Lan, X. (2019). Quantitative research of 11C‐CFT and 18F‐FDG PET in Parkinson's disease: A pilot study with NeuroQ software. Frontiers in Neuroscience, 13, 299. [DOI] [PMC free article] [PubMed] [Google Scholar]
- Taha, A. A., & Hanbury, A. (2015). Metrics for evaluating 3D medical image segmentation: Analysis, selection, and tool. BMC Medical Imaging, 15(1), 29. [DOI] [PMC free article] [PubMed] [Google Scholar]
- Wallis, L. I., Paley, M. N., Graham, J. M., Grünewald, R. A., Wignall, E. L., Joy, H. M., & Griffiths, P. D. (2008). MRI assessment of basal ganglia iron deposition in Parkinson's disease. Journal of Magnetic Resonance Imaging: An Official Journal of the International Society for Magnetic Resonance in Medicine, 28(5), 1061–1067. [DOI] [PubMed] [Google Scholar]
- Wei, H., Cao, S., Zhang, Y., Guan, X., Yan, F., Yeom, K. W., & Liu, C. (2019). Learning‐based single‐step quantitative susceptibility mapping reconstruction without brain extraction. NeuroImage, 202, 116064. 10.1016/j.neuroimage.2019.116064 [DOI] [PMC free article] [PubMed] [Google Scholar]
- Wei, H., Dibb, R., Zhou, Y., Sun, Y., Xu, J., Wang, N., & Liu, C. (2015). Streaking artifact reduction for quantitative susceptibility mapping of sources with large dynamic range. NMR in Biomedicine, 28(10), 1294–1303. 10.1002/nbm.3383 [DOI] [PMC free article] [PubMed] [Google Scholar]
- Wu, B., Li, W., Guidon, A., & Liu, C. (2012). Whole brain susceptibility mapping using compressed sensing. Magnetic Resonance in Medicine, 67(1), 137–147. [DOI] [PMC free article] [PubMed] [Google Scholar]
- Xiao, Y., Fonov, V., Bériault, S., Al Subaie, F., Chakravarty, M. M., Sadikot, A. F., … Collins, D. L. (2015). Multi‐contrast unbiased MRI atlas of a Parkinson's disease population. International Journal of Computer Assisted Radiology and Surgery, 10(3), 329–341. [DOI] [PubMed] [Google Scholar]
- Xiao, Y., Fonov, V., Chakravarty, M. M., Beriault, S., Al Subaie, F., Sadikot, A., … Collins, D. L. (2017). A dataset of multi‐contrast population‐averaged brain MRI atlases of a Parkinsons disease cohort. Data in Brief, 12, 370–379. 10.1016/j.dib.2017.04.013 [DOI] [PMC free article] [PubMed] [Google Scholar]
- Yelnik, J., Bardinet, E., Dormont, D., Malandain, G., Ourselin, S., Tandé, D., … Agid, Y. (2007). A three‐dimensional, histological and deformable atlas of the human basal ganglia. I. Atlas construction based on immunohistochemical and MRI data. Neuroimage, 34(2), 618–638. [DOI] [PubMed] [Google Scholar]
- Yushkevich, P. A., Piven, J., Hazlett, H. C., Smith, R. G., Ho, S., Gee, J. C., & Gerig, G. (2006). User‐guided 3D active contour segmentation of anatomical structures: Significantly improved efficiency and reliability. NeuroImage, 31(3), 1116–1128. [DOI] [PubMed] [Google Scholar]
- Zhang, Y., Wei, H., Cronin, M. J., He, N., Yan, F., & Liu, C. (2018). Longitudinal atlas for normative human brain development and aging over the lifespan using quantitative susceptibility mapping. NeuroImage, 171, 176–189. 10.1016/j.neuroimage.2018.01.008 [DOI] [PMC free article] [PubMed] [Google Scholar]
- Zheng, Z., Shemmassian, S., Wijekoon, C., Kim, W., Bookheimer, S. Y., & Pouratian, N. (2014). DTI correlates of distinct cognitive impairments in Parkinson's disease. Human Brain Mapping, 35(4), 1325–1333. [DOI] [PMC free article] [PubMed] [Google Scholar]
Associated Data
This section collects any data citations, data availability statements, or supplementary materials included in this article.
Supplementary Materials
Table S1 Evaluation parameters of subcortical nuclei calculated from the manual segmentation and five co‐registered atlases.
Table S2p‐values of the t‐test for the quantitative parameters in the same ROI between atlases.
Table S3R2 coefficients between average DICE coefficients for intra‐rater and inter‐rater reliability and average volume of subcortical nuclei from the manual segmentation.
Appendix S1 Supporting Information
Data Availability Statement
The data that support the findings of this study are available from the corresponding author upon reasonable request.


