Abstract
Over the past decade, there has been an abundance of research on the difference between age and age predicted using brain features, which is commonly referred to as the “brain age gap.” Researchers have identified that the brain age gap, as a linear transformation of an out‐of‐sample residual, is dependent on age. As such, any group differences on the brain age gap could simply be due to group differences on age. To mitigate the brain age gap's dependence on age, it has been proposed that age be regressed out of the brain age gap. If this modified brain age gap is treated as a corrected deviation from age, model accuracy statistics such as R 2 will be artificially inflated to the extent that it is highly improbable that an R 2 value below .85 will be obtained no matter the true model accuracy. Given the limitations of proposed brain age analyses, further theoretical work is warranted to determine the best way to quantify deviation from normality.
Keywords: age, brain, development, deviation, prediction, residual
To mitigate the brain age gap's dependence on age, it has been proposed that age be regressed out of the brain age gap. If this modified brain age gap is treated as a corrected deviation from age, model accuracy statistics such as R 2 will be artificially inflated to the extent that it is highly improbable that an R 2 value below .85 will be obtained no matter the true model accuracy.
1. INTRODUCTION
Over the past decade, there has been an explosion of research devoted to estimating individuals' ages using features derived from magnetic resonance images (MRIs) of the brain (Franke & Gaser, 2019). From studies using diffusion‐weighted features to complex functional connectivity metrics, the literature is extensive (Cole, 2020; Erus et al., 2015; Irimia, Torgerson, Goh, & van Horn, 2015; Li, Satterthwaite, & Fan, 2018; Lin et al., 2016). While age is easily measured through more conventional means, assessing the appearance of the brain with respect to the natural patterns of development and aging provides a framework for dimension reduction; from hundreds of thousands to millions of MRI measurements, these models aim to provide the age of the brain for each subject as a convenient summary measure. The predicted age from these models has been coined “brain age,” and the difference between age (sometimes referred to as “chronological age”) and brain age is typically referred to as the “brain age gap” (BAG). Predicted ages are calculated using the following fitted model:
where is the predicted age of the ith subject, Bij is the jth brain feature for the ith subject, and f(⋅) is some function of the brain features.
BAG analysis was developed to address two major challenges in neuroscience and medicine: high‐dimensionality, and individual risk assessment. Neuroimaging data are high dimensional, with the average T1‐weighted scan containing approximately 1,200,000 voxels of brain tissue (Cosgrove, Mazure, & Staley, 2007). Importantly, different parts of the brain follow a variety of trajectories across the lifespan (Coupé, Catheline, Lanuza, & Manjón, 2017; Gennatas et al., 2017; Kennedy et al., 2015). Therefore, in order to better predict age, it is beneficial to use more brain features that complement each other (Varikuti et al., 2018). The main motivation, however, behind BAG analyses has been to develop a single number to represent an individual's deviation from some normal trajectory (de Lange & Cole, 2020). This is an admirable goal, since deviating from a normal trajectory may be indicative of or predictive of debilitating disorders (Marquand, Rezek, Buitelaar, & Beckmann, 2016).
Researchers often test whether members of a group tend to have their age overestimated compared to a control group, striving to assess whether the disorder is associated with the brain aging prematurely or lagging behind. For instance, Chung et al. (2018) asked if those at clinical high risk for psychosis had a larger BAG than healthy controls, and Liem et al. (2017) asked if the BAG differed across groups with varying degrees of objective cognitive impairment. Typically, these models are developed using regression or machine learning in one dataset, and are evaluated in a test set. The cross‐validation process involves dividing the training set into k folds, estimating the model parameters on k − 1 folds, applying the fitted model to the remaining fold, and repeating until every participant in the training set has a predicted age. This procedure helps avoid overfitting and reporting an inflated model accuracy statistic. Finally, the trained model is applied on a separate test set to predict age of each individual based on their brain features.
In this article, we further study the BAG with particular attention to its interpretation and its limitations. The BAG is a linear transformation of an out‐of‐sample residual (subsequently referred to as a “prediction error”). As such, it is dependent on the outcome variable (i.e., age) (Le et al., 2018). Therefore, differences in the BAG between groups may be due to differences in the brain, or due to differences in the age distributions across groups (Le et al., 2018; Smith, Vidaurre, Alfaro‐Almagro, Nichols, & Miller, 2019). A recently proposed solution to this problem involves regressing the BAG on age and taking the residuals from this model as a modified BAG (MBAG) that is orthogonal to age (Beheshti, Nugent, Potvin, & Duchesne, 2019; Chung et al., 2018; Liang, Zhang, & Niu, 2019; Smith et al., 2019). We show that this adjustment is problematic, because if this new prediction error is treated as a deviation from a subject's age, which it is not, metrics of model accuracy will be severely inflated.
2. KNOWN LIMITATIONS OF THE BRAIN AGE GAP
BAG analyses have historically failed to account for the fact that the difference between age and predicted age varies as a function of age (Beheshti, Maikusa, & Matsuda, 2018; Cole, Underwood, et al., 2017; Franke, Hagemann, Schleussner, & Gaser, 2015; Gaser et al., 2013; Liem et al., 2017; Nenadić, Dietzek, Langbein, Sauer, & Gaser, 2017; Steffener et al., 2016); however, recently several groups have pointed out that this assumption is false (Le et al., 2018; Liang et al., 2019; Smith et al., 2019). Smith et al. (2019) pointed out an extreme case of this error: when age has truly no relationship with brain features, the difference between age and predicted age (“brain age gap”) is a linear function of age, which implies that age explains 100% of the variance in the BAG. Smith et al. (2019) note that any subsequent analyses studying the relationship between this gap and other metrics is equivalent to relating a linear transformation of age to other metrics.
To flesh out the gravity of this observation, consider an example: If age does not vary as a function of any of the brain parameters, all coefficients, aside from the intercept, will be close to zero with high probability, and the intercept will be close to the mean age of the training sample. Let A i be the age of the ith subject, B ij the jth brain feature for the ith subject, ε i random error, and the mean age of the training sample. The brain age model is thus:
| (1) |
And the fitted values are:
| (2) |
For simplicity, let us assume that the coefficients are estimated to be exactly zero. Suppose the mean age of the training sample is 10 years old. Every person will have an estimated age of 10, so their BAG, , will be 10 − A i. Thus, the BAGs are as follows: 15‐year‐olds have a BAG of −5, 10‐year‐olds have a BAG of 0, 5‐year‐olds have a BAG of 5, and so forth. Older participants are estimated as being younger than they are, and younger participants as older. The BAG is a linear transformation of a residual (i.e., ), which by definition varies as a function of the outcome variable, in this case age. This emphasizes the complexity of interpreting the BAG. Suppose two groups, A and B, are to be compared with respect to the BAG. If the brain features are linearly independent of age, then testing for differences in the BAG is equivalent to testing, “Is the mean age of group A different from the mean age of group B?” In cases where the brain features are linearly associated with age, the group comparison of BAGs may be viewed as similar to asking “Controlling for the brain features, is the mean age of group A different from the mean age of group B?” As regression of out‐of‐sample residuals (derived from a previous model) is not equivalent to multiple regression, this description is not quite correct (Chen, Hribar, & Melessa, 2018; Freckleton, 2002). Nonetheless, the interpretation of the BAG remains difficult.
Whether or not the brain parameters under study are associated with age, the predicted age for every subject will still be shrunk toward the mean age of the training sample. This is referred to as regression toward the mean, and was first documented by Sir Francis Galton in 1886 (Bland & Altman, 1994). As Liang et al. (2019) noted, this phenomenon is a common feature of many good models. Therefore, older subjects will have negative BAG estimates on average simply because they are older, while younger subjects will have positive estimates on average. Note that the example of brain features being unable to predict age is unrealistic, and is used merely for illustration purposes. Out of sample R 2s typically fall between .4 and .9, and vary by the brain features and age range utilized (Alam, Nakano, & Kobashi, 2016; Aycheh et al., 2018; Beheshti et al., 2018; Brown et al., 2012; Cole, Poudel, et al., 2017; Dean III et al., 2015; Dosenbach et al., 2010; Guggenmos et al., 2017; Kiehl et al., 2018; Kwak, Kim, Chey, & Youm, 2018; Lancaster, Lorenz, Leech, & Cole, 2018; Pardoe et al., 2017; Richard et al., 2018; Rudolph et al., 2017; Steffener et al., 2016).
It is important to note that regression toward the mean is not a failure, but a feature, of regression and related methods. If there is any randomness in a process, observations will tend toward the mean of the outcome variable rather than remain as extreme as they were upon initial sampling (Stigler, 1997). Regression toward the mean is a feature of regression that is actively useful for prediction. Since age is known with certainty, the notion of predicting it makes the construction of a residual awkward because residuals are an estimate of random error. Thus, as we continue to use age prediction as a means to reduce dimensionality, it is important to understand the limitations of using age as an outcome variable and subsequent associated analyses. Recognizing the dependence of the BAG on age, researchers have begun to develop methods to mitigate the age dependence of the BAG (Beheshti et al., 2019; Le et al., 2018; Smith et al., 2019). However, these methods require careful theoretical consideration as we demonstrate in the next section.
3. RISKS OF USING AN MODIFIED BRAIN AGE GAP
To mitigate the residuals' dependence on age, some researchers apply the following algorithm (Beheshti et al., 2019; Chung et al., 2018; Liang et al., 2019; Smith et al., 2019) (see the appendix for details on Beheshti et al.'s (2019) method). First, a training sample is used to estimate a mapping f(⋅) from brain features to age. Then, for a left out subject i with brain data B i1, B i2, …, B ip, the predicted age (“brain age”) is estimated as :
| (3) |
Then the ith subject's BAG is
| (4) |
Recognizing the BAG's dependence on age, the researcher poses a linear model of the BAG on age:
| (5) |
where estimated parameters and are found from a regression using training data, and δ i is random error. Thus, the effect of age is removed, producing the MBAG:
| (6) |
which, as the prediction error from model (5), is approximately uncorrelated with age (only exactly uncorrelated if test data is used to estimate α and γ). Because the MBAG has been interpreted as a corrected residual, the MBAG is added to (or subtracted from; equivalent in correlation, see Supplement) age. This new variable is then referred to as the corrected predicted age:
| (7) |
Because the researcher perceives this predicted age as corrected, they correlate it with age to assess their model's accuracy in predicting age. We will refer to as the “modified predicted age” and will show below why this age estimation is flawed.
The MBAG is by no means a more accurate measure of an out‐of‐sample residual, or prediction error (i.e., the “brain age gap”). The BAG itself is more dependent on age the less the brain features are associated with age. Again, consider the extreme case where age is independent of the brain features. Then, the BAG is completely determined by age, as explained in the previous section. If the MBAG is treated as an estimate of the deviation from age, the reported model accuracy (e.g., ) will always be inflated relative to the true model accuracy, and often drastically so (see Table 1 for details on papers that have reported inflated model accuracy statistics). When age has no true dependence on the brain features, the population covariance between age and predicted age, , is zero. However, when the MBAG is treated as the deviation from age, A i + MBAGi, age and modified predicted age, , have an approximately perfect correlation of 1.
TABLE 1.
Papers reporting inflated model accuracy statistics
| Paper | Before modification | After modification | ||
|---|---|---|---|---|
| Beheshti et al. (2019) |
|
|
||
| Chung et al. (2018) |
|
|
||
| Liang et al. (2019) | MAE =1.57 | MAE =1.32 | ||
| Smith et al. (2019) |
|
|
Abbreviation: MAE, mean absolute error.
In fact, the inflated correlation can be directly computed as a function of the sample estimates of the covariance between age and predicted age, the variance of age, and the variance of predicted age (see Supplement for derivations):
| (8) |
If and are estimated in the test set, Equation (8) can be further simplified:
| (9) |
The equation can be simplified even further if is a linear estimator:
| (10) |
To illustrate the inflated correlation effect and confirm that Equation (8) is correct, a series of simulations were run to compare the transformations that researchers describe performing to the above equation using R version 3.6.2 (R Core Team, 2019). Training and testing sets of 10,000 samples were simulated from each of a series of bivariate normal distributions, where the true correlation between age and the brain feature was varied between 0 and 1, with the correlation between age and the modified predicted age, , in the test set being the key outcome measure recorded. All model parameters were estimated in the training set. Since there is only one brain feature, the correlation between age and predicted age is the same as the correlation between age and the brain feature. Results using a single brain feature are detailed in Figure 1. A single brain feature was used so as to have easy control over the correlation between age and predicted age, but note that this result generalizes to any number of brain features. For a set of correlations between 0 and 1, the correlation between age and the modified predicted age, , was calculated using the theoretical formulation in Equation (8) (black line), and the inflated correlation was obtained using the previously described transformations (grey dots). The identity line is displayed to aid in visualizing that the inflated correlation is larger than the true correlation. The simulations confirmed that the theoretical formulation in Equation (8) is equivalent to the transformations researchers have described. In addition, Figure 1 illustrates that the degree of inflation is much greater for models that have lower values of Corr than for models that have higher values of Corr.
FIGURE 1.
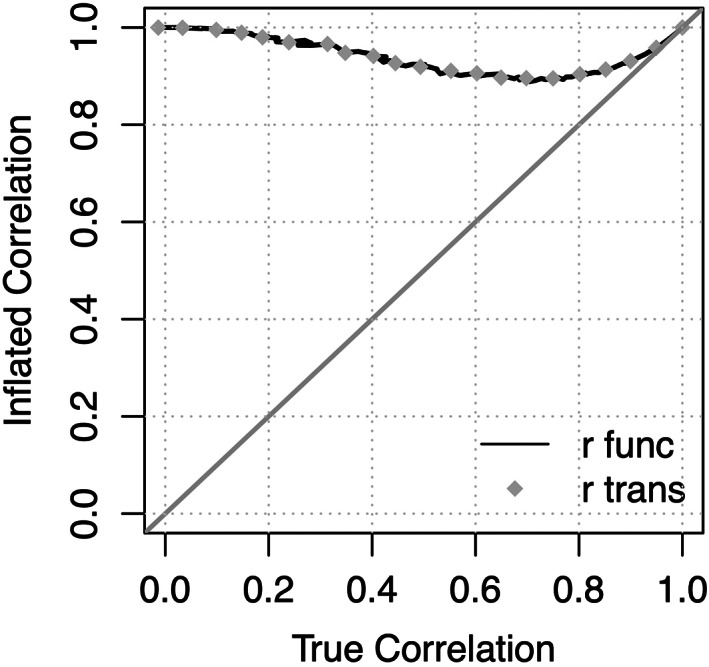
Inflated correlation, Corr , is a function of the true correlation, Corr. The inflated correlation is the correlation between age and the modified predicted age. The true correlation is the correlation between age and predicted age. To illustrate that the series of transformations that researchers perform is equivalent to Equation (8), correlations using both are plotted. r func is using Equation (8), and r trans is using the series of transformations. The identity line is displayed for ease of comparing the axes
Additional analyses were run using the Philadelphia Neurodevelopmental Cohort (PNC) to illustrate the findings in brain MRI data. Sample details, neuroimaging protocols, and processing can be found in Calkins et al. (2015), Gur et al. (2021), and Satterthwaite et al. (2014). Briefly, participants ages 8–22 were recruited through their primary care providers in the Philadelphia area. After complete description of the study, written informed consent was obtained from participants aged ≥18, and written assent and parental permission were obtained from children aged <18 and their parents/legal guardian. The University of Pennsylvania and Children's Hospital of Philadelphia Institutional Review Boards approved all procedures. Subjects were excluded for the purposes of these analyses if their cognitive assessment was conducted more than a year before or after their neuroimaging data was collected, or if their structural image did not pass stringent quality assurance measures. T1‐weighted images (voxel dimensions: 0.9375 × 0.9375 × 1) were obtained using a magnetization prepared, rapid‐acquisition gradient‐echo sequence. Receive coil shading was reduced by selecting the Siemens prescan normalize option, which is based on a body coil reference scan. Then, 132 regional volume values were extracted using the Advanced Normalization Tools software package (Tustison et al., 2013; Wang & Yushkevich, 2013), including cortical, subcortical, white matter, ventricle, and cerebellar volumes.
Elastic net models to predict age were built on youths ages 8–22 without a history of mental illness (“typically developing”). Hyperparameters were chosen using repeated five‐fold cross‐validation on the typically developing youth as implemented in the “caret” package, version 6.0‐86 (Kuhn, 2012). Then, a linear regression of the BAG on age was fit in the typically developing subjects (N = 317). Using the fitted values for the parameters from these models, the transformations previously described were applied to youth who met screening criteria for lifetime instance of a mental illness (N = 862). This real data example confirmed the theoretical and simulation findings (see Figure 2). Prior to any modification, the correlation between age (A) and predicted age () was .77. After applying the modifications, the correlation became .88. There were no differences between the typically developing youth and youth with a history of mental illness on age (t = − 1.05, p = 0.29), the BAG (t = 0.72, p = 0.47), or the MBAG (t = 0.09, p = 0.39). Age and performance on the complex cognition tasks were highly associated (r = 0.54, p < .0001). After regressing the brain features out of age and multiplying by negative one—or constructing the BAG—this association weakened (r = − .30, p < .0001). The MBAG and performance on the complex cognition tasks were not associated (r = − .01, p = 0.71). These results indicate that the association between cognition and the BAG are driven by the association between age and cognitive performance. As such, it is critical that readers of past literature note whether or not age was controlled for when testing for effects on the BAG, as this has not always been common practice (e.g., Beheshti et al., 2018; Cole, Underwood, et al., 2017; Franke et al., 2015; Gaser et al., 2013; Liem et al., 2017; Nenadić et al., 2017; Steffener et al., 2016).
FIGURE 2.
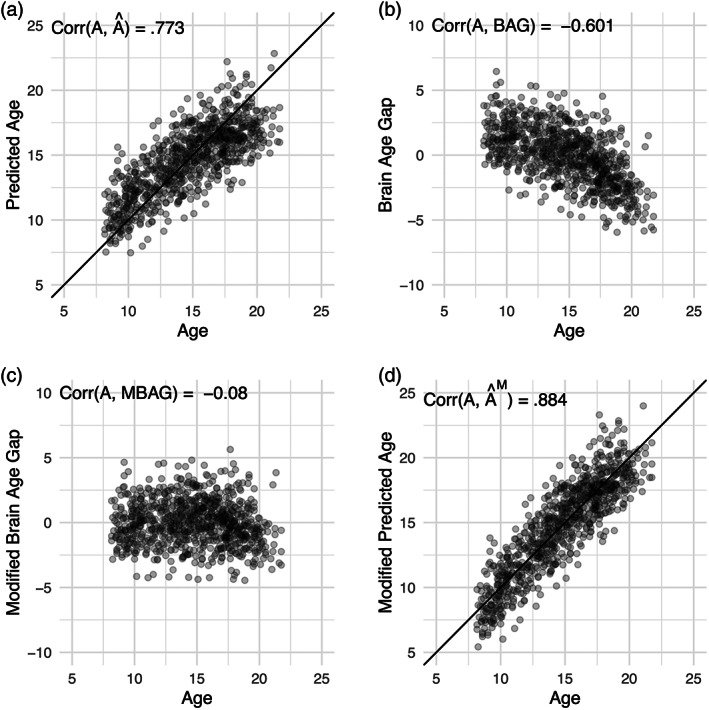
The inflated correlation finding was replicated in the Philadelphia Neurodevelopmental Cohort. Plotted are values for age (A), predicted age (), the brain age gap (BAG), the modified BAG (MBAG) and the modified predicted age () in the subset of participants who met screening criteria for an instance of mental illness in their lifetime. Panel (a) displayed the correlation between age and predicted age; Panel (b) the correlation between age and the brain age gap; Panel (c) the correlation between age and the modified brain age gap; and Panel (d) the correlation between age and the modified predicted age. The identity line is displayed in Panels (a) and (d)
Other common methods for addressing the fact that the BAG is correlated with age include scaling the predicted age by the slope and intercept from the regression of predicted age on age (de Lange & Cole, 2020), and including age as a covariate when testing for group differences on the BAG (Le et al., 2018). de Lange and Cole (2020) and Cole et al. (2018) suggest fitting the following regression:
| (11) |
where θ is the coefficient for age, λ is the intercept, η i is random error, and predicted age () is treated as a random variable. Then, they calculate a revised predicted age () as follows:
| (12) |
As de Lange and Cole (2020) demonstrate, this results in a revised predicted age that is as exactly correlated with age as the original predicted age. This is the case because correlations are invariant to linear transformations. Cole et al. (2018) go on to calculate the revised BAG as follows (though this is not stated explicitly in the manuscripts, it can be inferred from how they define brain‐PAD, i.e., the BAG):
| (13) |
This results in a revised BAG that is uncorrelated with age. In the PNC, the correlation between age and both the predicted age () and the revised predicted age () in the group of youth with mental illness was 0.77. The correlation between the revised BAG and age was −0.08. Note that it is not exactly zero because the parameters in Equation (11) were estimated in the typically developing youth.
Le et al. (2018) suggest either testing for group differences on the MBAG, or preferably controlling for age when testing for group differences on the BAG. The latter approach is not susceptible to researchers misinterpreting the reduced variability of the MBAG as an improvement in prediction accuracy because the MBAG is never calculated. In the PNC, controlling for age results in a nonsignificant relationship between the BAG and performance on the complex cognition tasks (t = 1.066, p = 0.29), similar to the result obtained from testing for a correlation between the MBAG and cognition. While the transformations and analyses in both Cole et al. (2018) and Le et al. (2018) are not susceptible to being misinterpreted as producing an improvement in model accuracy, there is still much work to be done to determine whether either speaks to advanced or delayed development.
4. CONCLUSION
We have shown that a modified predicted age (“brain age”) based on a regression adjustment of the BAG results in a correlation between the modified predicted age and age never falling much below 0.85 regardless of the original predicted age and age correlation. Further, the interpretability of the modified brain age gap (MBAG) itself is limited by the fact that it is a prediction error from a regression to remove the effects of age from a residual obtained through a regression to predict age. By virtue of these limitations, we suggest that the modified version may not provide useful information about precocity or delay in brain development. In light of this, as well as the complexities associated with interpretations of the BAG and its dependence on age, we suggest that further methodological and theoretical work is warranted.
Many other transformations have been developed to mitigate the downstream effects of BAG's dependence on age (de Lange & Cole, 2020). Some are not susceptible to the inflated correlation issue described in this work. Methods include scaling the predicted age by the slope and intercept from the regression of predicted age on age (see equation (5) in de Lange and Cole (2020)), and including age as a covariate when testing for group differences in BAG (Le et al., 2018). The former results in a new BAG estimate that is uncorrelated with age, and the latter ensures that any group differences found on the BAG will be linearly independent of age. More fundamentally, though, the need for age‐correction in BAG comparisons highlights the question under study and the methodology employed. For example, controlling for age when testing for group differences on an in‐sample estimated BAG is the two‐step regression equivalent of including age as a covariate in a multiple regression with brain features predicting age. This inherent circularity is troublesome and emphasizes the need for methods that are designed to directly answer questions about similarity between brains of different age groups and disease states.
CONFLICT OF INTEREST
The authors declare no conflict of interest.
AUTHOR CONTRIBUTIONS
Ellyn R. Butler: Conceptualized the work, wrote derivations, and wrote the manuscript. Andrew Chen, Thomas E. Nichols, and Russell T. Shinohara: Wrote derivations, and provided feedback on the framing of the work. Rabie Ramadan, Trang T. Le, Fengqing Zhang, and Haochang Shou: Provided statistical insights and edited the manuscript. Theodore D. Satterthwaite: Oversaw the processing of the neuroimaging data and edited the manuscript. Kosha Ruparel, Tyler M. Moore, and Ruben C. Gur: Provided inspiration for, and assisted in the framing of the work.
ACKNOWLEDGMENTS
The authors thank Dr. Michael Stein, members of the Brain Behavior Laboratory and attendees of Data Club for their questions and feedback. This work was supported by the National Institute of Mental Health (grant numbers MH107235, MH117014, MH119219, MH123550, and MH112847); and National Institute of Neurological Disorders and Stroke (grant numbers NS060910 and NS112274).
All code can be found in https://github.com/PennBBL/brainAgeGapMistake.
Beheshti et al. correlation
Beheshti et al. (2019) suggest subtracting from , and calling this new value the corrected predicted age:
Therefore, their method is equivalent to Equation (8).
Adding and subtracting MBAG from age results in the same inflated correlation with age
Modified predicted age has been calculated in the literature as either MBAGi = A i − BAGi or MBAGi = A i + BAGi. In both cases, the main results from the paper apply since the correlation between age and the modified predicted age using either formula is the same. We have that
 |
 |
which follows from the fact that MBAGi is a residual from regression of BAGi on A i and thus MBAGi is orthogonal to A i or equivalently, Cov(A, MBAG) = 0. Note that this result is only approximate when the regression of BAG on age is done in the training set.
Derivation of Equation (8)
Derivations of Equations (9) and (10)
The following derivation involves the algebraic manipulation of the sample estimates and not expectations. Assuming that the linear regression of BAG on age has been estimated with the testing data, then
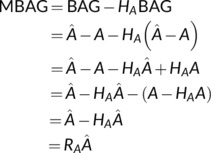 |
where H A = A(A T A)−1 A T is the hat matrix for the regression on age, A = [1 A], and R A = I − H A is the corresponding residual forming matrix.
We first note that
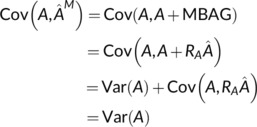 |
where the last equality holds due to the orthogonality of A and R A.
Then, consider:
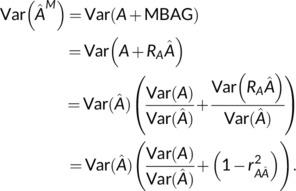 |
Then, Equation (9) is found as
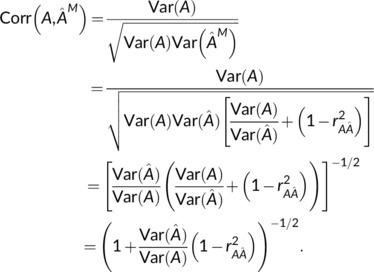 |
For insight on the term, note that shrinkage will generally mean this term is less than one. Moreover, if were found with a linear regression on the testing data, that is, where X are brain features, then this ratio is exactly the squared correlation,
producing Equation (10).
In this setting, when both brain age and MBAG are determined from testing data using linear regression, the correlation of A and can never fall below . Of course, in practice, held‐out training data is used to learn the brain‐age relationship, so a regression prediction would instead have the form , where X in and A in are held‐in training data, but still provides a useful starting point for exploring the parameters in the expression for Corr .
Finally, note that the equality of and holds not just for linear regression, but any linear estimator. Specifically, if there exists an idempotent H X () such that 1 T H X = 1 and , then
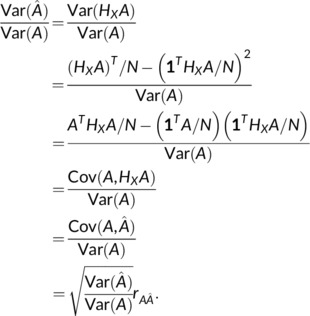 |
And thus
Butler, E. R., Chen, A., Ramadan, R., Le, T. T., Ruparel, K., Moore, T. M., Satterthwaite, T. D., Zhang, F., Shou, H., Gur, R. C., Nichols, T. E., & Shinohara, R. T. (2021). Pitfalls in brain age analyses. Human Brain Mapping, 42(13), 4092–4101. 10.1002/hbm.25533
Thomas E. Nichols and Russell T. Shinohara are co‐senior authors.
[Correction added on 9 July 2021, after first online publication: Minor edits were made in the text.]
Funding information National Institute of Mental Health, Grant/Award Numbers: MH107235, MH112847, MH117014, MH119219, MH123550; National Institute of Neurological Disorders and Stroke, Grant/Award Numbers: NS060910, NS112274
DATA AVAILABILITY STATEMENT
The data that support the findings of this study are available from the Brain Behavior Laboratory at the University of Pennsylvania. Restrictions apply to the availability of these data, which were used under license for this study. Data are available (https://redcap.med.upenn.edu/surveys/?s=74EEFPNCMH) with the permission of the Brain Behavior Laboratory at the University of Pennsylvania.
REFERENCES
- Alam, S. B., Nakano, R., & Kobashi, S. (2016). Brain age estimation using multiple regression analysis in brain MR images. IJICIC, 12(4), 1385–1396. [Google Scholar]
- Aycheh, H. M., Seong, J.‐K., Shin, J.‐H., Na, D. L., Kang, B., Seo, S. W., & Sohn, K.‐A. (2018). Biological brain age prediction using cortical thickness data: A large scale cohort study. Frontiers in Aging Neuroscience, 10, 252. [DOI] [PMC free article] [PubMed] [Google Scholar]
- Beheshti, I., Maikusa, N., & Matsuda, H. (2018). The association between “brain‐age score”(bas) and traditional neuropsychological screening tools in Alzheimer's disease. Brain and Behavior, 8(8), e01020. [DOI] [PMC free article] [PubMed] [Google Scholar]
- Beheshti, I., Nugent, S., Potvin, O., & Duchesne, S. (2019). Bias‐adjustment in neuroimaging‐based brain age frameworks: A robust scheme. NeuroImage: Clinical, 24, 102063. [DOI] [PMC free article] [PubMed] [Google Scholar]
- Bland, J. M., & Altman, D. G. (1994). Regression towards the mean. BMJ, 308(6942), 1499. [DOI] [PMC free article] [PubMed] [Google Scholar]
- Brown, T. T., Kuperman, J. M., Chung, Y., Erhart, M., McCabe, C., Hagler Jr, … Dale, A. M. (2012). Neuroanatomical assessment of biological maturity. Current Biology, 22(18), 1693–1698. [DOI] [PMC free article] [PubMed] [Google Scholar]
- Calkins, M. E., Merikangas, K. R., Moore, T. M., Burstein, M., Behr, M. A., Satterthwaite, T. D., … Gur, R. E. (2015). The Philadelphia Neurodevelopmental Cohort: Constructing a deep phenotyping collaborative. Journal of Child Psychology and Psychiatry, 56(12), 1356–1369. [DOI] [PMC free article] [PubMed] [Google Scholar]
- Chen, W., Hribar, P., & Melessa, S. (2018). Incorrect inferences when using residuals as dependent variables. Journal of Accounting Research, 56(3), 751–796. 10.1111/1475-679X.12195 [DOI] [Google Scholar]
- Chung, Y., Addington, J., Bearden, C. E., Cadenhead, K., Cornblatt, B., Mathalon, D. H., … Cannon, T. D. (2018). Use of machine learning to determine deviance in neuroanatomical maturity associated with future psychosis in youths at clinically high risk. JAMA Psychiatry, 75(9), 960–968. 10.1001/jamapsychiatry.2018.1543 [DOI] [PMC free article] [PubMed] [Google Scholar]
- Cole, J. H. (2020). Multi‐modality neuroimaging brain‐age in UK Biobank: Relationship to biomedical, lifestyle and cognitive factors. Neurobiology of Aging, 92, 34–42. [DOI] [PMC free article] [PubMed] [Google Scholar]
- Cole, J. H., Poudel, R. P., Tsagkrasoulis, D., Caan, M. W., Steves, C., Spector, T. D., & Montana, G. (2017). Predicting brain age with deep learning from raw imaging data results in a reliable and heritable biomarker. NeuroImage, 163, 115–124. [DOI] [PubMed] [Google Scholar]
- Cole, J. H., Ritchie, S. J., Bastin, M. E., Hernández, M. V., Maniega, S. M., Royle, N., & Deary, I. J. (2018). Brain age predicts mortality. Molecular Psychiatry, 23(5), 1385–1392. [DOI] [PMC free article] [PubMed] [Google Scholar]
- Cole, J. H., Underwood, J., Caan, M. W., De Francesco, D., van Zoest, R. A., Leech, R., … Sharp, D. J. (2017). Increased brain‐predicted aging in treated hiv disease. Neurology, 88(14), 1349–1357. [DOI] [PMC free article] [PubMed] [Google Scholar]
- Cosgrove, K. P., Mazure, C. M., & Staley, J. K. (2007). Evolving knowledge of sex differences in brain structure. Biological Psychiatry, 62(8), 847–855. 10.1016/j.biopsych.2007.03.001.Evolving [DOI] [PMC free article] [PubMed] [Google Scholar]
- Coupé, P., Catheline, G., Lanuza, E., & Manjón, J. V. (2017). Towards a unified analysis of brain maturation and aging across the entire lifespan: A MRI analysis. Human Brain Mapping, 38(11), 5501–5518. 10.1002/hbm.23743 [DOI] [PMC free article] [PubMed] [Google Scholar]
- de Lange, A.‐M. G., & Cole, J. H. (2020). Commentary: Correction procedures in brain‐age prediction. NeuroImage: Clinical, 26. [DOI] [PMC free article] [PubMed] [Google Scholar]
- Dean, D. C., III, O'Muircheartaigh, J., Dirks, H., Waskiewicz, N., Lehman, K., Walker, L., … Deoni, S. C. (2015). Estimating the age of healthy infants from quantitative myelin water fraction maps. Human Brain Mapping, 36(4), 1233–1244. [DOI] [PMC free article] [PubMed] [Google Scholar]
- Dosenbach, N. U., Nardos, B., Cohen, A. L., Fair, D. A., Power, J. D., Church, J. A., … Schlaggar, B. L. (2010). Prediction of individual brain maturity using fMRI. Science, 329(5997), 1358–1361. [DOI] [PMC free article] [PubMed] [Google Scholar]
- Erus, G., Battapady, H., Satterthwaite, T. D., Hakonarson, H., Gur, R. E., Davatzikos, C., & Gur, R. C. (2015). Imaging patterns of brain development and their relationship to cognition. Cerebral Cortex, 25(6), 1676–1684. 10.1093/cercor/bht425 [DOI] [PMC free article] [PubMed] [Google Scholar]
- Franke, K., & Gaser, C. (2019). Ten years of brainage as a neuroimaging biomarker of brain aging: What insights have we gained? Frontiers in Neurology, 10. 10.3389/fneur.2019.00789 [DOI] [PMC free article] [PubMed] [Google Scholar]
- Franke, K., Hagemann, G., Schleussner, E., & Gaser, C. (2015). Changes of individual brainage during the course of the menstrual cycle. NeuroImage, 115, 1–6. [DOI] [PubMed] [Google Scholar]
- Freckleton, R. P. (2002). On the misuse of residuals in ecology: Regression of residuals vs. multiple regression. Journal of Animal Ecology, 71(3), 542–545. 10.1046/j.1365-2656.2002.00618.x [DOI] [Google Scholar]
- Gaser, C., Franke, K., Klöppel, S., Koutsouleris, N., Sauer, H., & Alzheimer's Disease Neuroimaging Initiative (2013). Brainage in mild cognitive impaired patients: Predicting the conversion to Alzheimer's disease. PLoS One, 8(6), e67346. [DOI] [PMC free article] [PubMed] [Google Scholar]
- Gennatas, E. D., Avants, B. B., Wolf, D. H., Satterthwaite, T. D., Ruparel, K., Ciric, R., … Gur, R. C. (2017). Age‐related effects and sex differences in gray matter density, volume, mass, and cortical thickness from childhood to young adulthood. Journal of Neuroscience, 37(20), 5065–5073. 10.1523/JNEUROSCI.3550-16.2017 [DOI] [PMC free article] [PubMed] [Google Scholar]
- Guggenmos, M., Schmack, K., Sekutowicz, M., Garbusow, M., Sebold, M., Sommer, C., … Sterzer, P. (2017). Quantitative neurobiological evidence for accelerated brain aging in alcohol dependence. Translational Psychiatry, 7(12), 1–7. [DOI] [PMC free article] [PubMed] [Google Scholar]
- Gur, R. C., Butler, E. R., Moore, T. M., Rosen, A. F., Ruparel, K., Satterthwaite, T. D., … Gur, R. E. (2021). Structural and functional brain parameters related to cognitive performance across development: Replication and extension of the parieto‐frontal integration theory in a single sample. Cerebral Cortex, 31(3), 1444–1463. [DOI] [PMC free article] [PubMed] [Google Scholar]
- Irimia, A., Torgerson, C. M., Goh, S.‐Y. M., & van Horn, J. D. (2015). Statistical estimation of physiological brain age as a descriptor of senescence rate during adulthood. Brain Imaging and Behavior, 9(4), 678–689. [DOI] [PMC free article] [PubMed] [Google Scholar]
- Kennedy, K. M., Rodrigue, K. M., Bischof, G. N., Hebrank, A. C., Reuter‐Lorenz, P. A., & Park, D. C. (2015). Age trajectories of functional activation under conditions of low and high processing demands: An adult lifespan fMRI study of the aging brain. NeuroImage, 104, 21–34. 10.1016/j.neuroimage.2014.09.056 [DOI] [PMC free article] [PubMed] [Google Scholar]
- Kiehl, K. A., Anderson, N. E., Aharoni, E., Maurer, J. M., Harenski, K. A., Rao, V., … Steele, V. R. (2018). Age of gray matters: Neuroprediction of recidivism. NeuroImage: Clinical, 19, 813–823. [DOI] [PMC free article] [PubMed] [Google Scholar]
- Kuhn, M. (2012). The caret package. Vienna, Austria: R Foundation for Statistical Computing; Retrieved from https://cran.r-project.org/package=caret [Google Scholar]
- Kwak, S., Kim, H., Chey, J., & Youm, Y. (2018). Feeling how old i am: Subjective age is associated with estimated brain age. Frontiers in Aging Neuroscience, 10, 168. [DOI] [PMC free article] [PubMed] [Google Scholar]
- Lancaster, J., Lorenz, R., Leech, R., & Cole, J. H. (2018). Bayesian optimization for neuroimaging pre‐processing in brain age classification and prediction. Frontiers in Aging Neuroscience, 10, 28. [DOI] [PMC free article] [PubMed] [Google Scholar]
- Le, T. T., Kuplicki, R. T., McKinney, B. A., Yeh, H.‐W., Thompson, W. K., & Paulus, M. P. (2018). A nonlinear simulation framework supports adjusting for age when analyzing BrainAGE. Frontiers in Aging Neuroscience, 10(October), 1–11. 10.3389/fnagi.2018.00317 [DOI] [PMC free article] [PubMed] [Google Scholar]
- Li, H., Satterthwaite, T. D., & Fan, Y. (2018). Brain age prediction based on resting‐state functional connectivity patterns using convolutional neural networks. In 2018 IEEE 15th International Symposium on Biomedical Imaging (ISBI 2018) . [DOI] [PMC free article] [PubMed]
- Liang, H., Zhang, F., & Niu, X. (2019, aug). Investigating systematic bias in brain age estimation with application to post‐traumatic stress disorders. Human Brain Mapping, 40(11), 3143–3152. 10.1002/hbm.24588 [DOI] [PMC free article] [PubMed] [Google Scholar]
- Liem, F., Varoquaux, G., Kynast, J., Beyer, F., Kharabian Masouleh, S., Huntenburg, J. M., … Margulies, D. S. (2017). Predicting brain‐age from multimodal imaging data captures cognitive impairment. NeuroImage, 148(July 2016), 179–188. 10.1016/j.neuroimage.2016.11.005 [DOI] [PubMed] [Google Scholar]
- Lin, L., Jin, C., Fu, Z., Zhang, B., Bin, G., & Wu, S. (2016). Predicting healthy older adult's brain age based on structural connectivity networks using artificial neural networks. Computer Methods and Programs in Biomedicine, 125, 8–17. [DOI] [PubMed] [Google Scholar]
- Marquand, A. F., Rezek, I., Buitelaar, J., & Beckmann, C. F. (2016). Understanding heterogeneity in clinical cohorts using normative models: Beyond case‐control studies. Biological Psychiatry, 80(7), 552–561. 10.1016/j.biopsych.2015.12.023 [DOI] [PMC free article] [PubMed] [Google Scholar]
- Nenadić, I., Dietzek, M., Langbein, K., Sauer, H., & Gaser, C. (2017). Brainage score indicates accelerated brain aging in schizophrenia, but not bipolar disorder. Psychiatry Research: Neuroimaging, 266, 86–89. [DOI] [PubMed] [Google Scholar]
- Pardoe, H. R., Cole, J. H., Blackmon, K., Thesen, T., Kuzniecky, R., & Human Epilepsy Project Investigators. (2017). Structural brain changes in medically refractory focal epilepsy resemble premature brain aging. Epilepsy Research, 133, 28–32. [DOI] [PubMed] [Google Scholar]
- R Core Team . (2019). R: A language and environment for statistical computing [Computer software manual]. Vienna, Austria: Retrieved from https://www.R-project.org/ [Google Scholar]
- Richard, G., Kolskår, K., Sanders, A.‐M., Kaufmann, T., Petersen, A., Doan, N. T., … Westlye, L. T. (2018). Assessing distinct patterns of cognitive aging using tissue‐specific brain age prediction based on diffusion tensor imaging and brain morphometry. Peer J, 6, e5908. [DOI] [PMC free article] [PubMed] [Google Scholar]
- Rudolph, M. D., Miranda‐Domínguez, O., Cohen, A. O., Breiner, K., Steinberg, L., Bonnie, R. J., … Fair, D. A. (2017). At risk of being risky: The relationship between “brain age” under emotional states and risk preference. Developmental Cognitive Neuroscience, 24, 93–106. [DOI] [PMC free article] [PubMed] [Google Scholar]
- Satterthwaite, T. D., Elliott, M. A., Ruparel, K., Loughead, J., Prabhakaran, K., Calkins, M. E., … Gur, R. E. (2014). Neuroimaging of the Philadelphia Neurodevelopmental Cohort. Neuroimage, 86, 544–553. [DOI] [PMC free article] [PubMed] [Google Scholar]
- Smith, S. M., Vidaurre, D., Alfaro‐Almagro, F., Nichols, T. E., & Miller, K. L. (2019). Estimation of brain age delta from brain imaging. NeuroImage, 200, 528–539. 10.1016/j.neuroimage.2019.06.017 [DOI] [PMC free article] [PubMed] [Google Scholar]
- Steffener, J., Habeck, C., O'Shea, D., Razlighi, Q., Bherer, L., & Stern, Y. (2016). Differences between chronological and brain age are related to education and self‐reported physical activity. Neurobiology of Aging, 40, 138–144. [DOI] [PMC free article] [PubMed] [Google Scholar]
- Stigler, S. (1997). Regression towards the mean, historically considered. Statistical Methods in Medical Research, 6, 103–114. [DOI] [PubMed] [Google Scholar]
- Tustison, N. J., Avants, B. B., Cook, P. A., Song, G., Das, S., van Strien, N., … Gee, J. C. (2013). The ANTs cortical thickness processing pipeline. In Medical imaging 2013: Biomedical Applications in Molecular, Structural, and Functional Imaging (Vol. 8672, p. 86720K). International Society for Optics and Photonics. [Google Scholar]
- Varikuti, D. P., Genon, S., Sotiras, A., Schwender, H., Hoffstaedter, F., Patil, K. R., … Eickhoff, S. B. (2018). Evaluation of non‐negative matrix factorization of grey matter in age prediction. NeuroImage, 173(March), 394–410. 10.1016/j.neuroimage.2018.03.007 [DOI] [PMC free article] [PubMed] [Google Scholar]
- Wang, H., & Yushkevich, P. (2013). Multi‐atlas segmentation with joint label fusion and corrective learning—An open source implementation. Frontiers in Neuroinformatics, 7, 27. [DOI] [PMC free article] [PubMed] [Google Scholar]
Associated Data
This section collects any data citations, data availability statements, or supplementary materials included in this article.
Data Availability Statement
The data that support the findings of this study are available from the Brain Behavior Laboratory at the University of Pennsylvania. Restrictions apply to the availability of these data, which were used under license for this study. Data are available (https://redcap.med.upenn.edu/surveys/?s=74EEFPNCMH) with the permission of the Brain Behavior Laboratory at the University of Pennsylvania.


