

Abstract
Background:
Family history (FH) is an important risk factor for the development of alcohol use disorder (AUD). A variety of dichotomous and density measures of FH have been used to predict alcohol outcomes; yet a systematic comparison of these FH measures is lacking. We compared four density and four commonly-used dichotomous FH measures and examined variations by gender and race/ethnicity in their associations with age of onset of regular drinking, parietal P3 amplitude to visual target, and likelihood of developing AUD.
Methods:
Data from the Collaborative Study on the Genetics of Alcoholism (COGA) were utilized to compute the density and dichotomous measures. Only subjects and their family members with DSM-5 AUD diagnostic information obtained through direct interviews using the Semi-Structured Assessment of Genetics of Alcoholism (SSAGA) were included in the study. Area under receiver operating characteristic curves were used to compare the diagnostic accuracy of FH measures at classifying DSM-5 AUD diagnosis. Logistic and linear regression models were used to examine associations of FH measures with alcohol outcomes.
Results:
Density measures had greater diagnostic accuracy at classifying AUD diagnosis while dichotomous measures presented diagnostic accuracy closer to random chance. Both dichotomous and density measures were significantly associated with likelihood of AUD, early onset of regular drinking, and low parietal P3 amplitude but density measures presented consistently more robust associations. Further, variations in these associations were observed such that among males (vs. females) and Whites (vs. Blacks), associations of alcohol outcomes with density (vs. dichotomous) measures were greater in magnitude.
Conclusions:
Density (vs. dichotomous) measures seem to present more robust associations with alcohol outcomes. However, associations of dichotomous and density FH measures with different alcohol outcomes (behavioral vs. neural) varied across gender and race/ethnicity. These findings have great applicability for alcohol research examining FH of AUD.
Keywords: Alcohol use Disorder, Family history, P300, endophenotype, Risk and development
Introduction
Family history (FH) of Alcohol Use Disorder (AUD) has been consistently shown to be a major risk factor for developing AUD (Goodwin et al., 1973; Cadoret et al., 1980; Bohman et al., 1987; Dawson et al., 1992; Polich et al., 1994; Porjesz et al., 2005; Prescott, 2005; Rangaswamy and Porjesz, 2007). Ample evidence shows that FH is a robust predictor of alcohol problems and is associated with psychological and neurobiological precursors for AUD (Nurnberger et al., 2004; Porjesz et al., 2005; Hill and O’Brien, 2015). For example, FH is linked to greater risk for earlier initiation of drinking (Hill and Yuan, 1999; Dawson, 2000), increased frequency of alcohol intoxication (Pilatti et al., 2013), early onset of AUD (Lieb et al., 2002), and a higher prevalence of lifetime alcohol dependence across age, gender, and race (National Longitudinal Alcohol Epidemiological Survey, 1992), Additionally, FH has also been associated with aberrant electrophysiological characteristics such as low P3/P300 (an event-related brain potential; ERP) amplitude in response to target stimuli, often considered as a biomarker of vulnerability for AUD (Begleiter et al., 1984, 1987; Hill et al., 1990; Porjesz et al., 2005; Hill et al., 2009; Cservenka, 2016). Indeed, several studies have demonstrated that low P3 amplitude appears to be independent of disease state and varies in individuals with a FH of AUD compared to controls from non-AUD families (Porjesz et al., 1998; Euser et al., 2012; Hill and O’Brien, 2015).
Given the importance of FH in alcohol research, increased attention has been given to its measurement and clinical applications. However, there exists a large degree of variability in the ascertainment and measurement of FH and the relative performance of different FH measures as predictors of phenotypes and endophenotypes, especially across different groups, has not been investigated. This is important because, several variants of FH have been utilized to examine associations with numerous alcohol variables with little understanding of the differences in their predictive value across diverse ethnic and social groups. Moreover, population characteristics (i.e., cultural and societal factors) have been shown to affect alcohol use and problems with significant variability observed across gender and race/ethnicity (Berkman and Kawachi 2000; Rehm et al., 2009; Substance Abuse and Mental Health Services Administration, 2015). Yet, little is known about how different FH measures and their associations with alcohol variables differ across gender and race/ethnicity.
More specifically, a study systematically comparing different FH measures, their associations with different alcohol outcomes, across gender and race/ethnicity, is important for the following reasons:
1.1. Variability in measurement of FH (dichotomous vs. density).
The commonly used FH measures of AUD fall under dichotomous or density measures. Dichotomous measures often categorize individuals as FH+ and FH- defined by presence or absence of an AUD in the father/mother and/or among first- and/or second-degree relatives (Schuckit and Smith, 1996; Cservenka and Nagel, 2012). On the other hand, density measures are more complex scores that account for the number and type of family members who have the disorder. Several variants of density measures such as the Family Expression of Alcoholism (Zucker et al., 1994), the Family History Density (Stoltenberg et al., 1998), and other alternatives (e.g. Cservenka and Nagel, 2012) have been used in extant research. Despite such variability in measurement of FH, very few studies have examined the comparative utility of dichotomous and density measures.
1.2. Variability in ascertainment methods (direct vs Indirect).
Differences also exist in the methods used for ascertaining FH. Most often, information about family members is gathered either by directly interviewing each family member (direct FH method) or by having assessed family members report the alcohol use problems of unassessed family members (indirect FH method). Importantly, variations in ascertainment methods also affect the criteria used for determining affectedness of family members. For example, in the direct FH method, family members are directly interviewed using instruments such as the Semi-Structured Assessment for the Genetics of Alcoholism (SSAGA) (Bucholz et al., 1994), in which the diagnostic criteria, as defined by the Diagnostic and Statistical Manual of Mental Disorders (DSM; e.g., DSM-IV/DSM-5) are already incorporated into the instrument. Whereas, in the indirect FH method, instruments such as the Family History Assessment Module (FHAM) (Rice et al., 1995) are used where a relative’s affectedness is decided based on predetermined criteria—a family member has to be named by three or more family members to be considered “affected”.
1.3. Variability in coding criteria.
FH measures also vary in the use of coding criteria. For example, some FH measures have used the diagnostic criteria from clinical instruments (e.g., DSM) to create a binary coding of affectedness (i.e., 0=unaffected, 1=affected) while others have categorized affectedness into multiple categories that have then been collapsed to a binary code (e.g., Powers et al., 2017). Moreover, because studies have been carried out in the context of the evolution of diagnostic criteria over time, results of clinical instruments often correspond to different revisions of the DSM, with earlier studies defining AUD by DSM-III-R and DSM-IV. Very few studies to our knowledge have used DSM-5 to define affectedness in FH measures. Therefore, given the different versions of clinical instruments, criteria, and definitions that have been employed for coding affectedness, a systematic comparison of FH measures is difficult, especially because they do not map perfectly onto each other.
1.4. Associations with AUD and related phenotypes.
Studies comparing the predictive value and utility of different FH measures have largely examined their associations with behavioral phenotypes (e.g., tolerance, withdrawal, etc.) (Stoltenberg et al., 1998; Milne et al., 2013) and have mostly ignored their associations with endophenotypes. Endophenotypes are intermediate phenotypes on the putative causal pathway from genotype to phenotype (Euser et al., 2012). For example, low P3 amplitude, an ERP to a target of significance, has been considered as both a disease and vulnerability marker. Nevertheless, whether any differences exist in the associations between P3 amplitude and different variants of FH measures is not well-known. A comparative study of associations between different FH measures and P3 amplitude is important for the following reasons: 1) Reduced P3 is considered a biomarker of risk for developing AUD. There is substantial evidence that individuals with AUD, their unaffected offspring, and relatives manifest low P3 amplitude, particularly in multiplex AUD families compared to individuals with and without AUD from non-AUD families (Porjesz and Begleiter, 1996a; Porjesz et al., 1998; Begleiter et al., 1984; Berman et al., 1993; Hill and Steinhauer, 1993; Hill et al., 1999; Hesselbrock et al., 2001). 2) Reduced P3 is heritable and can be a familial risk. Indeed, evidence shows that P3 amplitude recorded during a visual oddball paradigm is directly related to the number of first-degree alcoholic relatives and not the drinking history of an alcoholic or high-risk individual (Pfefferbaum et al., 1991; Cohen et al., 1994; Benegal et al., 1995; Porjesz et al., 2005). Moreover, supporting the notion that P3 is heritable, twin studies have shown that identical twins manifest more similar P3 amplitudes than unrelated individuals, with a meta-heritability (via aggregating twin correlations across five studies) of 60% (Steinhauer et al., 1987; O’Connor et al., 1994; van Beijsterveldt and van Baal, 2002). Additionally, Carlson et al. (2004) have shown that P3 amplitude in nonalcoholic adolescent twin pairs who become discordant for AUD as adults also present reduced P3 amplitude, supporting the notion that this risk is familial. Further, Perlman, Johnson, and Iacono (2009) have showed that low P3 amplitude indexes risk for AUD, independent of any deleterious effect of alcohol use. However, despite extensive evidence linking FH of AUD to low P3 amplitude, it is unclear which measures (e.g., dichotomous or density) of FH are more predictive of this significant biomarker of risk for AUD. 3) Variability in P3 across gender and race/ethnicity. The relationship between low P3 amplitude and the heritability of AUD may be subject to modulation by population differences, and gender (Ehlers et al., 2003; Euser et al., 2011). Therefore, these points attest the importance of testing the associations of different FH measures with P3 amplitude and variations in these associations across gender and race/ethnicity.
1.5. Gender and race/ethnic differences.
Substantial evidence shows that women and men differ in rates of alcohol use initiation, consequences of use, maintenance of use patterns, and attempts to stop and success at cessation (Keyes et al., 2008). Additionally, psychosocial factors may have different structural associations with AUD in men and women (Schulte et al., 2009; Meyers et al., 2017). Importantly, inconsistent findings across studies have been reported that may be attributed to the use of different measures of FH. For example, some studies have reported significant interactions between gender and FH, such that FH+ males were especially more vulnerable to high levels of alcohol consumption (Barthwell, 1995). In other work, measures of SES (e.g., education, income) were shown to be more important predictors of alcohol dependence symptoms among men, whereas FH was a stronger predictor among women (LaBrie et al., 2011).
Similarly, aspects of race/ethnic group membership have been shown to mitigate or exacerbate the magnitude of alcohol-related outcomes (Gilman et al., 2008). For example, Whites tend to consume more alcohol than Blacks (Johnston et al., 2011) but Blacks reportedly have higher levels of alcohol problems (Zapolski et al., 2014). Yet, the risk for alcohol dependence associated with FH+ seems to increase with age in Whites but decrease with age in Blacks (Russell et al., 1990). Importantly, whether associations between different FH measures and alcohol-related phenotypes vary across gender and race/ethnicity, particularly comparing Whites and Blacks, is less understood. Therefore, a comparative study of associations of different FH measures with AUD-risk factors and their variation by gender and race/ethnicity is important.
1.6. Present Study
The aims of the present study are: 1) To compare the associations of different FH measures (dichotomous and density) with behavioral and neural phenotypes of risk for AUD and 2) To examine if these associations vary across gender (between males and females) and race/ethnicity (between Whites and Blacks). We utilized data from the Collaborative Study on the Genetics of Alcoholism (COGA), a large, multi-site, and multi-generational family study consisting of ethnically diverse AUD and community control families. COGA data comprise extensive assessments of individual family members with deep phenotyping in multiple domains (e.g., clinical, behavioral, neurophysiological). Also, information regarding each individual family member’s alcohol use, related behaviors, DSM-5 AUD symptom counts, and diagnoses have been acquired through direct interviews using the SSAGA, a poly-diagnostic psychiatric interview (Bucholz et al., 1994; Hesselbrock et al., 1999). These first-hand reports allow for greater reliability of the ascertained affectedness information and of FH measures derived from these reports. Therefore, taking advantage of COGA’s rich multi-modal AUD data, large ethnically diverse sample, and diagnostic information obtained via direct interviews, we computed four commonly used dichotomous and four density measures of FH, compared their predictive value in associations with alcohol-related clinical, behavioral, and neural outcomes, across gender and race/ethnicity. Specifically, we examined the diagnostic accuracy of dichotomous and density FH measures at classifying DSM-5 AUD diagnosis, their associations with likelihood of AUD, age of onset of regular drinking, and parietal P3 amplitude to visual target stimuli. We also examined if the diagnostic accuracy of these FH measures and their associations with the outcomes varied by gender (females vs. males) and self-reported race/ethnicity (Blacks vs. Whites).
2. Materials and Methods
2.1. Sample Characteristics
Data are from the COGA study, which has been described in detail elsewhere (Begleiter et al., 1999; Nurnberger and Wiegand, 2011). To date, COGA has assessed data on alcohol use frequency, AUD symptom counts, and diagnoses for approximately 17,762 individuals belonging to 2,255 families. COGA’s sample is well-suited for undertaking a systematic comparison of FH measures as its multiplex family data allows for use of the same subjects’ familial information to compute and compare the utility of the two types of FH measures. Also, given that the sample size is large and ethnically diverse, a systematic comparison of the FH measures across gender and race/ethnicity is feasible.
Importantly, to compute the dichotomous and density measures of FH using COGA family data, we applied two inclusion criteria. 1) The subject and at least one of their family members had to have DSM-5 AUD symptom count and diagnostic information. 2) The diagnostic information must be assessed using only direct interviews. That is, only those subjects and their relatives, whose affectedness information was gathered through the administration of the SSAGA were used for the analyses in this study. A total of 16,346 subjects (Mage=37.24; SD=15.00) from 1,934 families, each of which comprised between 2 and 84 family members (MFamMem=15.51; SD=13.80) fulfilled these criteria (see Table 1 for details on sample characteristics). The kinship information among family members was self-reported by participants and cross-verified through other family members. That is, at the time of their assessment/direct interview, participants described their family members and the relationships among them, and when their family members were assessed/directly interviewed, they in turn verified these relationships.
Table 1:
Sample characteristics
| Characteristic | Category | N | % |
|---|---|---|---|
| COGA Sample | Subjects | 16,346 | 100.00% |
|
| |||
| Sex | Female | 8,729 | 53.40% |
| Male | 7,617 | 46.60% | |
|
| |||
|
Race/Ethnicity
(self-reported) |
White | 11,753 | 71.90% |
| Black | 3,901 | 23.90% | |
| Other | 688 | 4.20% | |
| Missing | 4 | 0.02% | |
|
| |||
|
Hispanic
(self-reported) |
No | 15,161 | 92.80% |
| Yes | 1,183 | 7.20% | |
| Missing | 2 | 0.01% | |
|
| |||
| DSM-5 AUD diagnosed | No | 8,218 | 50.30% |
| Yes | 8,125 | 49.70% | |
Informed consent was obtained from all participants. For neurophysiological assessments, experimental protocols were approved by each study site’s institutional review board. Further, participants were excluded from neurophysiological assessments, if they had positive breath-analyzer test and/or urine screen results; hepatic encephalopathy/cirrhosis of the liver; history of head injury, seizures, or neurosurgery; uncorrected sensory deficits; history/symptoms of psychoses; self-reported positive test result for human immunodeficiency virus; other acute/chronic medical illnesses that affect brain function; or psychotropic medications that affect electrophysiologic measurement. Accordingly, a total of 7,516 subjects (MERPage=32.55; SD=13.26) had P3 data that were used in this study.
2.2. Independent Variables
Dichotomous FH scores.
We calculated four dichotomous FH scores, akin to those that have been extensively used in previous studies. The FH scores were calculated based on 1) The category of the family relative, which included father, mother, either parent, and any first-degree relative and 2) The affectedness criterion based on DSM-5 AUD lifetime diagnosis. Accordingly, for each subject, we computed four dichotomous FH scores: 1) Father with DSM-5 AUD diagnosis (FHFather–AUDDx), 2) Mother with DSM-5 AUD diagnosis (FHMother–AUDDx), 3) Either parent with DSM-5 AUD diagnosis (FHParent–AUDDx), and 4) Any first-degree relative with DSM-5 AUD diagnosis (FHFirst–AUDDx).
Density FH scores.
We also computed four ratio scores of FH density (FHDr). Briefly, the density measures accounted for the degree of relatedness of different categories of biological relatives, weighted based on their AUD affectedness. The mathematical formulations used for calculating these density measures are elaborated in the supplementary material. Specifically, the density measures accounted for 1) Two variations in the weighting scheme and inclusion of family members. That is, the set of relatives included were either (a) primary and secondary non-descendants (e.g., parents, grandparents, parental siblings, full siblings, and half-siblings) (FHDrPSND) or (b) all relatives, regardless of degree or direction of relatedness, including both predecessors and descendants (FHDrAR). 2) Two variations in affectedness coding criteria. That is, for coding family members’ AUD affectedness, the two criteria were (a) DSM-5 AUD lifetime diagnosis (AUDDx) and (b) DSM-5 AUD maximum symptom count (AUDMaxSxCnt). For DSM-5 maximum symptom count, the maximum number of endorsed symptoms at any one assessment across multiple assessments was used. This variable was transformed by the natural logarithm of the symptom count plus one (i.e., ln (count + 1)). Accordingly, for each subject, we computed four density FH scores: 1) Primary and secondary non-descendants with DSM-5 AUD diagnosis (FHDrPSND–AUDDx), 2) Primary and secondary non-descendants with DSM-5 AUD maximum symptom count (FHDrPSND–AUDMaxSxCnt), 3) All relatives with DSM-5 AUD diagnosis (FHDrAR–AUDDx), and 4) All relatives with DSM-5 AUD maximum symptom count (FHDrAR–AUDMaxSxCnt).
2.3. Dependent Variables.
DSM-5 AUD lifetime diagnosis.
Information from subjects’ SSAGA interview was used to classify AUD status. Specifically, interviewed subjects were coded as affected (1) or unaffected (0) based on whether they met lifetime criteria for DSM-5 AUD. That is, subjects who endorsed two or more criteria that clustered within a single 12-month period were diagnosed with AUD.
Age of onset of regular drinking.
This was the age at which subjects first reported drinking at least once a month for six months or more, in their SSAGA interview. Ample evidence suggests that earlier the age when drinking is initiated, greater the risk of developing AUD (Hawkins et al., 1997; DeWit et al., 2000). Importantly, early initiation of drinking has been linked to FH of AUD (Varma et al., 1994).
Visual parietal P3 amplitude.
We also examined the associations between the FH measures and the parietal P3 amplitude to target stimuli measured using the visual oddball paradigm. The visual oddball paradigm has been previously described (Cohen et al., 1994). Briefly, three types of visual stimuli are presented: target (the letter X), non-target (squares), and novel (a different colored geometric figure) on each trial. Subjects are required to respond to the target stimulus by pressing a button as quickly as possible, but not at the expense of accuracy. A total of 35 target stimuli, 210 non-target stimuli, and 35 novel stimuli trials were presented with the probabilities of occurrence of the trials being 12.5% for the target trials, 75% for non-target trials and 12.5% for novel trials. Trials with baseline corrected amplitudes greater than 75 μV were marked as artifact contaminated and not analyzed further. Subjects whose data did not contain a minimum of 20 artifact-free trials in each condition were not selected for analysis. The P3 amplitude used in this analysis was the peak amplitude to target at the midline parietal (Pz) electrode between 300–700 milliseconds after stimulus presentation.
2.4. Statistical Analyses
Descriptive and comparative statistics.
Descriptive statistics were computed for all FH measures. Specifically, for density measures, independent t-tests were used to compare the mean density scores within gender and race/ethnic groups (defined by participant’s self-report). Similarly, for dichotomous measures, parametric Pearson’s Chi square tests to compare the proportions of FH+ within gender and race/ethnic groups.
Diagnostic accuracy of FH measures at classifying DSM-5 AUD diagnosis.
Diagnostic accuracy is the ability of a measure/test to discriminate between the target condition/disorder and health. We used receiver operating characteristic (ROC) curves to graphically display tradeoff between sensitivity (true positive rate) and specificity (true negative rate) of FH measures for their ability to predict a dichotomous outcome, here DSM-5 AUD diagnosis. We also used area under the ROC curve (AUC) as a global measure to compare diagnostic accuracy across the FH measures. A measure/test with perfect diagnostic accuracy has an AUC of 1.0 and an uninformative measure/test is no better than chance where AUC=0.5 (50% probability/random chance) (Florkowski, 2008).
Logistic and linear regression analyses.
We ran separate logistic regression models with each of the FH measures as predictors along with assessment-age, gender, and self-reported race/ethnicity, included as covariates. In all models, lifetime diagnosis of DSM-5 AUD was included as a binary outcome variable. For age of onset of regular drinking and parietal P3 amplitude, we ran separate linear regression models with each of the FH measures as predictors along with assessment-age, gender, and self-reported race/ethnicity, included as covariates. Age of onset of regular drinking and parietal P3 amplitude for visual target stimuli were included as continuous outcome variables in respective models.
2.5. Gender and Race/Ethnic Differences
To examine variation by gender and race/ethnicity in associations of dichotomous and density FH measures with the alcohol variables, we ran all AUC analyses, linear, and logistic regression models separately for males, females, Whites, and Blacks. In all regression models, analyzed separately for males and females, we included assessment-age and self-reported race/ethnicity as covariates. Whereas, for all regression models analyzed separately for Whites and Blacks, we included assessment-age and gender as covariates. We also examined interactions between gender, race/ethnicity, and each of the FH measures across the outcomes. These findings are reported in the supplementary material.
2.6. Correction for Multiple Test Comparisons
In all analyses, for multiple comparisons, we used Bonferroni-corrected p-values to determine statistical significance. That is, when comparing the four density measures separately across gender and race/ethnicity using independent t-tests, a p-value=0.012 (α=0.05/4 comparisons) was used. The same corrected p-value=0.012 was used when comparing the four dichotomous measures separately across gender and race/ethnicity using non-parametric Chi square tests. For AUC and regression analyses comparing dichotomous and density measures, a p-value=0.006 (α=0.05/8 comparisons) was used. Similarly, for all AUC and regression models comparing dichotomous and density measures separately across gender and race/ethnicity, for each of the outcome variables, a p-value=0.003 (α=0.05/16 comparisons) was used.
3. Results
Overall, for all subjects, as shown in Table 2a, the highest and lowest mean scores among density measures were observed for FHDrPSND–AUDDx and FHDrAR– AUDMaxSxCnt respectively. Among dichotomous measures, FHFirst–AUDDx and FHMother–AUDDx yielded the highest and lowest proportions of FH+ subjects.
Table 2a:
Descriptive statistics for density and dichotomous FH scores for all subjects.
| Density Measures | N | Mean | SD |
|---|---|---|---|
| FHDrPSND–AUDDx | 9,805 | 0.53 | 0.25 |
| FHDrPSND–AUDMaxSxCnt | 9,805 | 0.43 | 0.19 |
| FHDrAR–AUDDx | 14,569 | 0.51 | 0.22 |
| FHDrAR– AUDMaxSxCnt | 14,569 | 0.41 | 0.17 |
|
| |||
| Dichotomous Measures | N | #(Yes) | %(Yes) |
|
| |||
| FHFather–AUDDx | 6,752 | 4,359 | 64.6% |
| FHMother–AUDDx | 9,593 | 3,219 | 33.6% |
| FHParent–AUDDx | 10,411 | 6,281 | 60.3% |
| FHFirst–AUDDx | 12,164 | 10,257 | 84.3% |
Diagnostic accuracy of dichotomous and density measures at classifying DSM-5 AUD diagnosis.
It is evident from the ROC curves shown in Figure 1a that density measures present greater diagnostic accuracy at classifying AUD diagnosis compared to the ROC curves for dichotomous measures (Figure 1b). As shown in Table 2b, although AUC for all eight FH measures were significantly greater than 50% probability, AUC for all dichotomous measures were closer to 50% probability, indicating poor diagnostic accuracy. FHFirst–AUDDx and FHDrPSND–AUDMaxSxCnt had the highest AUC among dichotomous and density measures respectively. Overall, density (vs. dichotomous) measures presented higher AUC indicative of better predictive accuracy at classifying AUD diagnosis.
Figure 1:
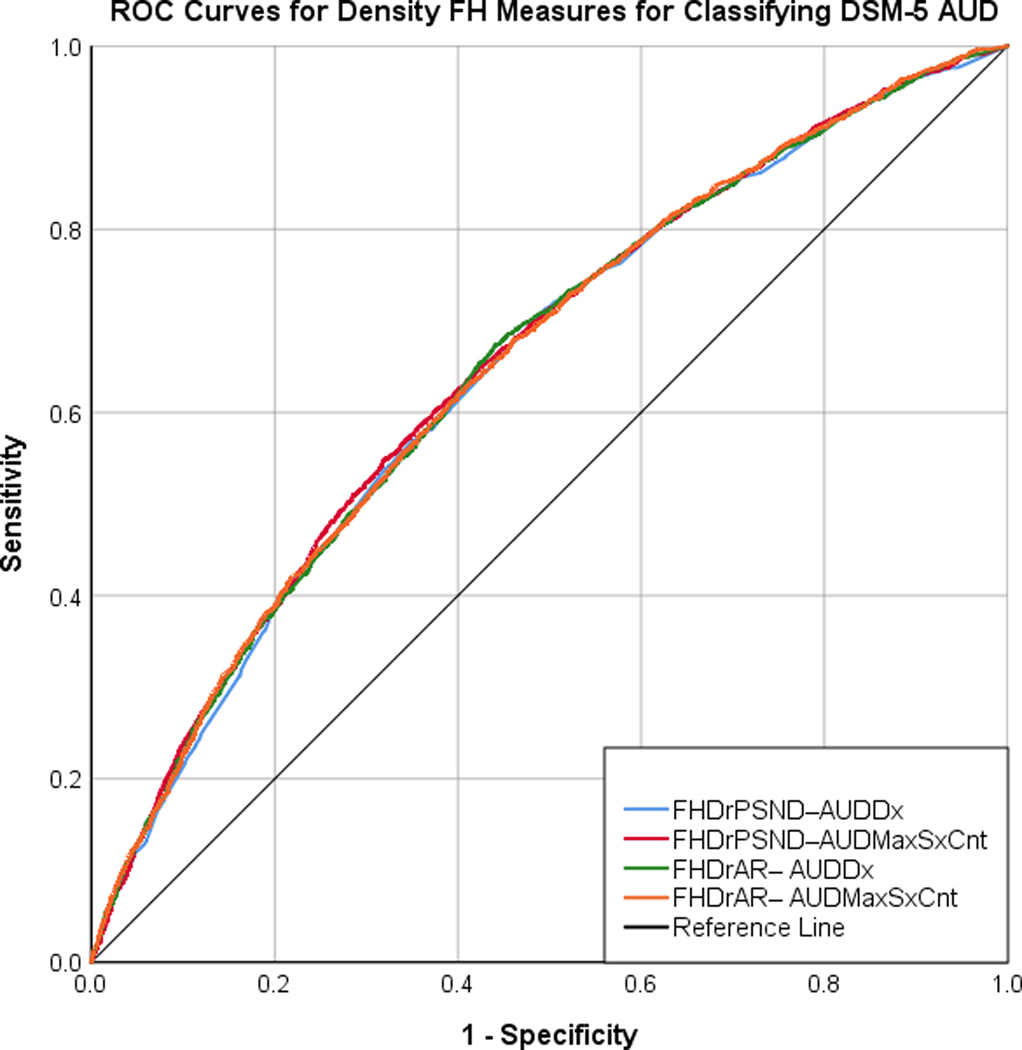

The ROC curves displaying the tradeoff between the sensitivity and the specificity for the four density measures (A) and the four dichotomous measures (B) in classifying DSM-5 AUD diagnosis.
Table 2b.
Area under the curve and unstandardized beta coefficients for density and dichotomous FH measures from logistic and linear regression models for each of the alcohol variables, across all subjects.
| FH Measures | Diagnostic Accuracy | Likelihood of AUD | Age of onset Regular Drinking | P3 Amplitude | |||||
|---|---|---|---|---|---|---|---|---|---|
|
|
|
|
|
||||||
| N | AUC | N | b | OR | N | b | N | b | |
|
| |||||||||
| Density Measures | |||||||||
| FHDrPSND–AUDDx | 9,805 | 0.64* | 9,684 | 2.21* | 9.13 | 7,749 | −2.23* | 5,254 | −1.95* |
| FHDrPSND–AUDMaxSxCnt | 9,805 | 0.65* | 9,684 | 3.01* | 20.45 | 7,749 | −3.05* | 5,254 | −2.52* |
| FHDrAR–AUDDx | 14,566 | 0.62* | 14,264 | 2.04* | 7.71 | 11,456 | −2.28* | 6,894 | −1.64* |
| FHDrAR– AUDMaxSxCnt | 14,566 | 0.62* | 14,264 | 2.85* | 17.45 | 11,456 | −2.98* | 6,894 | −2.12* |
| Dichotomous Measures | |||||||||
| FHFather–AUDDx | 6,752 | 0.54* | 6,696 | 0.58* | 1.80 | 5,505 | −0.74* | 3,656 | −1.05* |
| FHMother–AUDDx | 9,593 | 0.52* | 9,436 | 0.53* | 1.71 | 7,607 | −0.47* | 5,106 | −0.81* |
| FHParent–AUDDx | 10,411 | 0.54* | 10,231 | 0.60* | 1.83 | 8,220 | −0.55* | 5,499 | −0.94* |
| FHFirst–AUDDx | 12,164 | 0.55* | 11,340 | 0.69* | 2.00 | 9,184 | −0.78* | 6,157 | −0.59 |
AUC=area under curve. OR=Odds Ratio.
p<0.006 (Bonferroni corrected).
Associations of dichotomous and density measures with likelihood of AUD.
As shown in Table 2b, both dichotomous and density measures were significantly associated with likelihood of AUD. That is, irrespective of whether FH is evaluated as a dichotomous or a density measure, it is associated with increased odds of AUD. Further, FHDrPSND–AUDMaxSxCnt (OR=20.45) and FHFirst–AUDDx (OR=2.00) presented the most robust associations among density and dichotomous measures respectively. Importantly, all density measures yielded higher coefficients and odds ratios thereby presenting improved predictive value over dichotomous measures.
Associations of dichotomous and density measures with age of onset of regular drinking.
As shown in Table 2b, all dichotomous and density measures were significantly associated with age of onset of regular drinking. That is, irrespective of whether FH is evaluated as a dichotomous or a density measure, it is associated with early onset of regular drinking. Further, FHDrPSND–AUDMaxSxCnt (b=3.05) and FHFirst–AUDDx (b=0.78) presented the most robust associations among density and dichotomous measures respectively. Overall, compared to dichotomous measures, all density measures presented greater magnitude of associations with age of onset of regular drinking.
Associations of dichotomous and density measures with parietal P3 amplitude.
As shown in Table 2b, all four density measures were significantly associated with P3 amplitude. That is, increases in density scores were associated with lower P3 amplitude. On contrary, among dichotomous measures, except FHFirst–AUDDx, that failed to reach significance (following Bonferroni adjusted alpha), the rest were significantly associated, albeit the magnitude of their associations was modest. Further, FHDrPSND–AUDMaxSxCnt (b=2.52) and FHFather–AUDDx (b=1.03) presented the most robust associations among density and dichotomous measures respectively. Overall, density measures presented consistently greater magnitude of associations with P3 amplitude evidencing greater reliability over dichotomous measures.
3.1. Gender Differences
As shown in Table 3a, among density measures, significant differences in mean scores between males and females were observed for FHDrAR–AUDDx and FHDrAR– AUDMaxSxCnt measures. Specifically, females (vs. males) had higher mean scores. For dichotomous measures, no significant difference in the proportion of FH+ males and females were observed.
Table 3a:
Descriptive statistics and comparison of density scores using independent t-tests and dichotomous scores using Chi square tests, across gender.
| Density Measures | Gender | N | Mean | SD | t |
|---|---|---|---|---|---|
| FHDrPSND–AUDDx | Males | 4,755 | 0.52 | 0.24 | 0.64 |
| Females | 5,050 | 0.53 | 0.24 | ||
|
| |||||
| FHDrPSND–AUDMaxSxCnt | Males | 4,755 | 0.42 | 0.18 | 2.01 |
| Females | 5,050 | 0.43 | 0.19 | ||
|
| |||||
| FHDrAR–AUDDx | Males | 6,780 | 0.50 | 0.22 | 2.86* |
| Females | 7,789 | 0.51 | 0.22 | ||
|
| |||||
| FHDrAR– AUDMaxSxCnt | Males | 6,780 | 0.39 | 0.16 | 4.72* |
| Females | 7,789 | 0.41 | 0.16 | ||
|
| |||||
| Dichotomous Measures | Gender | N | #Yes | %Yes | χ 2 |
|
| |||||
| FHFather–AUDDx | Males | 3,375 | 2,164 | 64.1% | 0.57 |
| Females | 3,377 | 2,195 | 65.0% | ||
|
| |||||
| FHMother–AUDDx | Males | 4,663 | 1,536 | 32.9% | 1.54 |
| Females | 4,930 | 1,683 | 34.1% | ||
|
| |||||
| FHParent–AUDDx | Males | 5,062 | 3,072 | 60.7% | 0.52 |
| Females | 5,349 | 3,209 | 60.0% | ||
|
| |||||
| FHFirst–AUDDx | Males | 5,919 | 4,976 | 84.1% | 0.56 |
| Females | 6,245 | 5,281 | 84.6% | ||
t=independent t-test statistic. χ2= Pearson Chi square statistic.
p<0.012 (Bonferroni corrected).
Diagnostic accuracy of FH measures at classifying DSM-5 AUD diagnosis across gender.
As shown in Table 3b, in males, all four density measures presented significant diagnostic accuracy for classifying AUD diagnosis, with FHDrPSND–AUDMaxSxCnt having the highest AUC. However, among dichotomous measures, FHMother–AUDDx failed to be significantly different from 50% probability at classifying AUD diagnosis. In males, other dichotomous measures, although significant, nevertheless presented diagnostic accuracy closer to 50% probability/chance, indicating poor diagnostic accuracy. Whereas, in females, all dichotomous and density measures presented significant diagnostic accuracy for classifying AUD diagnosis, albeit the dichotomous measures were again closer to 50% probability/chance, indicating poor diagnostic accuracy. Among density measures, FHDrPSND–AUDMaxSxCnt yielded the highest AUC and among dichotomous measures, FHFather–AUDDx, FHParent–AUDDx, and FHFirst–AUDDx presented equally high AUC. Overall, in both males and females, the density measures present consistently significant and higher diagnostic accuracy at classifying DSM-5 AUD diagnosis unlike dichotomous measures, which present high variability and poor diagnostic accuracy.
Table 3b:
Area under the curve and unstandardized beta coefficients for density and dichotomous FH measures from logistic and linear regression models for each of the alcohol variables, across gender.
| FH Measures | Diagnostic Accuracy | Likelihood of AUD | Age of onset Regular Drinking | P3 Amplitude | |||||
|---|---|---|---|---|---|---|---|---|---|
|
|
|
|
|
||||||
| Males | N | AUC | N | b | OR | N | b | N | b |
|
|
|||||||||
| FHDrPSND–AUDDx | 4,755 | 0.63* | 4,755 | 1.99* | 7.345 | 3,955 | −2.15* | 2,546 | −2.59* |
| FHDrPSND–AUDMaxSxCnt | 4,755 | 0.64* | 4,755 | 2.69* | 14.855 | 3,955 | −2.70* | 2,546 | −3.26* |
| FHDrAR–AUDDx | 6,778 | 0.62* | 6,778 | 1.96* | 7.135 | 5,716 | −2.56* | 3,242 | −2.26* |
| FHDrAR– AUDMaxSxCnt | 6,778 | 0.63* | 6,778 | 2.76* | 15.867 | 5,716 | −3.31* | 3,242 | −2.98* |
| FHFather–AUDDx | 3,375 | 0.54* | 3,375 | 0.58* | 1.796 | 2,842 | −0.81* | 1,788 | −1.34* |
| FHMother–AUDDx | 4,663 | 0.50 | 4,663 | 0.51* | 1.67 | 3,882 | −0.39* | 2,474 | −1.03 |
| FHParent–AUDDx | 5,062 | 0.52* | 5,062 | 0.51* | 1.673 | 4,188 | −0.43* | 2,665 | −1.03* |
| FHFirst–AUDDx | 5,919 | 0.55* | 5,919 | 0.45* | 1.577 | 4,712 | −0.66* | 2,980 | −0.94 |
| Females | |||||||||
| FHDrPSND–AUDDx | 5,050 | 0.66* | 5,050 | 2.41* | 11.231 | 3,794 | −2.63* | 2,708 | −1.37 |
| FHDrPSND–AUDMaxSxCnt | 5,050 | 0.67* | 5,050 | 3.32* | 27.864 | 3794 | −3.87* | 2,708 | −1.86 |
| FHDrAR–AUDDx | 7,788 | 0.63* | 7,787 | 2.23* | 9.314 | 5,740 | −2.51* | 3,652 | −1.09 |
| FHDrAR– AUDMaxSxCnt | 7,788 | 0.63* | 7,787 | 3.11* | 22.588 | 5,740 | −3.40* | 3,652 | −1.36 |
| FHFather–AUDDx | 3,377 | 0.55* | 3,377 | 0.52* | 1.693 | 2,663 | −0.68* | 1,868 | −0.75 |
| FHMother–AUDDx | 4,930 | 0.54* | 4,929 | 0.59* | 1.817 | 3,725 | −0.55* | 2,632 | −0.62 |
| FHParent–AUDDx | 5,349 | 0.55* | 5,348 | 0.58* | 1.791 | 4,032 | −0.70* | 2,834 | −0.86 |
| FHFirst–AUDDx | 6,245 | 0.55* | 6,244 | 0.73* | 2.076 | 4,472 | −1.13* | 3,177 | −0.26 |
AUC=area under curve. OR=Odds Ratio.
p<0.003 (Bonferroni corrected).
Associations of FH measures with likelihood of AUD across gender.
As shown in Table 3b, in males, all dichotomous and density measures were significantly associated with increased odds of AUD. Further, FHDrAR– AUDMaxSxCnt (OR=15.86) and FHFather–AUDDx (OR=1.79) presented the most robust associations among density and dichotomous measures respectively. In females too, all dichotomous and density measures were significantly associated with increased odds of AUD. Further, FHDrPSND–AUDMaxSxCnt (OR=27.86) and FHFirst–AUDDx (OR=2.076) presented the most robust associations among density and dichotomous measures respectively. Importantly, in both males and females, density (vs. dichotomous) measures seemed to be substantially more robust in their associations with likelihood of AUD.
Associations of FH measures with age of onset of regular drinking across gender.
As shown in Table 3b, in males, all dichotomous and density measures were significantly associated with early onset of regular drinking. Further, FHDrAR– AUDMaxSxCnt (b=−3.31) and FHFather–AUDDx (b=−0.81) presented the most robust associations among density and dichotomous measures respectively. In females too, all dichotomous and density measures were significantly associated with early onset of regular drinking. FHDrPSND–AUDMaxSxCnt (b=−3.87) and FHParent–AUDDx (b=−0.70) presented the most robust associations among density and dichotomous measures respectively. Importantly, in both males and females, all density (vs. dichotomous) measures presented associations of greater magnitude.
Association of FH measures with parietal P3 amplitude across gender.
As shown in Table 3b, in males, all four density measures were significantly associated with low P3 amplitude. Further, FHDrPSND–AUDMaxSxCnt (b=−3.26) presented the most robust association. Among dichotomous measures, only FHFather–AUDDx and FHParent–AUDDx presented significant associations. FHFather–AUDDx (b=−1.34) was most robust. In females, interestingly, none of the dichotomous and density measures were associated with P3 amplitude. Overall, compared to dichotomous measures, albeit only in males, density measures were more consistently associated with P3 amplitude.
3.2. Race/Ethnic Differences
As shown in Table 3a, significant differences in mean scores between Whites and Blacks were observed for all four density measures. Specifically, across all density measures, Whites (vs. Blacks) had higher mean scores. On the other hand, no significant difference in the proportions of FH+ between Whites and Blacks were observed for FHFather–AUDDx and FHMother–AUDDx measures. However, a significantly greater proportion of Whites (vs. Blacks) were FH+ on FHParent–AUDDx and FHFirst–AUDDx dichotomous measures.
Diagnostic accuracy of FH measures at classifying DSM-5 AUD diagnosis across race/ethnicity.
As shown in Table 4b, in Whites, all dichotomous and density measures presented significant diagnostic accuracy at classifying AUD diagnosis. However, AUC of density measures were greater compared to dichotomous measures which were closer to 50% probability/chance. Further, FHDrPSND–AUDMaxSxCnt and FHFather–AUDDx yielded the highest AUC among density and dichotomous measures respectively. On the other hand, in Blacks, except for FHFirst–AUDDx, all other dichotomous measures failed to be significantly different from random chance at classifying AUD diagnosis. In other words, those measures were completely uninformative. On the contrary, in Blacks, all density measures presented significant diagnostic accuracy for classifying AUD diagnosis FHDrPSND–AUDMaxSxCnt presented the highest AUC. Therefore, in both Whites and Blacks, density measures presented consistent and significantly greater diagnostic accuracy for classifying AUD diagnosis, unlike dichotomous measures, which had poor diagnostic accuracy.
Table 4b.
Area under the curve and unstandardized beta coefficients for density and dichotomous FH measures from logistic and linear regression models for each of the alcohol variables, across race/ethnicity.
| FH Measures | Diagnostic Accuracy | Likelihood of AUD | Age of onset Regular Drinking | P3 Amplitude | |||||
|---|---|---|---|---|---|---|---|---|---|
|
|
|
|
|
||||||
| Whites | N | AUC | N | b | OR | N | b | N | b |
|
|
|||||||||
| FHDrPSND–AUDDx | 7,062 | 0.64* | 7,062 | 2.31* | 10.09 | 5,846 | −2.32* | 3,543 | −0.27* |
| FHDrPSND–AUDMaxSxCnt | 7,062 | 0.65* | 7,062 | 3.14* | 23.29 | 5,846 | −3.21* | 3,543 | −0.38* |
| FHDrAR–AUDDx | 10,756 | 0.61* | 10,756 | 2.06* | 7.86 | 8,836 | −2.30* | 4,733 | −0.22* |
| FHDrAR– AUDMaxSxCnt | 10,756 | 0.62* | 10,756 | 2.93* | 18.74 | 8,836 | −3.05* | 4,733 | −0.29* |
| FHFather–AUDDx | 5,358 | 0.55* | 5,358 | 0.60* | 1.83 | 4,494 | −0.83* | 2,756 | −0.13* |
| FHMother–AUDDx | 6,986 | 0.52* | 6,986 | 0.62* | 1.86 | 5,792 | −0.54* | 3,455 | −0.09 |
| FHParent–AUDDx | 7,484 | 0.54* | 7,484 | 0.61* | 1.84 | 6,175 | −0.63* | 3,671 | −0.13* |
| FHFirst–AUDDx | 8,447 | 0.54* | 8,447 | 0.68* | 1.97 | 6,887 | −0.93* | 3,895 | −0.10 |
| Blacks | |||||||||
| FHDrPSND–AUDDx | 2,302 | 0.60* | 2,302 | 1.47* | 4.37 | 1,583 | −1.61* | 1,404 | −0.30* |
| FHDrPSND–AUDMaxSxCnt | 2,302 | 0.61* | 2,302 | 2.05* | 7.76 | 1,583 | −2.10* | 1,404 | −0.30 |
| FHDrAR–AUDDx | 3,192 | 0.58* | 3,192 | 1.55* | 4.74 | 2,177 | −1.54 | 1,770 | −0.28 |
| FHDrAR– AUDMaxSxCnt | 3,192 | 0.58* | 3,192 | 2.06* | 7.81 | 2,177 | −1.55 | 1,770 | −0.31 |
| FHFather–AUDDx | 1,127 | 0.51 | 1,127 | 0.19 | 1.21 | 813 | −0.29 | 714 | −0.01 |
| FHMother–AUDDx | 2,150 | 0.50 | 2,150 | 0.41* | 1.51 | 1,476 | −0.24 | 1,336 | −0.06 |
| FHParent–AUDDx | 2,427 | 0.51 | 2,427 | 0.33* | 1.39 | 1,679 | −0.28 | 1,486 | −0.06 |
| FHFirst–AUDDx | 3,163 | 0.54* | 3,163 | 0.22 | 1.25 | 1,909 | −0.35 | 1,898 | −0.10 |
AUC=area under curve. OR=Odds Ratio.
p<0.003 (Bonferroni corrected).
Associations of FH measures with likelihood of AUD across race/ethnicity.
As shown in Table 4b, in Whites, all dichotomous and density measures were significantly associated with increased odds of AUD. Further, FHDrPSND–AUDMaxSxCnt (OR=23.29) and FHFirst–AUDDx (OR=1.979) presented the most robust associations among density and dichotomous measures respectively. In Blacks, all density measures were significantly associated with increased odds of AUD, being most robust for FHDrAR–AUDMaxSxCnt (OR=7.81). However, among the dichotomous measures, only FHMother–AUDDx and FHParent–AUDDx presented significant associations. FHMother–AUDDx (OR=1.51) yielded the most robust association. Importantly, in both Whites and Blacks, all density (vs. dichotomous) measures presented consistent and substantially robust associations with likelihood of AUD.
Associations of FH measures with age of onset of regular drinking across race/ethnicity.
As shown in Table 4b, in Whites, all dichotomous and density measures were significantly associated with early onset of regular drinking. Further, FHDrPSND–AUDMaxSxCnt (b=−3.21) and FHFirst–AUDDx (b=−0.93) presented the most robust associations among density and dichotomous measures respectively. In Blacks, only FHDrPSND–AUDDx (b=−1.61) and FHDrPSND–AUDMaxSxCnt (b=−2.10) density measures presented significant associations with the latter being most robust. Interestingly, all four dichotomous measures failed to present significant associations. Therefore, in both Whites and Blacks, density (vs. dichotomous) were more robust and consistent in their associations with age of onset of regular drinking.
Associations of FH measures with parietal P3 amplitude across race/ethnicity.
As shown in Table 4b, in Whites, all four FHDr measures were significantly associated with low P3 amplitude. Further, FHDrPSND–AUDMaxSxCnt (b=−0.38) presented the most robust association. However, among dichotomous measures, only FHFather–AUDDx and FHParent–AUDDx were significantly associated. Interestingly, in Blacks, none of the density or dichotomous measures except FHDrPSND–AUDDx were associated with P3 amplitude. Overall, compared to dichotomous measures, albeit only among Whites, associations of greater magnitude were observed for density measures.
4. Discussion
In summary, all four density (vs. dichotomous) measures presented greater diagnostic accuracy in males, females, Whites and Blacks. All four density (vs. dichotomous) measures presented robust associations with all three outcomes, especially in males and Whites. All four density (vs. dichotomous) measures were significantly associated with likelihood of AUD and age of onset of regular drinking in females and only with age of onset of regular drinking, in Blacks. These results corroborate previous findings that density measures of FH have greater predictive value. Nevertheless, the variations observed in the association of density and dichotomous FH measures with P3 amplitude, especially in females (vs. males) and Blacks (vs. Whites), indicate that utility of FH measures may differ depending on the phenotype and the social groups being studied.
Importantly, most studies investigating FH of AUD have focused on males, with data for females being less consistent, suggesting a weaker effect (Hill and Steinhauer 1993; Hill et al., 1995); previous studies using COGA data have shown lower P3 amplitude in female offspring from multiplex AUD families, yet to a lesser degree than in males (Porjesz and Begleiter, 1996a; Porjesz et al., 1998). Indeed, a meta-analysis of 35 studies that investigated P3 amplitude in relation to FH of substance use disorder reported that in contrast to FH+ males, low P3 amplitude is not present in FH+ females (Euser et al., 2011). An alternative explanation for the absence of associations between FH measures and P3 amplitude, in females, may also be attributed to the physiological and social changes that seem to differentially affect males and females in their developmental stages, with males being more susceptible to problem drinking (Schulte et al., 2009). Similarly, considerable evidence shows that compared to Whites, Blacks report later initiation of drinking, lower rates and levels of use across almost all age groups but higher levels of alcohol problems than Whites (Zapolski et al., 2014). Nevertheless, studies have also shown that FH is significantly associated with lower P3 amplitudes in Blacks without being affected by current usage of alcohol. Therefore, it is important to identify how FH measures, psychosocial, cultural factors, and drinking norms, may have race/ethnicity-specific influences on different alcohol outcomes (Hunte et al., 2012; Sartor et al., 2016).
4.1. Strengths and Implications
The present study has several strengths. First, to our knowledge, this is the first study to conduct a systematic comparison of the commonly used dichotomous FH measures with density measures and their associations with alcohol-related clinical (AUD diagnosis), behavioral (age of onset of regular drinking), and neural (P3 amplitude) phenotypes, and examine variations across gender and race/ethnicity. This systematic comparison enabled the discovery of diverse patterns of associations among different FH measures, alcohol outcomes, and diverse social groups. Importantly, the comparison of results across all subjects, males, females, Whites and Blacks allows for testing the general and specific applicability of our findings. Second, to compute the dichotomous and density FH measures, we used subjects’ FH information, alcohol use, AUD symptoms, and diagnosis obtained using only direct interviews. The validity of direct (vs. indirect) FH methods has been shown to be superior (Davies et al., 1997; Vandeleur et al., 2008), thereby ensuring reliability of our findings. Third, the density measures accounted for two variations in the inclusion of affected family members—in one variation, primary and secondary non-descendants were included and in another, the entire extended family (all available relatives) was included. This allowed for encapsulating more familial information and allowed for testing if the predictive validity of FH increased/decreased when considering all available versus only the first- and second-degree relatives. The findings suggest that inclusion of all relatives does not improve the predictive value of the FH measure. Indeed, the density measure–FHDrPSND–AUDMaxSxCnt–based on primary and secondary non-descendants emerged as most consistently robust across alcohol outcomes and social groups. Fourth, contrary to existing studies (Stoltenberg et al., 1998; Milne et al., 2013) that have compared associations of different FH measures with alcohol and substance use symptoms and diagnoses (e.g., alcohol dependence), we examined associations of FH measures with important risk factors for the development of AUD. Importantly, ample evidence shows that age of onset of regular drinking is associated with increased alcohol problems during adult life and that parietal P3 amplitude is a biomarker for AUD-risk. Given that FH is an index of risk that can be assessed early in individuals’ lives, it is meaningful to examine its associations with risk factors that occur sooner in the stages of AUD development. Therefore, these findings can be of great value in informing the planning and development of early prevention and intervention strategies. Lastly, we took advantage of COGA’s multimodal data that are available for a large and ethnically diverse sample with ~equal numbers of males and females, allowing the comparison of FH measures and their associations with clinical, behavioral, and neural phenotypes, across gender, race/ethnicity, and in families with a range of density of FH of AUD, with substantial statistical power. Therefore, our findings may have great applicability in population-based contexts that examine FH of AUD.
Regardless of the findings in our study evidencing the important role of FH and the robustness of density over dichotomous FH measures in predicting alcohol outcomes, it is important to consider alternative explanations: 1) An individual’s own alcohol use may affect the alcohol outcomes studied here, beyond the influence of one’s FH. Although studies (e.g., Pfefferbaum et al., 1991) have shown that effect of FH on neurocognitive alcohol outcomes like P3 amplitude is above and beyond an individual’s drinking history and that the effect of FH does not depend on an individual’s drinking (e.g., Dager et al., 2015), it is nevertheless important for future studies to account for individuals’ current alcohol use. 2) Social determinants like low socio-economic-status (SES) and parental education/income may affect the outcomes examined here, perhaps beyond the influence of FH. Indeed, studies show that although individuals from higher and lower SES may not differ in their alcohol consumption, the latter group is more affected by negative alcohol-related consequences further complicated by race/ethnicity and gender (Collins, 2016). Future studies examining effects of FH should also consider the influence of such social determinants. 3) Lastly, because it is difficult to tease apart the extent of biological (e.g., genes) and psychosocial (e.g., rearing) influences of FH, the outcomes observed here may be due to the genetic transmission, psychosocial effects, or the interaction of both.
4.2. Strengths of density FH measures
Although we computed both dichotomous and density FH measures using familial data from the same COGA subjects and their family members, the strengths of density measures outweigh those of dichotomous measures for the following reasons: First, density measures are more comprehensive and incorporate contributions of alcohol-affected biologically related relatives, type of relatives (e.g., first- or second-degree), and degree of relatedness. Moreover, affectedness of family members was defined using two criteria (DSM-5 AUD lifetime diagnosis and DSM-5 AUD maximum symptom count at any one assessment). Importantly, using DSM-5 based maximum symptom count as an affectedness criterion, allowed for improving on previous measures in capturing the density of the FH more effectively. That is, given the possibility that some family members may not fulfill the diagnostic criteria for AUD but may nevertheless present at least one alcohol-related symptom, inclusion of relatives based on the maximum symptom count is meaningful and more informative. In doing so, the density of one’s FH is more closely captured and the sensitivity of density measures as risk indices is increased even for individuals without any AUD diagnosed relatives. Indeed, the density measure FHDrPSND–AUDMaxSxCnt–based on log-transformed DSM-5 maximum symptom counts of primary and secondary non-descendants, emerged as the most informative measure with the highest diagnostic accuracy at classifying AUD diagnosis and with most robust associations with clinical, behavioral, and neural phenotypes, for all subjects. Second, the density measures used a weighting scheme that corresponded to the affected family members’ degree of relatedness such that the weights decreased exponentially with the increase in degree of relatedness. This formulation was designed to also approximate the amount of biopsychosocial information shared between an individual and his/her affected relative. That is, the biological (genes) and psychosocial (environment) information shared between individuals and their siblings may be more similar than between an individual and a distant cousin. Third, because density measures are ratio/proportion scores, they control for inflation of scores due to variation in subjects’ total number of alcohol-affected relatives. The benefit of using ratio scores, compared to the dichotomous measures which are nominal scores, is that they allow for a maximum potential score to always remain the same (i.e., 1) for all. Moreover, the algorithm used to generate the density measures counts the number of affected relatives and keeps the total weights of known relatives (denominator of the ratio score) constant (see supplementary material). Therefore, even if the affectedness status of a relative were to be unknown, it does not contribute to the density score whatsoever.
Overall, our results corroborate findings from previous comparative studies that density measures are more advantageous FH measures as they contain higher resolution familial information compared to simple dichotomous measures.
4.3. Limitations
Despite the strengths and informativeness of the density measures over commonly used dichotomous measures, several limitations prevail. First, an important caveat is that these density measures may not be utilized by studies where information about biological relatives are not typically available, admittedly making the general applicability of these measures somewhat limited. Second, the AUC for density measures, while greater than those for dichotomous measures, were nevertheless low for diagnostic/screening contexts. Indeed, it has been observed that measures of diagnostic accuracy are very sensitive to the characteristics of the population in which the test accuracy is evaluated. Accordingly, in our analyses we show that diagnostic accuracy is substantially variable across groups, particularly for dichotomous measures. Third, more work is needed to express confidence in the diagnostic accuracy of an FH density score based on how many and which kind of relatives and their affectedness are known for a given individual. Moreover, it has been observed that some measures largely depend on the prevalence of the disorder/condition, while others are highly sensitive to the spectrum of the disorder/condition in the studied population. Indeed, Milne et al. (2013) have shown that for disorders with high (vs. low) prevalence (e.g., AUD, smoking), density (vs. dichotomous) measures should be preferred. Fourth, it has been seen that multiple substance use (e.g., nicotine, marijuana) in individuals with AUD with or without meeting criteria for substance use disorder is often observed as part of their clinical profile, including in the present sample. However, given the substantial sharing of familial vulnerability to alcohol and drug problems, along with evidence for cross-predictions, where a FH of drug problem predicts alcohol use/problems and a FH of alcohol problems predicts substance use/problems (e.g., Kendler et al., 2015), our findings may not be invalid. Nevertheless, future studies should investigate such poly-substance use effects. Lastly, density measures, like dichotomous/other FH measures do not parse apart the effects of biological and psychosocial aspects in their measurement of FH. Although, Zucker et al. (1994) included the extended family in their computation of FEA scores, they reasoned that it mostly represented genetic risk, while Stoltenberg et al. (1998) included only parents and grandparents in their FHD measure, and reasoned that it represented biopsychosocial risk comprising biological effects (genes inherited from parents and grandparents) and psychosocial effects (rearing environment, with the assumption that individuals are most often reared by parents and grandparents). Yet, FH measures are not pure indices of genetic risk, but represent a complex combination of psychosocial family effects (rearing environment, family harmony, cohesion etc.) that interact with one’s molecular genetic risk. Therefore, the inclusion of more (vs. limited) relatives does not necessarily increase the genetic risk or undermine the psychosocial risk components in FH measures. Rather, including contributions from known family members into the measurement of FH, likely increases the informativeness of the role of FH for both aspects (biological and psychosocial). The COGA study has molecular genetic (polygenic risk scores for alcohol-related behaviors) as well as environmental measures (e.g., parental monitoring, family conflict etc.) that will be utilized to address these issues in future studies.
Overall, density (vs. dichotomous) FH measures have greater potential for use as predictors in general alcohol-related research and in analyzing neural correlates of familial risk (low P3 amplitude). Density measures of FH are more informative and present greater utility for use as risk indices, albeit caution should be exercised in using variants of FH measures when gender and race/ethnicity are to be studied.
Supplementary Material
Table 4a:
Descriptive statistics and comparison of density scores using independent t-tests and dichotomous scores using Chi square tests, across race/ethnicity.
| Density Measures | Race/Ethn | N | Mean | SD | t |
|---|---|---|---|---|---|
| FHDrPSND–AUDDx | White | 7,062 | 0.55 | 0.24 | 13.66* |
| Black | 2,302 | 0.47 | 0.23 | ||
|
| |||||
| FHDrPSND–AUDMaxSxCnt | White | 7,062 | 0.44 | 0.18 | 14.01* |
| Black | 2,302 | 0.38 | 0.18 | ||
|
| |||||
| FHDrAR–AUDDx | White | 10,757 | 0.53 | 0.22 | 25.77* |
| Black | 3,193 | 0.43 | 0.19 | ||
|
| |||||
| FHDrAR– AUDMaxSxCnt | White | 10,757 | 0.42 | 0.16 | 27.16* |
| Black | 3,193 | 0.34 | 0.14 | ||
|
| |||||
| Dichotomous Measures | Race/Ethn | N | #(Yes) | %(Yes) | χ 2 |
|
|
|||||
| FHFather–AUDDx | White | 5,358 | 3,458 | 64.5% | 0.25 |
| Black | 1,127 | 736 | 65.3% | ||
|
| |||||
| FHMother–AUDDx | White | 6,986 | 2,332 | 33.4% | 1.98 |
| Black | 2,150 | 753 | 35.0% | ||
|
| |||||
| FHParent–AUDDx | White | 7,484 | 4,692 | 62.7% | 50.45* |
| Black | 2,427 | 1,325 | 54.6% | ||
|
| |||||
| FHFirst–AUDDx | White | 8,446 | 7,397 | 87.6% | 195.00* |
| Black | 3,163 | 2,439 | 77.1% | ||
t=independent t-test statistic. χ2= Pearson Chi square statistic.
p<0.012 (Bonferroni corrected).
Acknowledgements
The Collaborative Study on the Genetics of Alcoholism (COGA), Principal Investigators B. Porjesz, V. Hesselbrock, H. Edenberg, L. Bierut, includes eleven different centers: University of Connecticut (V. Hesselbrock); Indiana University (H.J. Edenberg, J. Nurnberger Jr., T. Foroud); University of Iowa (S. Kuperman, J. Kramer); SUNY Downstate (B. Porjesz); Washington University in St. Louis (L. Bierut, J. Rice, K. Bucholz, A. Agrawal); University of California at San Diego (M. Schuckit); Rutgers University (J. Tischfield, A. Brooks); Department of Biomedical and Health Informatics, The Children’s Hospital of Philadelphia; Department of Genetics, Perelman School of Medicine, University of Pennsylvania, Philadelphia PA (L. Almasy), Virginia Commonwealth University (D. Dick), Icahn School of Medicine at Mount Sinai (A. Goate), and Howard University (R. Taylor). Other COGA collaborators include: L. Bauer (University of Connecticut); J. McClintick, L. Wetherill, X. Xuei, Y. Liu, D. Lai, S. O’Connor, M. Plawecki, S. Lourens (Indiana University); G. Chan (University of Iowa; University of Connecticut); J. Meyers, D. Chorlian, C. Kamarajan, A. Pandey, J. Zhang (SUNY Downstate); J.-C. Wang, M. Kapoor, S. Bertelsen (Icahn School of Medicine at Mount Sinai); A. Anokhin, V. McCutcheon, S. Saccone (Washington University); J. Salvatore, F. Aliev, J. Su, S. I-Chun Kuo, B. Cho (Virginia Commonwealth University); and Mark Kos (University of Texas Rio Grande Valley). A. Parsian and H. Chin are the NIAAA Staff Collaborators.
We continue to be inspired by our memories of Henri Begleiter and Theodore Reich, founding PI and Co-PI of COGA, and also owe a debt of gratitude to other past organizers of COGA, including Ting-Kai Li, P. Michael Conneally, Raymond Crowe, and Wendy Reich, for their critical contributions. This national collaborative study is supported by NIH Grant U10AA008401 from the National Institute on Alcohol Abuse and Alcoholism (NIAAA) and the National Institute on Drug Abuse (NIDA).
Sources of Support: Grants # U10 AA008401 from the National Institute on Alcohol Abuse and Alcoholism (NIAAA) and National Institute on Drug Abuse
Footnotes
Conflict of interest
All coauthors reported no financial interests or potential conflicts of interest.
References
- Alterman AI, Gerstley LJ, Goldstein G, Tarter RE (1987) Comparisons of the cognitive functioning of familial and nonfamilial alcoholics. Journal of Studies on Alcohol 48:425–429. [DOI] [PubMed] [Google Scholar]
- Barthwell AG (1995) Alcoholism in the family: A multicultural exploration, in Recent developments in alcoholism, Vol.12, Women and alcoholism (Galanter M ed), pp 387–404. Plenum Press, New York, NY. [DOI] [PubMed] [Google Scholar]
- Begleiter H, Porjesz B, Bihari B, Kissin B (1984) Event-related potentials in boys at risk for alcoholism. Science 225:1493–1496. [DOI] [PubMed] [Google Scholar]
- Begleiter H, Reich T, Nurnberger J Jr, Li TK, Conneally PM, Edenberg H, Crowe R, Kuperman S, Schuckit M, Bloom F, Hesselbrock V, Porjesz B, Cloninger CR, Rice J, Goate A (1999) The collaborative study on the genetics of alcoholism. Alcohol Health and Research World 19:228–236. [Google Scholar]
- Benegal V, Janin S, Subbukrishna DK Channabasavanna SM (1995) P300 amplitudes vary inversely with continuum of risk in first degree male relatives of alcoholics. Psychiatric Genetics 5:149–156. [DOI] [PubMed] [Google Scholar]
- Berkman L, Kawachi I (2000) Social Epidemiology. Oxford University Press, New York. [Google Scholar]
- Berman MS, Whipple SC, Fitch RJ, Noble EP (1993) P3 in young boys as a predictor of adolescents’ substance abuse. Alcohol 10:69–76. [DOI] [PubMed] [Google Scholar]
- Bohman M (1978) Some genetic aspects of alcoholism and criminality. A population of adoptees. Archives of General Psychiatry 35:269–276. [DOI] [PubMed] [Google Scholar]
- Bohman M, Cloninger R, Sigvardsson S, von Knorring AL (1987) The genetics of alcoholism and related disorders. Journal of Psychiatric Research 21:447–452. [DOI] [PubMed] [Google Scholar]
- Brown MD Reeves MJ (2003) Interval likelihood ratios: another advantage for the evidence-based diagnostician. Ann Emerg Med 42:292–297. [DOI] [PubMed] [Google Scholar]
- Bucholz KK, Cadoret R, Cloninger CR, Dinwiddie SH, Hesselbrock VM, Nurnberger JI Jr, Reich T, Schmidt I, Schuckit MA (1994) A new, semi-structured psychiatric interview for use in genetic linkage studies: a report on the reliability of the SSAGA. Journal of Studies on Alcohol 55:149–158. [DOI] [PubMed] [Google Scholar]
- Cadoret RJ, Cain CA, Grove WM (1980) Development of alcoholism in adoptees raised apart from alcoholic biologic relatives. Archives of General Psychiatry 37:561–563. [DOI] [PubMed] [Google Scholar]
- Cadoret RJ, Garth A (1978) Inheritance of alcoholism in adoptees. British Journal of Psychiatry 132:252–258. [Google Scholar]
- Carlson SR, Iacono WG, McGue M (2004) P300 amplitude in non-alcoholic adolescent twin pairs who become discordant for alcoholism as adults. Psychophysiology 41:841–844. [DOI] [PubMed] [Google Scholar]
- Cohen HL, Wang W, Porjesz B, Bauer L, Kuperman S, O’Connor SJ, Rohrbaugh J, Begleiter H (1994) Visual P300: an interlaboratory consistency study. Alcohol 11:583–587. [DOI] [PubMed] [Google Scholar]
- Collins SE (2016) Associations between socioeconomic factors and alcohol outcomes. Alcohol Research 38:83–94. [DOI] [PMC free article] [PubMed] [Google Scholar]
- Cservenka A, Nagel BJ (2012) Risky decision-making: An FMRI study of youth at high risk for alcoholism. Alcoholism: Clinical and Experimental Research 36:604–615. [DOI] [PMC free article] [PubMed] [Google Scholar]
- Cservenka A (2016) Neurobiological phenotypes associated with a Family History of Alcoholism. Drug and Alcohol Dependence 158:8–21. [DOI] [PMC free article] [PubMed] [Google Scholar]
- Dager AD, Anderson BM, Stevens MC, Pulido C, Rosen R, Jiantonio-Kelly RE, Sisante JF, Raskin SA, Tennen H, Austad CS, Wood RM, Fallahi CR, Pearlson GD (2015) Influence of alcohol use and family history of alcoholism on neural response to alcohol cues in college drinkers. Alcoholism: Clinical and Experimental Research 37:161–171. [DOI] [PMC free article] [PubMed] [Google Scholar]
- Dawson DA (2000) Alcohol consumption, alcohol dependence, and all-cause mortality. Alcoholism: Clinical and Experimental research 24:72–81. [PubMed] [Google Scholar]
- Dawson DA, Harford TC, Grant BF (1992) Family history as a predictor of alcohol dependence. Alcoholism: Clinical and Experimental Research 16:572–575. [DOI] [PubMed] [Google Scholar]
- DeWit DJ, Adlaf EM, Offord DR, Ogborne AC (2000) Age at first alcohol use: A risk factor for the development of alcohol disorders. The American Journal of Psychiatry 157:745–750. [DOI] [PubMed] [Google Scholar]
- Ehlers CL, Phillips E, Sweeny A, Slawecki CJ (2003) Event-related potential responses to alcohol-related stimuli in African American young adults: relation to family history of alcoholism and drug usage. Alcohol and Alcoholism 38:332–338. [DOI] [PubMed] [Google Scholar]
- Euser AS, Arends LR, Evans BE, Greaves-Lord K, Huizink AC, Franken IH (2012) The P300 event-related brain potential as a neurobiological endophenotype for substance use disorders: a meta-analytic investigation. Neuroscience and Biobehavioral Reviews 36:572–603. [DOI] [PubMed] [Google Scholar]
- Euser AS, Van Meel CS, Snelleman M, Franken IH (2011) Acute effects of alcohol on feedback processing and outcome evaluation during risky decision-making: an ERP study. Psychopharmacology 217:111–125. [DOI] [PMC free article] [PubMed] [Google Scholar]
- Florkowski CM (2008) Sensitivity, specificity, receiver-operating characteristic (ROC) curves and likelihood ratios: communicating the performance of diagnostic tests. The Clinical Biochemist Reviews 29:S83–S87. [PMC free article] [PubMed] [Google Scholar]
- Gilman SE, Breslau J, Conron KJ, Koenen KC, Subramanian SV, Zaslavsky AM (2008) Education and race-ethnicity differences in the lifetime risk of alcohol dependence. Journal of Epidemiology and Community Health 62:224–230. [DOI] [PMC free article] [PubMed] [Google Scholar]
- Goodwin DW (1979) Alcoholism and heredity: A review and hypothesis. Archives of General Psychiatry 36:57–61. [DOI] [PubMed] [Google Scholar]
- Goodwin DW, Schulsinger F, Moller N, Hermansen L, Winokur G, Guze SB (1974) Drinking problems in adopted and nonadopted sons of alcoholics. Archives of General Psychiatry 31:164–169. [DOI] [PubMed] [Google Scholar]
- Harford T, Parker D, Grant B (1992) Family history, alcohol use and dependence symptoms among young adults in the United States. Alcoholism: Clinical and Experimental Research 16:1042–1046. [DOI] [PubMed] [Google Scholar]
- Hawkins JD, Graham JW, Maguin E, Abbott R, Hill KG, Catalano RF (1997) Exploring the effects of age of alcohol use initiation and psychosocial risk factors on subsequent alcohol misuse. Journal of Studies on Alcohol and Drugs 58:280–290. [DOI] [PMC free article] [PubMed] [Google Scholar]
- Hesselbrock M, Easton C, Bucholz KK, Schuckit M, Hesselbrock V (1999) A validity study of the SSAGA-A comparison with the SCAN. Addiction 94:1361–70. [DOI] [PubMed] [Google Scholar]
- Hesselbrock V, Begleiter H, Porjesz B, O’Connor S, Bauer L (2001) P300 event-related potential amplitude as an endophenotype of alcoholism-evidence from the collaborative study on the genetics of alcoholism. Journal of Biomedical Science 8:77–82. [DOI] [PubMed] [Google Scholar]
- Hesselbrock VM, Stabenau JR, Hesselbrock MN (1985) Minimal brain dysfunction and neuropsychological test performance in offspring of alcoholics. Recent Developments in Alcoholism 3:65–82. [DOI] [PubMed] [Google Scholar]
- Hill SY (2015) Psychological and neurobiological precursors of alcohol use disorders in high risk youth. Current Addiction Reports 2:104–113. [DOI] [PMC free article] [PubMed] [Google Scholar]
- Hill SY, Muka D, Steinhauer S, Locke J (1995a) P3 amplitude decrements in children from families of alcoholic female probands. Biological Psychiatry 38:622–632. [DOI] [PubMed] [Google Scholar]
- Hill SY, O’Brien J (2015) Psychological and Neurobiological Precursors of Alcohol Use Disorders in High Risk Youth. Current Addiction Reports 2:104–113. [DOI] [PMC free article] [PubMed] [Google Scholar]
- Hill SY, Steinhauer S, Park J, Zubin J (1991) Event-related potential characteristics in children of alcoholics from high density families. Alcoholism: Clinical and Experimental Research 14:6–16. [DOI] [PubMed] [Google Scholar]
- Hill SY, Steinhauer SR (1993) Assessment of prepubertal and post-pubertal boys and girls at risk for developing alcoholism with P300 from a visual discrimination task. Journal of Studies on Alcohol and Drugs 54: 350–358. [DOI] [PubMed] [Google Scholar]
- Hill SY, Steinhauer SR (1993) Assessment of prepubertal and postpubertal boys and girls at risk for developing alcoholism with P300 from a visual discrimination task. Journal of Studies on Alcohol 54:350–358. [DOI] [PubMed] [Google Scholar]
- Hill SY, Steinhauer SR, Locke-Wellman J, Ulrich R (2009) Childhood risk factors for young adult substance dependence outcome in offspring from multiplex alcohol dependence families: a prospective study. Biological Psychiatry 66:750–757. [DOI] [PMC free article] [PubMed] [Google Scholar]
- Hill SY, Yuan H (1999) Familial density of alcoholism and onset of adolescent drinking. Journal of Studies on Alcohol and Drugs 60:7–17. [DOI] [PubMed] [Google Scholar]
- Hill SY, Yuan H, Locke J (1999) Path analysis of P300 amplitude of individuals from families at high and low risk for developing alcoholism. Biological Psychiatry 45:346–359. [DOI] [PubMed] [Google Scholar]
- Hunte HE, Barry AE (2012) Perceived discrimination and DSM-IV–based alcohol and illicit drug use disorders. American Journal of Public health 102:111–117. [DOI] [PMC free article] [PubMed] [Google Scholar]
- Kendler KS, Edwards A, Myers J, Cho SB, Adkins A, Dick D (2015) The predictive power of family history measures of alcohol and drug problems and internalizing disorders in a college populations American Journal of Medical Genetics 168B:337–346. [DOI] [PMC free article] [PubMed] [Google Scholar]
- Keyes KM, Grant BF, Hasin DS (2008) Evidence for a closing gender gap in alcohol use, abuse, and dependence in the United States population. Drug and Alcohol Dependence 93:21–29. [DOI] [PMC free article] [PubMed] [Google Scholar]
- Khoddam R, Worley M, Browne KC, Doran N, Brown SA (2015) Family history density predicts long term substance use outcomes in an adolescent treatment sample. Drug and Alcohol Dependence 147: 235–242. [DOI] [PMC free article] [PubMed] [Google Scholar]
- Labrie JW, Migliuri S, Kenney SR, Lac A (2010) Family history of alcohol abuse associated with problematic drinking among college students. Addictive Behaviors 35:721–725. [DOI] [PMC free article] [PubMed] [Google Scholar]
- Lieb R, Merikangas KR, Hofler M, Pfister H, Isensee B, Wittchen HU (2002) Parental alcohol use disorders and alcohol use and disorders in offspring: a community study. Psychological Medicine 32: 63–78. [DOI] [PubMed] [Google Scholar]
- Meyers JL, Brown Q, Grant BF, Hasin D (2017) Religiosity, race/ethnicity, and alcohol use behaviors in the United States. Psychological Medicine 47:103–114. [DOI] [PMC free article] [PubMed] [Google Scholar]
- Milne BJ, Moffitt TE, Crump R, Poulton R, Rutter M, Sears MR, Taylor A, Caspi A (2013) How should we construct psychiatric family history scores? A comparison of alternative approaches from the Dunedin Family Health History Study. Psychological Medicine 38:1793–1802. [DOI] [PMC free article] [PubMed] [Google Scholar]
- Nurnberger JI Jr, Wiegand R (2011) A Family Study of Alcohol Dependence. Archives of General Psychiatry 61:1246–1256. [DOI] [PubMed] [Google Scholar]
- Nurnberger JI Jr, Wiegand R, Bucholz KK, O’Connor S, Meyer ET, Reich T, Rice J, Schuckit M, King L, Petti T, Bierut L, Hinrichs AL, Kuperman S, Hesselbrock V, Porjesz B (2004) A family study of alcohol dependence: Coaggregation of multiple disorders in relatives of alcohol-dependent probands. Archives of General Psychiatry 61:1246–56. [DOI] [PubMed] [Google Scholar]
- O’Connor S, Morzorati S, Christian JC, Li TK (1994) Heritable features of the auditory oddball event-related potential: Peaks, latencies, morphology, and topography. Electroencephalography and Clinical Neurophysiology 92:115–125. [DOI] [PubMed] [Google Scholar]
- Perlman G, Johnson W, Iacono WG (2009) The heritability of P300 amplitude in 18-year-olds is robust to adolescent alcohol use. Psychophysiology 46:962–969. [DOI] [PMC free article] [PubMed] [Google Scholar]
- Pfefferbaum A, Ford JM, White PM, Mathalon DH (1991) Event-related potentials in alcoholic men: P3 amplitude reflects family history but not alcohol consumption. Alcoholism: Clinical and Experimental Research 15:839–850. [DOI] [PubMed] [Google Scholar]
- Pilatti A, Godoy JC, Brussino SA, Pautass RM (2013) Patterns of substance use among Argentinean adolescents and analysis of the effect of age at first alcohol use on substance use behaviors. Addictive Behavior 38: 2847–50. [DOI] [PubMed] [Google Scholar]
- Polich J, Pollock VE, Bloom FE (1994) Meta-analysis of p300 amplitude from males at risk for alcoholism. Psychological Bulletin 115:55–73. [DOI] [PubMed] [Google Scholar]
- Porjesz B, Begleiter H (1990) Event-related potentials in individuals at risk for alcoholism. Alcoholism 7:465–469. [DOI] [PubMed] [Google Scholar]
- Porjesz B, Begleiter H (1996a) Effects of alcohol on electrophysiological activity of the brain, Vol. 2, Alcohol and Alcoholism: The Pharmacology of Alcohol and Alcohol Dependence (Begleiter H, Kissin B eds), pp. 207–247. Oxford University Press, New York. [Google Scholar]
- Porjesz B, Begleiter H, Litke A, Bauer LO, Kuperman S, O’Connor SJ, Rohrbaugh J (1996b) Visual P3 as a potential phenotypic marker for alcoholism: Evidence from the COGA national project, Recent Advances in Event-Related Brain Potential Research (Ogura C, Koga Y, Shimokochi M eds), pp. 539–549. Elsevier Science, Holland. [Google Scholar]
- Porjesz B, Begleiter H, Reich T, Van Eerdewegh P, Edenberg HJ, Foroud T, Goate A, Litke A, Chorlian DB, Stimus A, Rice J, Blangero J, Almasy L, Sorbell J, Bauer LO, Kuperman S, O’Connor SJ, Rohrbaugh J (1998) Amplitude of visual P3 event-related potential as a phenotypic marker for a predisposition to alcoholism: preliminary results from the COGA Project. Collaborative Study on the Genetics of Alcoholism. Alcoholism: Clinical and Experimental Research 22:1317–1323. [PubMed] [Google Scholar]
- Porjesz B, Rangaswamy M, Kamarajan C, Jones KA, Padmanabhapillai A, Begleiter H (2005) The utility of neurophysiological markers in the study of alcoholism. Clinical Neurophysiology 116:993–1018. [DOI] [PubMed] [Google Scholar]
- Powers G, Berger L, Furhmann D, Fendrich M (2017) Family history density of substance use problems among undergraduate college students: Associations with heavy alcohol use and alcohol use disorder. Additive Behaviors 71:1–6. [DOI] [PubMed] [Google Scholar]
- Prescott CA, Caldwell CB, Carey G, Vogler GP, Trumbetta SL, Gottesman II (2005) The Washington University Twin Study of Alcoholism. American Journal of Medical Genetics 134:48–55. [DOI] [PubMed] [Google Scholar]
- Rangaswamy M, Jones KA, Porjesz B, Chorlian DB, Padmanabhapillai A, Kamarajan C, Kuperman S, Rohrbaugh J, O’Connor SJ, Bauer LO, Schuckit MA, Begleiter H (2007) Delta and theta oscillations as risk markers in adolescent offspring of alcoholics. International Journal of Psychophysiology 63:3–15. [DOI] [PMC free article] [PubMed] [Google Scholar]
- Rehm J, Mathers C, Popova S, Thavorncharoensap M, Teerawattananon Y, Patra J (2009) Global burden of disease and injury and economic cost attributable to alcohol use and alcohol-use disorders. Lancet 373:2223–2233. [DOI] [PubMed] [Google Scholar]
- Rice JP, Reich T, Bucholz KK, Neuman RJ, Fishman R, Rochberg N, Hesselbrock VM, Nurnberger JI Jr, Schuckit MA, Begleiter H (1995) Comparison of direct interview and family history diagnoses of alcohol dependence. Alcoholism: Clinical and Experimental Research 19:1018–1023. [DOI] [PubMed] [Google Scholar]
- Russell M, Cooper ML, Frone MR (1990) The influence of sociodempgraphic characteristics on familial alcohol problems: Data from a community sample. Alcoholism: Clinical and Experimental Research 14:221–226. [DOI] [PubMed] [Google Scholar]
- Sartor CE, Jackson KM, McCutcheon VV, Duncan AE, Grant JD, Werner KB, Bucholz KK (2016) Progression from First Drink, First Intoxication, and Regular Drinking to Alcohol Use Disorder: A Comparison of African American and European American Youth. Alcoholism: Clinical and Experimental Research 40:1515–1523. [DOI] [PMC free article] [PubMed] [Google Scholar]
- Schuckit MA, Smith TL (1996) An 8-year follow-up of 450 sons of alcoholic and control subjects. Archives of General Psychiatry 53:202–10. [DOI] [PubMed] [Google Scholar]
- Schulte MT, Ramo D, Brown SA (2009) Gender differences in factors influencing alcohol use and drinking progression among adolescents. Clinical Psychology Review 29:535–547. [DOI] [PMC free article] [PubMed] [Google Scholar]
- Simundic A (2009) Measures of diagnostic accuracy: Basic definitions. The Journal of the International Federation of Clinical Chemistry and Laboratory Medicine 19: 203–211. [PMC free article] [PubMed] [Google Scholar]
- Steinhauer SR, Hill SY, Zubin J (1987) Event-related potentials in alcoholics and their first-degree relatives. Alcohol 4:307–314. [DOI] [PubMed] [Google Scholar]
- Stoltenberg SF, Mudd SA, Blow FC, Hill EM (1998) Evaluating measures of family history of alcoholism: density versus dichotomy. Addiction 93:1511–1520. [DOI] [PubMed] [Google Scholar]
- Substance Abuse and Mental Health Services Administration, Racial/ Ethnic Differences in Mental Health Service Use among Adults (2015) HHS Publication No. SMA-15–4906. Rockville, MD: Substance Abuse and Mental Health Services Administration. [Google Scholar]
- Turner WM, Cutter HSG, Worobec TG, O’Farrell TJ, Bayog RD, Tsaung MT (1993) Family history models of alcoholism: Age of onset, consequences and dependence. Journal of Studies on Alcohol 54:164–171. [DOI] [PubMed] [Google Scholar]
- van Beijsterveldt CEM, van Baal GCM (2002) Twin and family studies of the human electroencephalogram: A review and a meta-analysis 61:111–138. [DOI] [PubMed] [Google Scholar]
- van Stralen KJ, Stel VS, Reitsma JB, Dekker FW, Zoccali C. Jager KJ (2009) Diagnostic methods I: Sensitivity, specificity, and other measures of accuracy. Kidney International 75:1257–1263. [DOI] [PubMed] [Google Scholar]
- Varma VK, Basu D, Malhotra A, Sharma A, Mattoo SK (1994) Correlates of early- and late-onset alcohol dependence. Addictive Behaviors 19:609–619. [DOI] [PubMed] [Google Scholar]
- Verhulst B, Neale MC, Kendler KS (2015) The heritability of alcohol use disorders: A meta-analysis of twin and adoption studies. Psychological Medicine 45:1061–1072. [DOI] [PMC free article] [PubMed] [Google Scholar]
- Zapolski TCB, Pedersen SL, McCarthy DM, Smith GT (2014) Less drinking, yet more problems: Understanding African American drinking and related problems. Psychological Bulletin 140:188–223. [DOI] [PMC free article] [PubMed] [Google Scholar]
- Zucker RA, Ellis DA, Fitzgerald HE (1994) Developmental evidence for at least two alcoholisms. Annals of New York Academy of Sciences 708:134–146. [DOI] [PubMed] [Google Scholar]
Associated Data
This section collects any data citations, data availability statements, or supplementary materials included in this article.