

Abstract
Objective:
To determine the accuracy (trueness and precision) of two different rapid prototyping (RP) techniques for the physical reproduction of three-dimensional (3D) digital orthodontic study casts, a comparative assessment using two 3D STL files of two different maxillary dentitions (two cases) as a reference was accomplished.
Materials and Methods:
Five RP replicas per case were fabricated using both stereolithography (SLA) and the PolyJet system. The 20 reproduced casts were digitized with a highly accurate reference scanner, and surface superimpositions were performed. Precision was measured by superimposing the digitized replicas within each case with themselves. Superimposing the digitized replicas with the corresponding STL reference files assessed trueness. Statistical significance between the two tested RP procedures was evaluated with independent-sample t-tests (P < .05).
Results:
The SLA and PolyJet replicas showed statistically significant differences for trueness and precision. The precision of both tested RP systems was high, with mean deviations in stereolithographic models of 23 (±6) μm and in PolyJet replicas of 46 (±13) μm. The mean deviation for trueness in stereolithographic replicas was 109 (±4) μm, while in PolyJet replicas, it was 66 (±14) μm.
Conclusions:
Comparing the STL reference files, the PolyJet replicas showed higher trueness than the SLA models. But the precision measurements favored the SLA technique. The dimensional errors observed in this study were a maximum of 127 μm. In the present study, both types of reproduced digital orthodontic models are suitable for diagnostics and treatment planning.
Keywords: Rapid prototyping, 3D printing, Stereolithography, Dental casts
INTRODUCTION
Rapid prototyping (RP) technologies offer the possibility to generate a physical orthodontic cast model from digital data in a fast and economic way. With this additive technology, a virtual three-dimensional (3D) model of a patient's occlusion can be transformed into a hard copy anytime, as might be necessary for patient referrals, to fulfill country-specific legal requirements or to meet American Board of Orthodontics examination conditions.1 RP in the future may enable an entirely new digital workflow between the orthodontist and the dental laboratory.2
Rapid prototyping is a generic name given to a range of related technologies that build models on a layer-by-layer basis.3 The oldest and most established RP system is stereolithography (SLA), introduced in 1986 by 3D Systems (Rock Hill, SC). An SLA machine consists of a bath of photosensitive resin, a model-building platform, and an ultraviolet laser for curing the resin.4 Recently, the inkjet technology was fused with the existing SLA technology, creating a new generation of 3D printing machines that are smaller, less expensive, and have reduced printing times.5 The technology behind this new RP process is mostly called inkjet-based 3D printing, while the more familiar terms MultiJet and PolyJet printing are product names. A key element of the inkjet-based 3D printing process is the print head that sprays layers of photosensitive polymers, which precisely represent the cross-sectional profile of the model on the building platform.6
Currently, physical models can be reproduced from digital data records in various ways, but the question remains as to how accurate and reliable these systems are. The accuracy of a virtual or reproduced orthodontic cast is defined by the parameters “trueness” and “precision” (ISO 15725-1).7 The objectives of this study were to assess trueness and precision of physical reproductions of digital orthodontic study casts fabricated by two different RP processes: SLA and inkjet-based 3D printing (PolyJet), to follow established standards.7,8 The accuracy of physical and digital occlusions were compared, and the deviation patterns on superimposed images were detected visually. The null hypothesis was that SLA and PolyJet printing deliver 3D replicas of digital orthodontic study models of the same trueness and with the same precision.
MATERIALS AND METHODS
From the local digital orthodontic model archive scanned with a surface laser printer (R700, 3Shape, Copenhagen, Denmark), two 3D digital representations of two different maxillary arches were selected. Case 1 was characterized by little crowding and a long dental arch, while case 2 showed marked anterior crowding and a clearly shorter dental arch.
The two digital files selected were first converted into the stereolithography file format (STL), a data interface that is widely used in RP and computer-aided manufacturing. Five resin replicas per case were fabricated using the stereolithography system (SLA) and five replicas using an inkjet-based 3D-printer (PolyJet). To ensure a professional and high-end fabrication of the physical replicas, specialized companies in the field of RP carried out the reproduction of the digital data sets. The orders were made online through the manufacturers' homepage. The residential address of the first author was chosen as the delivery address. In this way, it was ensured that the manufacturers would not recognize that the replicas were being used for study purposes.
The SLA replicas were fabricated by a mid-sized SLA machine (Viper si2 SLA, 3D Systems GmbH, Darmstadt, Germany) using an epoxy-based resin (Accura). The layer thickness varied with 100 μm at the base and 50 μm on the level of the gingiva and the teeth. The replicas were post cured for 15 minutes before being cleaned with water. The production time of one hard copy was about 2 hours.
The PolyJet models were manufactured by a mid-range 3D printer using the new inkjet-based technology (Objet Eden 260, Stratasys Ltd, Eden Prairie, Minn, and Rehovot, Israel). The dimensional resolution of this printer is about 0.016 mm.6 Two photopolymer resins were used in the fabrication process, one as core material to build up the model (VeroDent) and the other as support material (FullCure705). After removing the supporting material with a jet of pressurized water, the models were cleaned in a bath of caustic soda. The production time per unit was about 1 hour 20 minutes.
The 20 replicas received were stored in darkness to prevent exposure to sunlight. Then they were scanned by a reference scanner (Infinite Focus Standard, Alicona Imaging, Graz, Austria). The validation and the standardized measurement process were described in detail previously.8 Briefly, the point size of each scan was 1.6 × 1.6 μm in the x and y directions and 0.25 μm in the z direction. During scanning, the model was positioned on the back of its base (z-axis = vertical axis of the cast) and was oriented with the dental arch pointing toward the scanning machine (y-axis = sagittal axis of the cast; x-axis = transverse axis of the cast). A single scan took 21 to 29 hours and produced around 20 million surface measuring points. A minimal surface coating was performed to ensure optimal scanning properties of the models (Sirona Optispray, Sirona Dental Systems, Bensheim, Germany).
The obtained data sets from the digitized RP replicas were then imported into a program, where they could be superimposed pairwise or superimposed to the reference data sets of the two cases, respectively. The superimposition of two data sets was done automatically by a best-fit algorithm (IFM software 3.5.0.1, Alicona Imaging, Graz, Austria). After the best-fit alignment, the signed distance for each measured surface point of data set 1 to the surface of data set 2 was calculated. The distance was negative if the surface point from data set 1 was inside the surface of data set 2 and positive if vice versa. These distances were stored and sorted, starting from the smallest value to the largest value, to obtain a histogram of the distance values. The level for the 10% lowest (quantile 10%) and the 10% highest deviations (quantile 90%) were determined, and the half span from these two levels ((quantile90 − quantile10)/2) was used as a measure of the deviation between superimposed models.9 Trueness was measured, in each case, by superimposition of the data sets obtained from the SLA and PolyJet replicas with their related original STL data file. Precision was determined for each case by superimposing the data sets obtained from the SLA or the PolyJet replicas with themselves (eg, for the five stereolithographic replicas of case 1: A with B/C/D/E, B with C/D/E, C with D/E, D with E).
Mean, range, and standard deviation were calculated for trueness and precision within each of the two cases and technologies. Tests of normal distribution (Shapiro-Wilk) and independent-sample t-tests were performed to evaluate statistical differences between the procedures (SPSS 19). The level of significance was set at P < .05. In addition, all superimpositions were examined visually for deviation patterns.
RESULTS
Mean, standard deviation (SD), and range for trueness and precision of each case and technology are displayed in Tables 1 and 2. The Shapiro-Wilk test of normality showed a non-cadata. The independent-sample t-tests (P ≤ .05) resulted in statistically significant measurement differences between SLA and PolyJet replicas for trueness and precision. In both cases, the trueness of PolyJet replicas (66 ± 14 μm/62 ± 8 μm) was significantly higher compared with the SLA casts (109 ± 4 μm/92 ± 23 μm). Regarding precision, the results were opposite, with the SLA technique (20 ± 4 μm/23 ± 6 μm) performing significantly better than the PolyJet system (46 ± 13 μm/38 ± 14 μm). Except for the trueness measurements of case 2, the SLA replicas showed results fluctuating in a much smaller range around the mean value.
Table 1.
Trueness by SLA and PolyJet Generated Replicas of Case 1 and 2 in μm
|
|
SLA |
PolyJet |
P Value |
| Case 1 (n = 5) | <.001 | ||
| Mean ± SD | 109 ± 4 | 66 ± 14 | |
| Range | 105 to 116 | 53 to 83 | |
| Case 2 (n = 5) | .002 | ||
| Mean ± SD | 92 ± 23 | 62 ± 8 | |
| Range | 67 to 127 | 47 to 72 |
Table 2.
Precision by SLA and PolyJet Generated Replicas of Case 1 and 2 in μm
|
|
SLA |
PolyJet |
P Value |
| Case 1 (n = 10) | .001 | ||
| Mean ± SD | 20 ± 4 | 46 ± 13 | |
| Range | 14 to 26 | 26 to 67 | |
| Case 2 (n = 10) | <.001 | ||
| Mean ± SD | 23 ± 6 | 38 ± 14 | |
| Range | 15 to 36 | 21 to 67 |
Figure 1 shows examples of superimpositions of the digitized SLA and PolyJet replicas with the corresponding STL reference file (trueness). The scaling of the color indicator was set to ±100 μm. Light green and light blue areas indicate few or no deviations between the superimposed models, whereas areas in black, dark purple, and red indicate larger deviations. Systematic differences can be seen in both types of reproduced casts in fissures, at the cervical margin, and at cusp tips (z plane). The PolyJet replicas show less pronounced errors in both cases in the z plane, with clearly fewer deviations exceeding ±60 μm. Further systematic differences are present in the SLA casts at the mesial surfaces of the molars and the palatal surfaces of the central incisors (y plane). The SLA models of case 2, with the shorter dental arch, are less affected by this error in the y plane.
Figure 1.
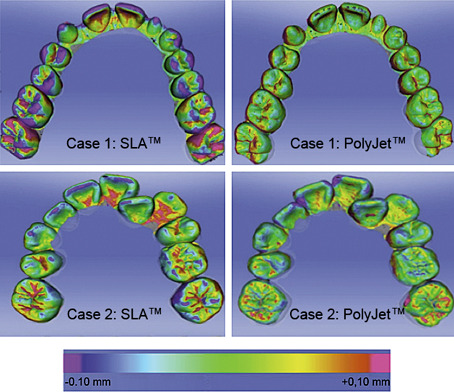
Examples of superimpositions showing trueness for both cases and technologies. For SLA technology, higher deviations can be seen over the whole arch in case 1 and over the whole arch and in the incisor and molar regions in case 2. The same trends were found for PolyJet technology, however, with significant minor deviations.
Figure 2 shows examples of surface superimpositions of the obtained data sets of the SLA or PolyJet replicas with themselves (precision). The major deviations are seen at fissures, cusp tips, and incisal edges (z plane). For both groups, the range of observed differences is low, documented by the rather harmonic color profiles of the superimpositions.
Figure 2.
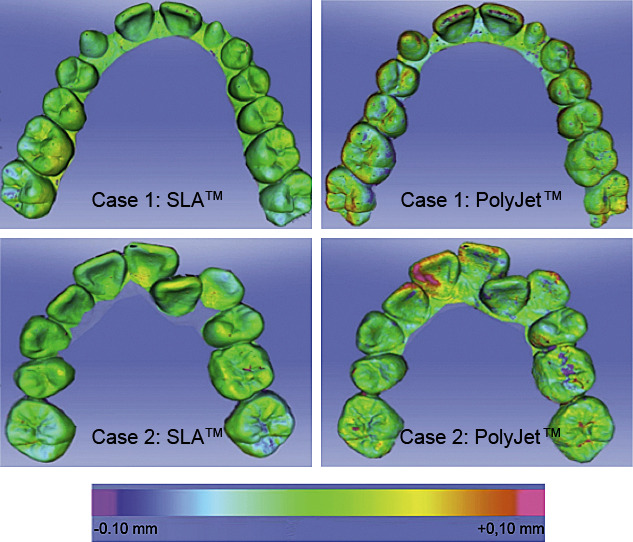
Examples of superimpositions showing precision for both cases and technologies. The deviations with SLA technology are very low for both cases and in each region. For PolyJet technology, higher deviations can be observed, especially in the incisor region of case 2.
DISCUSSION
There are multiple reasons why orthodontic study casts may continue to be needed in the future. Legal requirements to keep the casts for future reference for at least 10 years after the completion of active treatment create substantial problems with their physical storage in every practice or department.10,11
Numerous studies comparing measurements made on digital and traditional casts have shown that the evidence for the validity of digital models is accumulating,12 and it is possible that digital models may replace plaster models as the “gold standard” in orthodontics. In a recent systematic review, 17 studies comparing digital measurements made on virtual orthodontic casts with manual measurements performed on the reference plaster models were included.12 The review concluded that the observed differences between the approaches were likely to be clinically acceptable. The present study did not give any answers regarding the first step of capturing teeth shape and dimensions but investigated the second important aspect of reproducing physical models from digital data. The reference models in this study were the 3D surfaces of the STL files handed forward to the RP machines. To measure trueness and precision with electronic surface superimpositions, the fabricated resin replicas had to be scanned, which introduced a methodological error to the study. The scanning process used in this study, however, had a documented high trueness (5.3 ± 1.1 μm) and precision (1.6 ± 0.6 μm) for scanning a complete dental arch model.8 In other words, the errors introduced by the digitalization process were extremely small and several times less than those introduced by the reproduction techniques. Mathematical superimposition, as performed in this study, is advantageous to overcome the major human errors associated with landmark identification. The exact localization of landmarks on digital 3D models as well as on RP replicas is sometimes very difficult and subject to a learning curve.13
The results reject the null hypothesis that the SLA and PolyJet systems deliver reproductions of digital orthodontic study casts of the same trueness and with the same precision. While the SLA replicas in this study showed significantly lower mean values for precision, the PolyJet replicas had better trueness (P < .05). A rational explanation for the poorer performance of the SLA technology in the present study is hard to find because potential sources of error can be found at any of the several stages of the RP process. Errors can arise during the actual production and the postcuring of the RP models.14 These include residual polymerization of the resin, effects of support structures, laser diameter and path, thickness of layer, and surface finishing. During the fabrication of the SLA replicas used in this study, there were no support structures added and no surface finishing measures performed. But the possibility of minor shrinkage of SLA models during the building process and postcuring phase cannot be ruled out.13 That this might apply to this study is supported in particular by the color profiles of the superimpositions showing trueness (Figure 1); the systematic differences seen in SLA casts at the mesial surfaces of the molars and the palatal surfaces of the central incisors indicate a shortening of the models in the sagittal plane. The SLA casts of case 2 with the shorter dental arch are less affected by this error. In addition, the same replicas are clearly more affected from dimensional errors in the z plane, which are present at cusp tips; at the gingival margin; and in fissures. One possible explanation for this observation could be that the build layer thickness in SLA models was higher at 0.05 mm versus 0.016 mm in PolyJet replicas, and therefore, the loss of surface detail at the mentioned areas was more pronounced.
The observed differences were generally low, documented by the harmonic color profiles of the superimpositions (Figure 2). In contrast to trueness, precision has to be considered high in both tested technologies and therefore was satisfactory.
The comparison of the results from this study with others is difficult since different reference models, RP processes, or evaluation methods were used. Keating et al.1 examined one stereolithographic replica and found statistically significant differences in the z plane when compared with its corresponding plaster and 3D digital model. One explanation for this observation could be the high build layer thickness of the investigated SLA model (0.15 mm), which adversely affected the model's z plane; another could be that manual linear measurements were unable to display many 3D changes in the cast's y and x planes.8 Ibrahim et al.6 tested the accuracy of selective laser sintering (SLS), 3D printing (3DP), and inkjet-based 3D printing (PolyJet) for the reproduction of digital mandibular anatomy deriving from computed tomography scans. The mean dimensional error of the PolyJet system in that study was 1.23 mm, slightly better than the 3DP technique (1.44 mm) but worse than SLS (0.9 mm). When compared with the dry mandible, the SLS prototype showed the greatest dimensional accuracy, while the PolyJet technique reproduced anatomic details of the mandible the most accurately. A comparison of these observations with the current results is not possible because it is not evident which of the individual steps necessary to fabricate an RP model from a dry anatomic structure (image acquisition, computer-aided design data conversion, replica production) contributed how much to the dimensional errors reported. Choi et al.14 followed each step needed to produce an RP model and could identify various factors that caused dimensional errors in these models. The comparison of an entire SLA skull replica with its underlying 3D visual model showed a mean dimensional error of 0.57 ± 0.62 mm. This rather high dimensional error of the SLA system compared with the current results may have various causes: not identical production and measurement methods, different object sizes, and different measurement lengths. A recent study15 with a comparable approach compared stone casts and reconstructed RP models produced by only one printer (Z Printer, 3D Systems) in different degrees of crowding. They concluded that models produced by this printer were not clinically comparable with conventional stone models regardless of the degree of crowding. This is another proof that it is essential to check the method of RP when comparing study results.
The limitations of the present study were its insufficient comparability to the work of other authors and the chosen production modalities. Nevertheless, the study included two RP systems instead of one as in the previously mentioned study.15 Within each tested RP system, a wide range of machine types and materials are available. Moreover, the basic settings of each machine can be modified. These variables lead to a great variety of possible combinations, which all probably would deliver a different result. The machine types used in this study were mid-sized, in our opinion appropriate for the production of small prototypes such as dental casts. The selection of the materials used was based on the recommendations by the manufacturers of the RP machines for the fabrication of medical RP models. Despite efforts to choose representative production settings, the current results cannot determine the absolute accuracy of the entirety of the RP techniques tested, but they certainly give a valuable indication to orthodontists on the accuracy level that can be expected.
The study intended to focus only on the accuracy of the pure RP production process to quantify the possible errors introduced by the new RP technologies. To evaluate the entire process of model fabrication, different pathways have to be taken into account: (1) intraoral data acquisition, (2) conventional impression and extraoral scanning of the impression, and (3) conventional impression, plaster model fabrication, and subsequent extraoral scanning. In addition, these steps have to be integrated so that they can be compared with the conventional process of impression taking and plaster model fabrication. This question will be investigated in a future study.
Several authors addressed the question of a clinically significant measurement error when comparing digital and physical orthodontic casts. For Schirmer and Wiltshire,16 a measurement difference of less than 0.20 mm was clinically acceptable, while Hirogaki et al.17 demanded an accuracy of about 0.30 mm. For Halazonetis,18 an accuracy of 0.50 mm would be inadequate for orthodontic study models. With measurement differences not exceeding 0.13 mm, the current results were well within these reported guidelines. Therefore, the conclusion is that both rapid RP systems evaluated in this study delivered physical reproductions of digital orthodontic casts that were suitable for diagnostic, treatment-planning, and demonstration purposes. The question of whether these RP techniques were also sufficiently accurate for orthodontic appliance construction remains unanswered, and the minimum accuracy required for that purpose needs further investigation. In the future, the PolyJet system and other inkjet-based 3D printers could be part of orthodontic practices and dental laboratories because this new RP technique is more practical and economic than older systems such as SLA and SLS. Further investigations should evaluate the accuracy of simpler and less expensive 3D printer types than those tested in this study, as well as the impact of different RP materials on accuracy.
CONCLUSIONS
-
•
Comparing the STL reference files, the PolyJet replicas showed higher trueness than the SLA models.
-
•
The precision measurements favored the SLA technique.
-
•
The dimensional errors observed in this study were a maximum of 127 μm (0.13 mm).
-
•
Both types of reproduced digital orthodontic models were suitable for diagnostic and treatment planning purposes.
REFERENCES
- 1.Keating AP, Knox J, Bibb R, Zhurov AI. A comparison of plaster, digital and reconstructed study model accuracy. J Orthod. 2008;35:191–201. doi: 10.1179/146531207225022626. [DOI] [PubMed] [Google Scholar]
- 2.Kuo E, Miller RJ. Automated custom-manufacturing technology in orthodontics. Am J Orthod Dentofacial Orthop. 2003;123:578–581. doi: 10.1067/mod.2003.S0889540603000519. [DOI] [PubMed] [Google Scholar]
- 3.Webb PA. A review of rapid prototyping (RP) techniques in the medical and biomedical sector. J Med Eng Technol. 2000;24:149–153. doi: 10.1080/03091900050163427. [DOI] [PubMed] [Google Scholar]
- 4.Winder J, Bibb R. Medical rapid prototyping technologies: state of the art and current limitations for application in oral and maxillofacial surgery. J Oral Maxillofac Surg. 2005;63:1006–1015. doi: 10.1016/j.joms.2005.03.016. [DOI] [PubMed] [Google Scholar]
- 5.Faber J, Berto PM, Quaresma M. Rapid prototyping as a tool for diagnosis and treatment planning for maxillary canine impaction. Am J Orthod Dentofacial Orthop. 2006;129:583–589. doi: 10.1016/j.ajodo.2005.12.015. [DOI] [PubMed] [Google Scholar]
- 6.Ibrahim D, Broilo TL, Heitz C, et al. Dimensional error of selective laser sintering, three-dimensional printing and PolyJet models in the reproduction of mandibular anatomy. J Craniomaxillofac Surg. 2009;37:167–173. doi: 10.1016/j.jcms.2008.10.008. [DOI] [PubMed] [Google Scholar]
- 7.Ender A, Mehl A. Full arch scans: conventional versus digital impressions—an in-vitro study. Int J Comput Dent. 2011;14:11–21. [PubMed] [Google Scholar]
- 8.Ender A, Mehl A. Accuracy of complete-arch dental impressions: a new method of measuring trueness and precision. J Prosthet Dent. 2013;109:121–128. doi: 10.1016/S0022-3913(13)60028-1. [DOI] [PubMed] [Google Scholar]
- 9.Mehl A, Gloger W, Kunzelmann KH, Hickel R. A new optical 3-D device for the detection of wear. J Dent Res. 1997;76:1799–1807. doi: 10.1177/00220345970760111201. [DOI] [PubMed] [Google Scholar]
- 10.Asquith J, Gillgrass T, Mossey P. Three-dimensional imaging of orthodontic models: a pilot study. Eur J Orthod. 2007;29:517–522. doi: 10.1093/ejo/cjm044. [DOI] [PubMed] [Google Scholar]
- 11.Leifert MF, Leifert MM, Efstratiadis SS, Cangialosi TJ. Comparison of space analysis evaluations with digital models and plaster dental casts. Am J Orthod Dentofacial Orthop. 2009;136:16e11–14. doi: 10.1016/j.ajodo.2008.11.019. [DOI] [PubMed] [Google Scholar]
- 12.Fleming PS, Marinho V, Johal A. Orthodontic measurements on digital study models compared with plaster models: a systematic review. Orthod Craniofac Res. 2011;14:1–16. doi: 10.1111/j.1601-6343.2010.01503.x. [DOI] [PubMed] [Google Scholar]
- 13.Barker TM, Earwaker WJ, Lisle DA. Accuracy of stereolithographic models of human anatomy. Australas Radiol. 1994;38:106–111. doi: 10.1111/j.1440-1673.1994.tb00146.x. [DOI] [PubMed] [Google Scholar]
- 14.Choi JY, Choi JH, Kim NK, et al. Analysis of errors in medical rapid prototyping models. Int J Oral Maxillofac Surg. 2002;31:23–32. doi: 10.1054/ijom.2000.0135. [DOI] [PubMed] [Google Scholar]
- 15.Wan Hassan WN, Yusoff Y, Mardi NA. Comparison of reconstructed rapid prototyping models produced by 3-dimensional printing and conventional stone models with different degrees of crowding. Am J Orthod Dentofacial Orthop. 2017;151:209–218. doi: 10.1016/j.ajodo.2016.08.019. [DOI] [PubMed] [Google Scholar]
- 16.Schirmer UR, Wiltshire WA. Manual and computer-aided space analysis: a comparative study. Am J Orthod Dentofacial Orthop. 1997;112:676–680. doi: 10.1016/s0889-5406(97)70234-8. [DOI] [PubMed] [Google Scholar]
- 17.Hirogaki Y, Sohmura T, Satoh H, Takahashi J, Takada K. Complete 3-D reconstruction of dental cast shape using perceptual grouping. IEEE Trans Med Imag. 2001;20:1093–1101. doi: 10.1109/42.959306. [DOI] [PubMed] [Google Scholar]
- 18.Halazonetis DJ. Acquisition of 3-dimensional shapes from images. Am J Orthod Dentofacial Orthop. 2001;119:556–560. doi: 10.1067/mod.2001.115459. [DOI] [PubMed] [Google Scholar]