

Optogenetic fMRI highlights the involvement of corticothalamic circuit as an early mediator of recovery after stroke.
Abstract
Poststroke optogenetic stimulations can promote functional recovery. However, the circuit mechanisms underlying recovery remain unclear. Elucidating key neural circuits involved in recovery will be invaluable for translating neuromodulation strategies after stroke. Here, we used optogenetic functional magnetic resonance imaging to map brain-wide neural circuit dynamics after stroke in mice treated with and without optogenetic excitatory neuronal stimulations in the ipsilesional primary motor cortex (iM1). We identified key sensorimotor circuits affected by stroke. iM1 stimulation treatment restored activation of the ipsilesional corticothalamic and corticocortical circuits, and the extent of activation was correlated with functional recovery. Furthermore, stimulated mice exhibited higher expression of axonal growth–associated protein 43 in the ipsilesional thalamus and showed increased Synaptophysin+/channelrhodopsin+ presynaptic axonal terminals in the corticothalamic circuit. Selective stimulation of the corticothalamic circuit was sufficient to improve functional recovery. Together, these findings suggest early involvement of corticothalamic circuit as an important mediator of poststroke recovery.
INTRODUCTION
Functional recovery can occur after stroke and is attributed to rewiring of neural connections in areas adjacent to or remotely connected to the infarct (1, 2). Understanding of neural circuit reorganization is thus an important step toward developing future therapeutic strategies for stroke recovery (3, 4). Neuromodulation represents an emerging and promising approach with the potential to shape the reorganization of neural circuits in a desired trajectory (5–7). Brain stimulation techniques such as electrical stimulation and transcranial magnetic stimulation have been used to directly alter the activity of circuits to promote recovery of functions and to study circuit remapping (1, 5). However, these techniques nonselectively target all cell types (e.g., neurons, glia, and oligodendrocytes) near the stimulation site, making it difficult to study the underlying cell types and circuit mechanisms driving poststroke recovery (8, 9).
To address this, optogenetic stimulations have been used to activate selective cell types and circuits to promote functional recovery after stroke (10–12). Data from our laboratory and others have shown that optogenetic neuronal stimulations in the ipsilesional primary motor cortex (iM1, same side of stroke) (10), thalamocortical circuit (11), contralesional corticospinal tract (12), and contralesional deep cerebellar nuclei (13) can promote functional recovery after stroke. While optogenetic stimulation is effective in driving cell type–specific activations at the site of stimulation, it has also been shown that local optogenetic stimulations can alter functions of downstream brain circuits at distant areas (14). Hence, although the aforementioned poststroke brain stimulation strategies are effective in enhancing recovery, it is unclear how these stimulations affect the global network dynamics and which downstream circuits were altered to enhance recovery.
It has been shown that stroke disrupts the balance of excitatory/inhibitory circuits in both the preinfarct zone and distant sites. Surviving neurons in the peri-infarct zone undergo structural and functional reorganization that is related to a remapping of lost function (6). Functional network analysis using mesoscale optical imaging and optogenetic stimulations has been used to interrogate network properties at the cortical level. Using these methods, Lim and colleagues (15) showed that the pattern of recovery of functional connectivity within the peri-infarct zone is heterogeneous and does not follow a homeostatic upscaling of responses observed in the entire network over the course of recovery after stroke. Moreover, it has been suggested that acute stroke leads to an unmasking of existing pathways for sensory processing (16). Brown and colleagues (17) demonstrated that poststroke sensory remapping is accompanied by development of abnormal prolonged sensory-evoked responses and altered patterns of regional connectivity in both the peri-infarct zone and more remote sites. Although optical imaging has been instrumental in delineating the pattern of circuit reorganization after stroke, this technique is limited to interrogation of a subset of brain networks, namely, cortical circuits in vivo.
To investigate whole-brain neural circuit mechanisms (cortical and subcortical circuits) underlying poststroke recovery, we used a technique called optogenetic functional magnetic response imaging (ofMRI) to examine brain-wide spatiotemporal changes of neural circuit dynamics after optogenetic stimulation treatment (OST)–induced recovery after stroke. This unique approach integrates optogenetic stimulation with fMRI, allowing unbiased, longitudinal tracking of functional brain circuit dynamics in the same animals during recovery while simultaneously using optogenetics to manipulate specific neurons/circuits in vivo (18). Stimulations of iM1 excitatory neurons during fMRI can directly evoke activation of circuits involved in motor and sensory functions, allowing us to rigorously investigate the causal influence of genetically defined excitatory neuronal populations in iM1-connected circuits (18, 19). By comparing the areas of brain activation between nonstimulated and iM1-stimulated stroke mice, we have uncovered key neural circuits involved in poststroke recovery.
RESULTS
iM1 excitatory neuronal stimulation activates a widespread network of cortical and subcortical areas
We performed ofMRI experiments as described in the experimental timeline (Fig. 1A). We used mice expressing AAV1-CamKIIa-hChR2-eYFP (adeno-associated virus serotype 1–calcium/calmodulin-dependent protein kinase IIa–channelrhodopsin-2–enhanced yellow fluorescent protein) with optical fiber implanted in the iM1 layer V excitatory neurons (Fig. 1, A and D). At 4 to 5 weeks following virus injection, we performed the behavioral response test to iM1 stimulation and confirmed that all mice exhibit contralateral forelimb movements during stimulations (movie S1). Global brain circuit activation evoked by optogenetic simulation was examined at the pre- and poststroke time points in a 7T MR scanner (Fig. 1B). The ofMRI scans were performed at prestroke day (baseline) and on poststroke day 3 (PD3), PD15, and PD29. During ofMRI, the blood oxygen level–dependent (BOLD) signal in the whole brain was acquired with an evoked stimulus of 10-Hz iM1 stimulations in a block-design paradigm (Fig. 1B). All stroke mice included in the study underwent transient middle cerebral artery occlusion (MCAO) and exhibited infarct at least in ipsilesional striatum and primary somatosensory cortex (S1), as confirmed by both T2-weighted MRI and histological verification using MAP2 (microtubule-associated protein 2) and CD68 immunohistochemistry (Fig. 1E). Mice were balanced into two groups (Stim and NoStim): Stim group received 10 consecutive days of 10-Hz iM1 OST, from PD5 to P14 (Fig. 1C) (10), and NoStim group underwent similar procedures but did not receive OST.
Fig. 1. The experimental timeline and procedures.
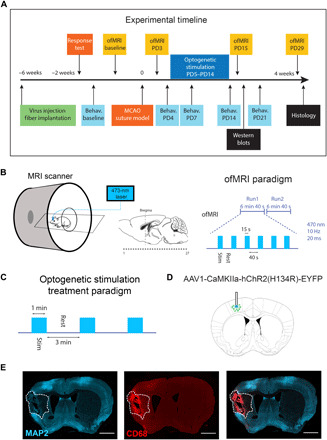
(A) Adult C57BL/6J mice first underwent a stereotaxic surgery for virus injection and optical fiber implantation to target iM1 layer V excitatory neurons. Behavioral response to iM1 stimulation was confirmed at 4 weeks after injection. Sensorimotor behavioral testing comprising rotating beam tests were conducted at prestroke, PD4, PD7, PD14, and PD21. Mice underwent transient MCAO on day 0. ofMRI sessions were performed at the following time points to obtain global brain circuit activation maps: prestroke and PD3, PD15, and PD29. Two groups of mice were used: NoStim group (n = 8) and Stim group (n = 9). Stim group received daily stimulations between PD5 and PD14. Mice were euthanized on PD15 and PD30 for Western blots and histology, respectively. (B) Functional MRI scans covering the whole brain (27 coronal slices as shown by small dots) were acquired during 10-Hz iM1 stimulation. The ofMRI stimulation paradigm consisted of two runs, each comprising six blocks of 15-s on and 40-s off periods. (C) OST paradigm: The Stim group received daily iM1 stimulations consisting of three 1-min stimulation periods with 3-min rest periods in between each stimulation. NoStim group went through identical procedures without any stimulations. (D) Diagram illustrates the optical fiber implant location in iM1 where ChR2-eYFP was expressed. (E) Representative images illustrating histological validation of infarct size using immunohistochemistry with neuronal marker MAP2 (left) and inflammatory activation marker CD68 (middle); combined MAP2 and CD68 (right). All mice used in this study exhibited infarcts in both the ipsilesional striatum and S1. Scale bar, 1000 μm.
To investigate global brain circuit activation patterns, we first performed ofMRI at prestroke baseline in all mice. We found that iM1 stimulation activated a widespread brain network including the ipsilateral M1, M2, S1, thalamus, striatum, and the contralateral M1 and cerebellum (Fig. 2A) [n = 17; corrected for multiple comparison using Gaussian random field theory (GRF), P < 0.05]. Analysis of the fMRI time series of key brain areas showed that the greatest activation was detected in the ipsilateral M1, M2, S1, and thalamus, with the largest volume of activation in the ipsilateral M1 and thalamus (Fig. 2B). Other activated areas include ipsilesional dorsal striatum, contralesional motor cortex, and contralesional cerebellum (fig. S1). We quantified the magnitude and volume of activation for each individual area. All these areas showed a significant activation volume and magnitude during stimulation at baseline on a per subject basis (P < 0.01 for M1, M2, and thalamus; P < 0.05 for S1; Bonferroni corrected; Fig. 2B). Comparison of prestroke baseline activations between Stim and NoStim groups showed that there was no significant difference in either magnitude or volume of activation in any of the activated areas (P > 0.4 in all cases; Fig. 2B).
Fig. 2. iM1 excitatory neuronal stimulation activates a widespread network of cortical and subcortical areas before stroke.
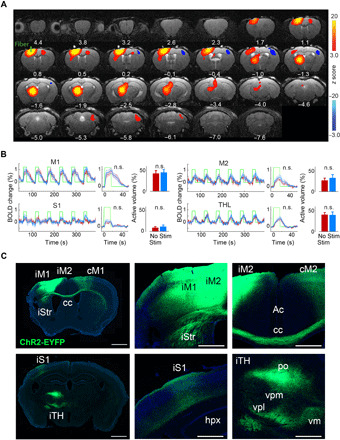
(A) ofMRI activation maps at prestroke baseline. Brain areas were activated by iM1 stimulation at prestroke baseline. Color-coded activation maps indicate z score values (red, increased activation; blue, decreased activation) and are corrected for multiple comparisons using GRF, P < 0.05 (n = 17). Number below each slice indicates distance relative to bregma. (B) Quantitative analysis of activation volume and magnitude in key brain areas activated at prestroke baseline. For each area, left panel shows BOLD signal change time series during the six blocks of iM1 stimulation averaged across Stim mice (n = 9, blue) and NoStim mice (n = 8, red). Green line indicates the on and off stimulation periods. The middle graph shows the BOLD signal change time series averaged across all blocks in each group. The bar plots (right) show the percentage of activated volume in each area in the Stim (blue) and NoStim (red) group. There is no difference in either magnitude of activation (middle) or activation volume (bar plots) between the Stim and NoStim group at prestroke baseline (n.s., not significant; P > 0.4 in all areas). (C) Histological examination confirmed that ChR2-eYFP is expressed in iM1-connected regions, consistent with brain areas that are functionally activated during iM1 stimulation as demonstrated in (A). M2, secondary motor cortex; Str, striatum; cc, corpus callosum; Ac, Anterior cingulate; hpx, hippocampus; TH, thalamus; po, posterior thalamic nucleus; vpm, ventral posteromedial thalamic nucleus; vpl, ventral posterolateral thalamic nucleus; vm, ventromedial thalamic nucleus; cM1, contralesional M1; iTH, ipsilesional thalamusi; iStr, ipsilesional striatum; iS1, ipsilesional primary somatosensory cortex. Scale bar, 1000 μm.
Histological examination of ChR2-eYFP expression showed that the ofMRI-activated regions also matched the ChR2 expressed axonal projections from the injected site in iM1 (Fig. 2C). Expression analysis confirmed that hChR2-eYFP was expressed locally in iM1 and its axonal projections including ipsilateral M2, S1, striatum, and several thalamic nuclei, as well as contralateral M1 and M2 (Fig. 2C).
Optogenetic excitatory neuronal stimulation in iM1 promotes functional recovery after stroke
One week after prestroke baseline ofMRI sessions, mice underwent transient MCAO (30 min). At PD3, stroke mice were scanned using a T2-weighted structural scan to visualize infarct. Groups were balanced by their behavior performance, infarct size, and locations (Fig. 3A). In both groups, all mice exhibited similar infarct in the ipsilesional S1 and striatum, with some mice showing extended infarct in the ipsilesional thalamus (iTH) and hippocampus (four mice in each group; Fig. 3A). The total infarct volume was similar between the two groups (P > 0.9, Fig. 3B).
Fig. 3. iM1 excitatory neuronal stimulation promotes functional recovery after stroke.
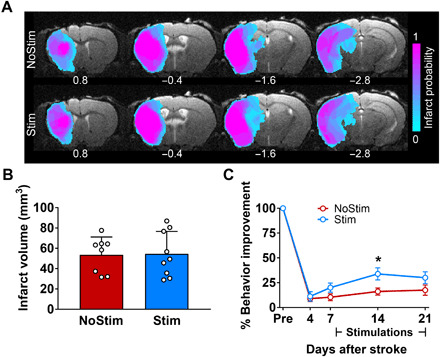
(A) Images represent T2-weighted MRI on PD3. The color-coded map shows the probability of infarct at different brain areas for mice included in this study (n = 17). Infarct areas were detected in ipsilesional somatosensory, parietal and temporal cortices, striatum, thalamus, and hippocampus. (B) Quantitation of total infarct volume shows no difference between Stim (blue) and NoStim (red) groups (P > 0.9). Data are expressed as means ± SEM with scatter plot of individual mice. (C) Stimulated stroke mice (blue) exhibited significant behavior improvement in their sensorimotor function compared to the NoStim mice (red) on PD14. Speed of traveling is expressed as percent improvement compared to prestroke baseline. n = 8 for NoStim mice, n = 9 for Stim mice. Two-way analysis of variance (ANOVA) with Bonferroni’s post hoc test, *P < 0.05. Data are expressed as means ± SEM.
To investigate whether repeated iM1 excitatory neuronal stimulations can promote functional recovery, we assessed the behavioral performance of stroke mice on the horizontal rotating beam test, an established functional behavior test that can detect sensory-motor deficits after stroke (20). Behavioral evaluations were performed at prestroke (baseline) and PD4, PD7, PD14, and PD21 in both groups (Fig. 1A). Stimulated stroke mice exhibited significant improvement in their sensorimotor function, traveling significantly faster on PD14 (relative to their prestroke performance) (Fig. 3C) and traveling longer distances on PD14 and PD21 (relative to PD4, the time point of greatest deficit) (fig. S2). Thus, optogenetic excitatory iM1 stimulation treatment enhanced functional recovery after stroke.
iM1 stimulation restores activation in thalamus and peri-infarct cortical areas after stroke
Next, we investigated the brain circuit dynamics after stroke and examined which circuits were altered by OST to enhance recovery. By comparing statistical maps of brain activation between the Stim and NoStim groups at prestroke baseline and various poststroke time points, we identified motor and sensory circuits disrupted by stroke and revealed several key circuits restored by OST (Fig. 4). Figure 4 shows the activated areas in response to excitatory iM1 stimulation in each day and group (n = 17; corrected for multiple comparison using GRF, P < 0.05). There was no significant difference in activation across groups on baseline and PD3, as tested by t statistics. On PD3, we observed a decreased BOLD response during iM1 stimulation as compared to baseline (Fig. 4A, second row). Specifically, on PD3, none of the brain regions showed increased activation, and the iM1 and iTH showed a decreased BOLD response during iM1 stimulation as compared to baseline (Fig. 4A, second row). Notably, at PD15, we found that iTH activity was significantly restored only in the Stim group (Fig. 4A, third row). A direct statistical comparison across groups showed that the activation of iTH and peri-infarct areas in S1 were significantly increased by the early effect of stimulation in the Stim compared to the NoStim group (n = 17; corrected for multiple comparison using GRF, P < 0.05; fig. S3A). However, on PD29, only ipsilesional S1 exhibited significantly greater increased activation in the Stim compared to the NoStim group (fig. S3B).
Fig. 4. iM1 excitatory neuronal stimulation restores activation in the iTH and somatosensory cortex after stroke.
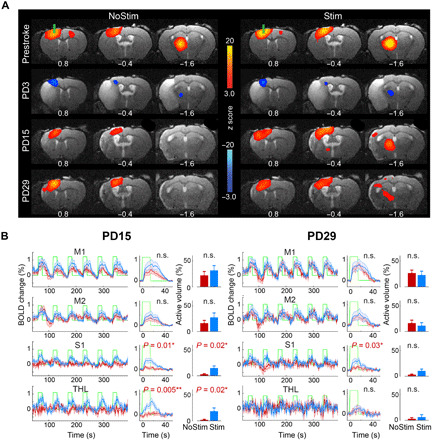
(A) ofMRI activation maps in the NoStim (left) and Stim group (right) at prestroke and PD3, PD15, and PD29. Color-coded activation maps indicate z score values (red, increased activation; blue, decreased activation) and are corrected for multiple comparisons using GRF, P < 0.05 (n = 8 in NoStim group, n = 9 in Stim group). At prestroke and PD3, there is no difference in activation between groups during iM1 stimulation. At PD3, all mice exhibit a depressed response throughout the brain. At PD15 and PD29, the NoStim mice show some recovery of activation locally around the stimulation site at iM1 and in ipsilesional S1, while the stimulated mice show greater recovery of activation around the stimulation site at iM1 and in ipsilesional S1, as well as in remote areas such as the iTH. (B) Quantitative analysis of BOLD signal time series at key brain areas revealed that at PD15, the Stim mice (blue) show significant greater activation in the iTH and S1 areas compared to the NoStim mice (red), both in terms of activation magnitude and volume of activation. Two sample t statistics is used to compare the magnitude of activation (middle) and the activated volume (bar plots) between groups (the related P values are reported on top of each panel, Bonferroni corrected). At PD29, only the ipsilesional S1 activation remains significantly higher in the Stim compared to the NoStim group (magnitude of activation, P < 0.05). Abbreviations are listed in Fig. 2.
Furthermore, fMRI time-series analysis of key brain areas confirmed that both the magnitude and volume of activation are significantly greater in the iTH and S1 on PD15 in the Stim group compared to the NoStim group (Fig. 4B). At PD29, S1 still exhibited greater magnitude of activation in the Stim group (P < 0.05; Fig. 4B); however, thalamic activation was no longer different across groups on PD29 (P > 0.5). Note that the induced activation locally around the implanted fiber at iM1 was not significantly different across groups on any of the assessment days (on baseline, P > 0.6; PD3, P > 0.7; PD15, P > 0.3; and PD29, P > 0.6). Thus, repeated OST led to early restoration of activity in the corticothalamic circuit, followed by sustained recovery of corticocortical connections.
We also evaluated the restoration of brain activity relative to the prestroke baseline. Hence, we performed additional regression analyses to compare the brain activation maps relative to the prestroke baseline in each group. The results reported in fig. S4 confirmed that early after stroke, both groups show extensive decreased activation on PD3. On PD15 and PD29, this decreased activation in the Stim group has disappeared, indicating that stimulations restored activation to an extent similar to prestroke baseline. In contrast, the NoStim group shows significant continued depressed activation in the iTH, at least until PD29 (fig. S4).
Ipsilesional corticocortical and corticothalamic circuits are involved at different stages of recovery after stroke
To further investigate the relationship between circuit activation and behavior functional recovery at different stages after stimulation treatment, we identified brain areas whose functional recovery was correlated with the amount of early and late behavioral improvements on a per subject basis. We performed two separate general linear model (GLM) analyses on PD15 and PD29. Early and late behavioral improvements were defined as the percentage change from PD4 in distance traveled in the rotating beam test at PD14 and PD21, respectively. This analysis revealed that the extent of BOLD signal change in the iTH at PD15 compared to PD3 was significantly correlated with early behavioral improvement in the Stim group [Fig. 5, A and B; correlation coefficient (r) = 0.87, P < 0.01]. However, the change in the activity of ipsilesional sensorimotor cortex at PD15, including peri-infarct M1 and S1 areas, was not correlated with early behavioral improvements (Fig. 5B). On the other hand, the change in the BOLD signal at PD29 in the ipsilesional S1 and iM1, but not in the iTH, was positively correlated with late behavioral improvements in the Stim group (Fig. 5, C and D; r = 0.74, P < 0.05). In the NoStim group, there was no brain area correlated with either early or late behavioral improvements at PD15 or PD29 (Fig. 5, B and D). We further separated the activated cortical cluster into M1 and S1 subclusters based on anatomical atlas and performed separate correlation analysis with behavior. We found that none of the subclusters were significantly correlated with late behavioral improvements, although there was a trend with the M1 subcluster in the Stim group (Stim group, M1 cluster: r = 0.65, P = 0.06, S1 cluster: r = 0.46; P = 0.21; and NoStim group, M1 cluster: r = 0.11; P = 0.80, S1 cluster: r = 0.26; P = 0.54). Together, these analyses support double dissociation of the involvement of ipsilesional corticothalamic and ipsilesional corticocortical circuits at early versus late stages of functional recovery following stimulation treatment after stroke.
Fig. 5. Distinct involvements of the corticothalamic and corticocortical circuits at different phases of recovery following stimulation treatment after stroke.
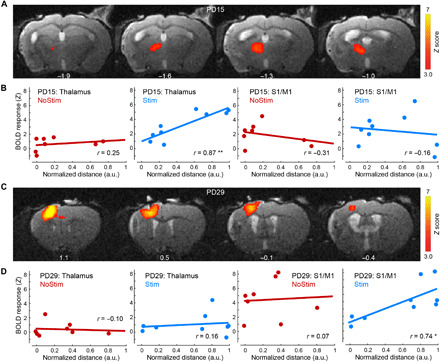
(A) Color-coded activation maps show brain areas whose activation at PD15 is significantly correlated with the amount of early behavioral improvements in the Stim group. Z score maps are corrected for multiple comparisons using GRF, P < 0.05. (B) At PD15, the BOLD signal change in the iTH, but not in the ipsilesional cortical areas (including M1 and S1), was significantly correlated with early behavioral improvements on a per subject basis exclusively in the Stim group. Abscissas represent the percentage change from PD4 in distance traveled in the rotating beam test at PD14. a.u., arbitrary units. (C) Color-coded activation maps show that activation in the ipsilesional corticocortical circuits on PD29 was significantly correlated with late behavioral improvements in the Stim group. (D) At PD29, the change in the BOLD signal in the ipsilesional cortex, but not in the thalamus, was positively correlated with late behavioral improvements exclusively in the Stim group. Abscissas represent the percentage change from PD4 in distance traveled in the rotating beam test at PD21. **P < 0.01 and *P < 0.05.
iM1 stimulated mice exhibit higher ChR2 terminal expression and plasticity marker in the iTH
To identify which of the subthalamic nuclei is involved in the recovery of activation on PD15, we used the Allen Mouse Brain Atlas to segment different nuclei and registered them into our template space (Fig. 6A and fig. S5) (21). We then calculated the percentage of active volume in response to stimulation in each thalamic nucleus on baseline and PD15 on a per subject basis. Three nuclei showed partial restoration of activation in the Stim mice on PD15 (Fig. 6B), including posterior nucleus (PO), ventral posterior nucleus (VP), and ventral anterior-lateral complex of the thalamus (VAL). None of these nuclei were activated in the NoStim mice (P > 0.1; Fig. 6B). In addition, there was no significant difference in the volume of activation in any thalamic nuclei during the baseline session between the two groups (P > 0.3; Fig. 6B).
Fig. 6. Activation in distinct nuclei of the iTH by iM1 stimulation.
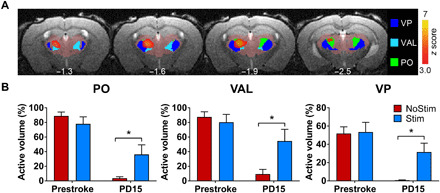
(A) Images represent the spatial overlap between the mask of different thalamic nuclei and the statistical map representing the increased activation from PD3 to PD15 in the stimulated mice. z score maps are corrected for multiple comparisons using GRF, P < 0.05. (B) Quantitative analysis showed that the volume of activation in three ipsilesional thalamic nuclei was significantly recovered in the stimulated mice when compared to the NoStim mice on PD15 (*P < 0.05, Bonferroni corrected). These include PO, VP, and VAL of the thalamus.
To investigate whether the activation of the corticothalamic and corticocortical circuit corresponds to a change in their axonal terminals, we examined changes in the density of iM1 axonal projections by quantifying ChR2 expression in the iTH and peri-infarct zone in S1 (Fig. 7, A to C). ChR2 expression in the iM1 was also quantified to determine whether ChR2 expression in the injection site is similar between Stim and NoStim groups. ChR2 expression levels were calculated by taking the average fluorescence intensity, subtracted from average background intensity (see fig. S6B), in each region of interest. Figure 7 (A and B) shows representative coronal sections of ChR2-eYFP expression in the ipsilesional anterior striatum, as well as cortex (iM1 and S1 peri-infarct zone) (Fig. 7A) and iTH (Fig. 7B). Quantification analysis revealed that while ChR2 expression (average fluorescence intensity) is similar across groups in the injection site iM1, the terminal expression of ChR2 in the iTH is significantly elevated in the Stim compared to the NoStim group (two-sample t statistics, P < 0.01, t15 = 3.05; Fig. 7C). The terminal expression of ChR2 at the peri-infarct S1 region, however, did not show any difference across groups (P > 0.7). To account for subject-level differences in viral transduction in excitatory neurons at the iM1 injection site, we also normalized the ChR2 expression levels at the iTH and peri-infarct S1 by the average ChR2 expression at the iM1 injection site on a per subject basis (fig. S6). Consistent with the results reported in Fig. 7C, the iTH showed a significant elevation of normalized ChR2 expression level in the Stim compared to the NoStim group (fig. S6; P < 0.01, t15 = 3.11).
Fig. 7. iM1 excitatory neuronal stimulation increases plasticity marker expression in the corticothalamic circuit.
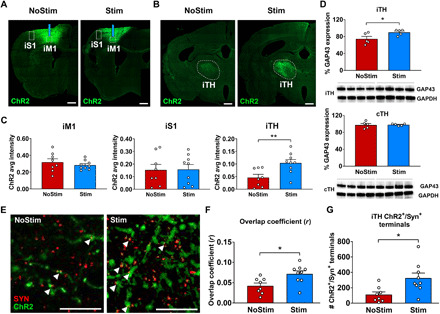
Representative images of ChR2-eYFP expression at the ipsilesional striatal (iM1 and iS1 peri-infarct zone) (A) and thalamic (iTH) (B) coronal slices in the Stim and NoStim groups. Dashed lines indicate selected regions of interest. Scale bar, 500 μm. (C) Graphs show quantification of ChR2 expression in the site of injection in iM1, iS1 peri-infarct zone, and the iTH in the Stim (blue) and NoStim (red) groups. The ordinate represents the average fluorescence intensity in the corresponding region of interest subtracted from the average background intensity. Stimulated mice exhibit significantly higher axonal terminal expression of ChR2 in iTH, when compared to the NoStim group (two-sample t statistics, **P < 0.01), while the ChR2 expression level is comparable between groups at the injection site in iM1 (P > 0.25). Scale bar, 100 μm. (D) Western blot analyses on the iTH and contralesional thalamus (cTH) tissues show that stimulated mice exhibit a significant increase in plasticity marker GAP43 protein levels in iTH (two-sample t statistics, *P < 0.05), but not in the contralesional thalamus. (E) Representative high magnification images of ChR2 (green) and Synaptophysin, a presynaptic marker (red) in the thalamus of NoStim (left) and Stim (right) group. (F) Stim mice showed significant increase in the colocalization of ChR2+/Synaptophysin+ axonal presynaptic terminals in iTH when compared to NoStim mice, as evaluated by Manders’ overlap coefficient (two-sample t statistics, *P < 0.05). (G) Furthermore, the number of ChR2+/Synaptophysin+ presynaptic terminals in iTH is significantly higher in the Stim group when compared to the NoStim group (two-sample t statistics, *P < 0.05). n = 8 for NoStim mice, n = 9 for Stim mice.
To provide further evidence that stimulated mice exhibit increased axonal structural plasticity in the corticothalamic circuit, we performed additional immunostaining and colocalization analyses using a presynaptic marker (Synaptophysin), followed by high-magnification fluorescence microscopy to quantify colocalization of Synaptophysin with ChR2 expression in the iM1 axonal presynaptic terminals in the thalamus. The results of this analysis corroborated our previous results, indicating higher ChR2 expression at the Synaptophysin+ presynaptic terminals in the Stim mice compared to the NoStim mice (P < 0.05; Fig. 7E and fig. S7), as well as higher colocalization of ChR2+/Synaptophysin+ terminals in the thalamus, as evaluated by calculating the overlap coefficient (22), in the Stim mice compared to the NoStim mice (P < 0.05; Fig. 7F). We also quantified the number of iM1-projecting thalamic presynaptic terminals and found higher number of iM1-thalamus presynaptic terminals (Synaptophysin+/ChR2+) in the Stim compared to NoStim mice (P < 0.05; Fig. 7G).
Moreover, we investigated whether the restoration of activation in the thalamus was associated with poststroke synaptic plasticity by examining the expression of axonal growth-associated protein 43 (GAP43), a key growth cone phosphorylation protein that has been highly linked to neurite outgrowth and plasticity after stroke (23, 24). Western blot analyses of the ipsilesional and contralesional thalamus tissues collected on PD15 show that stimulated mice exhibited a significant increase in plasticity marker GAP43 in the iTH (Fig. 7D), but not in the contralesional thalamus, suggesting that iM1 excitatory neuronal stimulations may enhance synaptic plasticity in the ipsilesional corticothalamic circuit. These analyses together with the ChR2 quantification of axonal projections suggest an increase in iM1 axonal projections to the iTH, possibly as a result of corticothalamic axonal sprouting in the Stim group after stroke.
Selective stimulation of the corticothalamic circuit is sufficient to improve functional recovery after stroke
To test the specific contribution of the corticothalamic circuit in poststroke recovery, we performed additional stimulation studies using a circuit-specific optogenetic targeting approach (25). We injected AAV1-CamKIIa-hChR2-eYFP in iM1 to express ChR2 in excitatory neurons and then implanted optical fiber in the iTH PO nucleus to selectively stimulate iM1-thalamus projection neurons (Fig. 8, A and B). Both anatomical scans and immunostaining of glial fibrillary acidic protein (GFAP) to label fiber tract confirmed successful expression of ChR2 at the site of fiber implantation in the iTH (Fig. 8C). Six weeks after virus/implant surgeries, mice underwent transient MCAO to induce stroke. T2-weighted MRI on PD3 showed that all mice exhibited infarct at least in ipsilesional striatum and S1 (Fig. 8D). Similar to our main experiment, mice were balanced into two groups (iTH-Stim and NoStim): iTH-Stim group received 10 consecutive days of 10-Hz iTH OST, from PD5 to PD4 (10), and NoStim group underwent similar procedures but did not receive OST. Analysis of T2-weighted images confirmed that the total infarct volume was similar between the two groups (P > 0.7; Fig. 8E). Sham mice were also included in the study as an internal control for the rotating beam test. All sham mice completed 120-cm distance and exhibited similar traveling speed at prestroke baseline, indicating that the iM1-iTH circuit surgery did not alter behavior function [sham, 16.38 ± 1.28 cm/s; NoStim, 16.16 ± 1.15 cm/s; Stim, 16.16 ± 1.22 cm/s; P = 0.9938, one-way analysis of variance (ANOVA)]. Behavioral assessment on the horizontal rotating beam test was performed at prestroke (baseline) and PD4, PD7, and PD14 in both groups. We found that iTH-stimulated stroke mice exhibited improved sensorimotor recovery, as demonstrated by significantly higher traveling speed on PD14 (Fig. 8F). Thus, stimulation of the corticothalamic circuit (iM1-iTH) alone can improve functional recovery after stroke. These results support our main finding that the corticothalamic circuit is a key circuit driving early stimulation-induced motor behavior recovery after stroke.
Fig. 8. Selective stimulation of the corticothalamic circuit is sufficient to improve functional recovery after stroke.
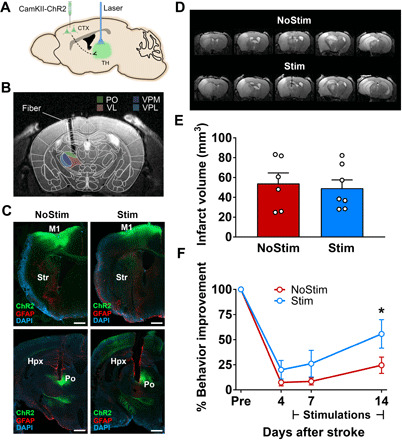
(A) Schematic illustrates selective targeting of the corticothalamic circuit: Virus injection (AAV1-CamKIIa-ChR2-eYFP) in iM1 and optical fiber implanted in the iTH. (B) Image represents the spatial overlap between the color-coded mask of different thalamic nuclei and the location of the implanted optical fiber. (C) Representative images at the M1 level (top) and thalamus level (bottom) show the ChR2-eYFP expression (green) locally at the injection site at iM1 and at its axonal projections around PO nucleus in the iTH. GFAP expression (red) illustrates the border of the implanted fiber in the thalamus. Left and right panels show representative images in the Stim and NoStim mice respectively. Scale bar, 500 μm. (D) Representative T2-weighted MR images of the infarct on PD3 in NoStim (top) and Stim (bottom) mice. (E) Quantitation of total infarct volume shows no difference between Stim (blue) and NoStim (red) groups (n = 7 and 6 in the Stim and NoStim underwent imaging on PD3, two-sample t statistics, P > 0.7). Data are expressed as means ± SEM with scatter plot of individual mice. (F) Stimulated stroke mice (blue) exhibited significant behavior improvement in their sensorimotor function compared to the NoStim mice (red) on PD14. n = 10 per group. Two-way ANOVA with Bonferroni’s post hoc test, *P < 0.05.
DISCUSSION
In this study, we report the first longitudinal study using ofMRI to identify neural circuit mechanisms of poststroke recovery induced by optogenetic neuronal stimulation. The unique ofMRI approach enabled us to examine the local and remote projections from the excitatory layer V neurons of the motor cortex and elucidate their stage-specific involvement in the process of recovery. Our activation circuit map analysis revealed that iM1 excitatory neuronal stimulation promotes functional recovery through restoration of activation in two key circuits. First, during early phase following repeated stimulation (PD15), the restoration of ipsilesional corticothalamic circuit activation is associated with enhanced recovery in stimulated mice (Fig. 4). In the later phase (PD29), the restoration of ipsilesional corticocortical circuit activation in the peri-infarct area is related to the sustained recovery of function after stroke (Fig. 4). Moreover, the recovery of ipsilesional corticothalamic and corticocortical circuits during early and late phases, respectively, is correlated with behavioral recovery (Fig. 5). Our ChR2 terminal expression analysis data indicate that the axonal projections of iM1 excitatory neurons to the iTH are significantly elevated in stimulated mice (Fig. 7, A to C). Our analysis using colocalization of ChR2 and Synaptophysin within the thalamus in stimulated mice further corroborates the network-level finding by examining the underlying neuroplasticity mechanisms (Fig. 7, E to G). The iTH in the stimulated mice also exhibited significant higher level of plasticity marker GAP43 (Fig. 7D), suggesting that the early recovery of ipsilesional corticothalamic circuit in stimulated mice is likely due to an increase in structural plasticity (e.g., axonal sprouting) in the iTH of stimulated mice. To the best of our knowledge, our study is the first to highlight the role of the corticothalamic circuit as an early mediator of recovery after stroke. The application of optogenetic fMRI method in stroke is novel and provides strong imaging evidence on the effect of stimulation in connected circuits (i.e., thalamus). Furthermore, using circuit-specific stimulations, we demonstrated that stimulation of the corticothalamic circuit alone can improve recovery, indicating a beneficial role of this circuit in poststroke recovery.
Previously, we have shown that repeated optogenetic stimulation of iM1 neurons can promote behavioral recovery after stroke (10). We also demonstrated that optogenetic targeting of other nodes in the sensorimotor network such as the deep cerebellar nuclei can promote robust recovery (13). Both of these studies used pan-neuronal stimulation of spatially defined targets and did not investigate the selective “cell type–specific” contribution of different neuronal populations and their circuit mechanisms. In the current study, we used viral targeting to selectively activate the excitatory neurons in the layer V of M1 and investigate its contribution in poststroke functional recovery. The viral vector we used in our studies is an AAV virus expressing ChR2 under the CaMKIIa promoter, which specifically expresses in excitatory neurons in cortex (26). Although, the injected virus would transfect different cortical layers due to diffusion, the depth of our implanted fiber (0.7 mm from the surface of the brain) targets layer V (and possibly also superior part of layer VI) that contains motor output excitatory neurons. Mice exhibit forelimb movements during stimulation that indicates activation of the corticospinal neurons in layer Vb (movie S1). Our ofMRI prestroke activation maps show that stimulations of the excitatory neurons in iM1 engage a widespread network of brain areas including the ipsilateral M1, M2, S1, thalamus, and the striatum, as well as contralateral M1, M2, and the cerebellum (Fig. 2A). These results are consistent with the sites of virus expression in terminal regions, as well as anatomical projections of M1 layer V and layer VI using retrograde viral tracking methods as outlined in the Allen Mouse Brain Connectivity Atlas (27), including bilateral M1 and M2, and ipsilateral S1, thalamus, and striatum (Fig. 2C). M1 projects to the contralateral cerebellar cortex through a disynaptic pathway (28). Both layer VA and layer VI M1 pyramidal neurons send strong monosynaptic projections to S1 pyramidal neurons, which in turn project back to M1 (29). In addition, both layer VI and VA M1 neurons send projection to different thalamic nuclei (30). While the layer VI corticothalamic M1 neurons project to PO, VM (ventromedial), and VL (ventrolateral) nuclei of the thalamus, some layer VB M1 corticospinal neurons send collaterals to the PO nucleus of the thalamus, which in turn project back to both M1 and S1 pyramidal neurons through VL. These findings support the central role of PO as a key node in the corticothalamocortical loop involved in sensorimotor integration (30, 31). Likewise, we found that PO activity is directly modulated by M1 optogenetic stimulation in the Stim mice, and the restoration of PO activation is associated with the degree of sensorimotor recovery (Fig. 6, A and B).
Several other laboratories have also demonstrated that optogenetic stimulation of different neuronal populations can enhance axonal sprouting and promote functional recovery after stroke (11, 12, 32). In one study, Wahl and colleagues (12) showed that contralesional corticospinal tract stimulation can result in functional recovery, along with pronounced axonal sprouting into the denervated spinal hemicord. In another study using two-photon imaging, Tennant and colleagues (11) provided evidence for the importance of ipsilesional thalamocortical projections in the recovery of function after stroke. They showed that optogenetic stimulation of thalamocortical axons promotes the formation of new thalamocortical synaptic boutons and enhances recovery of sensory cortical circuits. However, no study has reported a systematic mapping of brain-wide circuit dynamics after stroke. Using ofMRI approach, we reported the first brain-wide mapping of neural circuit dynamics after stroke and identified key circuits involved in functional recovery. Our activation maps revealed two key circuits restored by OST, the corticothalamic and the corticocortical circuit. The extent of activation in these two circuits also significantly correlated with recovery (Fig. 5). Furthermore, we observed stimulated mice exhibit increased terminal ChR2 expression in the iTH (Fig. 7C and fig. S7) and higher number of iM1-thalamus presynaptic terminals (Synaptophysin+/ChR2+; Fig. 7G), suggesting the presence of elevated axonal sprouting of M1 projections into the iTH as a result of repeated neuronal stimulation, a likely mechanism to restore neural circuit activation after stroke, as supported by our ofMRI activation maps. The increased level of plasticity marker GAP43 in the iTH (Fig. 7D) is also in line with axonal sprouting in the corticothalamic circuit of stimulated mice. Hence, our results highlight the importance of the ipsilesional corticothalamic circuit in functional recovery following stroke.
Currently there are two contrasting views on the role of corticocortical reorganization in motor recovery following stroke. One common theory states that the remapping of neural connections within ipsilesional or interhemispheric corticocortical pathways is closely related to functional recovery after stroke (1, 33). A more recent view, however, postulates a reactive role, if any role at all, for the pattern of corticocortical connectivity changes following stroke (34, 35). This view emphasizes the importance of the corticosubcortical connectivity changes in functional recovery after stroke (36, 37). Our results highlight the involvement of both corticosubcortical and corticocortical circuits in motor functional recovery after stroke. Our findings further suggest that while the pattern of ipsilesional corticosubcortical connectivity change might be the initiator of functional recovery, the sustained increased connectivity of ipsilesional corticocortical pathways may be involved in the later stage of recovery after stroke.
In our study, we identified both restored and nonrestored brain circuits by the effects of iM1 stimulations. For instance, the corticocerebellar, corticostriatal, and interhemispheric transcallosal circuits were disrupted by stroke, and OST did not restore these circuits. At prestroke, iM1 stimulation reduced activation of the contralateral S1 compared to rest periods (Fig. 2A, blue cluster). This decrease in contralateral S1 activation might represent interhemispheric inhibition, and this did not get restored at any time points after stroke in both groups. Since we observed partial functional recovery in our stimulated mice, this raises the question of whether stimulations of these nonrestored circuits may achieve greater recovery. The partial functional recovery in our study could also be in part related to the activation of all iM1 downstream projections. It is possible that not all iM1 circuits are beneficial after stroke, some may be maladaptive (38). Thus, future studies targeting specific neural circuits (corticothalamic or corticocortical) may result in greater recovery. It is also worth noting that the magnitude of recovery might have been affected by repeated fMRI scans under anesthesia.
In this study, we did not test a no-stroke stimulation control group to address whether iM1 stimulation has a beneficial effect on thalamic GAP43 levels, irrespective of stroke. However, in our previous study (10), we showed that stimulation did not have beneficial effect in the no-stroke stimulated group. Hence, this possibility seems unlikely. In addition, in the current study, we did not test a sham opsin construct group to rule out the possibility that the observed effects are not due to heating or changes in blood flow due to laser heat. However, this vasodilation effect by blue laser occurs usually at higher laser power [e.g., greater than 2 to 5 mW, as reported in (39)]. In the current study, we used low laser power in the range of 0.6 to 1.2 mW, which does not cause any significant vasodilation (39). Our previous publication (10) tested these control groups (contralesional M1 stimulation and sham control group) and showed that contralesional M1 stimulation does not have an effect on behavior response in stimulated mice after stroke. Furthermore, to examine potential activation mediated by off-target effects of light, we have previously stimulated M1 with a similar blue laser power as in the current study in sham animals (injected with saline instead of opsin-AAV) and showed that no BOLD signal can be elicited during sham stimulation (18). Hence, it is unlikely that the beneficial stimulation effect on recovery is due to nonspecific effects from blue laser heat.
Our optogenetic fMRI approach provides functional activation maps using cell type–specific modulation of neural circuits, allowing us to dissect the underlying mechanisms in poststroke recovery. Using this unique approach, we have identified two key circuits (i.e., corticothalamic and corticocortical), whose restoration was positively correlated with the sensorimotor function at different phases of recovery. We demonstrate that selective stimulation of the corticothalamic circuit alone can improve functional recovery. Furthermore, combination of neuromodulation with other therapeutic strategies such as sensorimotor training, pharmacological treatments, and stem cell transplantation may further enhance recovery following stroke (12, 40). Our findings highlight key neural circuit mechanisms underlying recovery and provide potential targets for designing therapeutic brain stimulation strategies in future clinical studies.
MATERIALS AND METHODS
Animals
Adult male C57BL/6J mice (6 to 7 weeks) were purchased from the Jackson laboratory (n = 40 in total) and were divided into two arms: neuroimaging/immunohistochemistry (n = 30) and Western blot/immunohistochemistry (n = 10). Animal experimental protocols and husbandry were in strict accordance with the National Institutes of Health (NIH) and Stanford University’s Institutional Animal Care and Use Committee guidelines. Animals were housed under environmentally controlled conditions, a 12-hour light-dark cycle with food and water provided ad libitum. In exclusion criteria, mice were excluded from the study if they (i) exhibit striatal-only infarcts (three mice), (ii) exhibit poor prestroke baseline performance (zero mice), (iii) lack behavioral deficits following stroke (zero mice), and (iv) died after stroke (nine mice). Infarct size and locations were visualized using the high-resolution T2-weighted image acquired on PD3. Hence, 18 mice were used for neuroimaging (Stim, 9 mice; NoStim, 8 mice; 1 mouse did not undergo fMRI acquisitions due to large susceptibility artifacts). In addition, of 10 mice in the Western blot group, 2 were excluded, resulting in 4 mice in per group. These animals were processed for histology and Western blots. For the circuit-specific iM1-iTH stimulations, two independent groups were performed (n = 65 total). Mice were excluded from the study if they (i) exhibit striatal-only infarcts (5 mice), (ii) exhibit poor prestroke baseline performance (0 mice), (iii) lack behavioral deficits following stroke (4 mice), (iv) died after stroke (12 mice), (v) lost cannula (5 mice), and (vi) poor ChR2 expression overlap with fiber tract (15 mice). Thus, a total of 24 mice were included in this set of studies (sham, 4 mice; NoStim, 10 mice; Stim = 10 mice). To ensure that iM1-iTH circuit surgery itself did not affect behavior function, sham mice was included in the study as an internal control for the rotating beam test. Sham underwent same stereotaxic surgery to express AAV1-CamKIIa-hChR2-eYFP in the iM1-iTH circuit with fiber implant in iTH. Sham mice also had sham surgery that included anesthesia and chest skin incision but did not have stroke surgery.
Surgical procedure for virus injection and fiber optic implantation
The surgical procedure was designed to express the blue-light sensitive opsin ChR2 in the M1 layer V excitatory neurons. Mice (6 to 7 weeks) were anesthetized using 5% isoflurane in pure oxygen and then maintained on 1.5 to 2% throughout the duration of the surgical procedure. Body temperature, heart rate, and respiration were monitored every 15 min and kept in physiological range. The top of the animal’s head was shaved, cleaned with 70% ethanol and betadine, and then positioned in the stereotactic frame. Ophthalmic ointment was applied, a midline scalp incision was made, and small craniotomy was performed using a drill mounted on the frame. Mice were injected with 0.6 μl of AAV1-CamKIIa-hChR2-eYFP [#26969-AAV1; titer = 1 × 10¹³ vg (viral genomes)/ml] (University of Pennsylvania Vector Core and Addgene) into the left iM1 [anterior-posterior (AP): 0.74 mm, medial-lateral (ML): −1.5 mm, dorsal-ventral (DV): −0.7 mm from dura, coordinates from the Paxinos and Franklin Mouse Brain Atlas). Virus was delivered using a 33-gauge beveled needle attached to a 10-μl Hamilton syringe. A syringe pump (Micro 4, World Precision Instruments) was used to deliver the virus at a constant rate of 75 nl/min. After injection, the needle was left in place for 10 additional minutes and then slowly withdrawn. For the iM1 stimulation study, an MRI compatible fiber optic cannula (ceramic ferrule; 200-μm fiber) was inserted in layer V left iM1 (AP: 0.74 mm, ML: −1.5 mm, DV: −0.5 mm from dura) (10). For the corticothalamic circuit (iM1-iTH) study, the fiber optic cannula was inserted in the left anterior thalamus (AP: −1.42 mm, ML: −1.15 mm, DV: −2.75 mm from dura). Dental cement was applied to secure the fiber optic cannula to the skull. Animals were kept on a heating pad during recovery from anesthesia. Buprenorphine (0.01 mg/kg) and 0.9% saline was given subcutaneously following the surgical procedure to minimize discomfort and to prevent dehydration. Mice were monitored for recovery and returned to home cages.
Transient MCAO
At 4 to 6 weeks after stereotaxic surgery, mice underwent stroke surgery (transient MCAO). Anesthesia was induced with 5% isoflurane and maintained with 2 to 3% isoflurane. Body temperature, heart rate, and respiration were monitored every 15 min during surgery to maintain their physiological range. Mice (10 to 12 weeks) were placed in the supine position, an incision was made at the midline of the neck, and the left carotid artery was located. An intraluminal suture of 0.20 mm in diameter and 4 to 5 mm in length (70SPRePK5-2045, Doccol Corporation, Sharon, MA) was inserted into the left internal carotid artery and advanced distally to block blood flow to the middle cerebral artery. The suture was left in place for 30 min before being removed, followed by wound closure with sutures and tissue glue. Buprenorphine (0.1 mg/kg) was administered during and after operation to alleviate pain. For hydration, animals received daily subcutaneous injections of 0.9% saline (500 μl) for 7 days after stroke. Body weights were recorded to monitor weight changes.
Stimulation paradigm for treatment
In each of the neuroimaging and Western blot arms, mice were randomized, and experimenters were blinded. The stereotaxic surgery, stroke surgeries, stimulations, and behavior tests were performed by different individuals. All experimental groups underwent identical behavior handling/training, surgical procedures, and environmental exposures, with the exception that NoStim stroke mice did not receive laser pulses for stimulations. Mice were randomly assigned into two balanced groups (Stim group and NoStim group) using an in-house software that computes the prestroke and PD4 behavior data. Groups were also based on their infarct size and location as assessed by T2 imaging. The infarct mask was defined on the basis of the area of high intensity in the high-resolution T2-weighted structural image obtained on PD3 (Fig. 3A). The infarct masks were identified by an MRI expert and validated by a neurosurgeon.
Functional opsin expression was confirmed at 4 to 6 weeks following the surgical procedure via assessment of a behavioral response to stimulation (contralateral forelimb movements; movie S1). During stimulations, the mouse was allowed to freely move in the empty mouse cage. Each stimulated mouse received one session of stimulation that is consisted of three 1-min stimulations separated by 3-min rest intervals. Mice received daily stimulations from PD5 to PD14, using a 473-nm blue laser (OEM Laser Systems, Salt Lake City, UT) controlled by the Agilent function generator (AGT33210A). Mice were stimulated with laser setting at 10 Hz, 20-ms light pulses, with a power range of 0.6 to 1.2 mW as measured by a power meter (Thorlabs, Newton, New Jersey). We used the minimal laser power necessary to elicit movements in the affected forelimb during stimulations. Stimulations were performed in the morning between 8 and 10 a.m., and behavior tests were performed in the afternoon between 1 and 3 p.m., thus allowing for ~5 hours between stimulations and behavior testing.
MRI/fMRI data acquisition
All fMRI data acquisition was performed using the 7T horizontal-bore system (Bruker BioSpec 70/30) at the Stanford Center for Innovation in In Vivo Imaging (SCi3). In this longitudinal study, each mouse underwent four scanning sessions in the following order: at prestroke day (baseline scan, ~7 days before stroke), PD3, PD15, and PD29. All scanning sessions involved the same setup and imaging protocols as follows.
A two-channel 86-mm-diameter volume coil was used for RF excitation with a single-loop 10-mm surface coil as the RF (radio frequency) receiver, and a 200-μm diameter optical fiber was inserted through the holder. Mice were initially anesthetized with isoflurane (2%) together with air and oxygen mixed at a 4:1 ratio via vaporizer during preparation. To moderate the inhibitory effects of the isoflurane on BOLD signal, the anesthesia was immediately switched to combined dexdomitor (0.5 mg/ml; dexmedetomidine hydrochloride, Pfizer Inc., NY, United States) with a low-dose isoflurane (0.5 to 1%). Moderate dexdomitor sedation was initially induced by a bolus injection via subcutaneously (0.015 mg/kg of body weight). The mice were then placed in an animal holder with ear pins and a bite bar to restrain head motions. A fiber-optic rectal temperature probe was inserted, and the cardiac and respiratory rates were monitored. Fifteen minutes after the initial bolus injection, the mice started to receive a continuous subcutaneous infusion of dexdomitor using an MRI compatible catheter controlled by an infusion pump (Harvard Apparatus, Holliston, MA, USA) at a rate of 0.03 mg/kg of body weight per hour. During functional scans, the dose of isoflurane was kept at 0.5% (air and oxygen mixed at a 4:1 ratio) to maintain a relatively stable respiratory rate (90 to 120 per minute).
A high-resolution structural MR image was first acquired using a multi-slice T2-weighted fast spin echo sequence, with the following parameters: echo time (TE)/repetition time (TR) = 33/5816 ms, field of view (FOV) = 25 mm by 25 mm, matrix size = 256 by 256, in-plane resolution = 0.098 mm by 0.098 mm, 55 slices with a slice thickness of 0.3 mm and no gap, echo train length = 8, and two signal averages. A shimming procedure was then performed to optimize the field homogeneity inside an oval shape covering the whole brain. The fMRI acquisition was carried out using gradient-echo echo-planer imaging to obtain BOLD signals with the following acquisition parameters: TE/TR = 14/1000 ms, flip angle = 40°, FOV = 25 mm by 25 mm, matrix size = 70 by 70, in-plane resolution = 0.357 mm by 0.357 mm, slice thickness = 0.5 mm, number of slices = 27, number of volumes = 400, number of dummy scans = 4. Last, a low-resolution structural image was acquired using a T2-weighted fast spin echo sequence at the exact same resolution and geometry as the functional images, with the following parameters: TE/ TR = 33/2843 ms, echo train length = 8, and two signal averages.
Each fMRI acquisition lasted 6 min and 40 s and was repeated two times. During each acquisition, a block design paradigm was used to deliver optogenetic iM1 stimulation (473-nm blue laser), in six blocks of 15-s light-on and 40-s light-off periods (Fig. 1B). The light-on period consisted of 150 light pulses of 20 ms each at 10-Hz frequency. For each mouse, the laser power was adjusted to 1.5 times the minimum power recorded previously during the behavioral response to stimulation test (see above), resulting in a power range of 0.6 to 1.2 mW. Note that since mice were anesthetized under light isoflurane (0.5%), this stimulation power did not result in any apparent limb movements. Respiratory and cardiac rates were carefully monitored, and if there was any sign of irregularity or movement, then the scan was stopped and restarted after a 2-min interval (3 mice). In addition, during functional scans, a second blue laser continuously emitted blue light toward the eyes via a second bare optical fiber, to saturate and eliminate any unwanted light stimulus due to the optogenetic stimulation laser (41).
Rotating beam test
We used the horizontal rotating beam test to evaluate motor and sensory function. For iM1 stimulation study, we performed rotating beam test on day 0 (prestroke baseline) and PD4, PD7, PD14, and PD21. This motor/sensory test measures the distance traveled and the speed of mice placed on a rotating white fiberglass beam (length, 120 cm; diameter, 13 mm; distances marked in centimeters). The beam, attached to a motor that rotates at 3 rpm, is located 60 cm above the ground covered with bubble cushions to reduce the mouse’s impact from a fall. The behavior tests were performed by a blinded observer. Three trials were performed and the two closest values were averaged. Mice were handled and pretrained three times before collecting the prestroke baseline data. For the iM1-thalamus stimulation study, we performed behavior assessment at on day 0 (prestroke baseline) and PD4, PD7, and PD14. Mice were euthanized at PD15, and brains were collected for histological analysis. We chose to collect samples at PD15 since PD14 was the time point we observed that has the most significant behavior recovery in iM1 stimulation study. This time point also exhibited the greatest activation in the iM1-iTH circuit.
Immunofluorescence staining
At day 30 after stroke, mice were euthanized and perfused with cold phosphate-buffered saline (PBS) and 3% paraformaldehyde (PFA). Brains were cryoprotected overnight in 20% sucrose/3% PFA solution. After the brains sank, they were frozen on dry ice and stored in −80°C until sectioning. The brains were sectioned on a cryostat at 30 μm and kept at −20°C in an antifreeze solution (30% ethylene glycol and 30% glycerol in PBS). Sections were washed in PBS and transferred to a preheated buffer for antigen retrieval (0.5 M sodium citrate and 0.05% Tween 20 in deionized water) for 20 min at 60°C. Sections were then transferred to a blocking solution (10% normal goat serum and 1% bovine serum albumin in 0.3% PBS-Triton X-100) for 1 hour and incubated overnight at 4°C in a solution of primary antibody diluted in blocking solution [MAP2 from Cell Signaling Technology, #8707 (dilution, 1:200); CD68 from Abcam, ab53444 (dilution, 1:200); GFAP from Abcam, ab4674 (dilution, 1:200); Synaptophysin 1 from Synaptic Systems, 101 004 (dilution, 1:250)]. The next day, sections were washed in PBS and incubated for 2 hours at room temperature with 1:500 secondary antibody (Alexa Fluor 590 or 647) diluted in blocking solution. Sections were then washed in PBS and mounted on slides to dry. Once dry, coverslips were applied using mounting medium with 4′,6-diamidino-2-phenylindole (DAPI; VECTASHIELD, H-1500) to stain nuclei. Viral expression (AAV1-CamKIIa-hChR2-eYFP) was detected via endogenous fluorescence from the viral eYFP tag. Viral expression (AAV1-CamKIIa-hChR2-eYFP, Addgene, 26969-AAV1) was visualized via endogenous fluorescence from the viral eYFP tag. High-resolution images for ChR2, MAP2, CD68, and DAPI were acquired by 10× tiled stitching, and images for Synaptophysin and ChR2 were acquired with 63× imaging using confocal LSM 800 with Zen software. Synaptophsin/ChR2 images were captured from area below the fiber optical cannula in the iTH.
To quantify ChR2 expression levels at different regions, the following procedure was used. Two coronal slices were selected in each mouse, which included brain slices at the site of viral injection and at the thalamus level. High-resolution tiled images from these slices were acquired using confocal LSM 800 with Zen software. Three regions of interest were drawn on the basis of anatomical landmarks, including the iM1 region at the site of injection, the peri-infarct S1 region, the iTH. A representative background region was also selected in each brain slice (ipsilesional lateral septum and ipsilesional hypothalamus). The ChR2 fluorescence images were converted to grayscale image using MATLAB software, and the average intensity in each region of interest was calculated. To correct for differences in the overall brightness level of different slices in different animals, the average intensity of the selected regions of interest was subtracted from the average background intensity for that slice. Furthermore, to account for variations in the level of viral transduction across animals, the average ChR2 intensity level at the selected regions of interests (iTH and peri-infarct S1 region) was divided by the average ChR2 intensity level locally at the site of injection (iM1) to obtain normalized ChR2 intensity levels. Two-sample t statistics were performed to compare the average ChR2 intensity and the normalized ChR2 intensity levels between the Stim and NoStim groups.
To assess Synaptophysin and ChR2 colocalization, we used ImageJ software, JACoP plugin. Images were thresholded on the basis of Costes’ automatic threshold approach (42). We then calculated the Manders’ overlap coefficient between the thresholded Synaptophysin and ChR2 images, which is a reliable metric to assess colocalization (22, 43). Furthermore, we used ImageJ software, Analyze Particles tool to segment, and count the number of Synaptophysin+/channelrhodopsin+ terminals in the thresholded images. Two-sample t statistics were performed to compare the average normalized ChR2 intensity at the Synaptophysin+ terminals between the Stim and NoStim groups.
Western blot analysis
At day 15 after stroke, mice were euthanized and perfused with cold PBS. Brain regions of interest were dissected on ice and quickly frozen to −80°C. Proteins were extracted using the NE-PER nuclear and cytoplasmic extraction kit (Thermo Fisher Scientific). Protein concentrations were measured using the Bradford Assay, and all protein samples were diluted to equal concentrations (1 μg/μl). Proteins were separated by SDS gel electrophoresis performed on 4 to 15% Criterion TGX Precast Gels (Bio-Rad) at 150 V, and then proteins were transferred to a polyvinylidene difluoride membrane using the Trans-Blot Turbo System (Bio-Rad) and blocked in 5% milk to prevent nonspecific binding. Membranes were then incubated in primary antibodies (GAP43, Millipore, #AB5220; dilution, 1:1000) diluted in 5% milk overnight at 4°C. The next day, the membranes were incubated in secondary antibody (anti-rabbit–horseradish peroxidase) at room temperature for 1 hour. Membranes were also blotted with the housekeeping gene glyceraldehyde-3-phosphate dehydrogenase (GAPDH) (Cell Signaling Technology, #2118; dilution, 1:5000). The Amersham ECL Prime Western Blotting Detection Reagent (RPN2232) was used to develop the membranes, and protein expression signals were captured using the Bio-Rad Chemi-Doc MP Imager. NIH ImageJ was used to calculate relative optical density. After quantitation of relative optical density, the level of GAP43 protein was normalized using GAPDH.
Neuroimaging data analysis
The structural and fMRI data were analyzed using FSL software (44). Details of preprocessing and analysis are given below.
Structural image analysis
The T2-weighted structural images were skull-stripped using three-dimensional pulse-coupled neural networks method (45), and the resulting brain masks were manually corrected if needed. For each mouse and session, the low-resolution structural image was first registered to the high-resolution T2-weighted image using a six-parameter rigid body transformation as implemented in the FSL software package (44). Then, for each mouse, we calculated the transformation to align the high-resolution T2-weighted images of different sessions (PD3, PD15, and PD29) to the baseline session using a rigid body transformation. Next, the high-resolution T2-weighted image of a representative mouse was selected as template for group-level analysis purposes, and we registered the high-resolution image of each mouse at baseline session to the template image using a 12-parameter affine transformation as implemented in FSL. The three transformations calculated above were concatenated to obtain the registration parameters to align the low-resolution image of each mouse at each session to the template image. Furthermore, we obtained the registration parameters from the Allen Mouse Brain Atlas [Common Coordinate Framework version 3 (27)] to the template image, using a 12-parameter affine transformation as implemented in FSL. The mask of each brain area as defined in the Allen Mouse Brain Atlas was then registered to the template space for further analysis.
fMRI data analysis
The brain functional images were first processed using regular preprocessing steps including motion correction, high-pass temporal filtering (σ = 100 s), spatial smoothing (using a Gaussian kernel of 0.7 mm at full width at half maximum), and rigid body registration to the low-resolution T2-weighted structural image, as implemented in FSL (44). A brain mask obtained from the low-resolution T2-weighted image was applied on the functional data. For each mouse, changes in brain regional responses to optogenetic M1 stimulation were estimated using a GLM including boxcars convolved with a double-gamma hemodynamic response function (HRF) as implemented in the Feat software (FSL) (46). The time derivative of this regressor was also included in the model to account for any jitter at the start or end of each stimulation block due to HRF variations across brain areas. In addition, six rotation and translation motion parameters were included in the model as confounds. Time-series statistical analysis was carried out using FILM (FSL) with local autocorrelation correction (46). This analysis produced maps of all voxels that increased or decreased their activity in response to M1 stimulation as compared to baseline. The subject-level regression coefficients and their covariance maps were then input to a group-level GLM analysis, and the corresponding Z statistics maps for the contrasts of interest were generated (46). The Z statistics maps were first thresholded using a stringent voxel-level threshold Z > 3.0 and then corrected for multiple comparisons using GRF theory (cluster-level significance threshold P < 0.01, corrected).
Furthermore, we calculated the volume of activation and the average BOLD signal percent change time series for the key brain areas, on a per subject basis. For this analysis, we first registered the mask of each key brain area from the Allen Mouse Brain Atlas into our template space and from there to the functional space of each mouse, using the transformation parameters described above. Next, for each mouse and each session, we calculated the area of overlap between the subject-level thresholded Z statistics activation map (Z > 2.3) and the registered mask of each brain region in the functional space. On the basis of that, we calculated the active volume percentage for each region by dividing the number of activated voxels to the total number of voxels in that region for each mouse and session. For each session, we took the average values across the two stimulation runs. Moreover, for each region, we calculated the average BOLD time series over the active voxels in that region from the motion-corrected fMRI data. The percent BOLD signal change was then calculated by dividing the BOLD time series to the average BOLD signal during baseline (light-off) periods in each run. On the basis of that, we calculated the magnitude of activation in each region by taking the average of percent BOLD signal change during the light-on periods in each run (from the start of stimulation until 5 s after its termination to account for slow BOLD signal dynamics). Last, for each key brain region and each session, the average volume and magnitude of activation were calculated across all mice in each experimental group (Stim and NoStim). The t statistics were used to compare the volume and magnitude of activation for different brain regions across groups.
Last, we investigated brain areas whose activity in response to M1 stimulation was related to behavioral improvements following stroke, on a per subject basis. In this analysis, we used the behavioral scores on PD15 or PD29 as an additional predictor at the group-level GLM, where the behavioral regressor was orthogonalized with respect to the group mean regressor. The behavioral scores were normalized by the prestroke performance to obtain a normalized score between 0 and 1. This analysis was performed on the Stim and NoStim groups separately, as we expected different recovery mechanisms in each group. Corrections for multiple comparisons at the cluster level were performed using GRF (minimum Z > 3.0; cluster significance, P < 0.01, corrected). As a sanity check, we also calculated the Pearson r between the percent BOLD signal changes in a given session and its corresponding behavioral scores, for each experimental group separately.
Statistical tests
Results are shown as means ± SEM. All statistics were performed using Prism 7.05. Behavior analyses were analyzed with two-way ANOVA, followed by Bonferroni’s post hoc test. The Western data and infarct data were analyzed by two-tailed Student’s t test, two-tailed. Data were checked for normality and equality of variance across sessions. The neuroimaging results were corrected for multiple comparisons using GRF theory (cluster-level significance threshold P < 0.01, corrected).
Acknowledgments
We would like to thank M. Ito, J. Liu, and J. Rudberg for assistance in data collection and discussions on the manuscript. We thank C. Plant for scientific editing of the manuscript. Funding: This work was funded by NIH grants R01NS093057 (to G.K.S.) and RF1MH11422701 (to J.H.L.). This work was also funded in part by NIH (R25) and Neurosurgery Research and Education Foundation (NREF) grants (to A.V.P.). Author contributions: S.V., A.V.P., T.C., S.H., H.U., Z.C., A.K., H.C., and M.C. conducted the experiments. S.V., A.V.P., H.U., Z.C., M.C., and M.Y.C. analyzed the data. S.V., M.Y.C., J.H.L., and G.K.S. designed and planned the study. M.Y.C., J.H.L., and G.K.S. supervised all personnel. S.V. and M.Y.C. wrote the manuscript. T.C., S.H., H.C., Z.C., A.K., M.C., H.J.L., J.H.L., and G.K.S. revised the manuscript. Competing interests: J.H.L. is a founder, consultant, and board member of LVIS. H.J.L. is an employee and shareholder of LVIS. All authors declare that they have no other competing interests. Data and materials availability: All data needed to evaluate the conclusions in the paper are present in the paper and/or the Supplementary Materials. Additional data related to this paper may be requested from the authors.
SUPPLEMENTARY MATERIALS
Supplementary material for this article is available at http://advances.sciencemag.org/cgi/content/full/7/33/eabd9465/DC1
REFERENCES AND NOTES
- 1.Ward N. S., Mechanisms underlying recovery of motor function after stroke. Postgrad. Med. J. 81, 510–514 (2005). [DOI] [PMC free article] [PubMed] [Google Scholar]
- 2.Carmichael S. T., Cellular and molecular mechanisms of neural repair after stroke: Making waves. Ann. Neurol. 59, 735–742 (2006). [DOI] [PubMed] [Google Scholar]
- 3.Grefkes C., Fink G. R., Reorganization of cerebral networks after stroke: New insights from neuroimaging with connectivity approaches. Brain 134, 1264–1276 (2011). [DOI] [PMC free article] [PubMed] [Google Scholar]
- 4.Murphy T. H., Corbett D., Plasticity during stroke recovery: From synapse to behaviour. Nat. Rev. Neurosci. 10, 861–872 (2009). [DOI] [PubMed] [Google Scholar]
- 5.Pekna M., Pekny M., Nilsson M., Modulation of neural plasticity as a basis for stroke rehabilitation. Stroke 43, 2819–2828 (2012). [DOI] [PubMed] [Google Scholar]
- 6.Silasi G., Murphy T. H., Stroke and the connectome: How connectivity guides therapeutic intervention. Neuron 83, 1354–1368 (2014). [DOI] [PubMed] [Google Scholar]
- 7.Grefkes C., Fink G. R., Connectivity-based approaches in stroke and recovery of function. Lancet Neurol. 13, 206–216 (2014). [DOI] [PubMed] [Google Scholar]
- 8.Gradinaru V., Mogri M., Thompson K. R., Henderson J. M., Deisseroth K., Optical deconstruction of parkinsonian neural circuitry. Science 324, 354–359 (2009). [DOI] [PMC free article] [PubMed] [Google Scholar]
- 9.Takatsuru Y., Eto K., Kaneko R., Masuda H., Shimokawa N., Koibuchi N., Nabekura J., Critical role of the astrocyte for functional remodeling in contralateral hemisphere of somatosensory cortex after stroke. J. Neurosci. 33, 4683–4692 (2013). [DOI] [PMC free article] [PubMed] [Google Scholar]
- 10.Cheng M. Y., Wang E. H., Woodson W. J., Wang S., Sun G., Lee A. G., Arac A., Fenno L. E., Deisseroth K., Steinberg G. K., Optogenetic neuronal stimulation promotes functional recovery after stroke. Proc. Natl. Acad. Sci. U.S.A. 111, 12913–12918 (2014). [DOI] [PMC free article] [PubMed] [Google Scholar]
- 11.Tennant K. A., Taylor S. L., White E. R., Brown C. E., Optogenetic rewiring of thalamocortical circuits to restore function in the stroke injured brain. Nat. Commun. 8, 15879 (2017). [DOI] [PMC free article] [PubMed] [Google Scholar]
- 12.Wahl A. S., Büchler U., Brändli A., Brattoli B., Musall S., Kasper H., Ineichen B. V., Helmchen F., Ommer B., Schwab M. E., Optogenetically stimulating intact rat corticospinal tract post-stroke restores motor control through regionalized functional circuit formation. Nat. Commun. 8, 1187 (2017). [DOI] [PMC free article] [PubMed] [Google Scholar]
- 13.Shah A. M., Ishizaka S., Cheng M. Y., Wang E. H., Bautista A. R., Levy S., Smerin D., Sun G., Steinberg G. K., Optogenetic neuronal stimulation of the lateral cerebellar nucleus promotes persistent functional recovery after stroke. Sci. Rep. 7, 46612 (2017). [DOI] [PMC free article] [PubMed] [Google Scholar]
- 14.Otchy T. M., Wolff S. B. E., Rhee J. Y., Pehlevan C., Kawai R., Kempf A., Gobes S. M. H., Ölveczky B. P., Acute off-target effects of neural circuit manipulations. Nature 528, 358–363 (2015). [DOI] [PubMed] [Google Scholar]
- 15.Lim D. H., Ledue J. M., Mohajerani M. H., Murphy T. H., Optogenetic mapping after stroke reveals network-wide scaling of functional connections and heterogeneous recovery of the peri-infarct. J. Neurosci. 34, 16455–16466 (2014). [DOI] [PMC free article] [PubMed] [Google Scholar]
- 16.Mohajerani M. H., Aminoltejari K., Murphy T. H., Targeted mini-strokes produce changes in interhemispheric sensory signal processing that are indicative of disinhibition within minutes. Proc. Natl. Acad. Sci. U.S.A. 108, E183–E191 (2011). [DOI] [PMC free article] [PubMed] [Google Scholar]
- 17.Brown C. E., Aminoltejari K., Erb H., Winship I. R., Murphy T. H., In vivo voltage-sensitive dye imaging in adult mice reveals that somatosensory maps lost to stroke are replaced over weeks by new structural and functional circuits with prolonged modes of activation within both the peri-infarct zone and distant sites. J. Neurosci. 29, 1719–1734 (2009). [DOI] [PMC free article] [PubMed] [Google Scholar]
- 18.Lee J. H., Durand R., Gradinaru V., Zhang F., Goshen I., Kim D. S., Fenno L. E., Ramakrishnan C., Deisseroth K., Global and local fMRI signals driven by neurons defined optogenetically by type and wiring. Nature 465, 788–792 (2010). [DOI] [PMC free article] [PubMed] [Google Scholar]
- 19.Bernal-Casas D., Lee H. J., Weitz A. J., Lee J. H., Studying brain circuit function with dynamic causal modeling for optogenetic fMRI. Neuron 93, 522–532.e5 (2017). [DOI] [PMC free article] [PubMed] [Google Scholar]
- 20.Nygren J., Wieloch T., Enriched environment enhances recovery of motor function after focal ischemia in mice, and downregulates the transcription factor NGFI-A. J. Cereb. Blood Flow Metab. 25, 1625–1633 (2005). [DOI] [PubMed] [Google Scholar]
- 21.Chon U., Vanselow D. J., Cheng K. C., Kim Y., Enhanced and unified anatomical labeling for a common mouse brain atlas. Nat. Commun. 10, 5067 (2019). [DOI] [PMC free article] [PubMed] [Google Scholar]
- 22.Bolte S., Cordelières F. P., A guided tour into subcellular colocalization analysis in light microscopy. J. Microsc. 224, 213–232 (2006). [DOI] [PubMed] [Google Scholar]
- 23.Benowitz L. I., Routtenberg A., GAP-43: An intrinsic determinant of neuronal development and plasticity. Trends Neurosci. 20, 84–91 (1997). [DOI] [PubMed] [Google Scholar]
- 24.Sandelius Å., Cullen N. C., Källén Å., Rosengren L., Jensen C., Kostanjevecki V., Vandijck M., Zetterberg H., Blennow K., Transient increase in CSF GAP-43 concentration after ischemic stroke. BMC Neurol. 18, 202 (2018). [DOI] [PMC free article] [PubMed] [Google Scholar]
- 25.Yizhar O., Fenno L. E., Davidson T. J., Mogri M., Deisseroth K., Optogenetics in neural systems. Neuron 71, 9–34 (2011). [DOI] [PubMed] [Google Scholar]
- 26.Liu X., Ramirez S., Pang P. T., Puryear C. B., Govindarajan A., Deisseroth K., Tonegawa S., Optogenetic stimulation of a hippocampal engram activates fear memory recall. Nature 484, 381–385 (2012). [DOI] [PMC free article] [PubMed] [Google Scholar]
- 27.Oh S. W., Harris J. A., Ng L., Winslow B., Cain N., Mihalas S., Wang Q., Lau C., Kuan L., Henry A. M., Mortrud M. T., Ouellette B., Nguyen T. N., Sorensen S. A., Slaughterbeck C. R., Wakeman W., Li Y., Feng D., Ho A., Nicholas E., Hirokawa K. E., Bohn P., Joines K. M., Peng H., Hawrylycz M. J., Phillips J. W., Hohmann J. G., Wohnoutka P., Gerfen C. R., Koch C., Bernard A., Dang C., Jones A. R., Zeng H., A mesoscale connectome of the mouse brain. Nature 508, 207–214 (2014). [DOI] [PMC free article] [PubMed] [Google Scholar]
- 28.Brodal P., Bjaalie J. G., Organization of the pontine nuclei. Neurosci. Res. 13, 83–118 (1992). [DOI] [PubMed] [Google Scholar]
- 29.Kinnischtzke A. K., Fanselow E. E., Simons D. J., Target-specific M1 inputs to infragranular S1 pyramidal neurons. J. Neurophysiol. 116, 1261–1274 (2016). [DOI] [PMC free article] [PubMed] [Google Scholar]
- 30.Yamawaki N., Shepherd G. M. G., Synaptic circuit organization of motor corticothalamic neurons. J. Neurosci. 35, 2293–2307 (2015). [DOI] [PMC free article] [PubMed] [Google Scholar]
- 31.Groh A., Bokor H., Mease R. A., Plattner V. M., Hangya B., Stroh A., Deschenes M., Acsády L., Convergence of cortical and sensory driver inputs on single thalamocortical cells. Cereb. Cortex 24, 3167–3179 (2014). [DOI] [PMC free article] [PubMed] [Google Scholar]
- 32.He X., Lu Y., Lin X., Jiang L., Tang Y., Tang G., Chen X., Zhang Z., Wang Y., Yang G. Y., Optical inhibition of striatal neurons promotes focal neurogenesis and neurobehavioral recovery in mice after middle cerebral artery occlusion. J. Cereb. Blood Flow Metab. 37, 837–847 (2017). [DOI] [PMC free article] [PubMed] [Google Scholar]
- 33.Thiel A., Vahdat S., Structural and resting-state brain connectivity of motor networks after stroke. Stroke 46, 296–301 (2015). [DOI] [PubMed] [Google Scholar]
- 34.Xu J., Branscheidt M., Schambra H., Steiner L., Widmer M., Diedrichsen J., Goldsmith J., Lindquist M., Kitago T., Luft A. R., Krakauer J. W., Celnik P. A.; SMARTS Study Group , Rethinking interhemispheric imbalance as a target for stroke neurorehabilitation. Ann. Neurol. 85, 502–513 (2019). [DOI] [PMC free article] [PubMed] [Google Scholar]
- 35.Branscheidt M., Ejaz N., Xu J., Widmer M., Harran M. D., Cortés J. C., Kitago T., Celnik P., Hernandez-Castillo C., Diedrichsen J., Luft A., Krakauer J. W., No evidence for motor recovery-related cortical reorganization after stroke using resting-state fMRI. bioRxiv, 681320 (2019). [DOI] [PMC free article] [PubMed] [Google Scholar]
- 36.Wahl A.-S., Omlor W., Rubio J. C., Chen J. L., Zheng H., Schröter A., Gullo M., Weinmann O., Kobayashi K., Helmchen F., Asynchronous therapy restores motor control by rewiring of the rat corticospinal tract after stroke. Science 344, 1250–1255 (2014). [DOI] [PubMed] [Google Scholar]
- 37.Radlinska B., Ghinani S., Leppert I. R., Minuk J., Pike G. B., Thiel A., Diffusion tensor imaging, permanent pyramidal tract damage, and outcome in subcortical stroke. Neurology 75, 1048–1054 (2010). [DOI] [PMC free article] [PubMed] [Google Scholar]
- 38.J. W. Krakauer, S. T. Carmichael, Broken Movement: The Neurobiology of Motor Recovery after Stroke (The MIT Press, 2017).
- 39.Rungta R. L., Osmanski B.-F., Boido D., Tanter M., Charpak S., Light controls cerebral blood flow in naive animals. Nat. Commun. 8, 14191 (2017). [DOI] [PMC free article] [PubMed] [Google Scholar]
- 40.Cheng M. Y., Aswendt M., Steinberg G. K., Optogenetic approaches to target specific neural circuits in post-stroke recovery. Neurotherapeutics 13, 325–340 (2016). [DOI] [PMC free article] [PubMed] [Google Scholar]
- 41.Schmid F., Wachsmuth L., Albers F., Schwalm M., Stroh A., Faber C., True and apparent optogenetic BOLD fMRI signals. Magn. Reson. Med. 77, 126–136 (2017). [DOI] [PubMed] [Google Scholar]
- 42.Costes S. V., Daelemans D., Cho E. H., Dobbin Z., Pavlakis G., Lockett S., Automatic and quantitative measurement of protein-protein colocalization in live cells. Biophys. J. 86, 3993–4003 (2004). [DOI] [PMC free article] [PubMed] [Google Scholar]
- 43.Manders E. M. M., Stap J., Brakenhoff G. J., Van Driel R., Aten J. A., Dynamics of three-dimensional replication patterns during the S-phase, analysed by double labelling of DNA and confocal microscopy. J. Cell Sci. 103, 857–862 (1992). [DOI] [PubMed] [Google Scholar]
- 44.Smith S. M., Jenkinson M., Woolrich M. W., Beckmann C. F., Behrens T. E., Johansen-Berg H., Bannister P. R., De Luca M., Drobnjak I., Flitney D. E., Niazy R. K., Saunders J., Vickers J., Zhang Y., De Stefano N., Brady J. M., Matthews P. M., Advances in functional and structural MR image analysis and implementation as FSL. Neuroimage 23( Suppl. 1), S208–S219 (2004). [DOI] [PubMed] [Google Scholar]
- 45.Chou N., Wu J., Bai Bingren J., Qiu A., Chuang K.-H., Robust automatic rodent brain extraction using 3-D pulse-coupled neural networks (PCNN). IEEE Trans. Image Process. 20, 2554–2564 (2011). [DOI] [PubMed] [Google Scholar]
- 46.Woolrich M. W., Jbabdi S., Patenaude B., Chappell M., Makni S., Behrens T., Beckmann C., Jenkinson M., Smith S. M., Bayesian analysis of neuroimaging data in FSL. Neuroimage 45, S173–S186 (2009). [DOI] [PubMed] [Google Scholar]
Associated Data
This section collects any data citations, data availability statements, or supplementary materials included in this article.
Supplementary Materials
Supplementary material for this article is available at http://advances.sciencemag.org/cgi/content/full/7/33/eabd9465/DC1