Abstract
SWI/SNF chromatin remodelers play critical roles in development and cancer. The causal links between SWI/SNF complex disassembly and carcinogenesis are obscured by redundancy between paralogous components. Canonical cBAF-specific paralogs ARID1A and ARID1B are synthetic lethal in some contexts, but simultaneous mutations in both ARID1s are prevalent in cancer. To understand if and how cBAF abrogation causes cancer, we examined the physiologic and biochemical consequences of ARID1A/ARID1B loss. In double knockout liver and skin, aggressive carcinogenesis followed de-differentiation and hyperproliferation. In double mutant endometrial cancer, add-back of either induced senescence. Biochemically, residual cBAF subcomplexes resulting from loss of ARID1 scaffolding were unexpectedly found to disrupt polybromo containing pBAF function. 37 of 69 mutations in the conserved scaffolding domains of ARID1 proteins observed in human cancer caused complex disassembly, partially explaining their mutation spectra. ARID1-less, cBAF-less states promote carcinogenesis across tissues, and suggest caution against paralog-directed therapies for ARID1-mutant cancer.
INTRODUCTION
An important class of nucleosome remodelers are the SWI/SNF complexes, which use energy from ATP hydrolysis to slide, evict, and remodel nucleosomes to influence transcription, DNA damage repair, or DNA unwinding1, 2. SWI/SNF complexes are composed of 10–15 subunits that are assembled in diverse ways, potentially owing to intricate cell-type specific functions during development and tissue homeostasis3–5. There are three main classes of SWI/SNF complexes: canonical BAF (cBAF), polybromo containing BAF (pBAF), and non-canonical BAF (ncBAF)6–10. Despite elegant biochemical elucidation of complex assembly, enzymatic activities, and genomic targeting, there are still significant unknowns about the mechanistic basis and functional consequences of complex dysfunction in disease.
SWI/SNF biology has risen to prominence because of the high frequency of cancer-related mutations within complex components2, 11, 12. The most perturbed SWI/SNF component is ARID1A, with mutation rates of up to 50–60% in selected cancer types13. Given ARID1A’s demonstrated role as a tumor suppressor14, 15, multiple efforts have been made to identify synthetic lethal partners for therapeutic targeting16–24. As with many epigenetic complexes, paralogous pairs have been identified as vulnerabilities25, 26. Helming et al.27 and project DRIVE19 showed that ARID1B, the closely related paralog of ARID1A, is a synthetic lethal target in ARID1A-mutant cells. Because these are mutually exclusive and partially redundant subunits within cBAF complexes, cells are thought to require either component to survive. Knockdown of both results in reduced chromatin accessibility, prominently around enhancers28, although it is unclear how this translates into cellular phenotypes. Synthetic lethality has not been tested in vivo or over long time scales, and is made somewhat risky because some cancers harbor mutations in both ARID1A and ARID1B29.
There are other important reasons to understand the impact of simultaneous ARID1A and ARID1B loss. First, how defective SWI/SNF complexes drive cancer is still vague. For example, it is unclear to what extent loss of complex integrity promotes or abolishes cancer growth. Moreover, it is unknown if dissociated subcomplexes might be disruptive through gain of new activities. This is partially because biochemical findings have not been causally connected with relevant phenotypes from animal models. Indeed, SWI/SNF function is difficult to genetically dissect because many subunits are shared between multiple subassemblies. BAF47, Brg1, and Brm are all present in cBAF, pBAF, and ncBAF9, thus it is challenging to ablate single complex types without collateral damage. Central questions involve what cBAF, pBAF, or ncBAF complexes do physiologically, how they disassemble in the setting of mutations, and what the impact of disassembly might be. Because ARID1A and ARID1B are exclusive to cBAF, we reasoned that dual deletion would reveal cBAF-specific functions in a clearer way than individual deletions, the impact of which would be obscured by mutual redundancy. Here, dual loss of ARID1 proteins was analyzed on the molecular, cellular, and organismal levels.
RESULTS
ARID1A and ARID1B mutations co-occur in cancer
To ask if dual loss occurs in human cancers, we interrogated cBioPortal for mutations in ARID1A and ARID1B. Endometrial (36%), bladder (22%), esophageal/gastric (22%), and biliary (20%) cancers have the highest rates of ARID1A mutations (Supplementary Table 1). ARID1B mutations occur at a 4–8% rate across these cancer types. Notably, 4% of gastric, 5% of endometrial, and 1–2% of liver cancer patients have dual ARID1A and ARID1B mutations, and instead of being mutually exclusive as would be expected of synthetic lethal pairs, these mutations are highly likely to co-occur (Supplementary Table 1). We did not identify any cancer types with mutual exclusivity between ARID1A and ARID1B mutations. Also, more than one third of ARID1A-mutant cell lines harbor ARID1B-inactivating mutations27. These observations raise the possibility that dual loss has synergistic or cancer promoting effects. Given the yearly prevalence of endometrial carcinoma (66K new cases according to the American Cancer Society), one would expect approximately 3,300 cases of double ARID1A/1B mutants per year for this cancer alone, making this scenario rather common.
Dual deletion of ARID1A and ARID1B is sufficient to drive aggressive tumorigenesis
To dissect the dual loss of ARID1A and ARID1B in vivo, we analyzed liver-specific conditional knockout models. As previously reported, liver-specific Arid1a deletion (AKO) results in morphologically normal livers that rarely developed cancer30. Liver-specific Arid1b KO (BKO) mice had no discernible phenotype31 (Fig. 1a). To ask if there is a synthetic lethal interaction, liver-specific double KO (DKO) mice were generated. 30% of DKO mice died prior to weaning (Extended Data Fig. 1a), but those that survived beyond one month survived into adulthood. At weaning, DKO body weights were lower than those of WT mice (Extended Data Fig. 1b). The early death and growth retardation was attributable to impaired liver development, indicated by high levels of AST, ALT, alkaline phosphatase, and total bilirubin (Extended Data Fig. 1c–g). Hyperbilirubinemia, a common finding in liver disease, was evident from the jaundiced appearance of DKO plasma (Extended Data Fig. 1h). By 1.5 months of age, DKO livers were dramatically overgrown (Fig. 1a) and multifocal cystic structures were apparent (Fig. 1b). Histology showed large, vacuolated structures in DKO livers, accompanied by loss of the monotonous hepatocytes and tissue organization seen in WT livers (Fig. 1c). IHC and western blots showed efficient ablation of both proteins (Extended Data Fig. 1i–k). Downregulation of HNF4A, a master transcription factor of liver differentiation, suggested a dedifferentiated state for DKO hepatocytes (Fig. 1d). Examination of the proliferative and apoptotic states of liver cells by Ki-67 and TUNEL staining showed increases in both (Fig. 1e,f). However, the importance of cell proliferation was further supported by the substantial increase in DKO liver mass (Fig. 1a). At 6–10 months of age, we observed large multifocal tumors associated with pervasive metastatic lesions in the lungs and spleen (Fig. 1g,h). Both hepatocellular carcinomas (HCCs) and cholangiocarcinomas (CCAs) were identified (Fig. 1i). While CCAs were larger in size, HCCs were more frequent. The median survival for DKO mice that made it into adulthood was 1 year, whereas all control mice were healthy at this time (Fig. 1j).
Figure 1. Loss of both ARID1A and ARID1B in the liver leads to impaired liver function, increased cell growth and tumor formation.
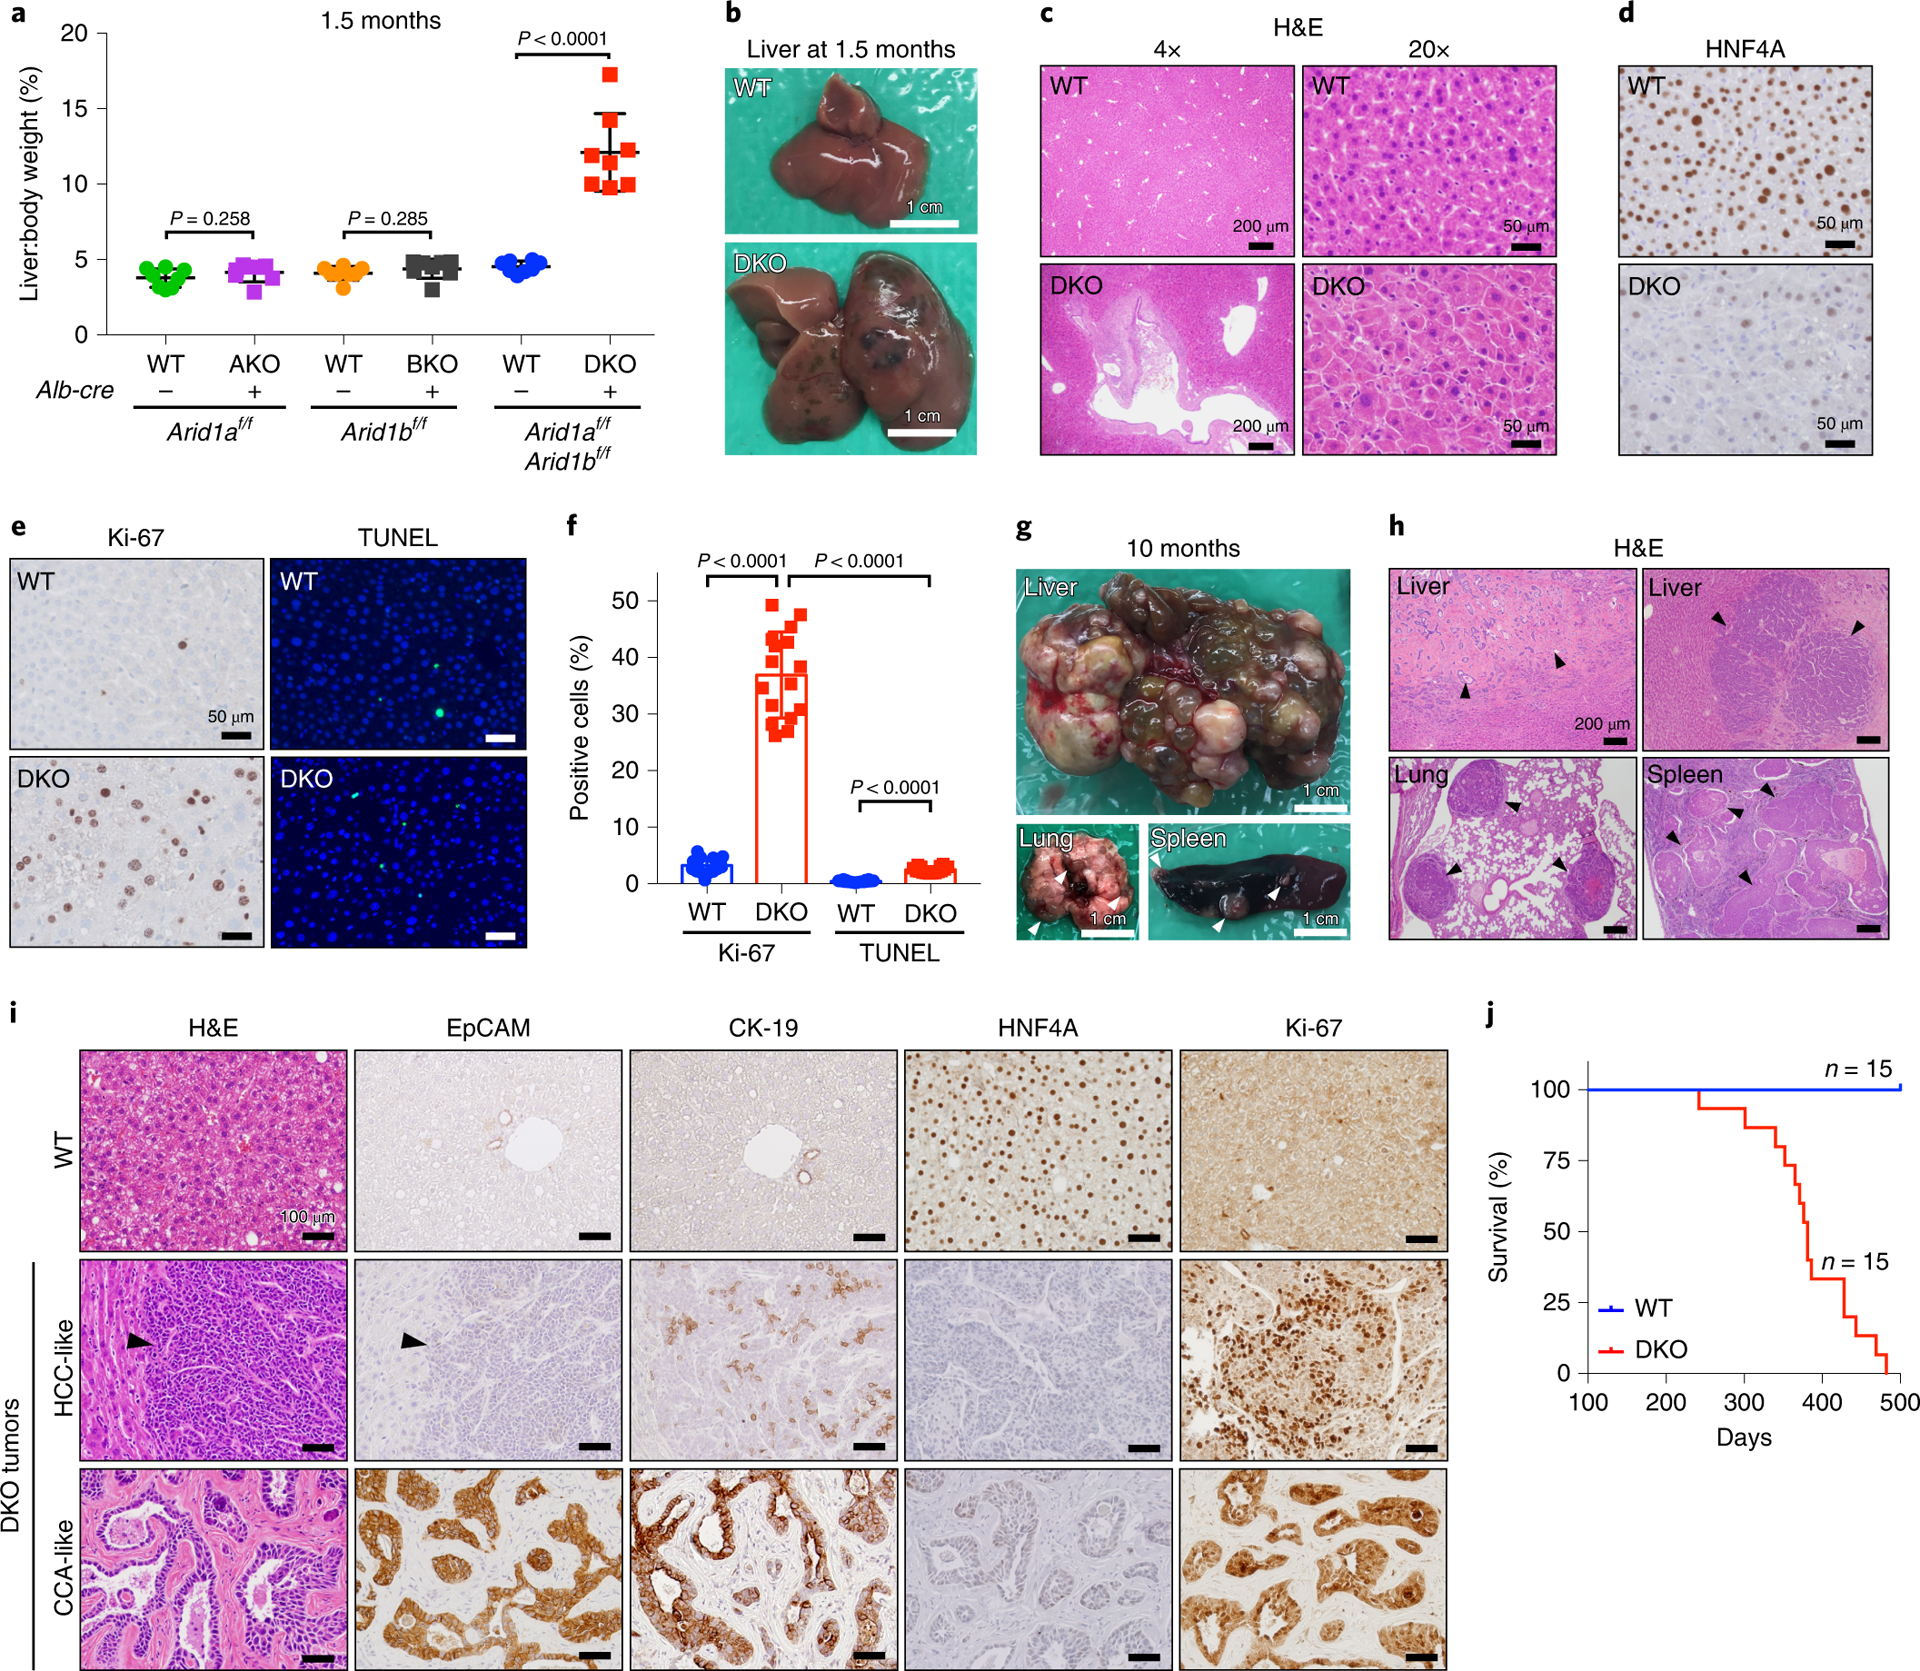
a. Liver/body weight ratios of liver specific Arid1a knockout (AKO), Arid1b knockout (BKO), and double knockout (DKO) mice and their corresponding control mice at 1.5 months (n=8 and 8 mice for each group)
b. Representative liver images of WT and DKO mice at the age of 1.5 months.
c. H&E staining of WT and DKO liver sections. Representative pictures shown in two different magnifications.
d. IHC staining of HNF4A on WT and DKO liver sections.
e. Proliferation and apoptosis were examined in WT and DKO livers by IHC staining of Ki-67 and TUNEL.
f. Quantitation of the positive cells from e (two images from each of n=8 and 8 mice were used for analysis).
g. DKO mice at 10 months of age developed multifocal tumors in the liver that metastasized to the lung and spleen. Representative pictures shown.
h. H&E staining of tissues shown in g.
i. Two histologic types of tumors (HCCs and CCAs) in DKO livers were analyzed by H&E and IHC staining of EpCAM, CK-19, HNF4A and Ki-67. HCCs were characterized by hepatocyte-like sheets of cells with the conspicuous absence of portal tracts and central veins. CCAs had the appearance of adenocarcinomas characterized by multiple glandular structures surrounded by a thick stromal lining. CCAs, but not HCCs, stained strongly for markers of biliary differentiation such as EPCAM and CK19.
j. Of the mice that survived the first month, a Kaplan-Meier survival curve was generated.
Data are presented as mean ± SD (a,f). Statistical significance was determined by two-tailed unpaired Student’s t-tests with Welch’s correction (a,f).
Loss of ARID1A and ARID1B in the liver leads to hyperproliferation and de-differentiation
Genome-wide chromatin accessibility changes are an expected consequence of BAF loss, but how these changes cause cancer is still unclear. To obtain an unbiased view of ARID1 deficient liver transcriptomes, we performed RNA-seq on WT livers, and those without Arid1a (AKO), Arid1b (BKO), or both (DKO). Compared with WT, AKO livers had 148 down and 361 upregulated genes (Fig. 2a) while BKO livers had a much smaller number of changes (Fig. 2b), suggesting a dominant role for ARID1A. In contrast, DKO livers revealed many more up- and down-regulated genes than either AKO or BKO livers (Fig. 2c), suggesting that the other paralog is required to maintain a homeostatic expression profile when one is missing. Notably, Cytochrome P450 family members were dramatically downregulated (Fig. 2c). Suppression of P450s, a large group of metabolic enzymes in liver, was likely a significant cause of metabolic dysfunction and jaundice. Gene Set Enrichment Analysis (GSEA) showed the upregulation of proliferation and inflammation circuits as well as the downregulation of metabolic signatures (Fig. 2d,e). AKO expression showed similar trends but to a lesser extent (Fig. 2f) and BKO showed minimal changes (Fig. 2g). We next analyzed the global binding of ARID1A and ARID1B containing cBAF complexes. Ty1 tagged ARID1A or ARID1B constructs were expressed in mouse H2.35 hepatocyte cell lines at physiologic levels (Fig. 2h,i), then ChIP-seq was performed with a Ty1 antibody. Within cBAF, ARID1B bound to only a subset of ARID1A peaks (Fig. 2j,k), explaining the more numerous and prominent transcriptional changes in AKO vs. BKO livers (Fig. 2a,b). These results underscored the significance of ARID1 proteins in liver development, terminal differentiation, and organ function.
Figure 2. Loss of ARID1A and ARID1B in the liver leads to hyperproliferation and de-differentiation.
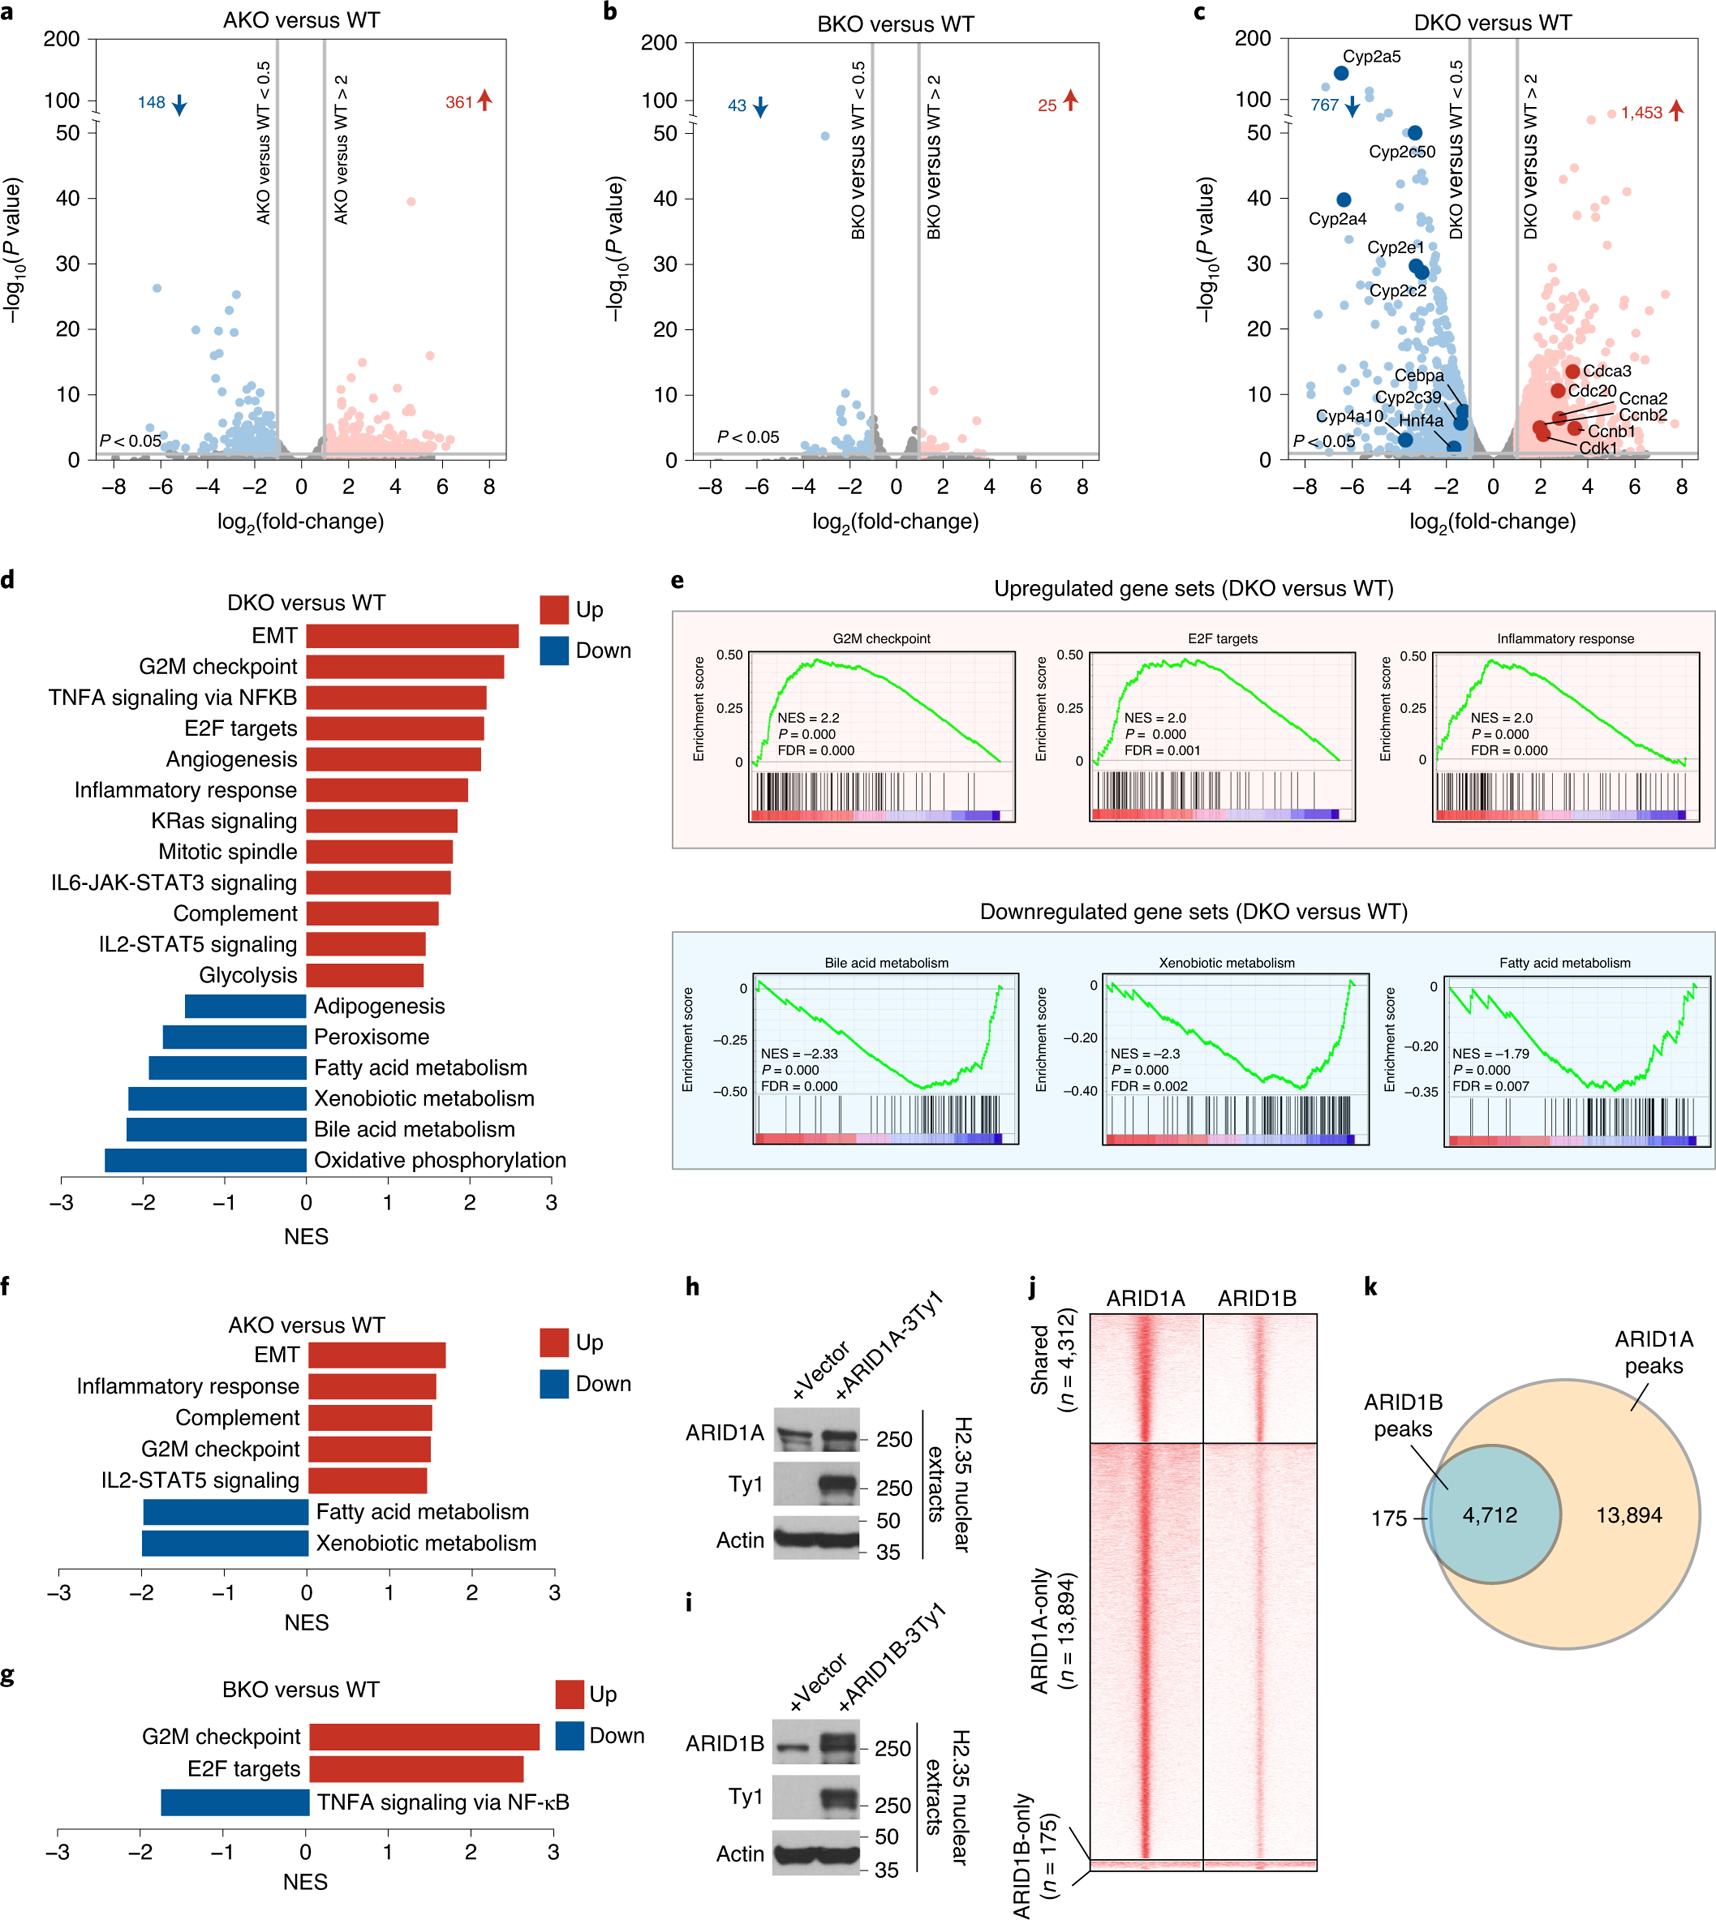
A–c. Volcano plots of RNA-seq data showing gene expression changes in AKO (a), BKO (b), DKO (c) and corresponding WT livers (n=4 and 4 mice for each group. ARID1Af/f; ARID1Bf/f, or double floxed mice without Albumin-Cre were used as controls). The dots/genes above the horizontal gray line at the bottom have P values of less than 0.05. P-values were calculated using DESeq R package which implements the negative binomial test and have been adjusted for multiple comparisons.
d. Hallmark pathway enrichment analysis of RNA-seq from WT and DKO livers.
e. GSEA performed on RNA-seq from DKO versus WT livers (NES: normalized enrichment score; FDR: false discovery rate).
f. Hallmark pathway enrichment analysis of RNA-seq from WT and AKO livers.
g. Hallmark pathway enrichment analysis of RNA-seq from WT and BKO livers.
h. Expression of Ty1 tagged ARID1A in H2.35 liver cells.
i. Expression of Ty1 tagged ARID1B in H2.35 liver cells.
j. Heatmap displaying ChIP-seq binding peaks of ARID1A and ARID1B (n=2 independent ChIP experiments for each).
k. Venn diagram showing the shared and unique binding loci between ARID1A and ARID1B.
Hyperproliferation and de-differentiation are immediate effects after ARID1A/1B loss
ARID1A/1B ablation during embryonic development leads to overgrowth and tumorigenesis, but it remained possible that hyperproliferation could have been a secondary adaptation to compensate for synthetic lethality induced cell death after dual paralog loss. To answer this, we deleted ARID1A and ARID1B in 3–6 month old adult livers by administering hepatocyte targeting adeno-associated virus (AAV-TBG-Cre) (Fig. 3a). As short as two weeks later, the liver surface became irregular (Fig. 3b), liver mass increased by more than 20% percent (Fig. 3c), and both ARID1 proteins were undetectable in hepatocytes (Fig. 3d). Similar to Albumin-Cre mice, AAV-TBG-Cre treated hepatocytes were large and dysmorphic (Fig. 3d), mice were jaundiced (Extended Data Fig. 2a), and exhibited high levels of AST, ALT, alkaline phosphatase, and total bilirubin (Extended Data Fig. 2b–f). Again, proliferation was a prominent contributor given the increase in liver size and ratio of proliferating to apoptotic cells (Fig. 3e,f). Gene expression changes recapitulated that of DKO livers, with ten-fold upregulation of cell cycle genes (Fig. 3g) and dramatic downregulation of differentiation (Fig. 3h) and P450 genes (Fig. 3i). These results suggested that hyperproliferation and dedifferentiation were immediate events following ARID1A/1B loss. Given the possibility that enforcing hepatocyte proliferation caused the secondary effect of dedifferentiation, we analyzed previously generated liver V5-ARID1A ChIP-seq data to examine direct targets of ARID1A30. Indeed, ARID1A binds to promoter or enhancer regions of many liver differentiation and P450 genes, suggesting that differentiation gene expression is directly altered after ARID1A/1B loss (Extended Data Fig. 2g).
Figure 3. Hyperproliferation and de-differentiation are immediate effects after ARID1A/1B loss.
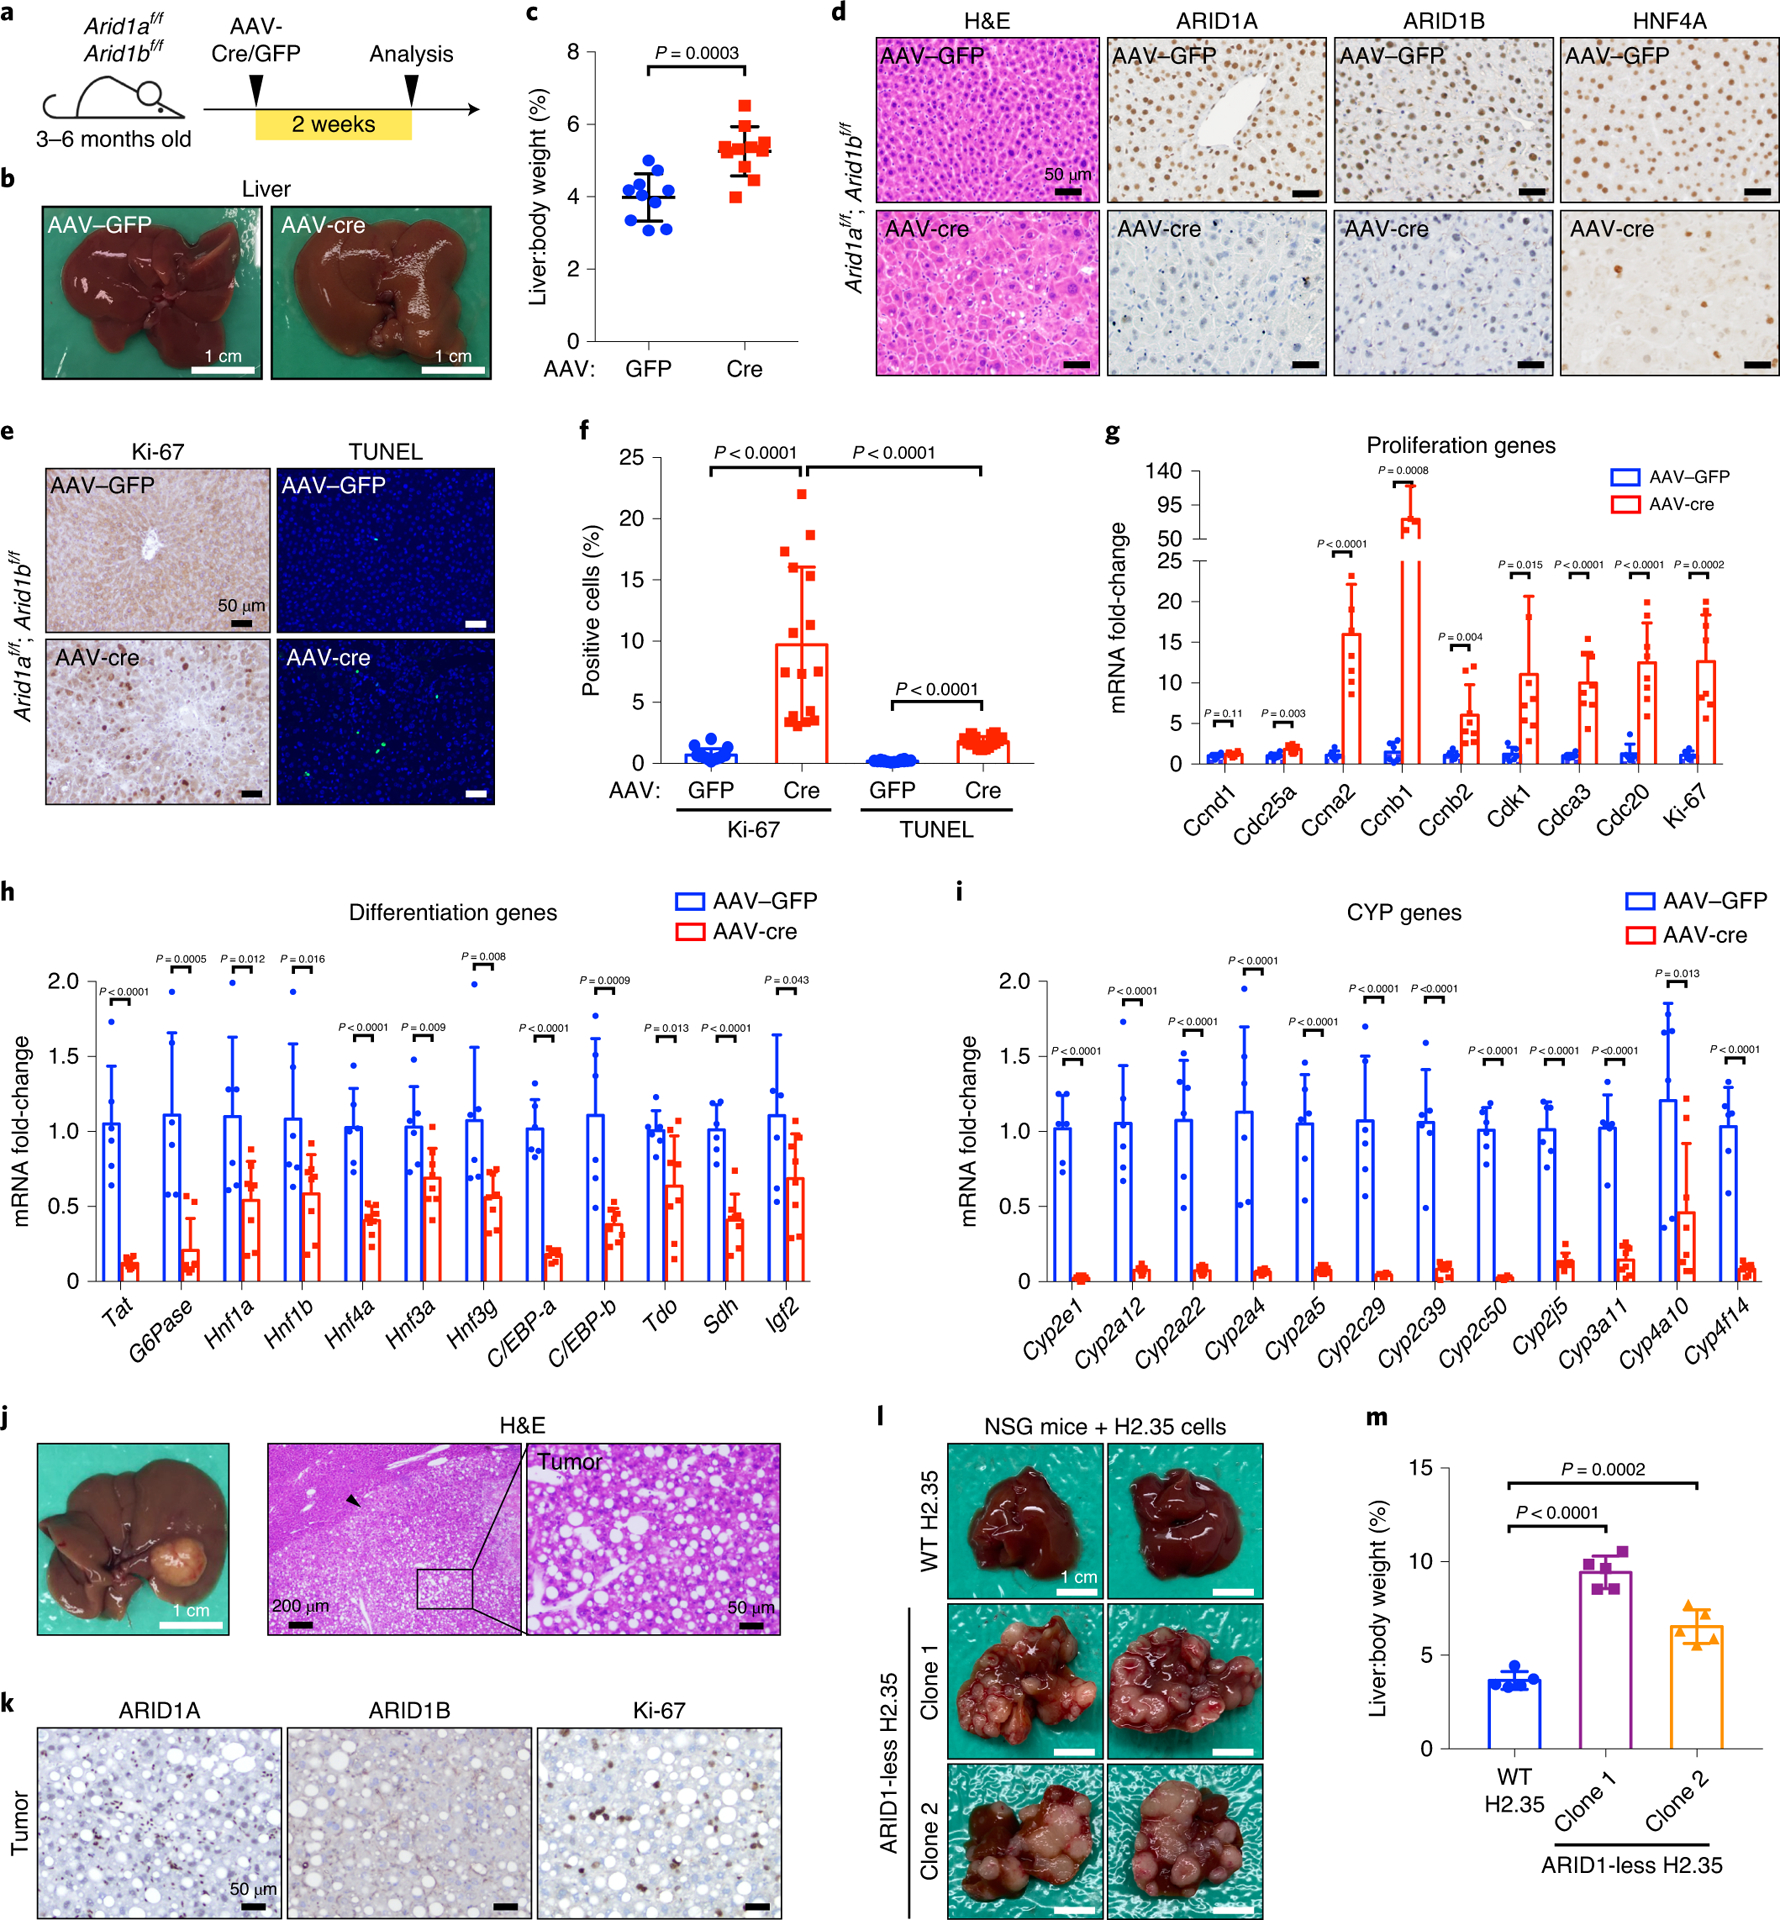
a. Schematic for AAV-Cre based KO of ARID1A/1B
b. Livers of Arid1af/f; Arid1bf/f mice injected with AAV-GFP or AAV-Cre.
c. Liver versus body weight of mice injected with AAV-GFP or AAV-Cre (n=10 and 11 mice).
d. H&E and IHC staining of ARID1A, ARID1B and HNF4A on AAV-Cre or GFP liver sections.
e. Proliferation and apoptosis were examined in AAV-GFP or Cre livers by IHC staining of Ki-67 and TUNEL.
f. Statistics of the positively staining cells in e (n = 8 and 8 mice for each group. Two images for each liver were analyzed).
g. qPCR analysis of proliferation related gene expression in AAV-GFP or AAV-Cre injected livers (n=6 and 8 mice for each group).
h. qPCR analysis of differentiation related gene expression in livers. Same samples and statistical analysis as in g.
i. qPCR analysis of Cytochrome P450 genes in livers. Same samples and statistical analysis as in g.
j. Representative liver images of Arid1af/f; Arid1bf/f mice injected with AAV-Cre at the age of 3 months and analyzed 8 months after injection. Histology was consistent with HCC.
k. IHC staining of ARID1A, ARID1B, and Ki-67 on AAV-Cre liver sections.
l. Representative liver images of NSG mice injected with control and ARID1-less H2.35 cells.
m. Liver versus body weight of NSG mice injected with WT and ARID1-less H2.35 cells (n=5 mice for each cell line transplantation). Data are presented as mean ± SD (c,f–i,m). Statistical significance was determined by two-tailed unpaired Student’s t-tests with Welch’s correction (c,f–i,m).
To determine if dual deletion was causing cancer solely through tissue damage occurring early in development, we asked if the above AAV8-TBG-Cre injected mice, which model adult onset loss of ARID1 proteins, could still develop cancer. At 10 months of age, 2 mice (2/11) exhibited large HCCs (Fig. 3j) and five (5/11) showed small cancer lesions. These tumors showed successful deletion of both genes and exhibited a high proliferative index (Fig. 3k). The absence of EpCAM and CK-19 staining was characteristic of HCC but not CCA (Extended Data Fig. 2h). Based on our models, dual deletion in hepatocytes and cholangiocytes with Alb-Cre induced a combination of HCCs and CCAs, whereas deletion in hepatocytes with AAV-Cre induced only HCCs. To further rule out tissue damage as a primary driver of cancer, and to confirm a cell autonomous proliferation inducing effect of dual ARID1A/1B suppression, we introduced a doxycycline (Dox)-inducible ARID1A knockdown construct into ARID1B knockout H2.35 hepatocyte cell lines (hereafter called “ARID1-less”) (Extended Data Fig. 3a). Loss of both ARID1 proteins did not lead to substantial changes in colony formation assays (Extended Data Fig. 3b). We then transplanted the WT or two distinct clones of ARID1-less H2.35 cells into NSG mice. Strikingly, ARID1-less cells formed large tumors in vivo, while WT cells were unable to form any tumors (Fig. 3l,m). This demonstrated that a damaged liver microenvironment, while possibly contributory, was not required for ARID1A/1B deficient cells to form cancer.
Global ARID1A/1B loss in adults leads to rapid development of squamous cell carcinoma
We next sought to determine if ARID1A/1B loss was tumorigenic in other tissues. We injected low-dose tamoxifen (Tam) into UBC-CreER; Arid1af/f; Arid1bf/f and control Arid1af/f; Arid1bf/f adult mice (Fig. 4a). UBC-CreER mice harbor a Tam inducible CreER that is expressed ubiquitously. Because this deleted both ARID1 components in most tissues, some mice did not survive. However, 2–3 months after injection, 50% of surviving mice (5/10) developed grossly visible cancers on their muzzles, ears, or limbs (Fig. 4b). Histology showed invasive squamous cell carcinoma (Fig. 4c). Notably, tumors invariably failed to stain for ARID1A/1B after IHC, while the non-malignant surrounding tissues expressed these proteins in a mosaic fashion (Fig. 4d). Thus, deletion of both ARID1 genes in adult mice was sufficient for transformation in a variety of tissues in the absence of injury.
Figure 4. UBC-CreER induced DKO mice develop invasive squamous cell carcinomas.
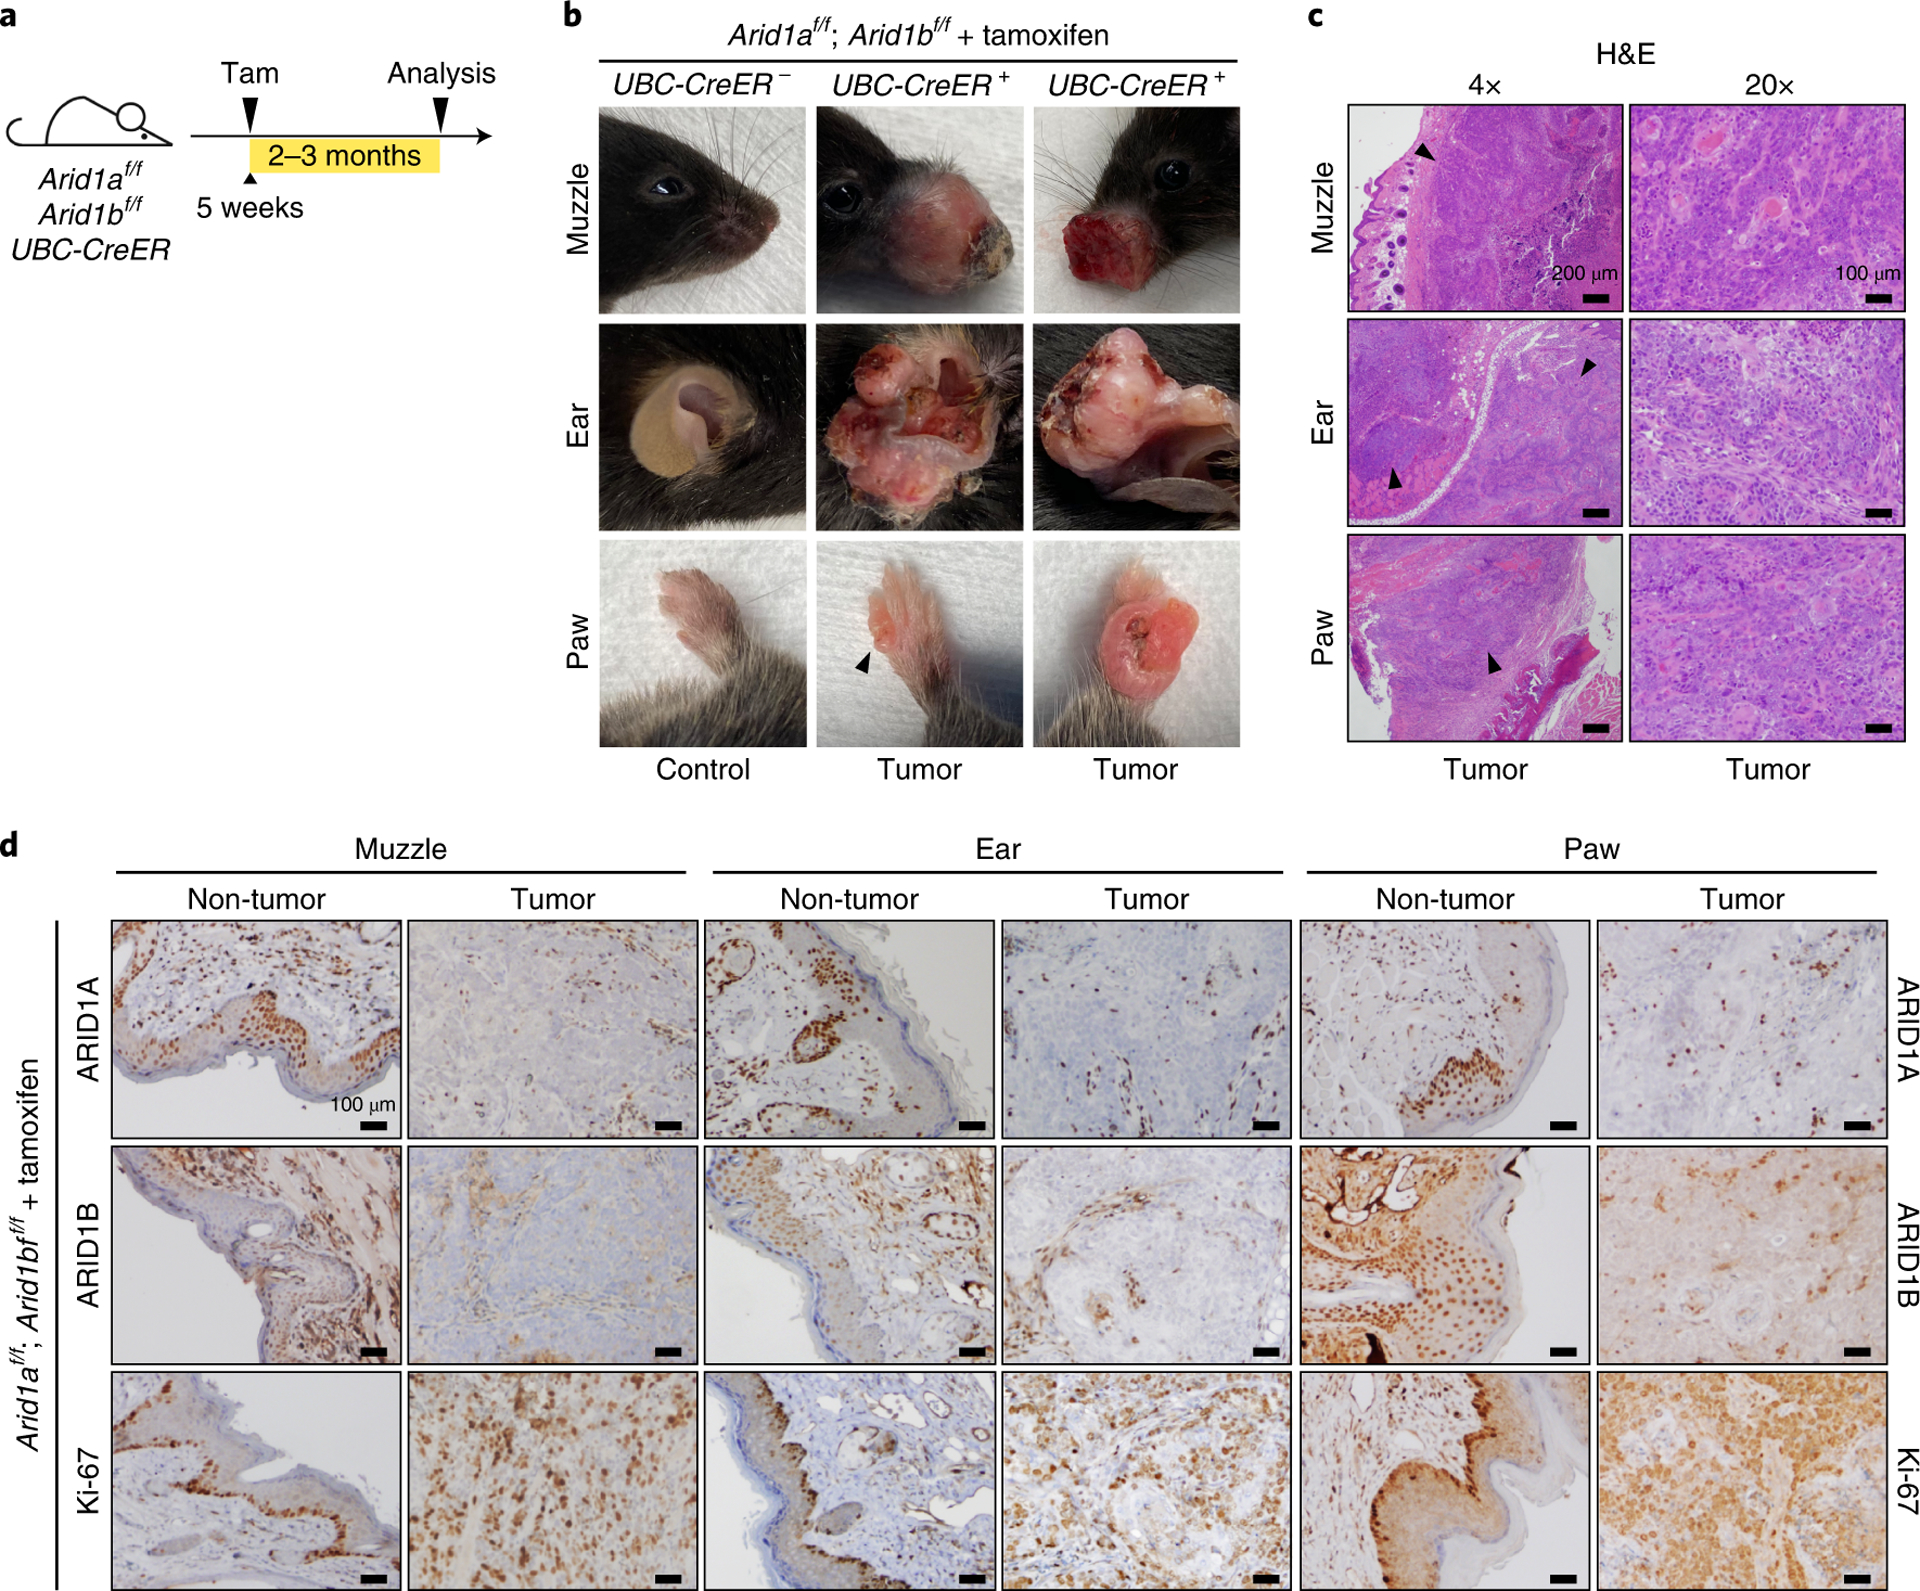
a. Schematic for UBC-CreER and tamoxifen induced deletion of Arid1a and Arid1b.
b. Representative tumors from the muzzle, ear, and limb.
c. H&E staining on tumor sections shows invasive squamous cell carcinomas of the skin.
d. IHC staining of ARID1A, ARID1B, and Ki-67 suggests that tumors originated from DKO cells.
Physiologic dual ARID1A/B loss in endometrial cancers is required for malignant growth
We extended the above studies to a human tissue type that is most frequently subject to ARID1 related carcinogenesis. We found that more than 55% percent of endometrial cancer cell lines have non-synonymous mutations in both ARID1A and ARID1B (Fig. 5a). However, whether these co-mutations are synergistic drivers or passenger events is unclear. We confirmed that one of these cell lines (MFE-296) showed complete protein loss of both paralogs (Fig. 5b). To determine if the absence of both components contributes to the malignant phenotype, we re-expressed ARID1A or ARID1B in MFE-296 cells. Cells re-expressing either ARID1A or ARID1B, but not GFP or an ARID1A truncation observed in cancer, showed senescence phenotypes such as larger, flattened cell shapes and halted proliferation (Fig. 5c). This was further confirmed by senescence-associated β-galactosidase activity (Fig. 5c,d). Continuous expression of either paralog completely arrested growth and colony formation, while neither GFP nor truncated ARID1A had these effects (Fig. 5e,f). These results, in agreement with the murine models, show that concerted loss of both ARID1s imparts synergistic effects on cellular transformation.
Figure 5. Loss of both ARID1A and ARID1B proteins in endometrial cancer cells is essential for transformation and proliferation.
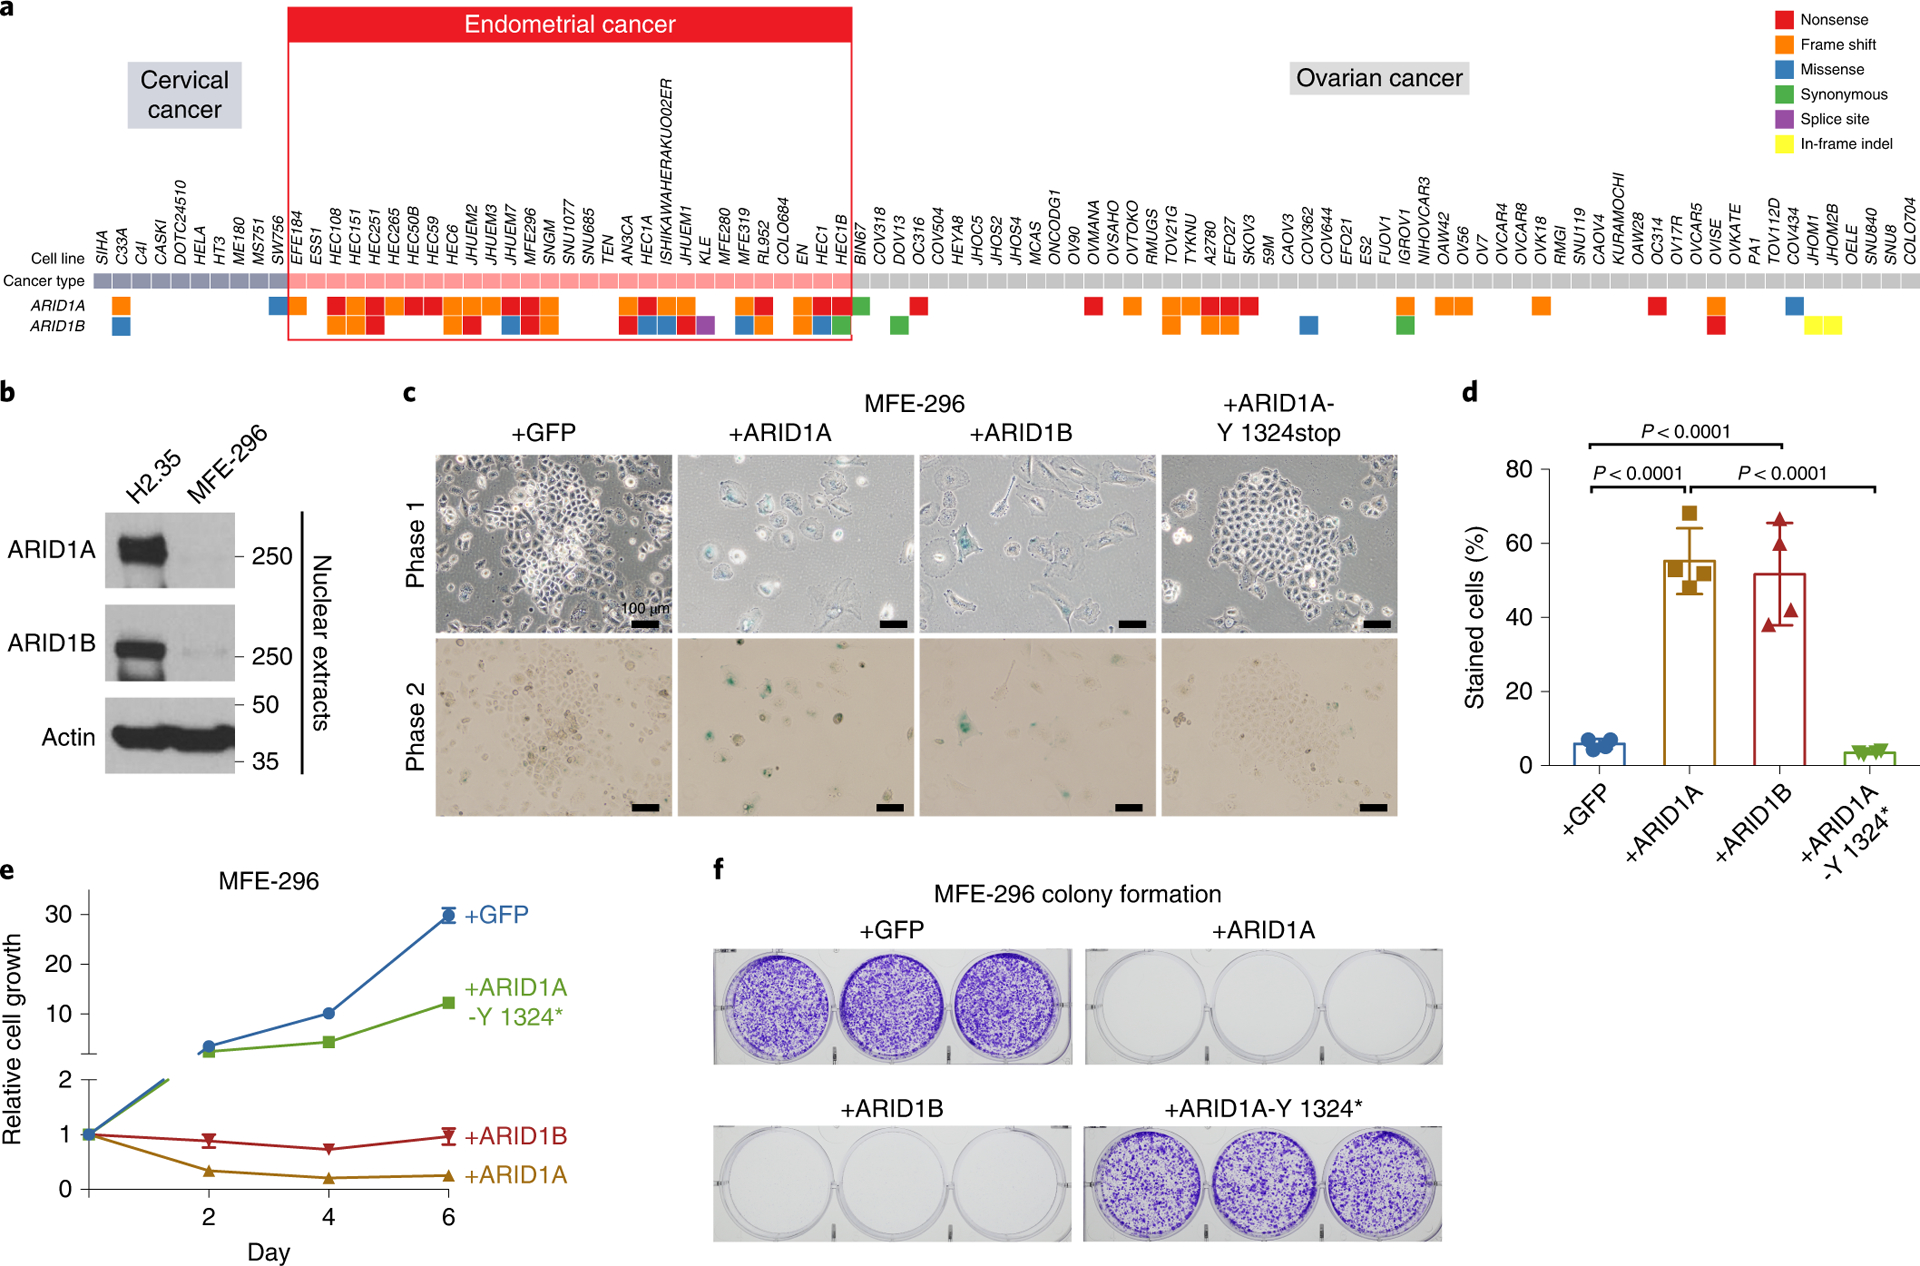
a. ARID1A and ARID1B mutations in cervical, endometrial, and ovarian cancer cells from the Cancer Cell Line Encyclopedia (CCLE).
b. Western blot for ARID1 proteins in MFE-296 endometrial cancer cells.
c. Senescence staining of MFE-296 cells expressing GFP, ARID1A, ARID1B or ARID1A-Y1324stop. Images were taken from the same field under two different phases to show cell morphology and staining.
d. Quantitation of blue-stained cells observed in c (Four different areas in each experiment were quantified. Data are presented as mean ± SD. Statistical significance was determined by two-tailed unpaired Student’s t-tests with Welch’s correction).
e. Relative growth of MFE-296 cells expressing GFP, ARID1A, ARID1B or ARID1A-Y1324stop (n=4 independent cultures for each time point. Data are presented as mean ± SD).
f. Colony formation assay of MFE-296 cells expressing GFP, ARID1A, ARID1B or ARID1A-Y1324stop.
Residual cBAF complexes secondary to ARID1A/1B loss do not possess neo-functionality
It is unclear if residual cBAF complexes resulting from ARID1A/1B loss possess neo-functionality that contributes to cancer. To understand how loss of ARID1A and ARID1B affects cBAF integrity, we analyzed the protein levels of BAF components in ARID1-less and control H2.35 cells described above (Extended Data Fig. 3). Dual ARID1 deletion did not lead to degradation of other SWI/SNF subunits in ARID1-less cells, except for a dramatic loss of DPF2 protein (Extended Data Fig. 3a). Similarly, DKO livers showed preservation of subunits except for a decrease in BAF170 (Extended Data Fig. 3c,d). To examine potential neo-functionality of cBAF without ARID1s, we characterized residual complexes. Prior reports used immunoprecipitation (IP) of putative dissociated BAF subunits to define residual complexes in the context of ARID1 deficiency9, 27. With this approach, only the residual subcomplexes that contain the antibody targeted subunit are enriched, whereas those without the targeted subunit may not be identified. To overcome this, we utilized two orthogonal chromatographic approaches to separate and identify potential subcomplexes. On a gel filtration column, BAF subunits in control H2.35 extracts co-eluted in fractions 7–10 (Fig. 6a), whereas in ARID1-less nuclear extracts, BAF170, 60b, 57, 155, and 47 shifted to smaller molecular weight fractions (compare fractions 11–14 from Fig. 6a,b). Gel filtration quantification parsed the subunits into two groups based on interaction patterns (Fig. 6c). On the S-column, a majority of the shared cBAF-pBAF subunits in control extracts were contained in cBAF complexes (Fig. 6d), indicating that cBAF is the most abundant SWI/SNF complex in liver cells. There were limited to no free subunits outside of BAF complexes (fractions 5–8 in Fig. 6d), suggesting a tight regulation of subunit abundance. Again, ARID1 loss resulted in a dramatically different pattern on the S-column (Fig. 6e). Most of the Brg1 and BAF53a co-eluted with ARID2 (fractions 12–15 in Fig. 6e). A majority of BAF170, 60b, 57, 155 and 47 dissociated from cBAF and eluted in fractions 6–8 (Fig. 6e,f). However, these subcomplexes shifted away from Brg1 containing fractions and thus were not likely to have chromatin remodeling ability due to the lack of the catalytic Brg1.
Figure 6. Residual cBAF complexes secondary to ARID1A/B loss do not possess neo-functionality.
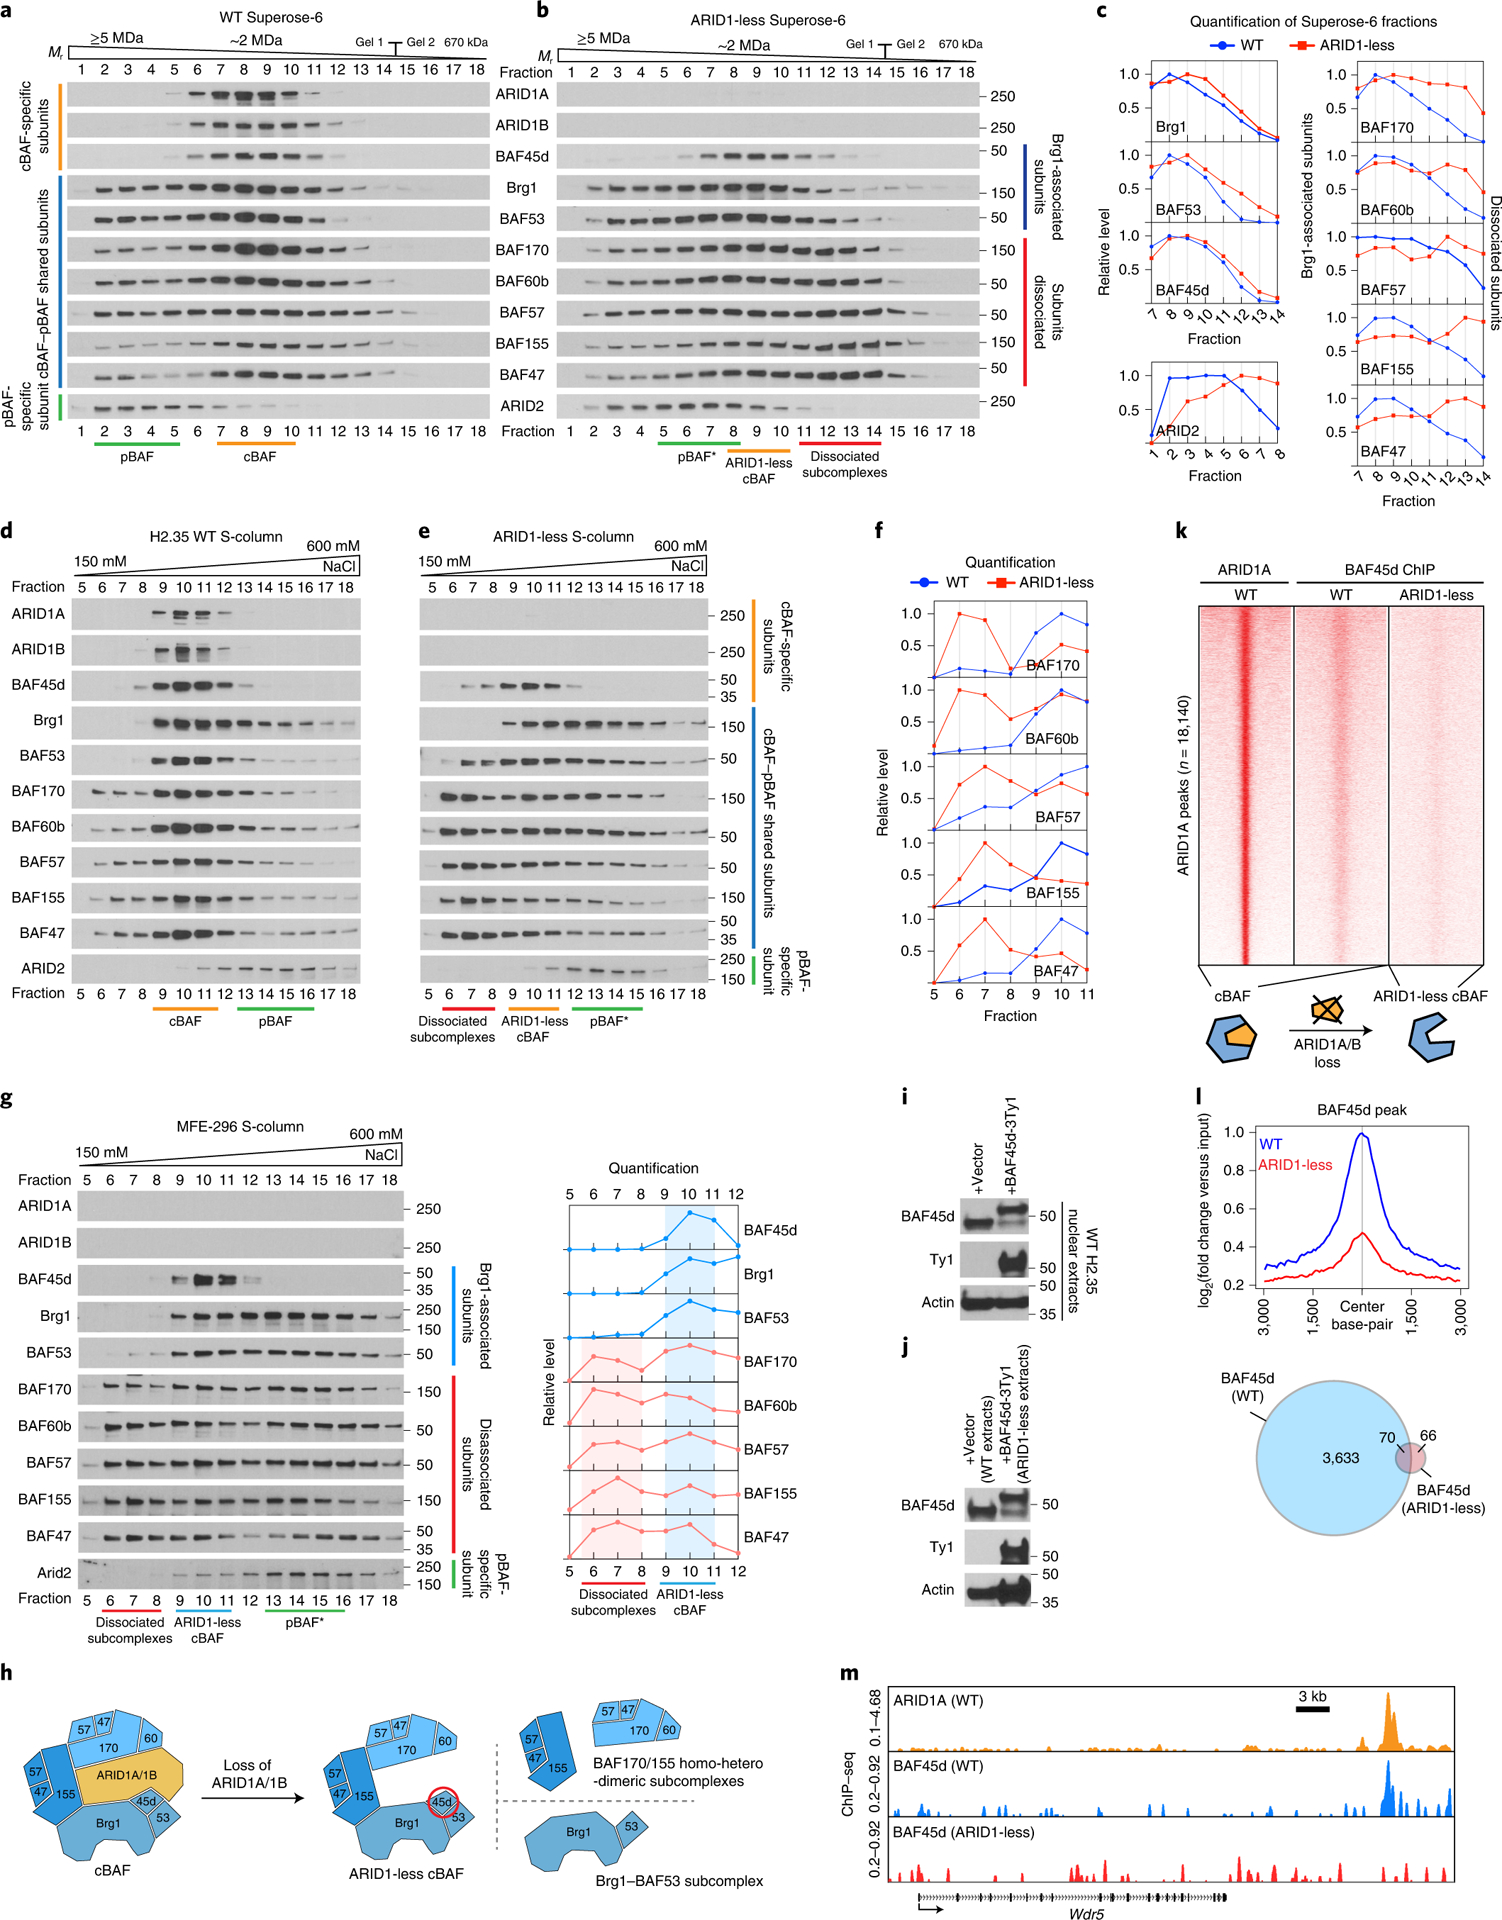
a. Gel filtration chromatography of control H2.35 cell nuclear extracts using a Superose-6 column.
b. Gel filtration chromatography of ARID1-less H2.35 cell nuclear extracts.
c. Quantification of western blot data in a and b.
d. Cation exchange chromatography of control H2.35 nuclear extracts using an S-column.
e. Cation exchange chromatography of ARID1-less H2.35 nuclear extracts.
f. Quantification of western blot data in d and e.
g. Cation exchange chromatography of MFE-296 nuclear extracts and the corresponding quantification.
h. Model for three types of subcomplexes resulting from cBAF dissociation in the absence of ARID1 paralogs. The ARID1-less cBAF specific subunit BAF45d is circled in red.
i. Expression of Ty1 tagged BAF45d in control H2.35 cells.
j. Expression of Ty1 tagged BAF45d in ARID1-less H2.35 cells. The expression level was compared with endogenous BAF45d in WT extracts due to partial loss of endogenous BAF45d in ARID1-less cells.
k. The occupancies of BAF45d in control and ARID1-less cells, which represent control cBAF and ARID1-less cBAF complex binding, shown as a heatmap. ARID1A binding loci were used as a reference.
l. The corresponding averaged ChIP-seq peaks and Venn diagram are shown.
m. Representative genome browser tracks showing impaired binding of ARID1-less cBAF (BAF45d peaks in ARID1-less cells).
In contrast to the cBAF assembly hypothesis in which Brg1 recruitment depends on ARID1 proteins9, in ARID1-less cells we identified a Brg1 containing subcomplex that lacks ARID1s but retains most of the other subunits (fractions 9–11 in Fig. 6e and fractions 8–10 in Fig. 6b). A similar Brg1 containing subcomplex was also observed in MFE-296 nuclear extracts separated by the cation exchange column (fractions 9–11 in Fig. 6g). We coined this Brg1 containing residual complex “ARID1-less” cBAF (Fig. 6h), which is the subcomplex that is most likely to have ectopic chromatin binding and remodeling activities. BAF45d, a cBAF specific component retained in ARID1-less cBAF fractions, was a representative subunit for this residual subcomplex and was used to specifically assess the neo-functionality of ARID1-less cBAF (Fig. 6h).
We next sought to determine if ARID1-less cBAF retained its original functions or exerted ectopic ones. ARID1-less cBAF functionality was tested by comparing BAF45d binding in control and ARID1-less cells. Ty1 tagged BAF45d was expressed in control (Fig. 6i) and ARID1-less cells (Fig. 6j) at physiologic levels, then ChIP-seq was performed with a Ty1 antibody. In control cells, the binding pattern of BAF45d corresponded to ARID1A patterns, but binding was virtually eliminated in ARID1-less cells (Fig. 6k–m). This suggested that residual ARID1-less cBAF complexes do not maintain strong genome-wide interactions and remodeling activities.
The presence of residual cBAF subcomplexes is associated with pBAF disruption
Dissociated subcomplexes other than ARID1-less cBAF are unlikely to remodel chromatin, but could still have an effect on SWI/SNF homeostasis. Based on the observation that SWI/SNF subunit levels are tightly controlled with small amounts of free subunits, we hypothesized that homeostasis of other SWI/SNF complexes might be disrupted when cBAF, the most abundant complex, is dissociated. Indeed, loss of ARID1 proteins influenced the assembly of pBAF, a complex in which neither ARID1A nor ARID1B reside. Gel filtration analysis in control H2.35 cells indicated that pBAF potentially exists in oligomeric form, since ARID2 ran at a much larger apparent molecular weight (MW) than would be expected if pBAF were a monomer (Fig. 7a and 6a–c). In ARID1-less cells, the ARID2 peak shifted by 3-fractions to a putative monomeric position (Fig. 7a,b). Similarly, MFE-296 chromatography showed almost identical patterns of cBAF complex breakup (Fig. 7c), notably including a potentially monomeric ARID2/pBAF peak that largely overlaps with ARID1-less cBAF (Fig. 7d). We hypothesized that the residual cBAF subcomplexes may bind non-specifically to pBAF, leading to the observed biochemical changes. To assess this, we compared pBAF composition in control and ARID1-less cells by expressing a Flag tagged ARID2 followed by IP and mass spectrometry analysis (Fig. 7e). Changes in the relative ratios of pBAF subunits were observed in ARID1-less cells (Fig. 7f). A model consistent with the above data is the de-oligomerization of pBAF due to non-specific binding of residual subcomplexes. The MW of monomeric pBAF plus bound subcomplexes is likely still smaller than a normally oligomerized pBAF, which could explain the increased subunit levels in mass spectrometry but decreased apparent MW on gel filtration. These results suggest a finely tuned distribution of subunits among SWI/SNF complexes.
Figure 7. The presence of residual cBAF subcomplexes is associated with pBAF disruption.
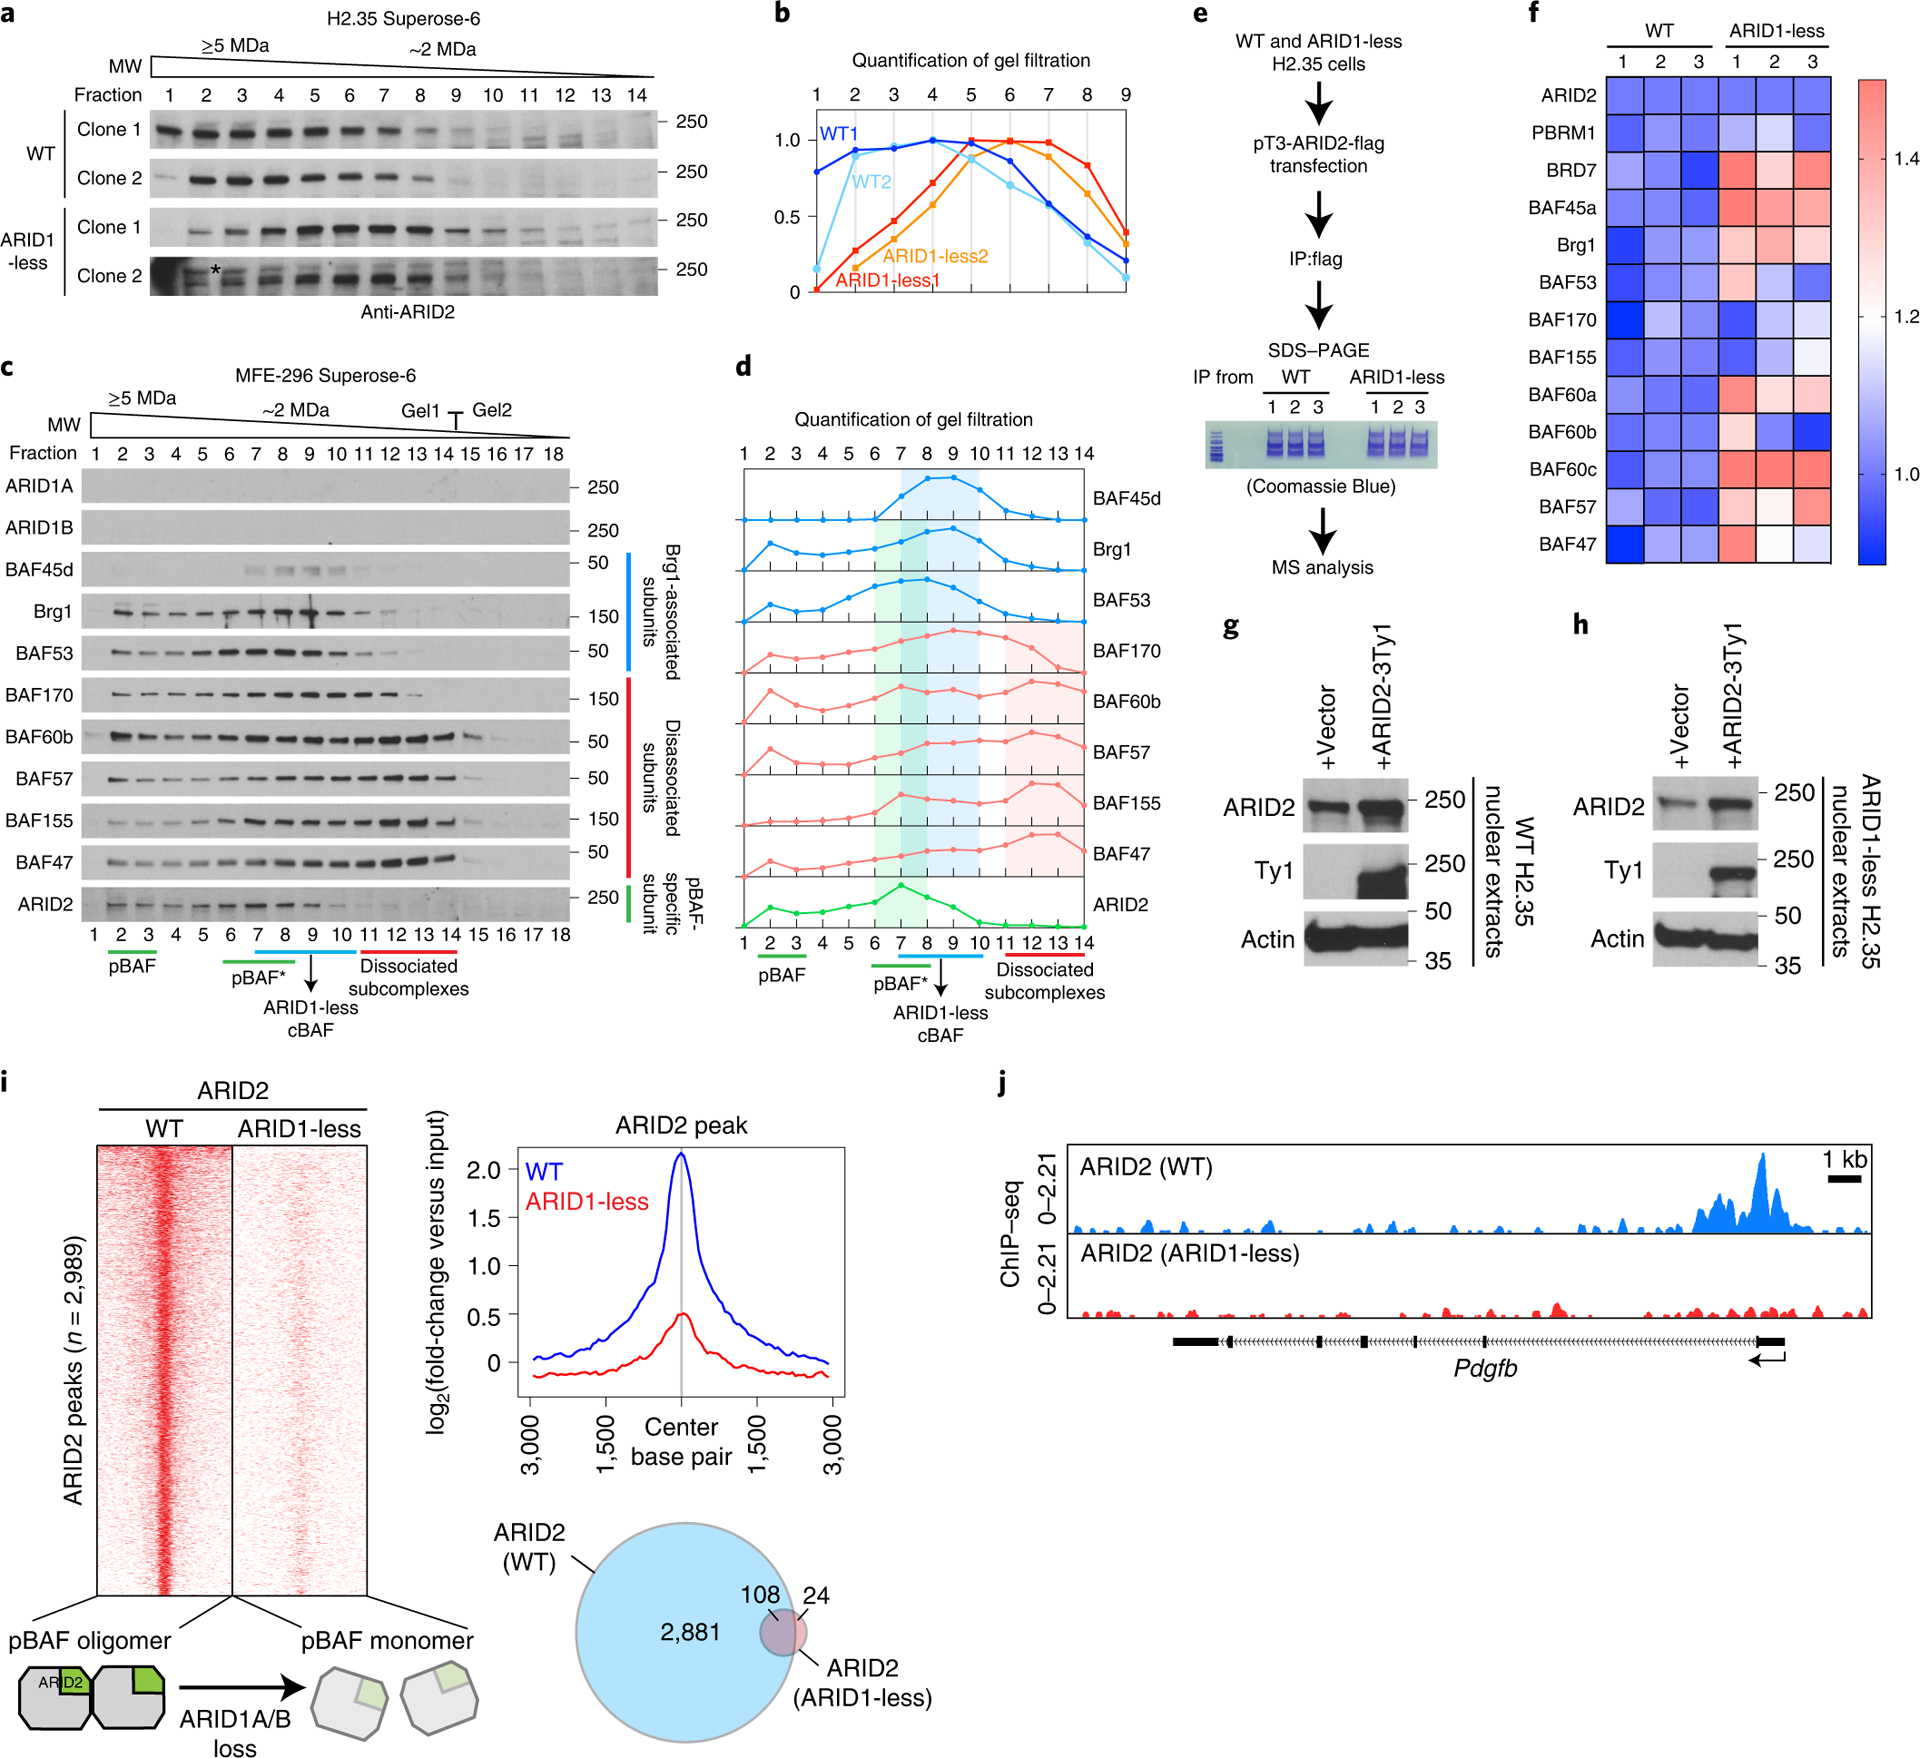
a. Western blot for ARID2 in gel filtration chromatography experiments on control and ARID1-less H2.35 nuclear extracts from independent cell line clones (* non-specific band).
b. Quantification of western blot data in a.
c. Gel filtration chromatography of MFE-296 nuclear extracts using a Superose-6 column showing breakup of cBAF and two peak sizes for pBAF.
d. Quantification of western blot data in c.
e. Schema for mass spectrometry analysis of pBAF composition.
f. Mass spectrometry of pBAF complex purified from control and ARID1-less H2.35 cells. Relative quantity of each subunit was shown as heatmap (n=3 and 3 independent IP and mass spectrometry experiments). ARID2 levels in WT and ARID1-less cells were normalized to each other, and the other subunits were normalized by comparing their relative levels with ARID2.
g. Expression of Ty1 tagged ARID2 in control H2.35 cells.
h. Expression of Ty1 tagged ARID2 in ARID1-less H2.35 cells.
i. Comparison of ARID2 occupancies in control and ARID1-less cells. Heatmap and the corresponding averaged peak map and Venn diagram are shown (n=2 and 4 independent ChIP experiments).
j. Representative genome browser tracks showing impaired binding of pBAF (ARID2 peaks in ARID1-less cells).
We examined the consequences of pBAF changes in ARID1-less cells by examining genome-wide binding. Ty1 tagged ARID2 was expressed at physiologic levels in control (Fig. 7g) and ARID1-less H2.35 cells (Fig. 7h). ChIP-seq with a Ty1 antibody showed that ARID2 binding was essentially eliminated in ARID1-less cells (Fig. 7i,j), suggesting impaired pBAF function. Impaired ARID2/pBAF function might contribute to cancer due to ARID1A/1B deficiency, as ARID2 has been shown to have tumor suppressor activities in multiple studies32–35.
We also analyzed ncBAF binding by expressing Ty1 tagged ncBAF specific subunit BRD9 in control and ARID1-less cells (Extended Data Fig. 4a). Globally, the three categories of intact SWI/SNF complexes in control cells have shared and unique binding peaks (Extended Data Fig. 4b), with cBAF showing the most abundant binding sites followed by ncBAF and pBAF (Extended Data Fig. 4c). In contrast to the impaired ARID2/pBAF binding in ARID1-less cells, ChIP-seq analysis showed that BRD9 binding was unperturbed (Extended Data Fig. 4d,e), suggesting that ncBAF functionality was not disturbed in ARID1-less cells. This was somewhat expected because ncBAF does not normally contain any ARID subunits.
Biochemical consequences of 69 ARID1A/1B mutations in cancer
The dissociation of cBAF and the disruptive role of the resulting residual subcomplexes underscored the importance of ARID1 proteins for cBAF scaffolding. ARID1s are large proteins with more than 2000 residues, thus understanding the function of distinct domains is critical but challenging. Evolutionary conservation analysis and secondary structure prediction36 of ARID1A proteins (Extended Data Fig. 5a,b) identified two conserved C-terminal domains, which we have termed ARID1 Scaffolding Domain 1 and 2 (ASD1 and ASD2) (Fig. 8a). Four conserved LxxLL motifs with unknown function also drew our attention (Fig. 8a). To identify the potential functions of each segment of ARID1A, we generated a deletion/mutation series spanning the full-length protein. We found that ASD1 and the second LxxLL motif within ASD2 were required for the interaction between ARID1A and other subunits (Fig. 8b). Alanine scans within ASD1 identified important residues (1670–1680 and 1712–1720) for ARID1A’s scaffolding role (Extended Data Fig. 5c). Interestingly, we were not able to identify mutants that could specifically disable ARID1A’s binding to either Brg1, BAF170, or 155 individually (Fig. 8b), suggesting that the essential ASD domains interact with Brg1, BAF170, and BAF155 together.
Figure 8. Biological consequences of 69 ARID1A/1B mutations in cancer.
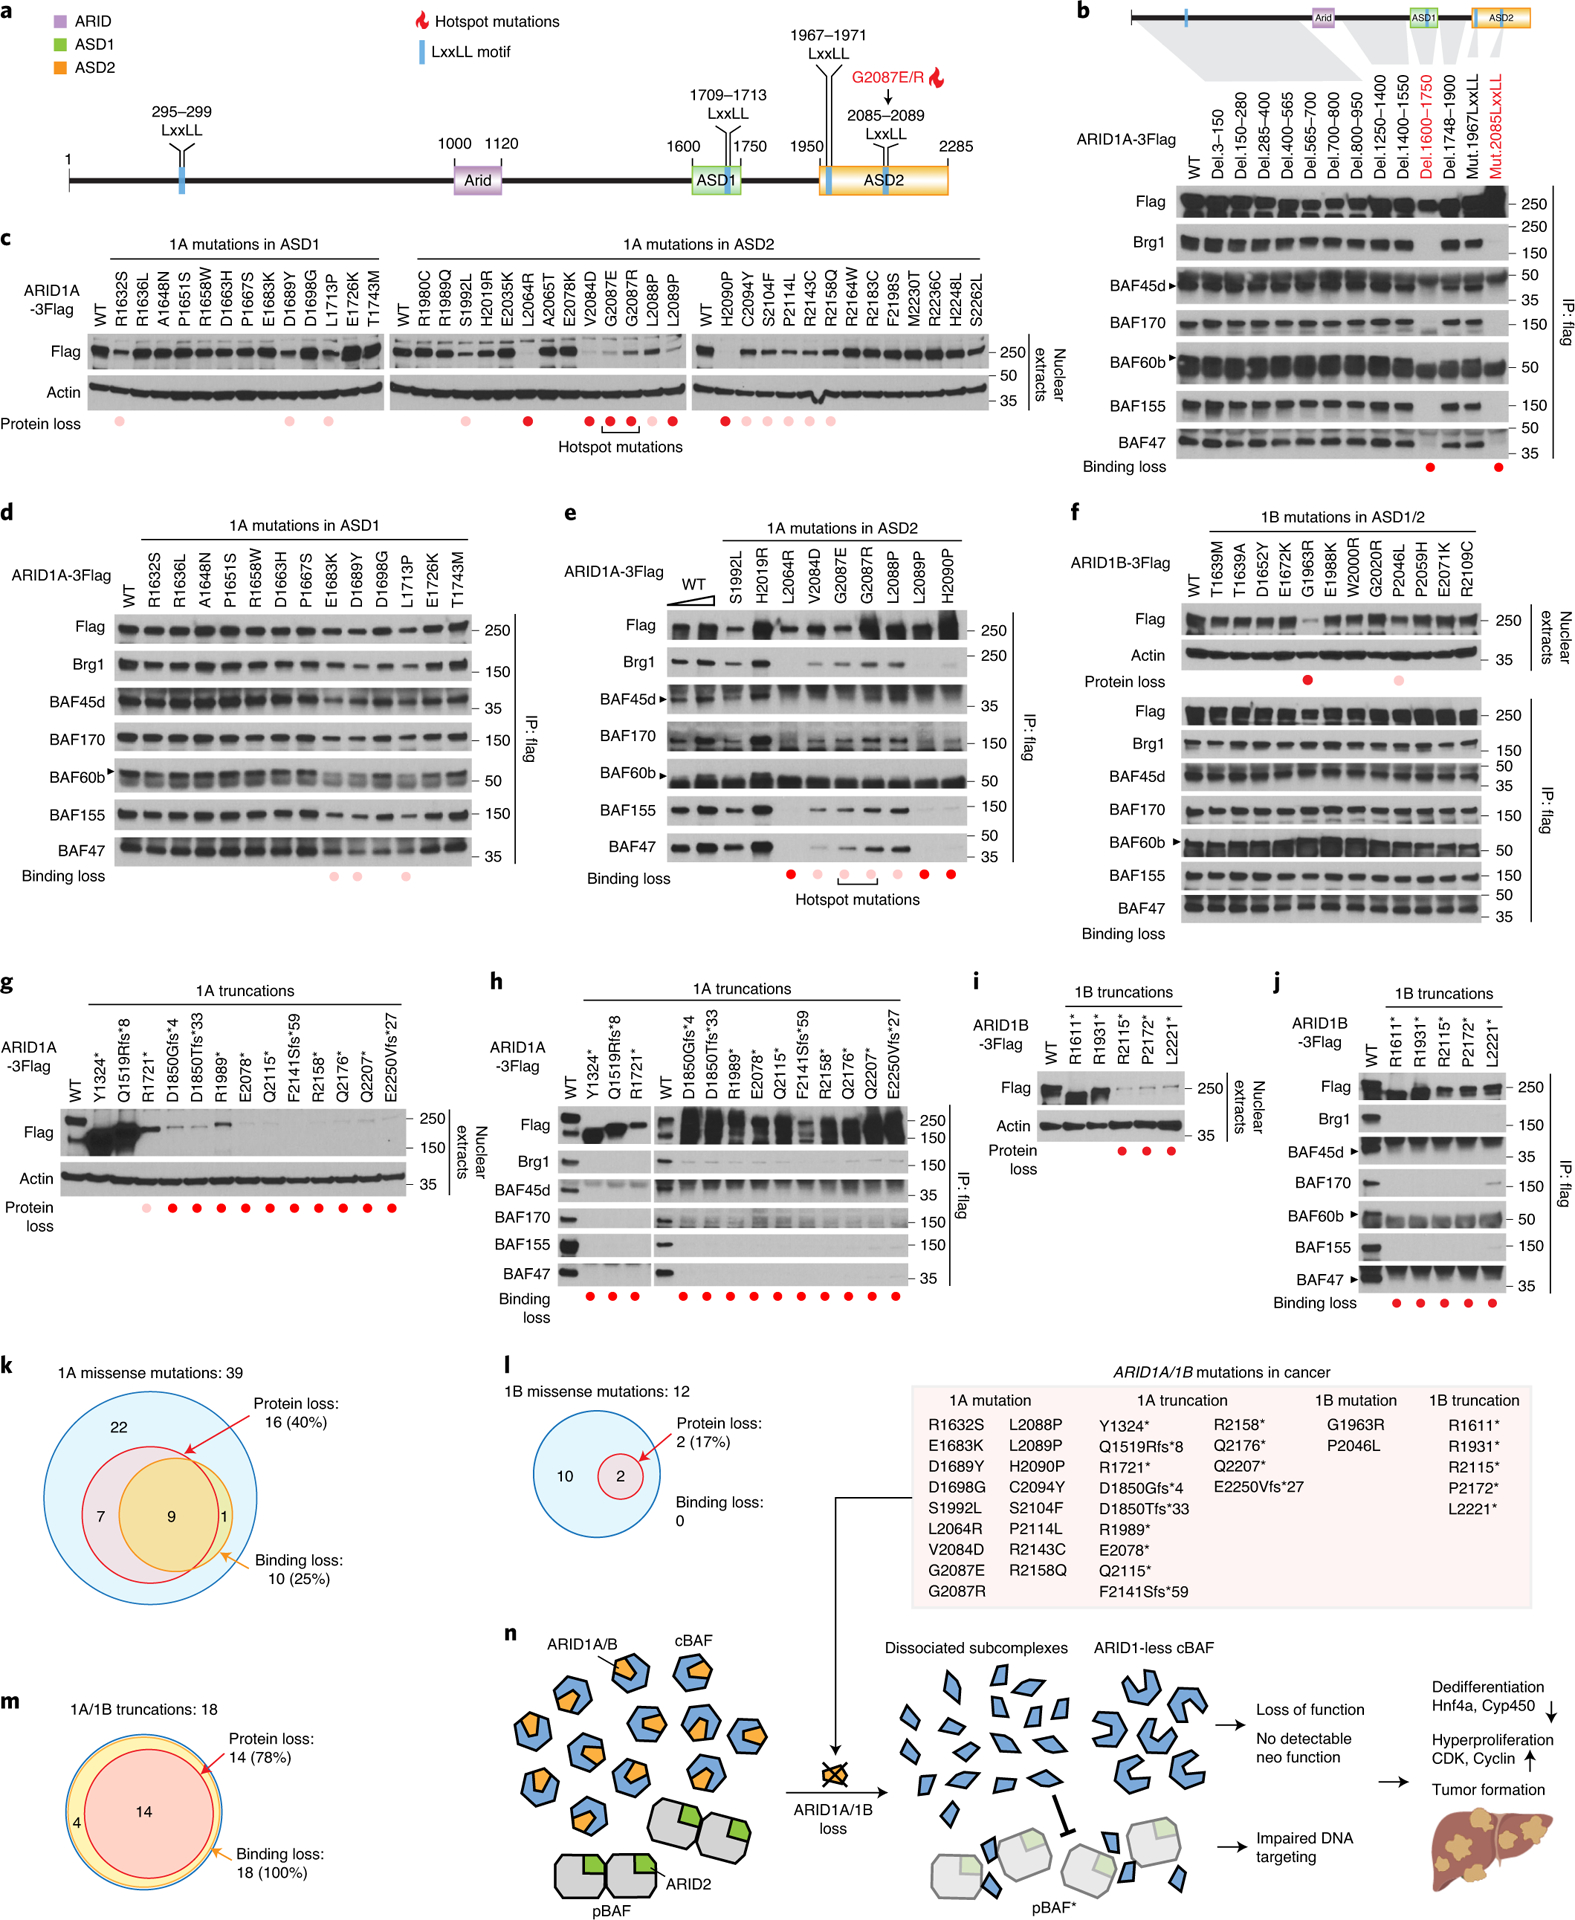
a. Schematic of ARID1A domains, conserved LxxLL motifs, and hotspot mutation location.
b. IP experiments for mapping the domains/residues responsible for ARID1A’s ability to scaffold.
c. Western blot showing the influence of ARID1A missense mutations on protein stability.
d. IP experiments showing the influence of ARID1A missense mutations within ASD1 and
e. ASD2 (selected mutations shown here, see Extended Data Fig. 5d for all analyzed mutations) on the physical interactions with BAF subunits.
f. Western blot and IP showing the influence of ARID1B missense mutations on protein stability and interactions with other BAF subunits.
g. Western blot showing the influence of ARID1A truncations on protein stability.
h. IP experiments showing the influence of ARID1A truncations on interactions with BAF subunits. Protein expression of ARID1A truncations was titrated to WT levels.
i. Western blot showing the influence of ARID1B truncations on protein stability.
j. IP experiments showing the influence of ARID1B truncations on the interactions with BAF subunits. Protein expression of ARID1B truncations was titrated to WT levels.
k. Summary of the influence of missense mutations on ARID1A stability and scaffolding
l. Summary of the influence of missense mutations on ARID1B stability and scaffolding.
m. Summary of the influence of truncations on ARID1A/1B stability and scaffolding.
n. Model for how residual cBAF subcomplexes impair pBAF function to promote cancer. Model figure showing intact cBAF complexes on the left with ARID1 proteins (yellow), cBAF components (blue), ARID2 (green), and pBAF components (grey). ARID1A and ARID1B missense mutations and truncations in cancer that lead to loss-of-function are listed. ARID1-less cBAF does not bear ectopic chromatin remodeling activities. We propose a model where dissociated subcomplexes from cBAF disrupt pBAF higher order assembly and activities. Loss of SWI/SNF homeostasis leads to rapid dedifferentiation, hyperproliferation, and carcinogenesis.
ARID1A and ARID1B mutations are prevalent in cancer and syndromic disorders3, 13, 37–41, but most have not been studied. Assessing their impact could reveal protein function, distinguish driver from passenger events, and guide clinical decisions. We assessed mutations within ASD1/2 since they would be more likely to impair cBAF scaffolding. Indeed, one ARID1A hotspot mutation (G2087E/R) is within the second LxxLL motif in ASD2 (Fig. 8a). Surprisingly, more than 40% (16/39) of ARID1A ASD1 and ASD2 missense mutations with high allele frequency showed decreased protein levels, especially those around the second LxxLL motif in ASD2 (Fig. 8c). 25% (9/39) of analyzed missense mutations showed reduced binding to BAF subunits (Fig. 8d and Extended Data Fig. 5d). Importantly, titrating mutant protein expression up to WT levels could not rescue the scaffolding defects (Fig. 8e). For ARID1B, two out of 12 missense mutations examined led to protein loss without dramatic influences on scaffolding (Fig. 8f). Moreover, small C-terminal truncations as short as 35 and 15 residues for ARID1A (Fig. 8g,h) and ARID1B (Fig. 8i,j), respectively, could lead to dramatic loss of protein and scaffolding. This is consistent with the fact that the ASD2 domains of ARID1 proteins are conserved through the last residues (Extended Data Fig. 5a). Similar consequences of two ARID1A mutations G2087R and Y2254* were also observed previously9. Furthermore, protein loss associated with ARID1A hotspot mutations and truncations could also be observed in H2.35 liver cells (Extended Data Fig. 5e,f), demonstrating similar effects in different contexts. The consequences of 69 ARID1 mutations are summarized in Fig. 8k–m.
DISCUSSION
Dual ARID1A/1B deletion in animal models and biochemical systems allowed us to elucidate the biology of cBAF before and after complex dissociation. ARID1A/ARID1B deletion in mice led to rapid onset of cancer through catastrophic dedifferentiation. This could explain why gastric, bladder, and endometrial cancers often harbor simultaneous mutations in both components. Dual deletion of ARID1s led to the splitting of cBAF into residual subcomplexes rather than loss of individual subunits, confirming important scaffolding roles for ARID1 proteins carried out by conserved ASD domains. Missense mutations centered at the second LxxLL motif within ASD2 are more likely to abolish scaffolding, highlighting the importance of this motif. Due to ASD2 conservation, even short C-terminal nonsense or frameshift mutations are likely to destroy the normal function of ARID1s. These results explain a significant subset of ARID1A mutations in cancer (Fig. 8n).
The absence of scaffolding in the ARID-less context allowed us to examine the neo-functionality of residual complexes. Unexpectedly, loss of ARID1A/1B proteins influenced both cBAF and pBAF complexes. We propose one possible model whereby ARID1 loss leads to redistribution of cBAF residual complexes that in turn disrupt pBAF (Fig. 8n). The loss of ARID1 proteins might result in structurally exposed surfaces in residual cBAF subcomplexes that non-specifically bind to pBAF, which could disrupt pBAF oligomerization. Oligomerization may be functionally important for chromatin remodeling, but this hypothesis will require additional exploration. As a precedent, oligomerization is functionally important for other epigenetic proteins such as DNMT3A42, 43 and TTF144. Moreover, ChIP-seq showed that pBAF in ARID1-less cells had very limited targeting abilities, a likely consequence of impaired pBAF assembly. Our result suggests a delicate balance between the three major SWI/SNF complexes.
Our findings do not refute the discovery that ARID1B inhibition is synthetic lethal in some ARID1A mutant cell lines, however, context dependency might explain synthetic lethality in some cell lines and rapid carcinogenesis in other settings. ARID1 proteins are required for many gene expression programs, some of which are essential for certain cell types. However, an intrinsically increased proliferation rate may be able to overcome the negative consequences of ARID1-loss in some settings, ultimately leading to cancer progression. Besides ARID1A and ARID1B, co-mutations in other SWI/SNF components are common in human cancers (Supplementary Table 2). This suggests synergistic effects, but how these combinations influence cancer needs further investigation. Our study explores the consequences of ARID1A and ARID1B loss from the organismal to the molecular levels, and reveals new insights into the impact of dual paralog loss.
METHODS
Antibodies
ARID1A (Sigma-Aldrich #HPA005456, western blot and IHC), ARID1A (Santa Cruz #sc-32761, western blot), ARID1B (Abcam #AB57461, western blot and IHC), ARID2 (Abiocode #R2380–1, western blot), Brg1 (Santa Cruz #sc-10768, western blot), BAF170 (Santa Cruz #sc-17838, western blot), BAF155 (Santa Cruz #sc-9746, western blot), BAF60b (Santa Cruz #sc-101162, western blot), BAF57 (Bethyl #A300–810A, western blot), BAF53 (Santa Cruz #sc-137063, western blot), BAF47 (Santa Cruz #sc-166165, western blot), BAF47 (CST #91735, western blot), BAF45d (Santa Cruz #sc-101106, western blot), Ki-67 (Abcam #AB15580, IHC), HNF4A (CST #3113, IHC), CK19 (Abcam #AB15463, IHC), EpCAM (CST #14452, IHC), Flag (CST #2368, western blot), Ty1 (Diagenode #C15200054, western blot and ChIP).
Cell culture
The H2.35 cell line was cultured in DMEM with 4% (vol/vol) FBS, 1x Pen/Strep and 200 nM Dexamethasone. The MFE296 cell line was cultured in EMEM (ATCC 30–2003) with 10% (vol/vol) FBS, 1x Pen/Strep and 0.1% (vol/vol) insulin solution (Sigma-Aldrich #I9278). The HEK-293T cell line was cultured in DMEM with 10% (vol/vol) FBS and 1x Pen/Strep. All cells were cultured at 37°C in a 5% CO2 incubator.
cDNAs, plasmids, and protein expression
The cDNAs used in this study are human ARID1A, ARID1B, ARID2, BRD9, mouse Brg1 and BAF45d. For protein expression, BAF45d was cloned into the lentiviral pRRL vector and other genes were cloned into the Sleeping Beauty transposon pT3 vector. The indicated tags were fused to the C-termini of the proteins. ARID1A and ARID1B mutations/truncations were generated using either the Q5 Site-Directed Mutagenesis kit (NEB) or the overlap PCR method. For stable expression of ARID1A and ARID1B constructs in HEK293T, pT3 plasmids were co-transfected with a transposase expressing plasmid pCMV-SB100 at ratio (ng/ng) of 10:1 using Lipofectamine 3000. For stable expression of ARID1A, ARID1B, ARID2, Brg1 and BRD9 in H2.35 cells, pT3 and pCMV-SB100 were co-transfected with an empty pLvx vector which harbors a puromycin resistant gene using Lipofectamine 3000. Positively transfected cells were selected with 2μg/ml puromycin for 3 days. For stable expression of BAF45d in H2.35 cells, lentivirus was produced, and infected cells were selected with 2μg/ml puromycin for 3 days.
Nuclear extract preparation and western blot analysis
Cells were trypsinized or scraped from dishes, washed once with PBS, and harvested by centrifugation at 1000g for 5 min. Pellets were resuspended in buffer A (20mM HEPES, 10mM KCl, 1.5mM MgCl2, 1mM EDTA, 1mM EGTA, 0.02% CHAPS, pH7.5) supplemented with final 0.3% CHAPS, 1mM DTT and protease inhibitor cocktail (Life Technologies #A32963) and lysed on ice for 30 min. Cell lysates were centrifuged at 20,000g for 10min at 4°C and pellets were resuspended in Nuclear Extraction Buffer (buffer A supplemented with 450mM NaCl and 20% glycerol), followed by incubation and rotation for 30min at 4°C. After centrifugation at 20,000g for 10min, the resulting supernatant contained the nuclear extract. For western blot analysis, the extracts were normalized by total protein using BCA assay (Pierce), boiled with 6x protein loading buffer, resolved with SDS-PAGE, and analyzed by western blot.
MFE296 cell growth measurement, colony formation assay, and senescence staining
MFE-296 cells were seeded at 0.4 million cells per well in a 6-well plate and cultured overnight. The indicated pT3 expressing constructs fused with a T2A linker and puromycin-resistant gene were co-transfected with pCMV-SB100 at ratio (ng/ng) of 10:1 using Lipofectamine 3000. A final concentration of 2μg/ml puromycin was added to each well one day after transfection and selected for 4 days. Cells were then either stained for senescence-associated β-galactosidase activity (Millipore QIA117) or trypsinized and re-seeded for cell growth and colony formation assays. For cell growth, live cells determined by Trypan blue staining were seeded in 96-well plate at 200 cells per well with 4 replicates. Cell growth was measured using Cell Titer Glo kit (Promega) at the indicated time points. For colony formation assay, live cells were seeded in 6-well plate at 10,000 cells per well with 3 replicates. Eight days after seeding, colonies were fixed and stained using Crystal Violet solution (Sigma-Aldrich HT90132). 2μg/ml puromycin was present in the medium for cell growth and colony formation assays to maintain continuous expression of exogenous proteins.
Generation of KO and ARID1-less H2.35 cell lines
The guide DNA sequences used were TTAGTCCCACCATACGGCTG for ARID1A knockout and ATCCGGGTCTACAAGCAGCC for ARID1B knockout in mouse H2.35 cells. Guide DNAs were cloned into pX459 and transfected into H2.35 cells using Lipofectamine 3000. One day after transfection, 2μg/ml puromycin was used to select for 4 days. The surviving cells were trypsinized to single cell suspension and plated in 10-cm dishes. After one week, single clones were picked and expanded in 12-well plates. Western blotting on cell lysates was used to examine ARID1A or ARID1B loss. To generate the ARID1A Dox-inducible knockdown and ARID1B knockout H2.35 cell line, the shRNA sequence CCTAGGCAGCCTAACTATAATTACTAGTATTATAGTTAGGCTGCCTAGG was cloned into the EZ-Tet-pLKO-Hygro vector and delivered into ARID1B knockout H2.35 cells using lentivirus. 800μg/ml hygromycin was added to the medium to select stably transfected cells. To knock down ARID1A, 1μg/ml Dox was added to the medium for 3–4 days. The scramble shRNA sequence CCTAAGGTTAAGTCGCCCTCGTACTAGTCGAGGGCGACTTAACCTTAGG was cloned into EZ-Tet-pLKO-Hygro vector, and lentivirally transfected into WT H2.35 cells as a control.
Gel filtration and S-column chromatography
For gel filtration analysis, the nuclear extracts were dialyzed in Gel Filtration Buffer (Buffer A supplemented with 200mM NaCl and 1mM DTT), concentrated to 0.5ml using the Amicon ultra centrifugal filter, and loaded onto a Superose-6 10/300 GL column (GE Healthcare Life Sciences) pre-equilibrated with Gel Filtration Buffer. Proteins were eluted at a flow rate of 0.5ml/min and collected at 0.33ml per fraction. For cation exchange chromatography, the nuclear extracts were dialyzed to S-Buffer-1 (Buffer A supplemented with 40mM NaCl and 1mM DTT) and loaded onto two tandem connected 1ml HiTrap SP columns (GE Healthcare Life Sciences). The columns were washed with 5 CV of S-Buffer-1 and proteins were eluted with a linear gradient of 10 CV from 0% to 60% S-Buffer-2 (Buffer A supplemented with 1M NaCl and 1mM DTT). Proteins were collected at 1ml per fraction.
Immunoprecipitation
To examine the interactions between ARID1 proteins and other SWI/SNF subunits, ARID1 constructs and pCMV-SB100 were co-transfected into HEK-293T cells grown in 6-well plates at 80% confluence. One day after transfection, the cells were trypsinized and seeded in 10-cm dishes. Cells were harvested when reaching 80% confluence and nuclear extracts were prepared and used for western blot and IP. Anti-Flag M2 agarose beads (Sigma-Aldrich #A2220, 25μl of the slurry beads per sample) were washed with Wash Buffer (Buffer A supplemented with 200mM NaCl), added to the extracts and rotated overnight at 4°C. After incubation, the beads were washed with Wash Buffer 3 times and directly boiled with 1x protein loading buffer for 10 min at 95°C. The supernatants of the boiled samples were resolved by SDS-PAGE and analyzed by western blot.
Mass spectrometry
WT and ARID1-less H2.35 cells expressing ARID2–3xFlag were generated by Lipofectamine 3000 based transfection as described in the “protein expression” section. Cells were expanded in 15-cm dishes and 1ug/ml Dox was added four days before harvest. 100μl anti-Flag M2 agarose beads were used to pull down ARID2–3xFlag from 5ml nuclear extracts from each sample as described above. Proteins were eluted using 100mM glycine (pH 3.0), neutralized with Wash Buffer and concentrated using the Amicon ultra centrifugal filter. Eluted samples were boiled and loaded onto a Nupage 4–12% Bis-Tris gel. Proteins ran into the gel within 1cm. The gel was stained by Coomassie Blue and the protein-containing region was cut for mass spectrometry analysis in the UTSW proteomics core.
Mouse Strains, Breeding, and Analysis
All mice were handled in accordance with the guidelines of the Institutional Animal Care and Use Committee at University of Texas Southwestern Medical Center. All experiments were done in an age and sex controlled fashion unless otherwise noted in the figure legends. All Arid1af/f; Arid1bf/f mice (with or without Alb-Cre or UBC-CreER) were on the C57BL/6 strain background. For UBC-CreER based DKO models, one dose of 12.5mg/kg tamoxifen was intraperitoneally injected into UBC-CreER; Arid1af/f; Arid1bf/f and control Arid1af/f; Arid1bf/f adult mice at 5 weeks of age. For transplantation models, 2 million WT H2.35 cells (carrying a scrambled Dox-inducible shRNA) or ARID1-less H2.35 cells (ARID1B KO H2.35 cells carrying a Dox-inducible shRNA targeting ARID1A) suspended in 200μl DMEM were injected into the tail veins of NSG mice at 3 months of age. Dox (1g/L) in water was given to mice 3 days before injection until sacrificed (7 weeks after injection).
Liver function tests
Blood samples were taken retro-orbitally in heparinized tubes, transferred into 1.5ml tubes and centrifuged at 2000g for 15min at 4°C. The supernatant after centrifugation (plasma) were analyzed for liver function by the UTSW Metabolic Phenotyping Core.
Histology and immunohistochemistry
Tissue samples were fixed in 4% paraformaldehyde (PFA) and embedded in paraffin. Immunohistochemistry was performed as previously described45. H&E staining was performed by the UTSW Histology Core Facility.
RNA Extraction and qRT-PCR
Arid1af/f and Arid1bf/f mice were injected with AAV-TBG-Cre (5×10¹⁰ genome copies per mouse) from retro-orbital plexus at 6 months of age and liver samples were collected 2 weeks after injection. Liver total RNA was isolated using TRIzol reagent (Invitrogen, #15596018) followed by purification using RNeasy Mini kit (Qiagen). For qRT-PCR, cDNA synthesis was performed with 1μg of total RNA using iScript RT Supermix (BioRad, #1708840) in a total of 20μl. To measure mRNA expression via qRT-PCR, each cDNA sample (20μl) was diluted to 200μl and 5μl was combined with primers and iTaq Universal SYBR green Supermix (BioRad #172–5121) in a total of 12μl. mRNA levels were normalized to β-Actin gene expression. qRT-PCR primers were used as previously described15.
RNA-seq
Liver total RNA was extracted from BKO, DKO and corresponding control mice using TRIzol reagent followed by purification using RNeasy Mini kit (Qiagen). RNA-seq libraries were prepared with the Ovation RNASeq Systems 1–16 (Nugen). 75bp single-end sequencing (DKO and control) and 150 bp double-end sequencing (BKO and control) were performed using an Illumina NextSeq500 system at the UTSW Children’s Research Institute Sequencing Facility. AKO and corresponding control RNA-seq were re-analyzed using data from Sun et al., 2016.
ChIP-seq
WT H2.35 cells expressing a Dox-inducible scramble shRNA and the indicated 3xTy1-tagged proteins were used for control ChIP. ARID1B knockout H2.35 cells expressing a Dox-inducible ARID1A shRNA and the indicated 3xTy1-tagged proteins were used for ARID1-less ChIP. Expression of exogenous proteins was titrated by transfecting different amount of pT3 plasmids. Transfections that resulted in similar expression levels as their endogenous counterparts were used. For ChIP, cells were induced with 1μg/ml Dox for 3 days and crosslinked by addition of 2mM disuccinimidyl glutarate (0.5M DMSO stock) for 45 min, followed by addition of 1% formaldehyde (37% stock) for 10 min. Crosslinking was quenched by addition of final 125mM glycine solution (2.5M stock) to the medium for 5 min. The cells were washed with PBS twice, scraped and collected by centrifugation. Cell pellets were resuspended in RIPA-0 (10mM Tris-HCl, 1mM EDTA, 0.1% sodium deoxycholate, 0.1% SDS, 1% Triton X-100, 0.25% sarkosyl, pH8.0) and sonicated until DNA fragmented to an average size of 200 bp. The sonicated lysates were cleared by centrifugation at 20,000g for 10 min and supplemented with NaCl to final concentration of 0.3M. The lysates were then incubated with 5μg Ty1 antibody overnight followed by incubation with 25μl protein A/G Dynabeads for another 3 hours with rotation. After incubation, the beads were washed with 1ml following buffers, twice with RIPA-0, twice with RIPA-0.3 (RIPA-0 supplemented with 0.3M NaCl), twice with LiCl buffer (10mM Tris-HCl, 1mM EDTA, 0.5% sodium deoxycholate, 0.5% NP-40, 250mM LiCl, pH 8.0), and twice with TE buffer (10mM Tris-HCl, 1mM EDTA, pH 8.0). The DNA was eluted with 150μl SDS elution buffer (1% SDS, 10mM EDTA, 50mM Tris-HCl, pH 8.0) followed by incubation at 65°C overnight. The eluted DNA was treated with 2μl RNase A (0.5μg/μl) for 30min at 37 °C followed by 2μl Protease K (20mg/ml) for 2 hours at 37°C, and purified using the MinElute PCR purification kit (Qiagen). The purified DNA was used for library preparation using the NEBNext ChIP-Seq Library Prep Master Mix Set for Illumina Kit. Library quality was assessed using the TapeStation system (Agilent). 75bp single-end sequencing was performed using an Illumina NextSeq500 system at UTSW Children’s Research Institute Sequencing Core.
Bioinformatics analyses
RNA-Seq Analysis
Single-end RNA-seq reads were firstly filtered based on quality. In brief, reads with phred quality scores less than 20 and read length less than 35bp after trimming were removed from further analysis using trimgalore version 0.4.1. Quality-filtered reads were then mapped to the mouse reference genome GRCm38 (mm10) using the HISAT (version 2.1.0) aligner with default settings. After mapping, rRNA reads were filtered from resulting .bam files according to their overlap with the coordinates of rRNA gene list obtained from UCSC genome browser site. Mapped reads were counted using featureCounts (version 1.6.2) program to obtain raw read counts for each gene. Differential gene expression analysis was performed using the R package DEseq (version 1.36.0). Genes with absolute log2 Fold change greater than 1.0 and an FDR (adjusted p-value) <= 0.05 were designated as differentially expressed genes between sample group comparisons.
Gene Set Enrichment Analysis
To perform GSEA analysis using RNA-seq data, raw read counts from each sample were converted to cpm value (count per million) using the cpm function within edgeR (version 3.22.5). We then create input files for group comparisons according to GSEA user manual (http://software.broadinstitute.org/gsea/doc/GSEAUserGuideFrame.html). GSEA was then performed against hallmark gene sets using default parameters.
ChIP-Seq Analysis
Single-end sequencing reads were mapped to the mouse reference genome GRCm38 (mm10) using bowtie2 aligner (version 2.3.4.3) with default parameters. Peak calling was performed using findpeaks command within HOMER software package version 4.9 with parameter – style histone. Peaks were called when enriched > 2 fold over input controls and > 4 fold over local tag counts, with FDR < 10e−5. ChIP-seq peaks within a 1000 bp range were stitched together to form ChIP-seq regions. To restrict analysis on stringent peaks, peaks were further filtered and peaks with the read tag numbers > ~20 within peaks were kept for downstream analysis. annotatePeaks.pl command was used to associate peaks to their nearest genes. To find ARID1A, ARID2 and BRD9 shared, ARID1A only, ARID2 only and BRD9 only peaks in WT samples, mergePeaks command was used to intersect control ARID1A, ARID2, BRD9 peaks with given size and overlap distance 1bp. Heatmap of ChIP-seq signal over input sample were plotted using ngs.plot (version 2.63) program.
Statistics and reproducibility
The data in most panels reflect multiple experiments performed on different days using mice derived from different litters. Variation is always indicated using standard deviation presented as mean ± SD. Two-tailed unpaired Student’s t-tests with Welch’s correction (GraphPad 7.0) were used to test the significance of differences between two groups unless otherwise specified. In all experiments, no mice were excluded from analysis after the experiment was initiated. Image analysis for the quantification was blinded. For histopathological micrographic images, at least five mice were subjected to analysis with similar results. For RNA-seq, four mice were used for each group. For ChIP, at least two independent experiments were performed with similar results. All the western blot experiments were either using at least 2 biological replicates or performed at least twice independently with similar results.
Reporting Summary
Further information on research design is available in the Nature Research Reporting Summary linked to this article.
Extended Data
Extended Data Fig. 1. Loss of both ARID1A and ARID1B in the liver leads to impaired liver function.
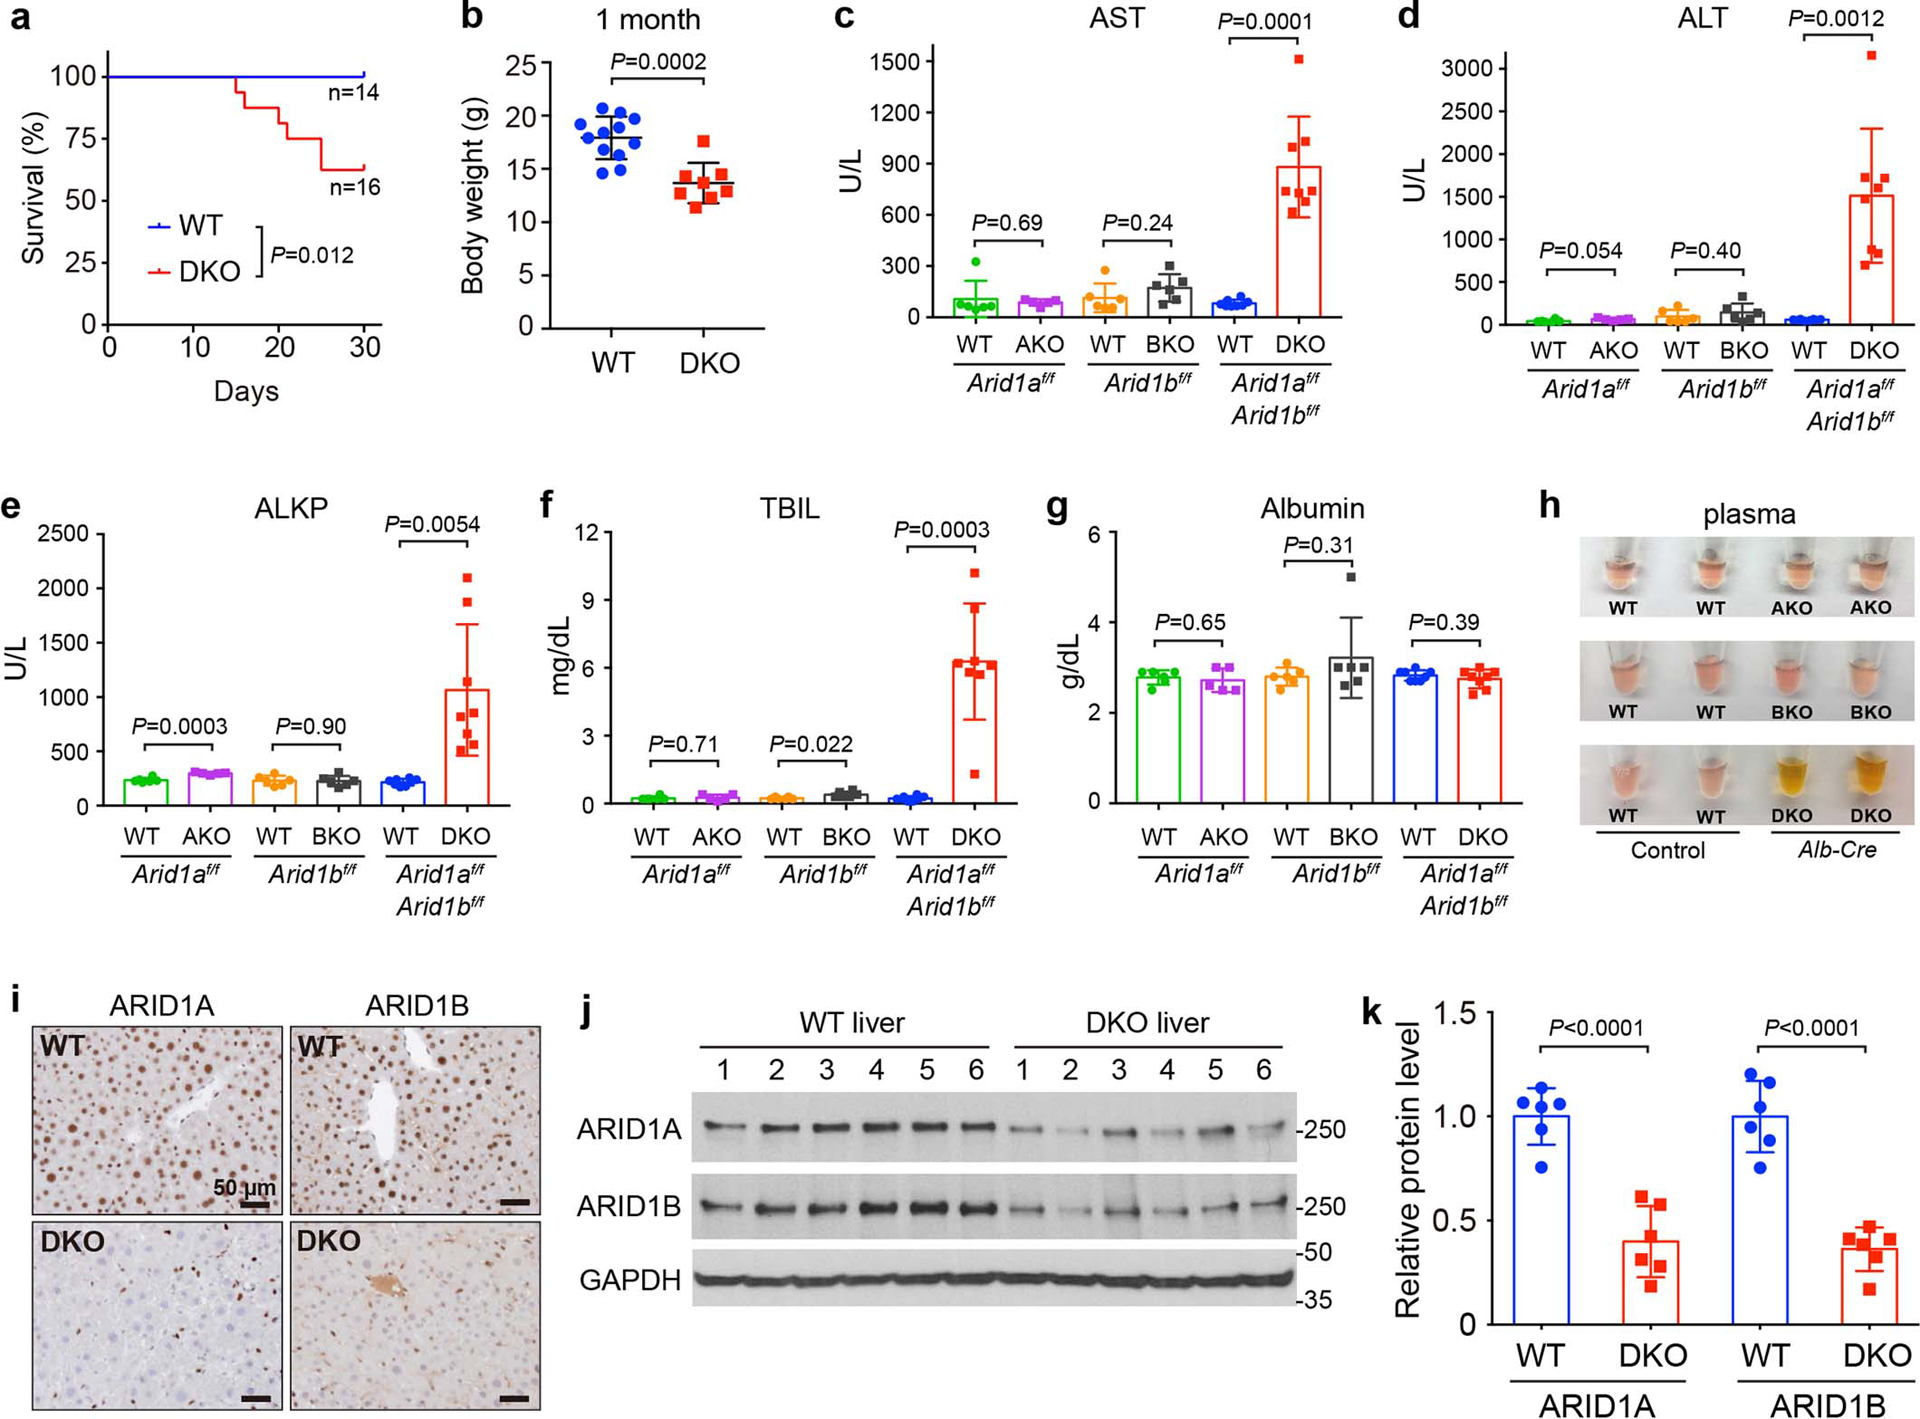
a. Kaplan-Meier survival curve of WT and DKO mice within the first month of life.
b. Body weight of WT and DKO mice at the age of 1 month (n=12 and 8 mice).
c–g. Liver function analysis using plasma (n=6 and 5 mice for the Arid1af/f group; 6 and 6 for the Arid1bf/f group; 8 and 8 for the Arid1af/f; Arid1bf/f group).
h. Gross inspection of plasma from AKO, BKO and DKO and their corresponding WT mice.
i. IHC staining of ARID1A and ARID1B on WT and DKO liver sections.
j. Western blot showing ARID1A and ARID1B protein levels in WT and DKO livers.
k. Quantification of Western blot data in j (n=6 and 6 mice for each group).
Data are presented as mean ± SD (b–g,k).
Statistical significance was determined by two-tailed unpaired Student’s t-tests with Welch’s correction (b–g,k).
Extended Data Fig. 2. AAV mediated deletion of ARID1A and ARID1B in the liver leads to organ failure.
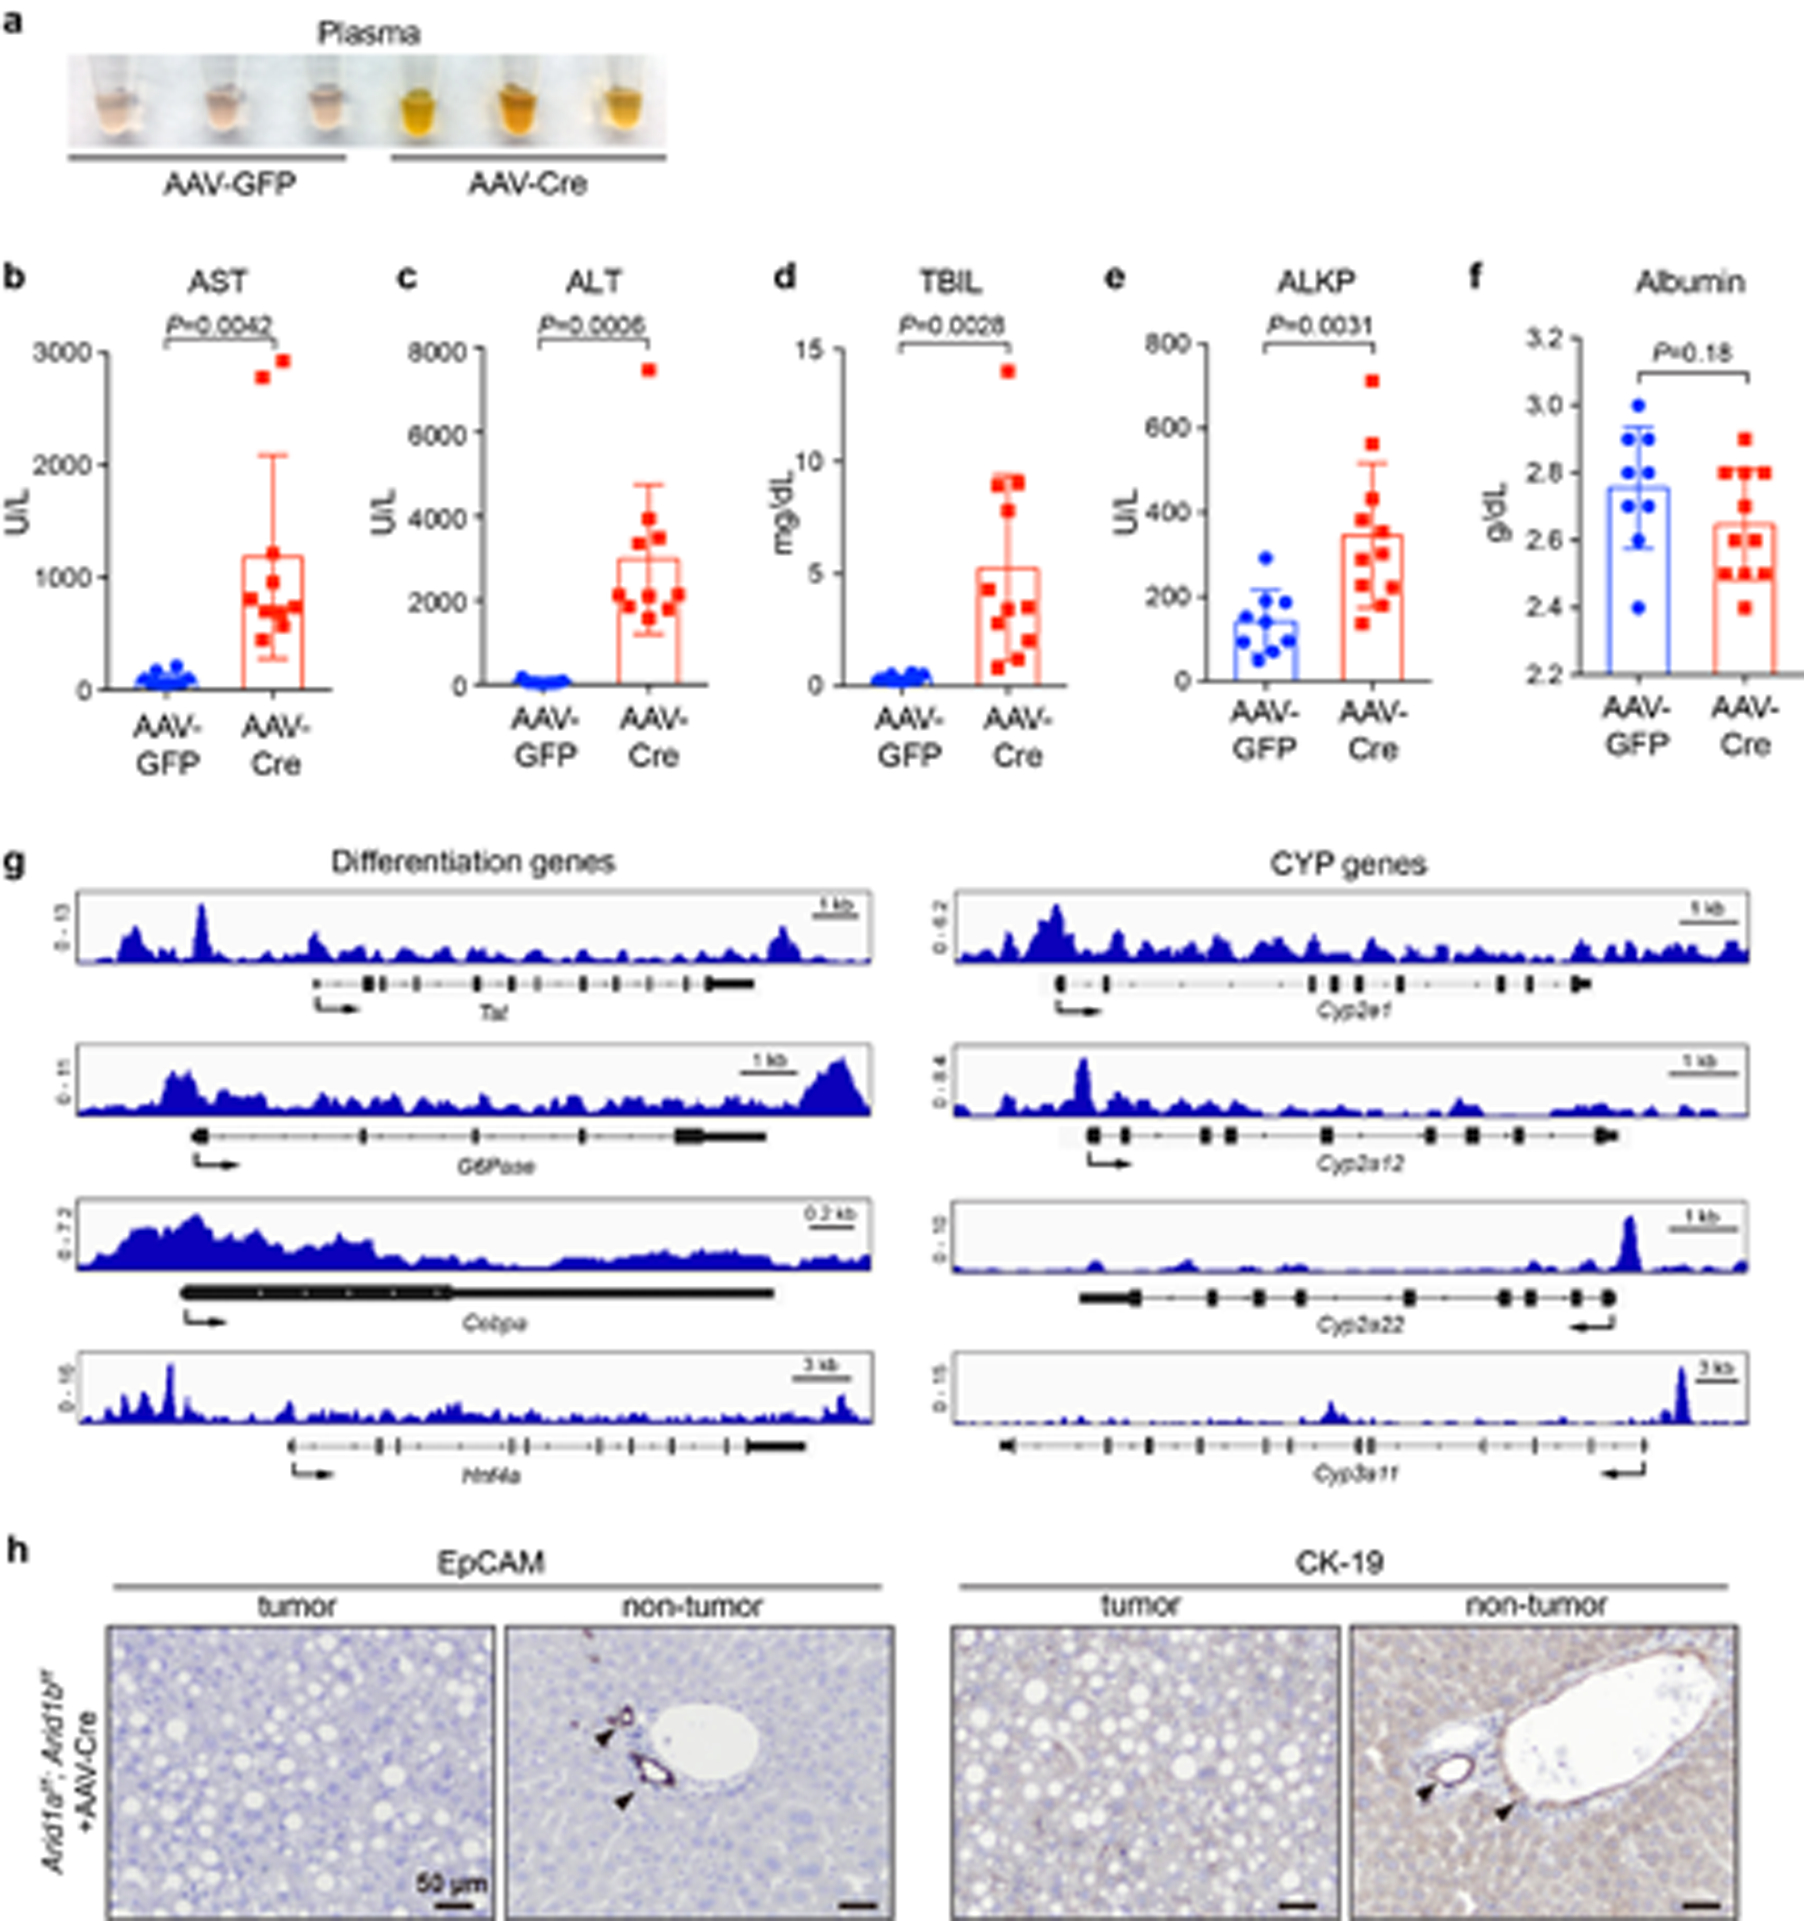
a. Gross inspection of plasma from mice injected with AAV-GFP or AAV-Cre.
b–f. Liver function tests of Arid1af/f; Arid1bf/f mice injected with AAV-GFP or AAV-Cre (n=10 and 10 mice for AST; 9 and 10 for ALT; 9 and 11 for TBIL; 10 and 11 for ALKP; 9 and 11 for Albumin. Data are presented as mean ± SD. Statistical significance was determined by two-tailed unpaired Student’s t-tests with Welch’s correction).
g. Representative genome browser tracks showing ARID1A binding to the promoter or enhancer regions of differentiation and Cytochrome P450 genes in liver.
h. IHC staining of EpCAM and CK-19 on AAV-Cre liver sections.
Extended Data Fig. 3. cBAF subunit levels showed limited to no decrease in ARID1-less cells or DKO livers.
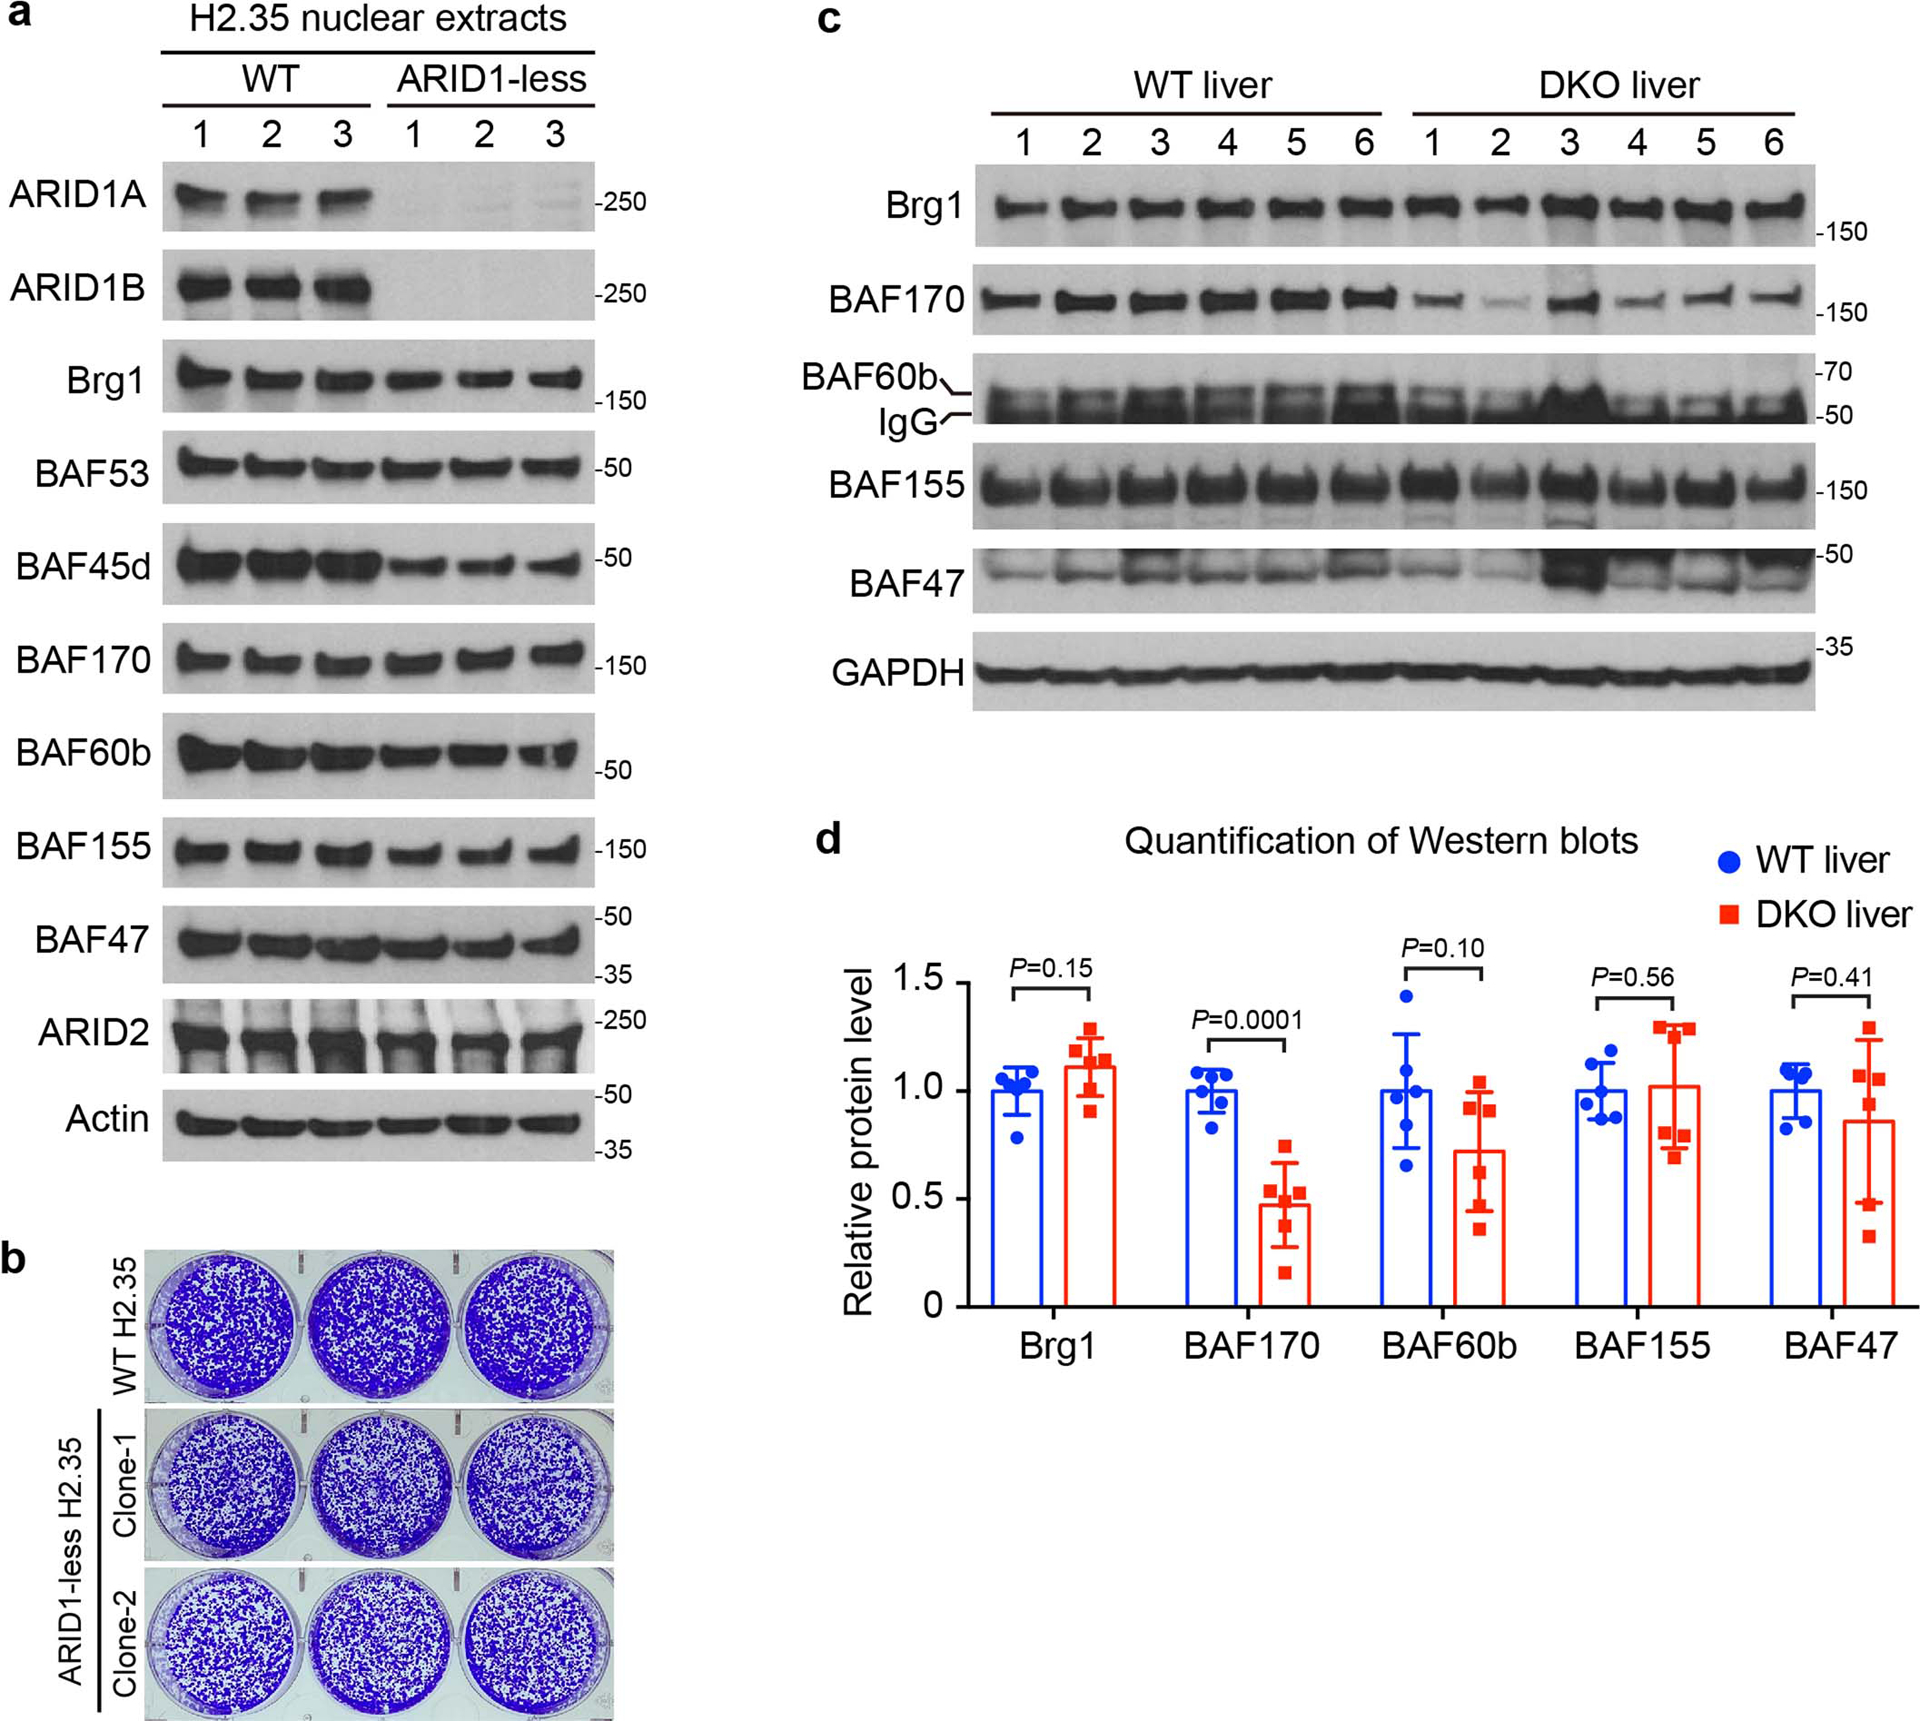
a. Western blot analysis of cBAF subunit levels in WT and ARID1-less H2.35 cells (n=3 and 3 independent clones).
b. Colony formation assay for control and ARID1-less H2.35 cells. 0.1 million H2.35 cells were seeded in each well of 6-well plate and cultured for 10 days in the presence of Dox.
c. Western blot analysis of cBAF subunit levels in WT and DKO livers (n=6 and 6 mice). Same batch of western blots/protein samples as in Extended Data Fig. 1j.
d. Quantification of western blot data in c (Data are presented as mean ± SD. Statistical significance was determined by two-tailed unpaired Student’s t-tests with Welch’s correction).
Extended Data Fig. 4. ChIP-seq analysis of SWI/SNF complexes binding to genomic DNA in control and ARID1-less H2.35 cells.
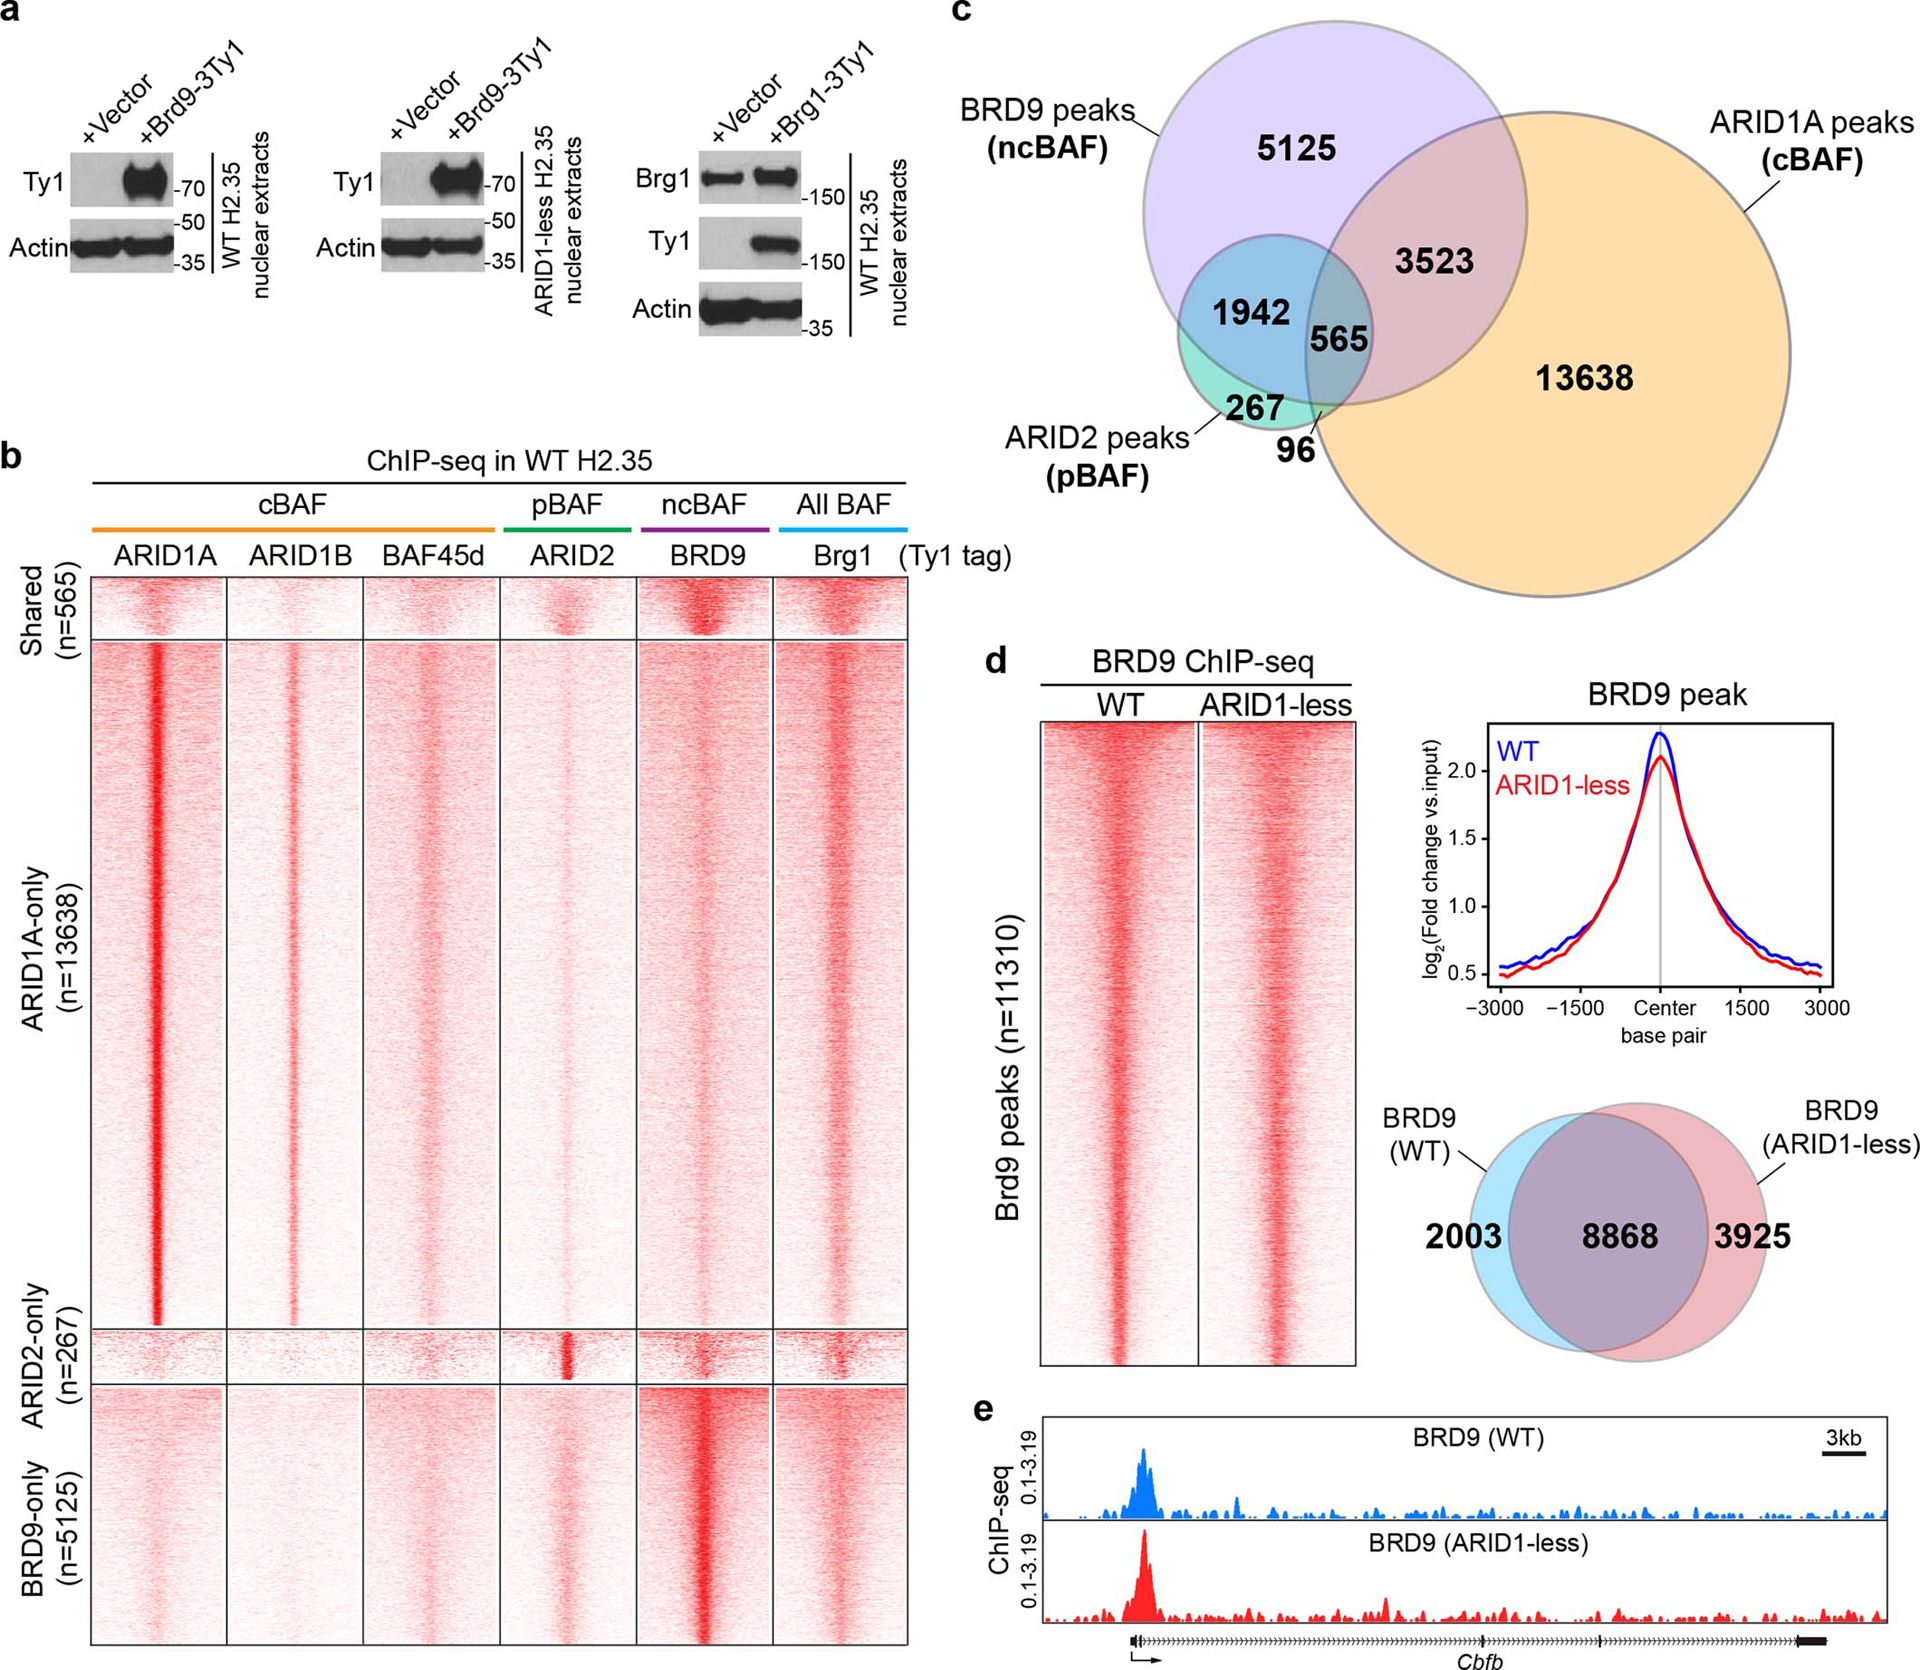
a. Expression of Ty1 tagged BRD9 and Brg1 in WT and ARID1-less H2.35 cells. BRD9 expression was only examined using the Ty1 antibody due to the lack of a commercial anti-mouse BRD9 antibody.
b. Heatmap displaying ChIP-seq peaks of intact SWI/SNF complexes in WT H2.35 cells. ARID1A, ARID1B, and BAF45d peaks were used to represent cBAF, ARID2 for pBAF, BRD9 for ncBAF, and Brg1 for all BAF complexes. 3000bp upstream and downstream of peak centers are shown in this figure (n=2 independent ChIP experiments for each protein).
c. Venn diagram showing the shared and unique binding loci among three types of BAF complexes from ChIP-seq data.
d. Comparison of BRD9 occupancies in control and ARID1-less cells. Heatmap and the corresponding averaged peak map and Venn diagram are shown (n=2 and 2 independent ChIP experiments).
e. Representative genome browser tracks showing that ncBAF binding was unaffected in ARID1-less cells (BRD9 peaks in ARID1-less cells).
Extended Data Fig. 5. Mapping of domains, residues, and mutations responsible for ARID1A’s scaffolding role.
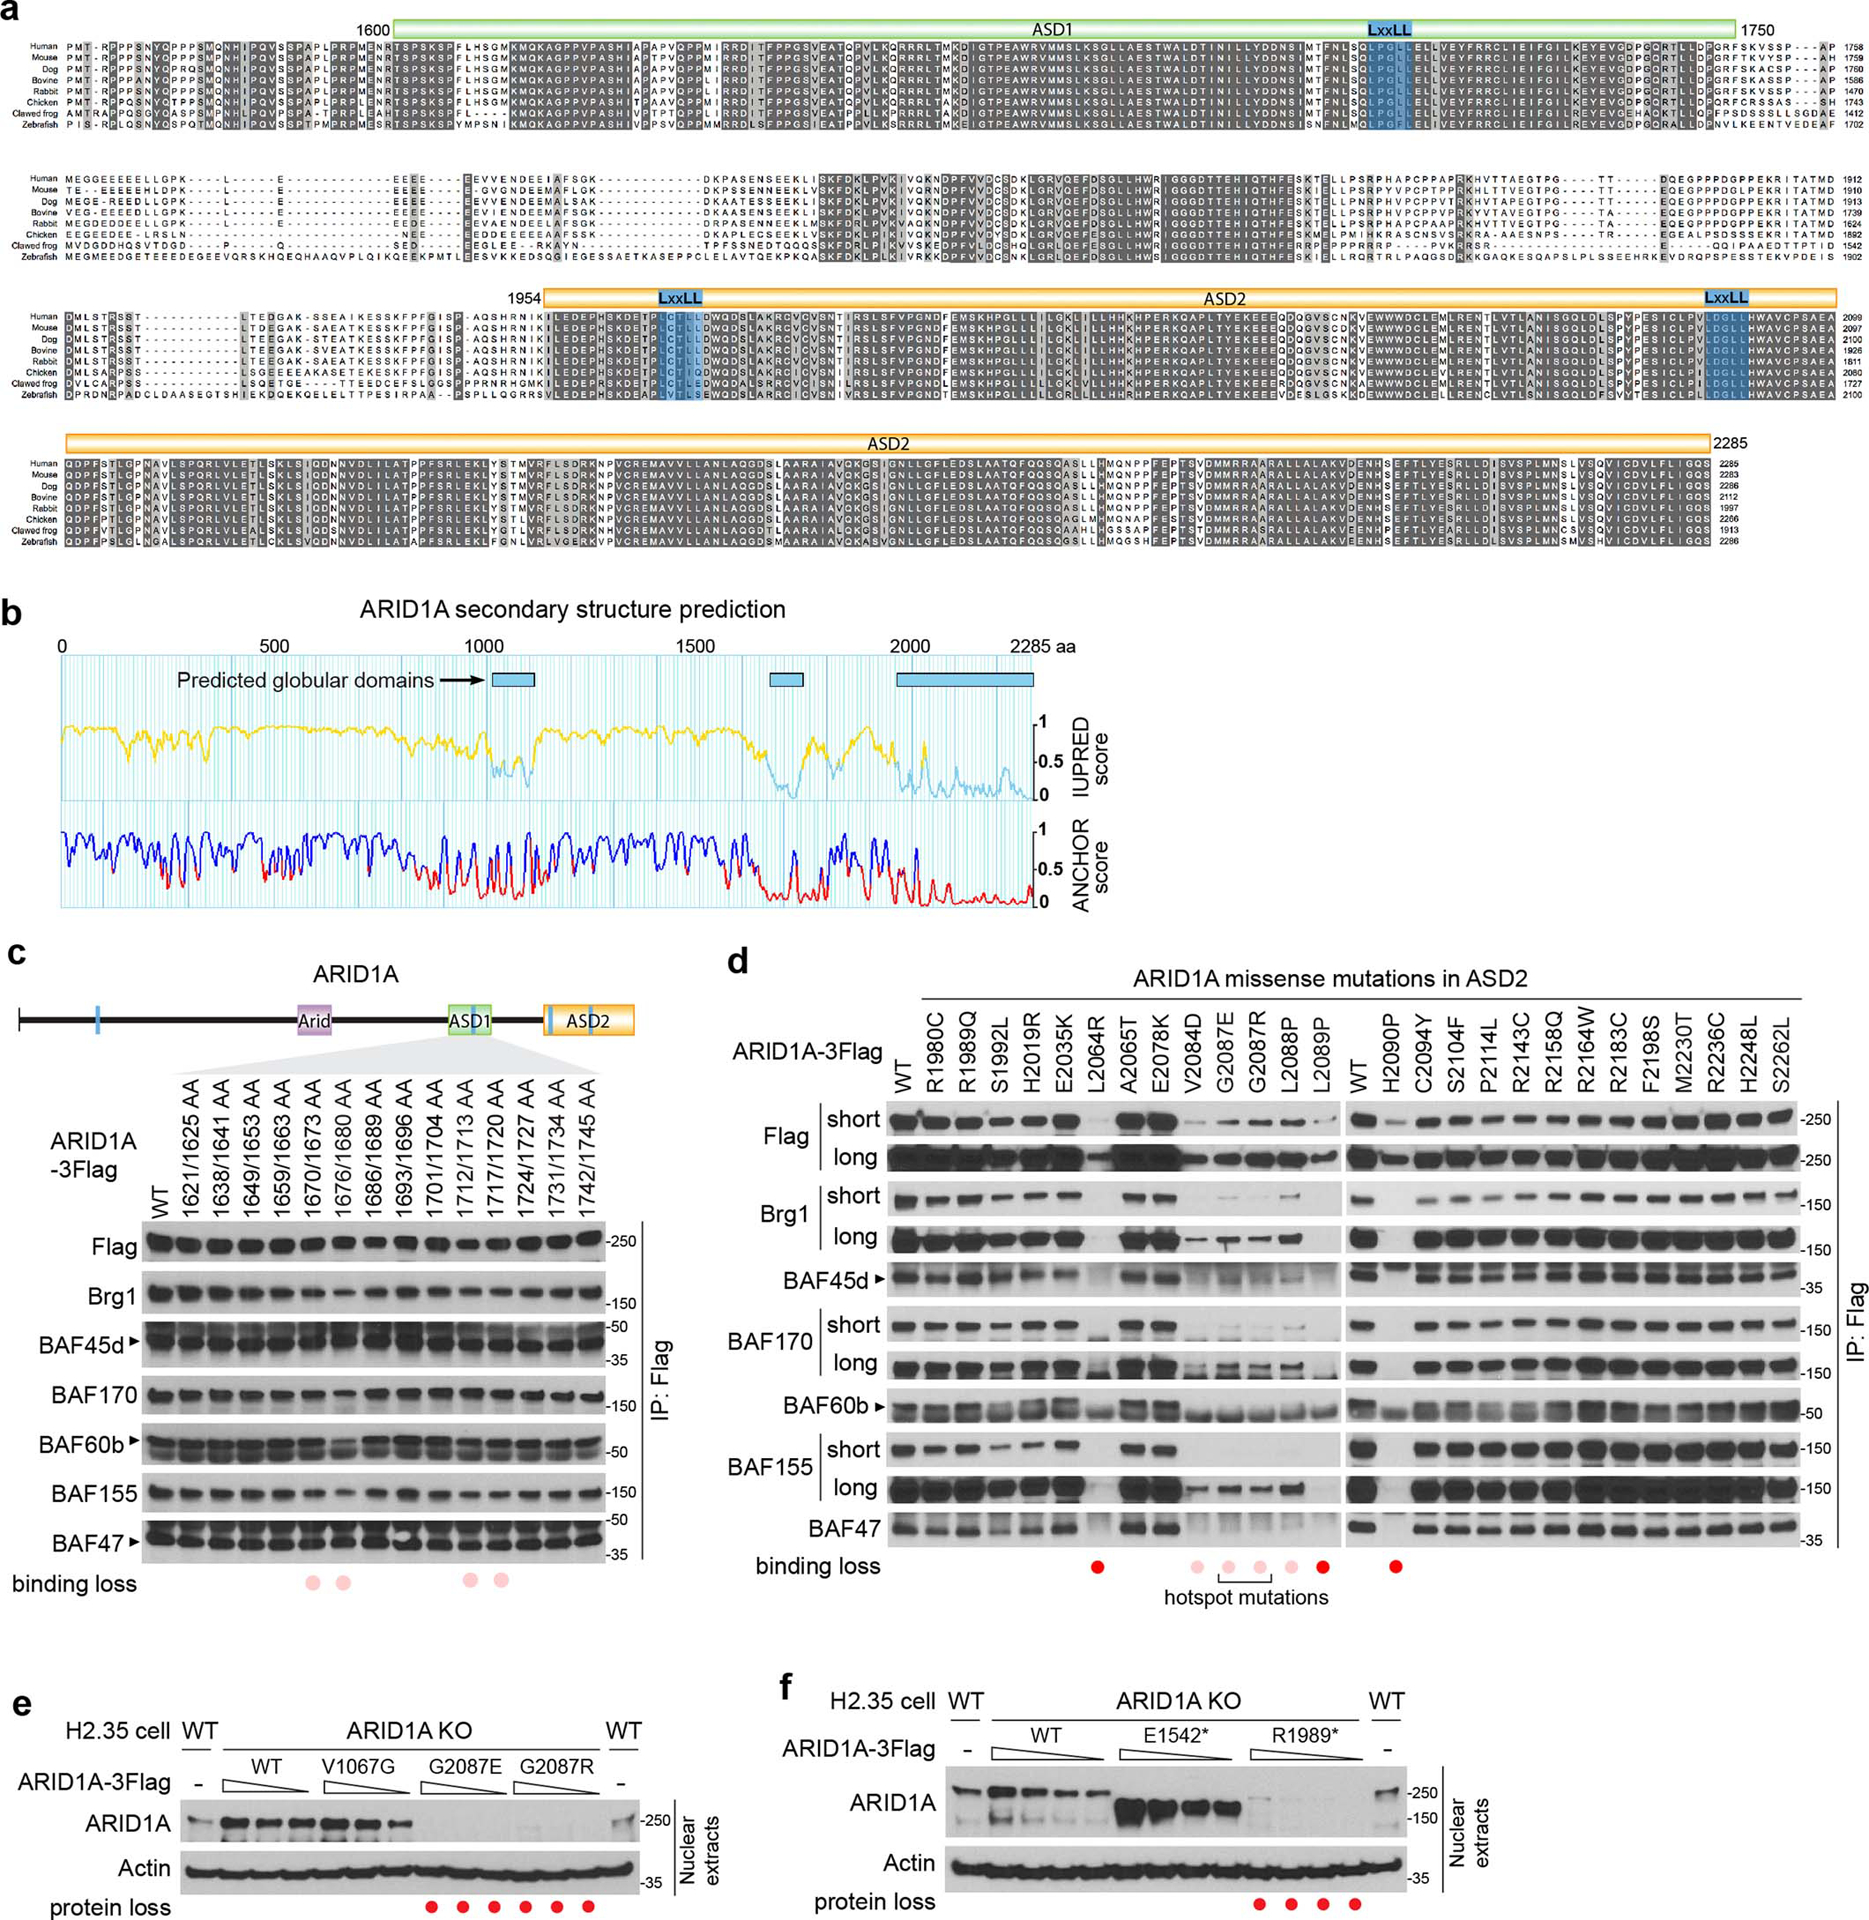
a. Multiple sequence alignment of ARID1A protein C-terminal regions from human, mouse, dog, bovine, rabbit, chicken, clawed frog, and zebrafish showing two conserved ARID1 scaffolding domains (ASD1 and ASD2).
b. Secondary structure prediction of ARID1A using LCR-eXXXplorer server. Regions with a score lower than 0.5 (shown as a cyan line for the IUPRED score and a red line for the ANCHOR score) are likely well-folded globular domains.
c. Alanine scans within ASD1 of ARID1A and IP experiments to assess residues for cBAF subunit interactions. The indicated two residues were mutated to alanine in each construct.
d. IP experiments showing the influence of ARID1A missense mutations within ASD2 on BAF subunit interactions.
e. Western blot showing the influence of ARID1A hotspot missense mutations on protein stability in H2.35 cells.
f. Western blot showing the influence of ARID1A truncations on protein stability in H2.35 cells.
Supplementary Material
Acknowledgements
We would like to thank Samuel McBrayer, Jiang Wu, Jian Xu, Laura Banaszynski, Xin Liu and Sam Wang for constructive comments on the manuscript; Cheryl Lewis and John Shelton for histopathology; Proteomics Core at UTSW (Andrew Lemoff) for mass spectrometry; and the CRI Sequencing Core (Jian Xu) for genomics. Funding sources: NIH R03ES026397-01 (T.W.), CPRIT RP150596 (T.W.), CPRIT RP170267 (H.Z.), NIH/NIDDK R01DK111588 (H.Z.), Stand Up To Cancer Innovative Research Grant SU2C-AACR-IRG 10-16 (H.Z.).
Footnotes
Competing Interests Statement
At the time of publication, Hao Zhu owned Ionis Pharmaceuticals stock worth less than $10,000. Hao Zhu has active collaborations with Alnylam Pharmaceuticals and Twenty-Eight Seven Therapeutics. The remaining authors disclose no conflicts.
Supplementary Information
Supplementary Tables 1 and 2
Reporting Summary
Data Availability
All sequencing data have been deposited in the GEO with the accession number GSE147664 for mRNA-seq and GSE140183 for ChIP-seq. Source data for Figs. 1–8 and Extended Data Figs. 1–5 are provided with the paper. All other data supporting the findings of this study are available from the corresponding author on reasonable request.
REFERENCES
- 1.Kadoch C & Crabtree GR Mammalian SWI/SNF chromatin remodeling complexes and cancer: Mechanistic insights gained from human genomics. Sci Adv 1, e1500447(2015). [DOI] [PMC free article] [PubMed] [Google Scholar]
- 2.Hodges C, Kirkland JG & Crabtree GR The Many Roles of BAF (mSWI/SNF) and PBAF Complexes in Cancer. Cold Spring Harb Perspect Med 6 (2016). [DOI] [PMC free article] [PubMed] [Google Scholar]
- 3.Ronan JL, Wu W & Crabtree GR From neural development to cognition: unexpected roles for chromatin. Nat Rev Genet 14, 347–359 (2013). [DOI] [PMC free article] [PubMed] [Google Scholar]
- 4.Son EY & Crabtree GR The role of BAF (mSWI/SNF) complexes in mammalian neural development. Am J Med Genet C Semin Med Genet 166C, 333–349 (2014). [DOI] [PMC free article] [PubMed] [Google Scholar]
- 5.Staahl BT & Crabtree GR Creating a neural specific chromatin landscape by npBAF and nBAF complexes. Curr Opin Neurobiol 23, 903–913 (2013). [DOI] [PMC free article] [PubMed] [Google Scholar]
- 6.Wang W et al. Purification and biochemical heterogeneity of the mammalian SWI-SNF complex. EMBO J 15, 5370–5382 (1996). [PMC free article] [PubMed] [Google Scholar]
- 7.Gatchalian J et al. A non-canonical BRD9-containing BAF chromatin remodeling complex regulates naive pluripotency in mouse embryonic stem cells. Nat Commun 9, 5139(2018). [DOI] [PMC free article] [PubMed] [Google Scholar]
- 8.Wang X et al. BRD9 defines a SWI/SNF sub-complex and constitutes a specific vulnerability in malignant rhabdoid tumors. Nat Commun 10, 1881(2019). [DOI] [PMC free article] [PubMed] [Google Scholar]
- 9.Mashtalir N et al. Modular Organization and Assembly of SWI/SNF Family Chromatin Remodeling Complexes. Cell 175, 1272–1288 e1220 (2018). [DOI] [PMC free article] [PubMed] [Google Scholar]
- 10.Raab JR, Resnick S & Magnuson T Genome-Wide Transcriptional Regulation Mediated by Biochemically Distinct SWI/SNF Complexes. PLoS Genet 11, e1005748(2015). [DOI] [PMC free article] [PubMed] [Google Scholar]
- 11.Kadoch C et al. Proteomic and bioinformatic analysis of mammalian SWI/SNF complexes identifies extensive roles in human malignancy. Nat Genet 45, 592–601 (2013). [DOI] [PMC free article] [PubMed] [Google Scholar]
- 12.Biegel JA, Busse TM & Weissman BE SWI/SNF chromatin remodeling complexes and cancer. Am J Med Genet C Semin Med Genet 166C, 350–366 (2014). [DOI] [PMC free article] [PubMed] [Google Scholar]
- 13.Jones S et al. Frequent mutations of chromatin remodeling gene ARID1A in ovarian clear cell carcinoma. Science 330, 228–231 (2010). [DOI] [PMC free article] [PubMed] [Google Scholar]
- 14.Mathur R et al. ARID1A loss impairs enhancer-mediated gene regulation and drives colon cancer in mice. Nat Genet 49, 296–302 (2017). [DOI] [PMC free article] [PubMed] [Google Scholar]
- 15.Sun X et al. Arid1a Has Context-Dependent Oncogenic and Tumor Suppressor Functions in Liver Cancer. Cancer Cell 33, 151–152 (2018). [DOI] [PMC free article] [PubMed] [Google Scholar]
- 16.Bitler BG et al. Synthetic lethality by targeting EZH2 methyltransferase activity in ARID1A-mutated cancers. Nat Med 21, 231–238 (2015). [DOI] [PMC free article] [PubMed] [Google Scholar]
- 17.Fukumoto T et al. Repurposing Pan-HDAC Inhibitors for ARID1 A-Mutated Ovarian Cancer. Cell Rep 22, 3393–3400 (2018). [DOI] [PMC free article] [PubMed] [Google Scholar]
- 18.Lissanu Deribe Y et al. Mutations in the SWI/SNF complex induce a targetable dependence on oxidative phosphorylation in lung cancer. Nat Med 24, 1047–1057 (2018). [DOI] [PMC free article] [PubMed] [Google Scholar]
- 19.McDonald ER 3rd et al. Project DRIVE: A Compendium of Cancer Dependencies and Synthetic Lethal Relationships Uncovered by Large-Scale, Deep RNAi Screening. Cell 170, 577–592 e510 (2017). [DOI] [PubMed] [Google Scholar]
- 20.Michel BC et al. A non-canonical SWI/SNF complex is a synthetic lethal target in cancers driven by BAF complex perturbation. Nat Cell Biol 20, 1410–1420 (2018). [DOI] [PMC free article] [PubMed] [Google Scholar]
- 21.Ogiwara H et al. Targeting the Vulnerability of Glutathione Metabolism in ARID1A-Deficient Cancers. Cancer Cell 35, 177–190 e178 (2019). [DOI] [PubMed] [Google Scholar]
- 22.Williamson CT et al. ATR inhibitors as a synthetic lethal therapy for tumours deficient in ARID1A. Nat Commun 7, 13837(2016). [DOI] [PMC free article] [PubMed] [Google Scholar]
- 23.Wu C et al. Targeting AURKA-CDC25C axis to induce synthetic lethality in ARID1A-deficient colorectal cancer cells. Nat Commun 9, 3212(2018). [DOI] [PMC free article] [PubMed] [Google Scholar]
- 24.Shen J et al. ARID1A deficiency promotes mutability and potentiates therapeutic antitumor immunity unleashed by immune checkpoint blockade. Nat Med 24, 556–562(2018). [DOI] [PMC free article] [PubMed] [Google Scholar]
- 25.Hoffman GR et al. Functional epigenetics approach identifies BRM/SMARCA2 as a critical synthetic lethal target in BRG1-deficient cancers. Proc Natl Acad Sci USA 111, 3128–3133(2014). [DOI] [PMC free article] [PubMed] [Google Scholar]
- 26.Viswanathan SR et al. Genome-scale analysis identifies paralog lethality as a vulnerability of chromosome 1p loss in cancer. Nat Genet 50, 937–943 (2018). [DOI] [PMC free article] [PubMed] [Google Scholar]
- 27.Helming KC et al. ARID1B is a specific vulnerability in ARID1A-mutant cancers. Nat Med 20, 251–254 (2014). [DOI] [PMC free article] [PubMed] [Google Scholar]
- 28.Kelso TWR et al. Chromatin accessibility underlies synthetic lethality of SWI/SNF subunits in ARID1A-mutant cancers. Elife 6 (2017). [DOI] [PMC free article] [PubMed] [Google Scholar]
- 29.Coatham M et al. Concurrent ARID1A and ARID1B inactivation in endometrial and ovarian dedifferentiated carcinomas. Mod Pathol 29, 1586–1593 (2016). [DOI] [PubMed] [Google Scholar]
- 30.Sun X et al. Suppression of the SWI/SNF Component Arid1a Promotes Mammalian Regeneration. Cell Stem Cell 18, 456–466 (2016). [DOI] [PMC free article] [PubMed] [Google Scholar]
- 31.Celen C et al. Arid1b haploinsufficient mice reveal neuropsychiatric phenotypes and reversible causes of growth impairment. Elife 6 (2017). [DOI] [PMC free article] [PubMed] [Google Scholar]
- 32.Oba A et al. ARID2 modulates DNA damage response in human hepatocellular carcinoma cells. J Hepatol 66, 942–951 (2017). [DOI] [PubMed] [Google Scholar]
- 33.Zhao H et al. ARID2: a new tumor suppressor gene in hepatocellular carcinoma. Oncotarget 2, 886–891 (2011). [DOI] [PMC free article] [PubMed] [Google Scholar]
- 34.Jiang H et al. Chromatin remodeling factor ARID2 suppresses hepatocellular carcinoma metastasis via DNMT1-Snail axis. Proc Natl Acad Sci USA 117, 4770–4780 (2020). [DOI] [PMC free article] [PubMed] [Google Scholar]
- 35.Li M et al. Inactivating mutations of the chromatin remodeling gene ARID2 in hepatocellular carcinoma. Nat Genet 43, 828–829 (2011). [DOI] [PMC free article] [PubMed] [Google Scholar]
- 36.Kirmitzoglou I & Promponas VJ LCR-eXXXplorer: a web platform to search, visualize and share data for low complexity regions in protein sequences. Bioinformatics 31, 2208–2210 (2015). [DOI] [PMC free article] [PubMed] [Google Scholar]
- 37.Santen GW et al. Mutations in SWI/SNF chromatin remodeling complex gene ARID1B cause Coffin-Siris syndrome. Nat Genet 44, 379–380 (2012). [DOI] [PubMed] [Google Scholar]
- 38.Wang K et al. Exome sequencing identifies frequent mutation of ARID1A in molecular subtypes of gastric cancer. Nat Genet 43, 1219–1223 (2011). [DOI] [PubMed] [Google Scholar]
- 39.Tsurusaki Y et al. Mutations affecting components of the SWI/SNF complex cause Coffin-Siris syndrome. Nat Genet 44, 376–378 (2012). [DOI] [PubMed] [Google Scholar]
- 40.Sausen M et al. Integrated genomic analyses identify ARID1A and ARID1B alterations in the childhood cancer neuroblastoma. Nat Genet 45, 12–17 (2013). [DOI] [PMC free article] [PubMed] [Google Scholar]
- 41.Jiao Y et al. Exome sequencing identifies frequent inactivating mutations in BAP1, ARID1A and PBRM1 in intrahepatic cholangiocarcinomas. Nat Genet 45, 1470–1473 (2013). [DOI] [PMC free article] [PubMed] [Google Scholar]
- 42.Holz-Schietinger C, Matje DM, Harrison MF & Reich NO Oligomerization of DNMT3A controls the mechanism of de novo DNA methylation. J Biol Chem 286, 41479–41488 (2011). [DOI] [PMC free article] [PubMed] [Google Scholar]
- 43.Jurkowska RZ et al. Oligomerization and binding of the Dnmt3a DNA methyltransferase to parallel DNA molecules: heterochromatic localization and role of Dnmt3L. J Biol Chem 286, 24200–24207 (2011). [DOI] [PMC free article] [PubMed] [Google Scholar]
- 44.Nemeth A, Guibert S, Tiwari VK, Ohlsson R & Langst G Epigenetic regulation of TTF-I-mediated promoter-terminator interactions of rRNA genes. EMBO J 27, 1255–1265 (2008). [DOI] [PMC free article] [PubMed] [Google Scholar]
- 45.Zhu H et al. Lin28a transgenic mice manifest size and puberty phenotypes identified in human genetic association studies. Nat Genet 42, 626–630 (2010). [DOI] [PMC free article] [PubMed] [Google Scholar]
Associated Data
This section collects any data citations, data availability statements, or supplementary materials included in this article.
Supplementary Materials
Data Availability Statement
All sequencing data have been deposited in the GEO with the accession number GSE147664 for mRNA-seq and GSE140183 for ChIP-seq. Source data for Figs. 1–8 and Extended Data Figs. 1–5 are provided with the paper. All other data supporting the findings of this study are available from the corresponding author on reasonable request.


