

Abstract
Background:
Alaska Native (AN) people have the highest rates of colorectal cancer (CRC) globally. Increasing CRC screening has been effective in reducing CRC-related morbidity and mortality in other populations.
Objective:
To examine recent descriptive epidemiology and longer-term CRC trends among AN people. To determine any changes in the descriptive epidemiology of CRC among AN people concurrent with increases in screening prevalence.
Methods:
We estimated age-specific CRC incidence and mortality rates 2000-2017. To examine longer-term trends in incidence and mortality 1990-2017, we conducted Joinpoint regression analyses of three-year rolling average incidence and mortality rates. We calculated descriptive statistics for two time-periods: 2000-2008, and 2009-2017. Finally, we examined five-year survival probability.
Results:
CRC incidence increased over time (1990-2017) among AN people aged less than 50 years, while there were modest declines in AN people older than 50 years old since 2000. Overall, AN CRC mortality rates declined between 1990 and 2004, but have been increasing steadily since that time. Comparing 2000-2008 with 2009-2017 we observed no difference in CRC incidence and mortality, age at diagnosis, tumor size, tumor location, or stage distribution. Survival analyses indicated no change in hazard of death between 2004-2008 and 2009-2017 (HR 1.02, 95% CI: 0.74, 1.38, P = 0.93).
Conclusions:
Colorectal cancer prevention and control efforts across the Alaska Tribal Health System have not yet resulted in reduced mortality rates, or induced earlier stage migration.
Policy Summary Statement:
Intensified efforts will be necessary to reduce the burden of CRC among this high-risk population. Continued and increased focus on primary and secondary prevention efforts is warranted.
Keywords: Native American, cancer surveillance, colorectal cancer, screening
INTRODUCTION
Alaska Native (AN) people have the highest recorded incidence and death rate from colorectal cancer (CRC) globally. Both incidence of and mortality from CRC is greater than twofold higher among AN people than US whites (incidence: 91 vs. 40/100,000; mortality: 37 vs. 15/100,000), and the median age at diagnosis is 64 years for AN people compared with 69 years for U.S. all races.1–3 This disparity has persisted for over 40 years.1,3 Furthermore, CRC is the second leading cancer among AN people, accounting for 18% of cancers, and 14% of cancer deaths.4
This high burden of CRC has led to an increased focus on CRC screening by Tribal and clinical leadership within the Alaska Tribal Health System.5–7 Screening can prevent CRC through the identification and removal of colorectal polyps before they develop into cancer.2 Screening also allows for the detection and diagnosis of CRC at earlier stages, when treatment has greater likelihood of success with lower impact on quality of life.8,9 Several strategies have been employed within the Alaska Tribal Health System to increase screening among AN people, including three AN CRC Control Programs, funded by the Centers for Disease Control and Prevention from 2009-2015.5 The goal of these programs was to increase colorectal cancer screening among AN people through a wide range of activities including direct screening services, patient navigation and reminder systems, community and provider education, and systems and policy changes.10 For example, one policy initiative implemented in 2013 was a change in Alaska Native Medical Center recommendations to begin screening AN people at 40 years, rather than 50 years as is nationally recommended, to address the high incidence and mortality among AN people.10,11 Overall, the efforts to increase screening among AN people have been a resounding success: in 1999, the proportion of AN people that had been screened was less than 40%.12 Before the CRC Control Programs began, in 2008 the AN screening prevalence was 47%, which increased to 68% in 2016.12 Yet, the impact of these screening increases on AN CRC outcomes is unknown.
This study investigated the potential impact of Alaska Tribal Health System CRC prevention and control efforts on CRC among AN people. Using population-based data from the Alaska Native Tumor Registry (ANTR), we examined recent descriptive epidemiology and longer-term CRC trends (1990-2017). We also compared descriptive statistics, incidence, mortality, and survival before (2000-2008) to during and immediately after (2009-2017) the implementation of CRC Control Programs in the Alaska Tribal Health System. The goal of this study was to identify any changes in the burden of CRC among AN people concurrent with increases in screening prevalence, and specifically since the implementation of the AN CRC Control Programs in 2009.
METHODS
Study population
An estimated 144,274 American Indian and Alaska Native (AIAN) people reside in Alaska13 (individuals reporting AIAN identity alone, or in combination with another racial identity), comprising 20% of the Alaskan population. Almost 90% of AIAN people living in Alaska identify as Alaska Native;14 therefore, hereafter we will refer to all AIAN people resident in Alaska as “Alaska Native (AN) people”. Healthcare for AN people residing in Alaska is provided by over twenty regional Tribal health organizations, and the Alaska Native Tribal Health Consortium, which provides statewide services. There is one Tribally managed tertiary healthcare facility in the state, located in Anchorage: the Alaska Native Medical Center, which provides colorectal cancer screening services to AN people statewide, as well as treatment to the majority of AN people with CRC. Screening services are provided by regional Tribal health organizations in six regional hubs.15
Data sources
Cancer data were collected by the ANTR, which is a population-based central cancer registry that records information on AIAN people who meet eligibility requirements for Indian Health Service benefits, who have been diagnosed with cancer in Alaska since 1969, and who resided in Alaska at the time of diagnosis. The ANTR has been collecting cancer information according to National Cancer Institute’s Surveillance, Epidemiology, and End Results Program (SEER) standards since its inception and has been a full member of the SEER Program since 1999. The primary focus of the current analysis is on cancers diagnosed 2000-2017; however, we also provide a longer-term context by examining trends in cancer incidence and mortality 1990-2017. Cases of colon and rectal cancer (ICD-O-3 anatomic site codes C18.0, 18.2-18.9, C19.9, C20.9) with a behavior code “3” (i.e., malignant cases) were selected for inclusion in this study. Cancers of the appendix (C18.1) were not included in this study. Mortality data were provided by linkage to the National Death Index Plus, which is maintained by the National Center for Health Statistics.
Patient characteristics collected by the tumor registry and reviewed in this study include sex, age at diagnosis, and Alaska Tribal health region of residence at the time of diagnosis. Clinical characteristics included tumor size (2004 onwards), tumor location, and stage distribution (Derived Summary Stage 2000; 2004 onwards). Regarding tumor location, colon tumors were defined as located in the proximal colon if they were located in the cecum, ascending colon, hepatic flexure, transverse colon, or splenic flexure (C18.0-18.5); the distal colon if they were located in the descending colon, the sigmoid colon or the large intestine (C18.6-18.8); or colon (not otherwise specified) (C18.9).
Statistical Analysis
Differences in patient and clinical characteristics were assessed using the Chi-squared test for categorical variables, and one-way ANOVA for continuous variables. Fisher’s exact test was used for analyses of categorical variables where cell size <5. Trends in three-year rolling CRC incidence and mortality rates, and average annual percent change (APC), were analyzed using Joinpoint Regression software (Surveillance Research Program, National Cancer Institute, Bethesda MD16). The minimum number of joinpoints allowed was zero, and the maximum five, with at least two observations between each joinpoint. Three-year rolling cancer incidence and mortality rates were calculated 1990-2017; averages were not calculated for 2017 due to the lack of available data for 2018 at the time of analysis. Cancer incidence rates were expressed as average annual rates over two time-periods (2000-2008 and 2009-2017), expressed per 100,000 population and age-adjusted to the US Census 2000 standard population using the direct method. Denominators for rate calculations were derived from population estimates from the U.S. Bureau of the Census and National Center for Health Statistics for AN people (bridged estimates), available from the NCI’s SEER Program.14
Cause-specific CRC survival was assessed from 2004-2017; analyses were limited to these dates by availability of stage data. Kaplan-Meier methods were used to calculate univariate five-year cause-specific survival; log-rank tests were used to formally assess differences in survival in strata of the patient and clinical characteristics listed above. Multivariable Cox proportional hazards models17 were used to characterize survival by patient and clinical characteristics. The outcome for these analyses was CRC-specific death; individuals who died from other causes were censored at the date of death. In accordance with prevailing standards, survival analyses were restricted to first primary cancers, cases of known age, and those histologically confirmed and followed over time; cases that were identified solely based on death certificates or autopsy reports were excluded.18,19 Patients still alive on December 31, 2017 were administratively censored.
All statistical tests were two-sided and were assessed at an alpha level of p<0.05. Statistics were generated using standard modules of the Statistical Analysis System (Version 9.4, SAS Institute, Cary, NC). As per ANTR standard procedure, incidence rates and case counts are not given where cell sizes were <5, in order to protect individuals’ privacy.
Ethics Statement
Institutional review board approval and informed consent were not required for the current study because all SEER Program data are publicly available and collected for surveillance purposes, and all data were de-identified. Tribal review and approval was obtained for publication of this study from the Alaska Native Tribal Health Consortium.
RESULTS
Figures 1 a–c show the age-specific Joinpoint regression analysis of cancer incidence trends, 1990-2016. Incidence of cancers among young people generally increased over this time. Among 40-49 year olds, we observed a positive trend (Annual percent change (APC) = 3.57, 0 joinpoints) for the entire seventeen-year period. We observed a non-significant decreasing trend among those aged 50-75 years (APC −0.97; 0 joinpoints), and a significant decreasing trend among those aged 75+ years (APC −1.71; 0 joinpoints). Figure 1d shows the Joinpoint regression analysis of cancer mortality rates 1990-2016; these analyses were not stratified by age due to case count limitations. We observed a decrease in mortality rates between 1991-2005 (APC= −1.57); however, between 2005-2016 rates increased (APC = 2.24).
Figure 1.
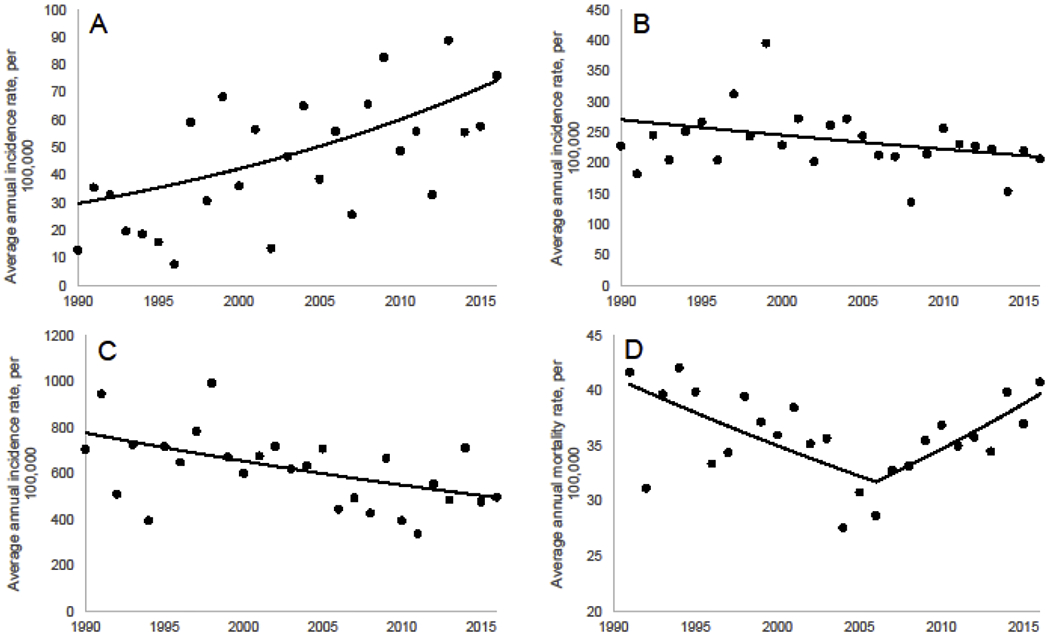
Age-specific Joinpoint regression analysis using three-year rolling average CRC incidence rates (1990-2016). Model selected by Joinpoint as best fit. A) Incidence, 40-49 years B) Incidence, 50-75 years C) Incidence, 76+ years D) Mortality, all ages.
Age-specific incidence and mortality rates are given in Table 1; specifically, this table presents data for 2000-2008 compared with 2009-2017. No significant difference in incidence or mortality rates was observed between time-periods, as indicated by overlapping 95% confidence intervals for each age group. Table 2 gives descriptive statistics for demographic and clinical characteristics of CRC diagnosed among AN people for these same time-periods. There were no statistically significant differences in demographic characteristics between time-periods. The majority of cases (~65%) were diagnosed in individuals of screenable age (50-75 years); however, there were a substantial number of diagnoses in those younger than 50 years (~15% cases) and older than 75 years (~20% cases). CRC diagnoses were almost equally split between men and women. There was also no significant difference in tumor size, location, or stage distribution between time-periods. Approximately one third of CRC cases were rectal cancers; another third were cancers of the distal colon; and the remaining ~40% were cancers of the proximal colon. In both time-periods approximately one fifth of all CRCs were diagnosed at distant stage, with the remainder of cases almost equally split between local and regional stage cases. In both time-periods almost half of all tumors were greater than 40mm in size.
Table 1.
Age-specific incidence and mortality rates (95% CI), per 100,000 population, for colorectal cancers among Alaska Native people, over time.
| 2000-2008 | 2009-2017 | |||||
|---|---|---|---|---|---|---|
| Age (y) | Total | Male | Female | Total | Male | Female |
|
| ||||||
| Incidence | ||||||
|
| ||||||
| 40-49 | 44.9 (34.4, 57.7) | 38.5 (25.2, 56.5) | 51.2 (35.7, 71.3) | 62.8 (49.8, 78.1) | 44.2 (29.5, 63.6) | 82.0 (61.1, 107.7) |
| 50-75 | 225.7 (201.5, 252.1) | 226.6 (191.8, 265.8) | 224.7 (191.6, 261.8) | 216.1 (195.8, 238.0) | 238.1 (207.6, 271.6) | 195.9 (169.2, 225.4) |
| 76+ | 588.4 (490.7, 700.1) | 569.0 (421.5, 753.3) | 599.8 (473.1, 750.1) | 509.3 (429.9, 599.2) | 541.0 (413.7, 695.3) | 489.7 (390.5, 606.6) |
|
| ||||||
| Mortality | ||||||
|
| ||||||
| 40-49 | 11.2 (6.2, 18.4) | -- | -- | 14.7 (9.0, 22.8) | -- | 17.6 (9.1, 31.1) |
| 50-75 | 61.9 (49.3, 76.7) | 79.2 (58.5, 104.6) | 46.8 (32.4, 65.3) | 68.1 (56.8, 80.9) | 77.2 (60.2, 97.4) | 59.7 (45.3, 77.2) |
| 76+ | 287.7 (219.4, 370.6) | 329.6 (212.8, 487.3) | 267.5 (185.1, 374.1) | 322.0 (258.6, 396.3) | 391.2 (281.3, 529.3) | 278.8 (204.7, 370.9) |
Table 2.
Descriptive statistics for colorectal cancers among Alaska Native people (n = 1,223), comparing 2000-2008 to 2009-2017.
| 2000-2008 | 2009-2017 | P | |
|---|---|---|---|
| Total, n (%) | 534 | 689 | |
| Male | 247 (46) | 337 (49) | 0.36 |
| Female | 287 (54) | 352 (51) | |
| Age at diagnosis, mean (SD) | 63.9 (12.9) | 62.7 (13.2) | 0.11 |
| 0-39 | 18 (3) | 30 (4) | 0.80 |
| 40-49 | 61 (11) | 81 (12) | |
| 50-75 | 342 (64) | 447 (65) | |
| 75+ | 113 (21) | 131 (19) | |
|
| |||
| Tumor Sizea | |||
|
| |||
| Central tendency, mm, mean (SD) | 44 (24) | 42 (26) | 0.28 |
| Size distribution, mm, n (%) | |||
| <10 | 6 (2) | 40 (6) | 0.11 |
| 10-20 | 20 (7) | 41 (6) | |
| 20-40 | 69 (22) | 144 (21) | |
| >40 | 142 (46) | 305 (45) | |
| Unknown | 72 (23) | 154 (23) | |
|
| |||
| Location, n (%) | |||
|
| |||
| Colon | |||
| Proximal | 216 (41) | 268 (39) | 0.47 |
| Distal | 157 (29) | 185 (27) | |
| Not otherwise specified | 8 (2) | 14 (2) | |
| Rectum | 153 (29) | 221 (32) | |
|
| |||
| Stage distributiona, n (%) | |||
|
| |||
| Localized | 119 (38) | 223 (37) | 0.44 |
| Regional | 121 (39) | 212 (36) | |
| Distant | 62 (20) | 147 (21) | |
| Unknown | 8 (3) | 14 (2) | |
Tumor size and stage data only available for diagnosis years 2004 onwards.
Univariate Kaplan-Meier and univariate and multivariable-adjusted Cox proportional hazards models examining CRC survival among AN people, stratified by sex, age, stage, and time-period are given in Table 3. After exclusions, the final number of CRC cases included in this analysis was 818. We observed no association of survival probability with sex, or age at diagnosis (0-49 years versus 50 years and older). Stage at diagnosis was a strong predictor of survival; risk of death was 7.29 times higher among those diagnosed at regional/distant/or unknown stage than those diagnosed at local stage (HR: 7.29, 95% CI: 4.48, 11.86, P<0.0001). In univariate analyses, there was a slightly increased hazard of death in the later period (2009-2017) compared to the earlier period (2004-2017; dates restricted due to availability of stage covariate information) (HR: 1.32, 95% CI: 1.00, 1.74, P<0.045); however, this association was non-significant in multivariable adjusted models (HR: 1.27, 95% CI: 0.96, 1.68, P<0.09).
Table 3.
Survival from colorectal cancer among Alaska Native people, 2004-2017, stratified by sex, age at diagnosis, stage at diagnosis, and time-period. Results are shown for univariate Kaplan-Meier and Cox proportional hazards models, as well as a multivariable Cox proportional hazards model including; all variables (n = 818).
|
Kaplan-Meier
|
Cox Proportional Hazards
|
||||||||||||
|---|---|---|---|---|---|---|---|---|---|---|---|---|---|
| Proportion Surviving Month | Unadjusted |
Adjusted |
|||||||||||
| by Log-rank | Hazard 95% CI | Hazard 95% CI | χ2 | ||||||||||
| n | 12 | 36 | 60 | P-value | Ratio | P-Value | Ratio | P-Value | |||||
| Sex | Male | 394 | 0.84 | 0.72 | 0.63 | 0.70 | 1.00 | Reference | 0.41 | 1.00 | Reference | 0.32 | |
| Female | 424 | 0.83 | 0.72 | 0.66 | 0.90 | 0.71-1.15 | 0.88 | 0.69, 1.13 | |||||
| Age at Diagnosis | 0-49 years | 148 | 0.87 | 0.72 | 0.70 | 0.17 | 0.80 | 0.58, 1.10 | 0.18 | 0.73 | 0.52, 1.01 | 0.05 | |
| 50+years | 670 | 0.83 | 0.72 | 0.64 | 1.00 | Reference | 1.00 | Reference | |||||
| Stage at Diagnosis | Local | 317 | 0.98 | 0.96 | 0.91 | <0.0001 | 1.00 | Reference | <0.0001 | 1.00 | Reference | <0.0001 | |
| Regional/Distant/Unknown | 501 | 0.75 | 0.59 | 0.49 | 7.74 | 4.98, 11.11 | 7.51 | 5.03, 11.22 | |||||
| Year of Diagnosis | 2004-2008 | 218 | 0.89 | 0.76 | 0.69 | 0.04 | 1.00 | Reference | 0.045 | 1.00 | Reference | 0.09 | |
| 2009-2017 | 600 | 0.82 | 0.70 | 0.63 | 1.32 | 1.00-1.74 | 1.27 | 0.96, 1.68 | |||||
DISCUSSION
The high rates of CRC among Alaska Native people have led to efforts to increase screening within the Alaska Tribal Health System. These efforts have included the development of Tribal CRC control programs using evidence-based interventions shown to be effective in other populations, such as patient and provider reminders, reducing structural barriers, and patient navigation and outreach.5,20–22 These efforts were successful in increasing the proportion of AN people being screened. The present study examined whether any impacts of screening increases could be detected in the recent descriptive epidemiology of CRC among AN people, as well as long term trends in incidence and mortality. The most striking finding from these analyses was that, despite increases in screening prevalence starting in the early 2000’s, CRC mortality showed a clear increasing trend beginning in 2005. Reasons for this counterintuitive finding are unknown. Further research is needed to explore whether access to or utilization of healthcare services after an abnormal finding; time between abnormal findings and diagnostic or treatment services, diagnosis of cancer between guideline-recommended intervals; or other factors that reduce the effectiveness of colorectal cancer treatment may be playing a role in the relationship between CRC screening and mortality in the AN population.
We also compared characteristics of cancers diagnosed 2000-2008, the time immediately prior to the implementation of CRC Control Programs, with the period during and immediately after program implementation (2009-2017). Screening programs reduce late-stage CRC incidence,23,24 mortality,24–26 and can induce earlier stage migration.27 Yet, among this high-risk population, we found little evidence of such impact, at least in the short term: there was no difference in stage at diagnosis or risk of death between the two time-periods, and mortality rates showed an increase from 2005 onwards. Because of the long lead time for CRC progression, it can take 5-10 years to observe an impact of a screening program on incidence and mortality;28,29 therefore, this current analysis might be too early to detect any changes that occurred as a direct result of the CDC-funded CRC Control Programs. Alternatively, it is possible that CRC incidence and mortality rates could have been even higher without these programs in place.
In our trend analyses, we observed a long-term pattern of increasing CRC incidence among AN people aged 40-49 years. This mirrors national trends in increasing incidence among younger adults.30,31 In both time-periods, the proportion of cases diagnosed among individuals aged less than 50 years was approximately 15%; this is higher than figures reported nationwide, which estimate approximately 12% of CRC are diagnosed in individuals aged under 50 years. Between 2009-2017, we observed incidence and mortality rates of 62.8 and 14.7/100,000, respectively; this is substantially higher than has been reported for USW,30,32 and is agreement with previous results from this population.33 The higher risk of CRC among AN people has been recognized by several leading public health organizations, including the American Cancer Society,34 and the higher risk specifically among younger people was a primary driver for the 2013 policy change at the Alaska Native Medical Center to begin screening for CRC at age 40 years among AN people.35 Further research is needed to determine why rates have been increasing among younger people; and why AN people are at much higher risk than their USW counterparts.
Colorectal cancer screening may also lead to improved survival, as cancers are diagnosed earlier when treatment has greater chance of success. In the present study, we observed no change in survival from CRC between 2000-2008 and 2009-2017, after adjustment for age, sex, and stage at diagnosis. In a previous study by our group, we observed a marginally non-significant 20% reduction in hazard of death from CRC among AN people between 1992-2002 and 2003-2013.36 The difference in these findings can likely be explained by the differences in time-periods examined: the previous study included data from the 1990’s when national CRC screening recommendations were just being released, and prevalence of screening among AN people was substantially lower. In 1999, the proportion of AN people that reported screening was <40%, which increased to 47% in 2008. Since that time, statewide screening prevalence has increased to over 65%,37 comparable to national figures.38 although screening rates among AN people vary widely from region to region, from 29% up to 72%. Other factors that may contribute to changes in survival include healthcare access and utilization; and treatment effectiveness.39–44 Further research to investigate these contributions may be warranted.
In addition to secondary prevention efforts, primary prevention should be a critical component of comprehensive efforts to reduce the burden of CRC among AN people. CRC risk factors, including smoking, obesity, physical inactivity, and low fruit and vegetable intake, continue to be common in the AN population,12,45 which indicate that increased primary prevention in addition to screening efforts may be warranted. Furthermore, research from non-Native populations suggests that there may be biological mechanisms underlying CRC development, including genes and gene-environment interactions,46–48 While few such research studies have been conducted for and among AN people,49 future research should elucidate whether genetic factors contribute to CRC risk in this population, and whether there are interactions with environmental factors that may contribute to the continued high incidence and mortality.
The primary strength of this study was its use of high-quality population-based data collected by the Alaska Native Tumor Registry, a special population registry of the National Cancer Institute’s Surveillance, Epidemiology and End Results Program. This study provides benchmark data pertaining to CRC incidence and mortality against which future studies can measure the potential impact of the AN CRC screening programs. A key limitation of this work is that because the Alaska Native population is small, case counts and numbers of deaths from CRC were low, despite CRC being the second leading cancer among AN people.1 Sparse data bias is always a concern for research conducted with small populations;50 yet, this does not diminish the importance of such research.51 Furthermore, small sample sizes results in reduced statistical power, which may have limited our ability to detect differences between groups, or trends over time, particularly within or between strata. To maximize the number of cases in each time-period, and to ensure that we were comparing relevant time-periods, we compared data from 2000-2008 with 2009-2017. It is possible that changes may have occurred within these time-periods; or that a different comparison may have resulted in significant findings. We chose these time-periods to provide data before and after the AN CRC Control Programs and their activities began in earnest; continued monitoring of these data will indicate if changes have occurred more recently, or are ongoing. We provide information on five-year survival for AN CRC patients; this metric has been criticized as an indicator of success against the burden of cancer because of its potential for lead-time bias, length bias, and/or overdiagnosis, particularly among screenable cancers.52 Because this may create the appearance of improvement where none truly exists, mortality has been suggested as a more suitable alternative.52 We observed no changes in either survival or age-specific mortality for the time-periods examined; and more fine-grained trends analyses actually indicated continued increases in overall mortality beginning in 2005. Finally, because this was an examination of data from the ANTR, we were not able to directly assess reductions in risk associated with screening among AN people, or examine screening among CRC cases. Further research to address these knowledge gaps among this high-risk population is warranted.
In this study, long-term trend analyses showed a steady increase in mortality since the early 2000’s, when CRC screening prevalence began to increase among AN people. Furthermore, we were not able to demonstrate any short-term changes in CRC mortality, incidence, or stage at diagnosis that could be directly linked to efforts to increase screening among AN people through CRC Control Programs. Continued surveillance is necessary to evaluate whether ongoing screening efforts result in improvements in CRC outcomes in this high-risk population.
Highlights.
Alaska Native people have the highest rate of colorectal cancer (CRC) globally.
We examined recent descriptive epidemiology and longer-term CRC trends among AN people to determine changes in the descriptive epidemiology of CRC among AN people concurrent with increases in screening prevalence.
CRC incidence rates increased over time (1990-2017) among AN people aged less than 50 years, while there were modest declines in AN people older than 50 years old since 2000.
AN CRC mortality rates declined between 1990 and 2004, but have been increasing steadily since that time.
Comparing 2000-2008 with 2009-2017 we observed no difference in CRC incidence and mortality, age at diagnosis, tumor size, tumor location, stage distribution, or survival.
Intensified efforts are required to reduce the CRC burden in this high-risk population.
Funding and Acknowledgements:
Dr. Nash and the Alaska Native Tumor Registry are supported by the National Cancer Institute (NCI) Surveillance, Epidemiology and End Results Program, NCI contract number HHSN26120130010I, Task Order HHSN26100005. Dr. Redwood is supported by the Centers for Disease Control and Prevention of the U.S. Department of Health and Human Services (HHS) under Organized Approaches to Increase Colorectal Cancer Screening Grant 6NU58DP006748-01-01.
Abbreviations:
- AI/AN
American Indian/Alaska Native
- AN
Alaska Native
- ANTR
Alaska Native Tumor Registry
- CI
Confidence Interval
- HR
Hazard Ratio
- ICD-O-3
International Classification of Diseases for Oncology – Third Edition
- SEER
Surveillance, Epidemiology and End Results
- USW
U.S. whites
Footnotes
Publisher's Disclaimer: This is a PDF file of an unedited manuscript that has been accepted for publication. As a service to our customers we are providing this early version of the manuscript. The manuscript will undergo copyediting, typesetting, and review of the resulting proof before it is published in its final form. Please note that during the production process errors may be discovered which could affect the content, and all legal disclaimers that apply to the journal pertain.
Conflict of Interest Statement
The authors declare no conflicts of interest.
References
- 1.Carmack A, Schade TL, Sallison I, Provost EM, Kelly JJ. Cancer in Alaska Native People: 1969-2013, The 45 Year Report. Anchorage, AK: Alaska Native Epidemiology Center, Alaska Native Tribal Health Consortium;2015. [Google Scholar]
- 2.American Cancer Society. Colorectal Cancer Facts and Figures, 2020-2022. Atlanta, GA: American Cancer Society;2020. [Google Scholar]
- 3.Zimpelman G, Miller KN, Carlo DD, Schade TL, Provost EM, Britton CL, Nash SH Cancer in Alaska Native people: The 50 year report. Anchorage, AK: Alaska Native Epidemiology Center, Alaska Native Tribal Health Consortium;2021. [Google Scholar]
- 4.Alaska Native Tumor Registry. Unpublished Surveillance Data. In. Anchorage, AK: Alaska Native Tribal Health Consortium; 2019. [Google Scholar]
- 5.Seeff LC, Major A, Townsend JS, et al. Comprehensive cancer control programs and coalitions: partnering to launch successful colorectal cancer screening initiatives. Cancer Causes Control. 2010;21(12):2023–2031. [DOI] [PubMed] [Google Scholar]
- 6.Redwood D, Provost E, Perdue D, Haverkamp D, Espey D. The last frontier: innovative efforts to reduce colorectal cancer disparities among the remote Alaska Native population. Gastrointest Endosc. 2012;75(3):474–480. [DOI] [PMC free article] [PubMed] [Google Scholar]
- 7.Redwood D, Joseph DA, Christensen C, et al. Development of a flexible sigmoidoscopy training program for rural nurse practitioners and physician assistants to increase colorectal cancer screening among Alaska Native people. J Health Care Poor Underserved. 2009;20(4):1041–1048. [DOI] [PubMed] [Google Scholar]
- 8.Siegel R, DeSantis C, Virgo K, et al. Cancer treatment and survivorship statistics, 2012. CA: a cancer journal for clinicians. 2012;62(4):220–241. [DOI] [PubMed] [Google Scholar]
- 9.Cabilan CJ, Hines S. The short-term impact of colorectal cancer treatment on physical activity, functional status and quality of life: a systematic review. JBI database of systematic reviews and implementation reports. 2017;15(2):517–566. [DOI] [PubMed] [Google Scholar]
- 10.Joseph DA, Redwood D, DeGroff A, Butler EL. Use of Evidence-Based Interventions to Address Disparities in Colorectal Cancer Screening. MMWR Suppl. 2016;65(1):21–28. [DOI] [PubMed] [Google Scholar]
- 11.Alaska Native Medical Center. Colorectal Cancer Screening Guidelines. Anchorage, AK: Alaska Native Tribal Health Consortium;2021. [Google Scholar]
- 12.Alaska Department of Health and Social Services. Alaska Behavioral Risk Factor Surveillance System. Juneau, AK: Alaska Department of Health and Social Services;2019. [Google Scholar]
- 13.Alaska Population by Age, Sex, Race (Alone or in Combination) and Hispanic Origin, July 2015. ≤http://live.laborstats.alaska.gov/pop/index.cfm≥. 2015. Accessed 3/23/2017.
- 14.U.S. Census Bureau. 2010 Census Summary File 1. ≤https://factfinder/census.gov≥. 2010. Accessed 3/23/2017.
- 15.Sherry P Health care delivery for Alaska Natives: a brief overview. International journal of circumpolar health. 2004;63(sup2):54–62. [DOI] [PubMed] [Google Scholar]
- 16.Kim HJ, Fay MP, Feuer EJ, Midthune DN. Permutation tests for joinpoint regression with applications to cancer rates. Statistics in medicine. 2000;19(3):335–351. [DOI] [PubMed] [Google Scholar]
- 17.Cox DR. Regression models and life-tables (with discussion). J Roy Statist Soc. 1972;34:187–220. [Google Scholar]
- 18.Howlader N, Ries LA, Mariotto AB, Reichman ME, Ruhl J, Cronin KA. Improved estimates of cancer-specific survival rates from population-based data. J Natl Cancer Inst. 2010;102(20):1584–1598. [DOI] [PMC free article] [PubMed] [Google Scholar]
- 19.Mariotto AB, Noone AM, Howlader N, et al. Cancer survival: an overview of measures, uses, and interpretation. J Natl Cancer Inst Monogr. 2014;2014(49):145–186. [DOI] [PMC free article] [PubMed] [Google Scholar]
- 20.U.S. Preventive Services Task Force. Screening for colorectal cancer: An evidence update for the U.S. Preventive Services Task Force. Rockville, MD: Agency for Healthcare Research and Quality, U.S. Department of Health and Human Services;2020. [Google Scholar]
- 21.American Cancer Society. Colorectal Cancer Facts & Figures 2020-2022. Atlanta, GA: American Cancer Society;2020. [Google Scholar]
- 22.Centers for Disease Control and Prevention National Center for Health Marketing (NCHM) Community Guide Branch. The Guide to Community Preventive Services. Cancer Prevention and Control: Increasing breast, cervical, and colorectal cancer screening; http://www.thecommunityguide.org/cancer/index.html. Accessed 4/11/2019. [Google Scholar]
- 23.Fitzpatrick-Lewis D, Ali MU, Warren R, Kenny M, Sherifali D, Raina P. Screening for Colorectal Cancer: A Systematic Review and Meta-Analysis. Clinical colorectal cancer. 2016;15(4):298–313. [DOI] [PubMed] [Google Scholar]
- 24.Elmunzer BJ, Hayward RA, Schoenfeld PS, Saini SD, Deshpande A, Waljee AK. Effect of flexible sigmoidoscopy-based screening on incidence and mortality of colorectal cancer: a systematic review and meta-analysis of randomized controlled trials. PLoS medicine. 2012;9(12):e1001352. [DOI] [PMC free article] [PubMed] [Google Scholar]
- 25.Jodal HC, Helsingen LM, Anderson JC, Lytvyn L, Vandvik PO, Emilsson L. Colorectal cancer screening with faecal testing, sigmoidoscopy or colonoscopy: a systematic review and network meta-analysis. BMJ Open. 2019;9(10):e032773. [DOI] [PMC free article] [PubMed] [Google Scholar]
- 26.Zhang J, Cheng Z, Ma Y, et al. Effectiveness of Screening Modalities in Colorectal Cancer: A Network Meta-Analysis. Clinical colorectal cancer. 2017;16(4):252–263. [DOI] [PubMed] [Google Scholar]
- 27.Battat AC, Rouse RV, Dempsey L, Safadi BY, Wren SM. Institutional commitment to rectal cancer screening results in earlier-stage cancers on diagnosis. Ann Surg Oncol. 2004;11(11):970–976. [DOI] [PubMed] [Google Scholar]
- 28.Edwards BK, Ward E, Kohler BA, et al. Annual report to the nation on the status of cancer, 1975-2006, featuring colorectal cancer trends and impact of interventions (risk factors, screening, and treatment) to reduce future rates. Cancer. 2010;116(3):544–573. [DOI] [PMC free article] [PubMed] [Google Scholar]
- 29.Levin TR, Corley DA, Jensen CD, et al. Effects of Organized Colorectal Cancer Screening on Cancer Incidence and Mortality in a Large Community-Based Population. Gastroenterology. 2018;155(5):1383–1391 e1385. [DOI] [PMC free article] [PubMed] [Google Scholar]
- 30.Loomans-Kropp HA, Umar A. Increasing Incidence of Colorectal Cancer in Young Adults. Journal of cancer epidemiology. 2019;2019:9841295. [DOI] [PMC free article] [PubMed] [Google Scholar]
- 31.Mauri G, Sartore-Bianchi A, Russo AG, Marsoni S, Bardelli A, Siena S. Early-onset colorectal cancer in young individuals. Mol Oncol. 2019;13(2):109–131. [DOI] [PMC free article] [PubMed] [Google Scholar]
- 32.Siegel RL, Fedewa SA, Anderson WF, et al. Colorectal Cancer Incidence Patterns in the United States, 1974-2013. J Natl Cancer Inst. 2017;109(8). [DOI] [PMC free article] [PubMed] [Google Scholar]
- 33.Kelly JJ, Alberts SR, Sacco F, Lanier AP. Colorectal cancer in alaska native people, 2005-2009. Gastrointest Cancer Res. 2012;5(5):149–154. [PMC free article] [PubMed] [Google Scholar]
- 34.Siegel RL, Miller KD, Goding Sauer A, et al. Colorectal cancer statistics, 2020. CA Cancer J Clin. 2020;70(3):145–164. [DOI] [PubMed] [Google Scholar]
- 35.Conway AA, Gerry JM, Sacco F, Wren SM. High Prevalence of Adenomatous Polyps in Alaska Native People Aged 40-49 years. The Journal of surgical research. 2019;243:524–530. [DOI] [PubMed] [Google Scholar]
- 36.Nash SH, Meisner ALW, Zimpelman GL, Barry M, Wiggins CL. Cancer survival among Alaska Native people. Cancer. 2018;124(12):2570–2577. [DOI] [PMC free article] [PubMed] [Google Scholar]
- 37.Alaska Native Epidemiology Center. Alaska Native Colorectal Cancer Screening Report. Anchorage, AK: Alaska Native Tribal Health Consortium;2019. [Google Scholar]
- 38.de Moor JS, Cohen RA, Shapiro JA, et al. Colorectal cancer screening in the United States: Trends from 2008 to 2015 and variation by health insurance coverage. Preventive medicine. 2018;112:199–206. [DOI] [PMC free article] [PubMed] [Google Scholar]
- 39.Kalager M, Haldorsen T, Bretthauer M, Hoff G, Thoresen SO, Adami H-O. Improved breast cancer survival following introduction of an organized mammography screening program among both screened and unscreened women: a population-based cohort study. Breast Cancer Research. 2009;11(4):R44. [DOI] [PMC free article] [PubMed] [Google Scholar]
- 40.Zauber AG. The Impact of Screening on Colorectal Cancer Mortality and Incidence – Has It Really Made a Difference? Dig Dis Sci. 2015;60(3):681–691. [DOI] [PMC free article] [PubMed] [Google Scholar]
- 41.Neal RD, Tharmanathan P, France B, et al. Is increased time to diagnosis and treatment in symptomatic cancer associated with poorer outcomes? Systematic review. Br J Cancer. 2015;112(Suppl 1):S92–S107. [DOI] [PMC free article] [PubMed] [Google Scholar]
- 42.Søgaard M, Thomsen RW, Bossen KS, Sørensen HT, Nørgaard M. The impact of comorbidity on cancer survival: a review. Clin Epidemiol. 2013;5(Suppl 1):3–29. [DOI] [PMC free article] [PubMed] [Google Scholar]
- 43.Xu F, Rimm AA, Fu P, Krishnamurthi SS, Cooper GS. The Impact of Delayed Chemotherapy on Its Completion and Survival Outcomes in Stage II Colon Cancer Patients. PLOS ONE. 2014;9(9):e107993. [DOI] [PMC free article] [PubMed] [Google Scholar]
- 44.Ortiz-Ortiz KJ, Ramírez-García R, Cruz-Correa M, Ríos-González MY, Ortiz AP. Effects of Type of Health Insurance Coverage on Colorectal Cancer Survival in Puerto Rico: A Population-Based Study. PLOS ONE. 2014;9(5):e96746. [DOI] [PMC free article] [PubMed] [Google Scholar]
- 45.Redwood DG, Lanier AP, Johnston JM, Asay ED, Slattery ML. Chronic disease risk factors among Alaska Native and American Indian people, Alaska, 2004-2006. Prev Chronic Dis. 2010;7(4):A85. [PMC free article] [PubMed] [Google Scholar]
- 46.Lung MS, Trainer AH, Campbell I, Lipton L. Familial colorectal cancer. Intern Med J. 2015;45(5):482–491. [DOI] [PubMed] [Google Scholar]
- 47.Peters U, Bien S, Zubair N. Genetic architecture of colorectal cancer. Gut. 2015;64(10):1623–1636. [DOI] [PMC free article] [PubMed] [Google Scholar]
- 48.Peters U, Hutter CM, Hsu L, et al. Meta-analysis of new genome-wide association studies of colorectal cancer risk. Hum Genet. 2012;131(2):217–234. [DOI] [PMC free article] [PubMed] [Google Scholar]
- 49.Boardman LA, Lanier AP, French AJ, et al. Frequency of defective DNA mismatch repair in colorectal cancer among the Alaska Native people. Cancer Epidemiol Biomarkers Prev. 2007;16(11):2344–2350. [DOI] [PubMed] [Google Scholar]
- 50.Greenland S, Mansournia MA, Altman DG. Sparse data bias: a problem hiding in plain sight, bmj. 2016;352:i1981. [DOI] [PubMed] [Google Scholar]
- 51.Srinivasan S, Moser RP, Willis G, et al. Small is essential: importance of subpopulation research in cancer control. Am J Public Health. 2015;105 Suppl 3:S371–373. [DOI] [PMC free article] [PubMed] [Google Scholar]
- 52.Welch HG, Black WC. Overdiagnosis in cancer. J Natl Cancer Inst. 2010;102(9):605–613. [DOI] [PubMed] [Google Scholar]