Abstract.
Optical-resolution photoacoustic microscopy (OR-PAM) has demonstrated fast, label-free volumetric imaging of optical-absorption contrast within the quasiballistic regime of photon scattering. However, the limited numerical aperture of the ultrasonic transducer restricts the detectability of the photoacoustic waves, thus resulting in incomplete reconstructed features. To tackle the limited-view problem, we added an oblique illumination beam to the original coaxial optical-acoustic scheme to provide a complementary detection view. The virtual augmentation of the detection view was validated through numerical simulations and tissue-phantom experiments. More importantly, the combination of top and oblique illumination successfully imaged a mouse brain in vivo down to 1 mm in depth, showing detailed brain vasculature. Of special note, it clearly revealed the diving vessels that were long missing in images from original OR-PAM.
Keywords: optical-resolution photoacoustic microscopy, limited view phenomenon, oblique illumination, mouse cerebral diving vessels
1. Introduction
Photoacoustic (PA, also known as optoacoustic) tomography (PAT), based on the PA effect,1,2 encompasses a collection of implementations, including PA microscopy (PAM) and PA computed tomography (PACT). Upon optical excitation by a short light pulse and the following energy conversion, the PA waves generated from excited molecules in the light-absorbing region always have positive initial pressures. Further, tissue boundaries, such as blood vessels, are usually acoustically smooth. Thus, the PA waves propagate normal to the local boundaries.3 Consequently, the visibility of the boundaries in the reconstructed image depends on the detection angle and the position of the acoustic detector in the system.4,5
To completely reconstruct the features of an absorbing structure of arbitrary shape, ideally the PA signals should be acquired over all the solid angles spanned by the structure’s boundary normal vectors, usually steradians. However, a three-dimensional (3-D) spherical transducer array is currently cost prohibitive, and scanning a detector to cover all solid angles is time-consuming. In fact, even in PACT, which desires full-view detection for reconstruction, hemispheric6 and ring-shape7 designs are more common in cutting-edge systems for practical applications, such as cerebral vascular imaging.8 Even so, the cost for the entire detector array and corresponding data acquisition system remains a barrier to broader implementation.
In contrast, scanning-based PAM can provide higher resolution within a shallower imaging depth in tissue, typically one order of magnitude less deep than PACT.9 Accordingly, PAM, especially OR-PAM, has been widely used to characterize features near the surface of tissue at various scales10–12 or to image thin tissue slices.13 Although the illumination of PAM is localized compared with the wide-field illumination in PACT, PAM can still suffer from a limited detection view for specific absorber geometries.14 However, implementing spherical detection would create further limitations on its applicability and make it more difficult to maintain confocal alignment with the excitation beam for applications requiring fast scanning.15,16
Several alternative solutions have been proposed to overcome the limited view problem in PAT. Huang et al.17 used an acoustic reflector to create a mirror image of a transducer array orthogonal to the real ones. Shu et al.18 employed two linear transducer arrays and Guo et al.19 rotated one linear array to increase the view angle.
Apart from engineering improvements to acoustic detection, a solution from another perspective is to generate nonuniform excitation within a large homogeneous absorbing structure by engineering the optical illumination. Gateau et al.20 demonstrated that the invisible structures in the original image could be retrieved using dynamic speckles generated from a scattered coherent light source for nonuniform illumination. Wang et al.21 used focused ultrasonic waves to thermally encode location information in the illuminated region.
However, none of these methods were tailored for or demonstrated on an OR-PAM system, although the concepts could be employed there as well. To date, there are only limited reports on the limited-view problem in PAM. For instance, Liu et al.14 exploited nonhomogeneous illumination generated by an objective with a numerical aperture (NA) as high as 0.3 to increase the visibility of vertical structures imaged by OR-PAM. Wang et al.22 generated nonuniform heating by a focused laser pulse preceding the excitation laser pulse, which enabled homogeneous structures to be imaged.
In this study, we present an approach that is compatible with conventional OR-PAM and can virtually augment the detection view. This approach involves introducing a second illumination beam focused at the original confocal region and around 45 deg off the axis of acoustic detection. As a result, structures along the direction of the acoustic axis that could not be imaged by the conventional top illumination beam can be imaged with the off-axis beam. For long structures along the oblique optical axis, the generated cylindrical PA waves are still detectable by the original ultrasonic transducer. Therefore, the oblique illumination provides a complementary detection view to the conventional OR-PAM. This approach allows the new system to inherit the original PA detection geometry, which provides excellent signal-to-noise-ratio (SNR). The first part of this paper describes numerical simulations to validate the efficacy of the proposed approach. Then, the virtual augmentation of the detection view is demonstrated in a phantom experiment and by in vivo mouse brain imaging.
2. Numerical Simulation
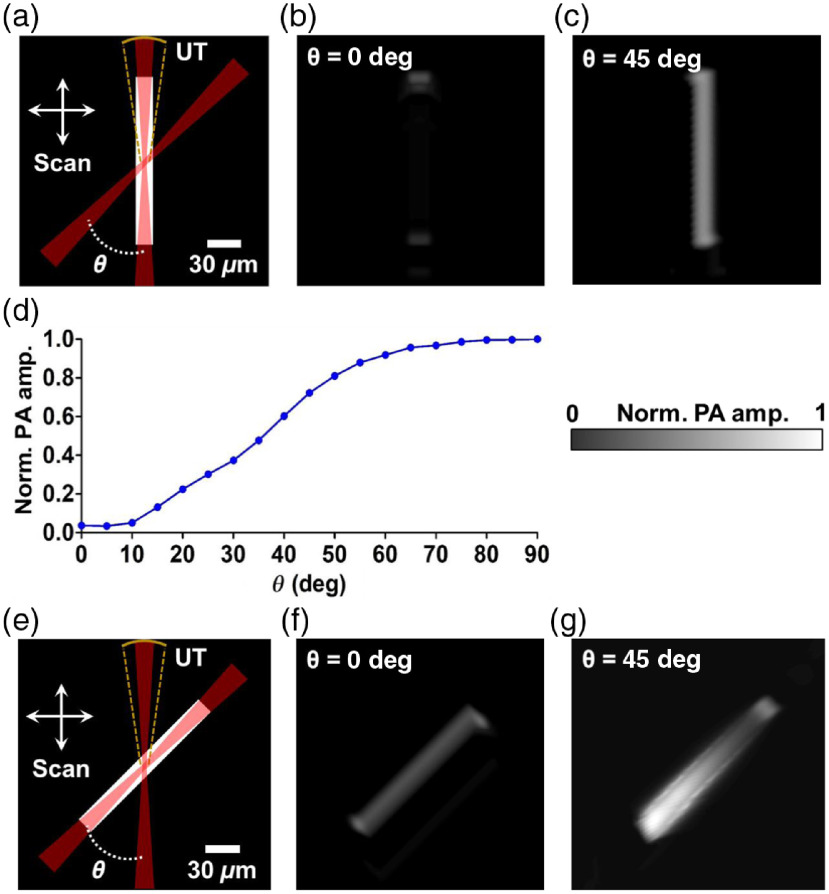
To validate the virtually augmented detection view angle provided by dual-axis illumination PAM (DAI-PAM), we simulated the PA wave propagation from a vessel-mimicking phantom with two different orientations using the k-Wave toolbox.23–25 Figure 1(a) shows the schematic of the simulation and the phantom in the vertical orientation. The phantom was a two-dimensional (2-D) absorptive bar that was long and wide. The sizes of the phantom were close to those of the cortical vessels of a mouse brain observed in a previous report.26 The phantom was illuminated by a Gaussian beam focused by a lens () from the vertical and the oblique directions, respectively. We used a wavelength of 1045 nm to provide deeper imaging than possible with visible wavelengths.27 Confocally aligned with the vertical beam, the simulated ultrasonic transducer at the top had a 50-MHz central frequency, a 100% bandwidth, and an NA of 0.15. Images of the phantoms from both top illumination and oblique illumination were formed by raster-scanning over the horizontal and the vertical directions.
Fig. 1.
Numerical simulation of the virtually augmented view angle of DAI-PAM. (a) Schematics of the simulation for the vertical phantom, which was imaged, respectively, with two Gaussian beams, one from the top, and the other from the upper right at an inclined angle (both with an ). The PA signals were detected by a focused ultrasonic transducer (UT) with an and a central frequency of 50 MHz. Two-dimensional scanning was applied to form an image. (b)–(c) The images formed by raster-scanning the phantom with the top and oblique illumination, respectively. The entire vertical feature was missed in (b). (d) The dependence of the received PA waves on the inclined angle. (e) Schematics of the simulation for the 45-deg oblique phantom. (f)–(g) The images formed by raster-scanning the phantom with the top and oblique illumination at , respectively. The phantom absorber could be reconstructed with both the top and oblique illumination.
As seen in Fig. 1(b), the simulated image demonstrates the limited view for the vertical phantom in conventional OR-PAM. This phenomenon results from the long depth of focus of the top illumination beam (around ), where the illumination is relatively homogeneous and the energy deposition generates a cylindrical PA wave propagating horizontally. Therefore, the ultrasonic detector on top of the phantom vessel, with a fairly limited NA, can locate only the signals from the top and the bottom boundaries.
When the vertical phantom vessel is illuminated at 45 deg, the light-absorbing region reduces to an approximate acoustic point source and radiates spherical PA waves that are detectable by the top transducer. As shown in Fig. 1(c), the image formed by raster-scanning of the phantom shows improved visibility of the entire vertical vessel. Ideally, the efficiency of receiving cylindrical waves reaches the maximum when the beam has a 90-deg inclination. However, as shown in Fig. 1(d), even a 45-deg inclination provides a useful improvement (75% of the optimal performance) and is more compatible with most in-vivo applications, where a reflection-mode geometry is preferred. These simulation results validate that these two illumination beams provide complementary detection views so that the entire detection view of the system is augmented.
A schematic of the simulation for the phantom in the oblique orientation of 45 deg to the vertical direction is shown in Fig. 1(e). Compared with the vertical phantom image, the structure of the oblique phantom can be fully reconstructed with the top illumination beam, as shown in Fig. 1(f). The better visibility relative to the vertical phantom also results from the effect of acoustic point source radiation, which is similar to the case of the vertical phantom illuminated by the oblique beam.
Figure 1(g) shows a simulation where the oblique beam is used to illuminate the oblique phantom at the same inclined angle. In this case, the oblique illumination provides worse resolution for the oblique targets than the top illumination because of the larger illumination volume. The PA signals at different locations of the reconstructed image depend on the relative positions between the illuminated regions and the top transducer. Figure 2 shows the propagation of the PA waves upon the optical excitation at three different locations on the phantom.
Fig. 2.
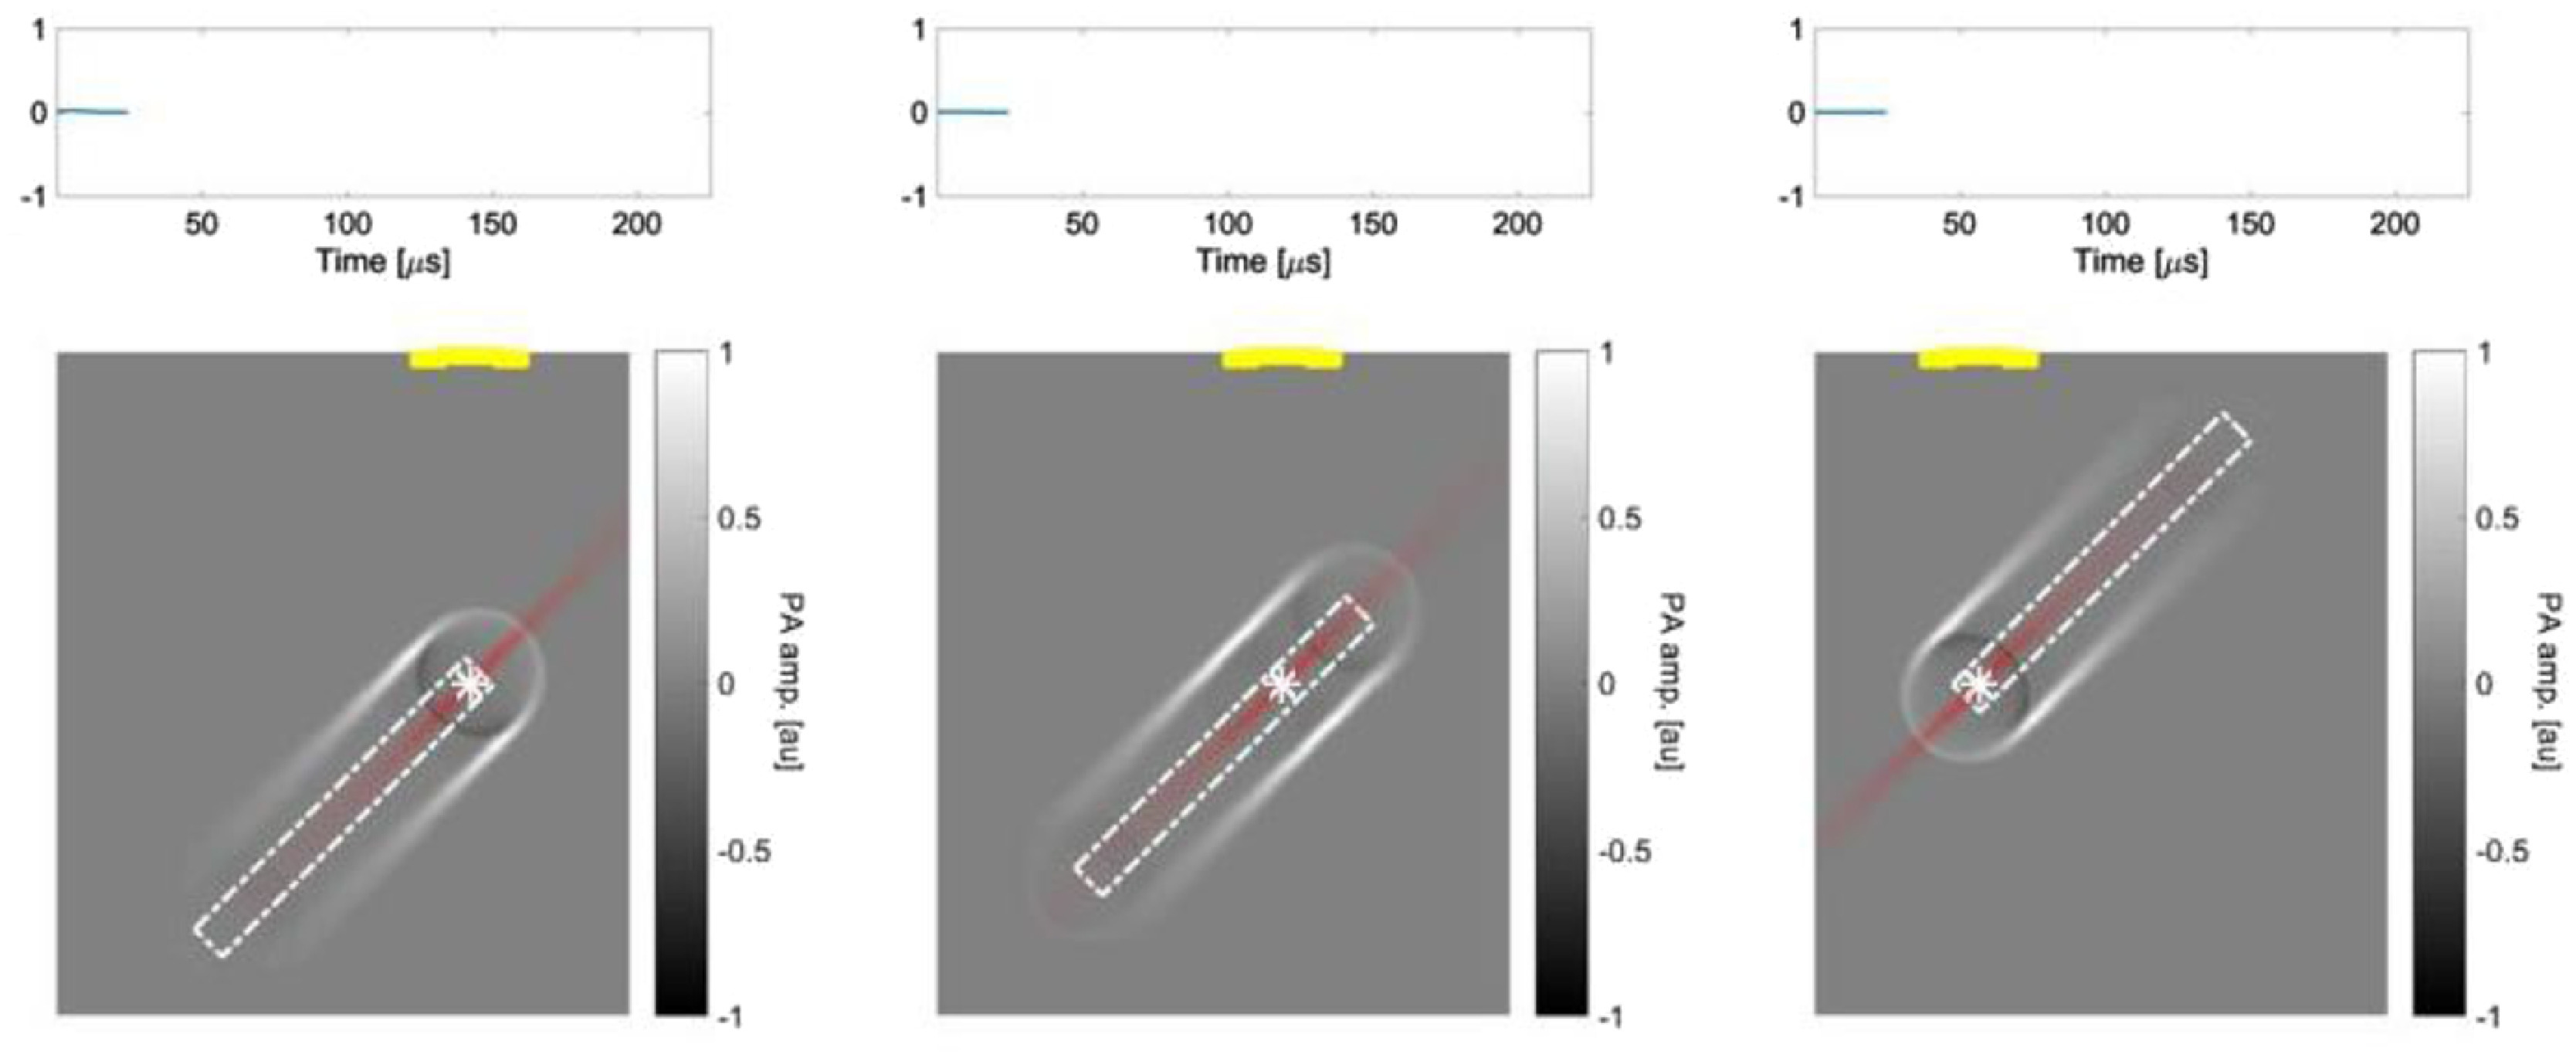
A still image of Video 1 (MPEG, 0.89 MB [URL: https://doi.org/10.1117/1.JBO.23.7.076001.1).
3. Experimental Setup and Methods
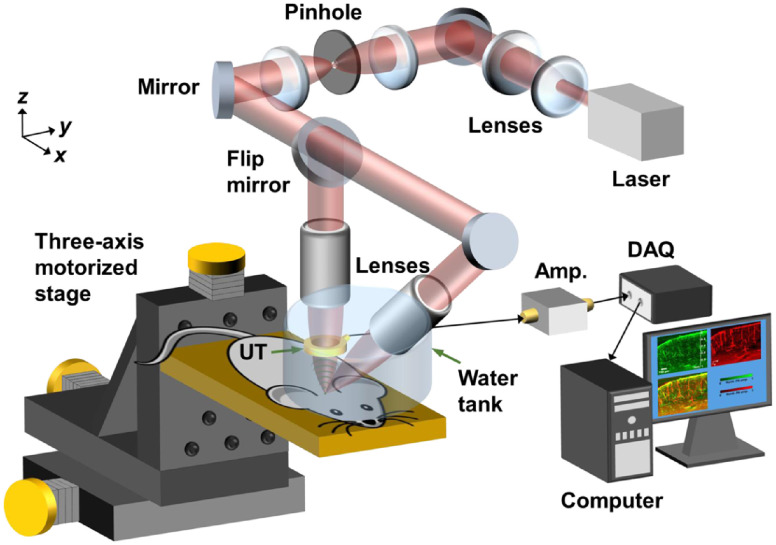
Figure 3 shows the experimental setup. A Q-switched Nd:YLF laser ( pulse duration, INNOSLAB, Edgewave) operated at wavelength of 1047 nm generates laser pulses for optical excitation. The laser beam is expanded and collimated by a convex lens and a concave lens to fill the back apertures of the vertical and oblique objectives. Then, the laser beam passes through an optical spatial filter consisting of a pinhole and a 4F optical system to keep only the fundamental mode of the beam. A nonpolarizing beamsplitter with 30:70 R:T ratio (BSS11, Thorlabs) splits the laser beam for direction to the vertical and the oblique objectives. Each lab-built objective lens assembly consists of an achromatic doublet (AC127-025-A, Thorlabs) and a correction lens to compensate for optical focusing in water. To set up the oblique illumination beam, a protractor was first used to coarsely align the lab-built objective lens with the vertical objective lens at an inclination of 45 deg. A digital camera was then employed to track the positions of the two focused beam spots until fine confocal alignment was achieved. The acoustic detection was done by a custom-made-focused ring-shaped ultrasonic transducer (35-MHz central frequency, 80% bandwidth, Resource Center for Medical Ultrasonic Transducer Technology, University of Southern California) with a 2-mm hole in the center for transmitting the laser beam. The focal zone of the ring transducer had a calculated lateral diameter of around and was confocally aligned with the optical foci.
Fig. 3.
Schematic of DAI-PAM system. UT, ultrasonic transducer; Amp., amplifier; DAQ, data acquisition card. The beam was first expanded by a concave lens and a convex lens, then spatially filtered by a pinhole and a 4F optical system before focusing through the vertical and the oblique custom-designed objectives. Volumetric scans were done by three-axis motorized stages. The received PA signals were amplified and then acquired by a DAQ card before saving to a hard disk drive.
Images were formed by raster-scanning the object three-dimensionally with motorized translation stages (PLS-85, PI miCos GmbH), with a step size of , which is around one-third of the lateral resolution in each direction. For oblique illumination, each A-line in a B-scan image parallel to the plane mapped to an obliquely illuminated region. Therefore, a proper shear transformation was implemented to recover the real geometry of the imaged objects. By imaging a vertically mounted hair phantom with the oblique illumination beam, a B-scan image in the plane could be used to determine the inclined angle of the beam, which was around 48 deg after the fine confocal alignment, as presented in the Appendix.
The lateral resolution for each beam was experimentally measured by imaging an Air Force resolution target (#58-198, Edmund Optics). A ring-shaped phantom (in the plane) made of a knotted carbon fiber bundle embedded in 3% agar gel was then imaged to validate the virtual augmentation of detection view. In addition, a 6-week-old mouse brain was imaged in vivo as a demonstration. The mouse was anesthetized by isoflurane during the entire experiment. Craniotomy was performed on the parietal bone of the skull, and then images of the cerebral vasculature down to around 1-mm deep in the cortex were acquired. All experimental animal procedures were carried out in conformity with laboratory animal protocols approved by the Animal Studies Committee of California Institute of Technology.
4. Results
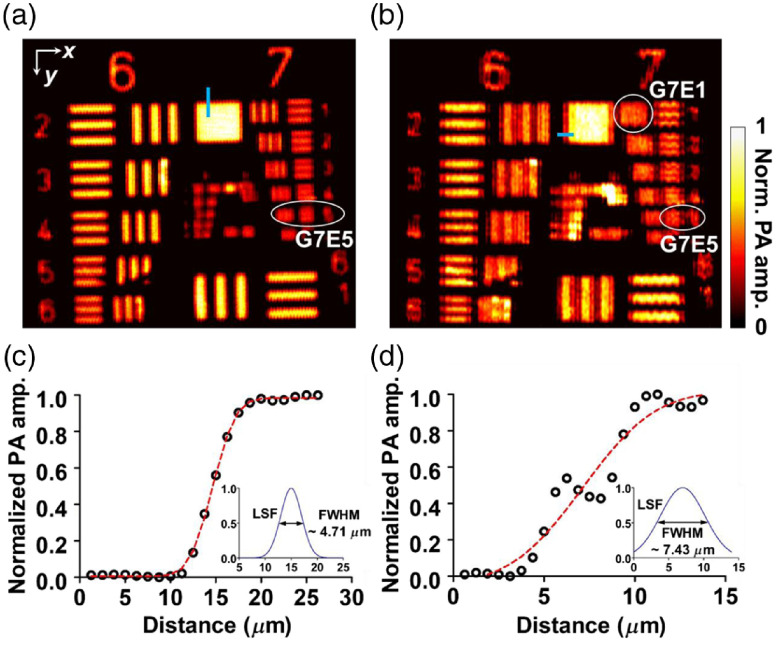
Figures 4(a) and 4(b) show images of the resolution target with the top and oblique illuminations, respectively. Based on the modulation transfer function analysis, the top illumination image has a cutoff spatial frequency at group 7, element 5 (G7E5) in both the and directions, respectively. However, the oblique illumination image shows an asymmetric lateral resolution, with a cutoff spatial frequency at group 7, element 1 (G7E1) in the direction. The corresponding full width at half maximum (FWHM) resolutions are around for G7E5 and for G7E1, which are concordant with the edge profile analysis shown in Figs. 4(c) and 4(d).
Fig. 4.
Spatial resolution tests of DAI-PAM with a USAF resolution target. (a) Imaging with the top illumination beam. Based on the modulation transfer analysis, the cutoff spatial frequencies in both the and directions were at group 7, element 5 (G7E5). (b) Imaging with the oblique illumination beam. The cutoff frequency in the direction is the same as in (a), but the cutoff frequency in the direction is at group 7, element 1 (G7E1). (c)–(d) Lateral resolution measured with the edge profile sampled from the thin blue areas in (a), and (b) respectively.
In addition to the degraded resolution in the direction, the obliquely projected focal spot of the oblique illumination may also have introduced aberration into the image. For example, Fig. 4(b) shows some stripe artifacts around the group numbers. These may have resulted from the side lobes around the elliptical focal spot, and they deteriorate the image quality. Focus engineering can be implemented for side-lobe suppression and reduction of artifacts in the future.
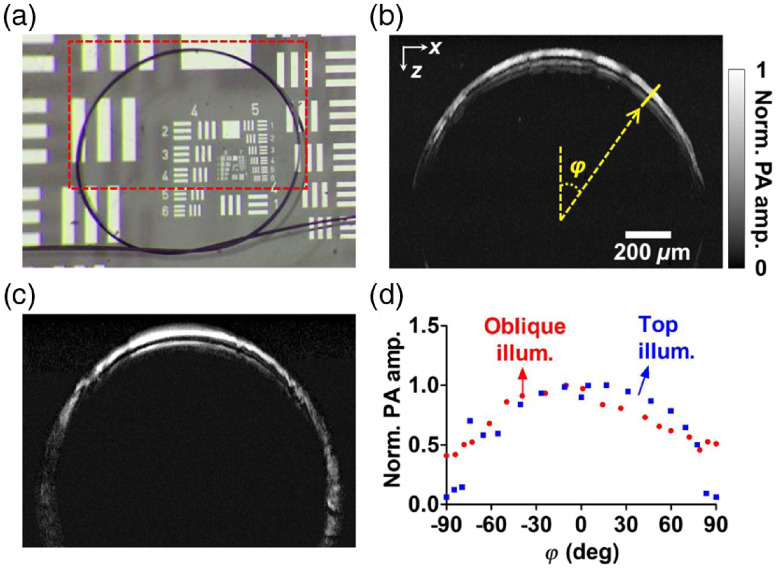
Another phantom, shown in Fig. 5(a), consisting of five carbon fibers each with diameter was then imaged with both beams, as shown in Figs. 5(b) and 5(c). In the top illumination image, the PA amplitude significantly decreases as the boundary normal direction on the phantom approaches horizontal. In the oblique illumination image, the vertical parts on the two sides of the phantom remain discernible. By picking peak values from the amplitude profiles of the crossed lines at different angles (denoted by ), the performance of the two illumination beams can be compared quantitatively, as shown in Fig. 5(d). For top illumination, the normalized average amplitude of the PA signals drops to around 0.12 when lies within the ranges of [, ] and [75 deg, 90 deg]. For oblique illumination, in contrast, the average signals are around 0.5 within the same range, an improvement of roughly four times.
Fig. 5.
(a) A photo of the phantom vessel comprised of five carbon fibers. Each of the fibers is around in diameter. (b)–(c) Images of the phantom in the red dashed region with the top illumination beam and the oblique illumination beam, respectively. (d) Peak PA amplitudes sampled at different angles in (b) and (c), as illustrated by the yellow line in (b).
In Fig. 5(c), we noticed that the PA amplitude on the lower left side of the phantom image is less visible than on the lower right side. This phenomenon could still be observed when we imaged the phantom with a rotation of 180 deg along the -axis but with the signals recovered at a rotation angle of 90 deg. Therefore, we ruled out the possibility of artifacts in the phantom and thought that the phenomenon could have resulted from shadowing27 by the upper right side of the phantom (which partially blocked the oblique beam coming from the top right side), owing to the strong absorption of the thick fiber bundle.
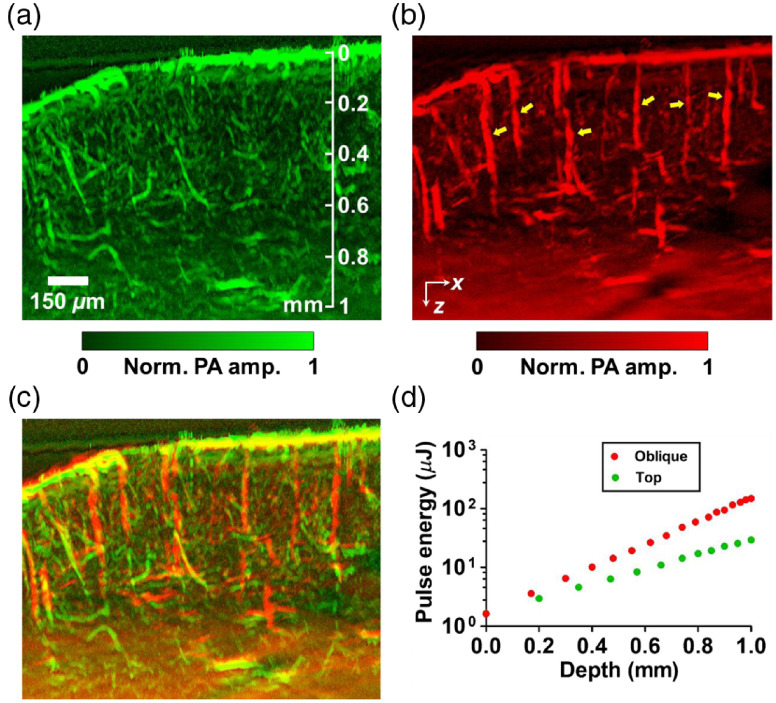
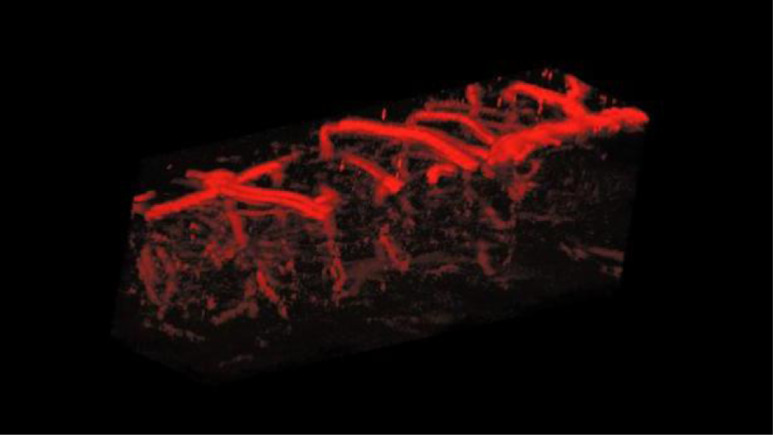
A further demonstration was performed by in-vivo mouse brain imaging. Figure 6 shows maximum-amplitude-projected (MAP) images along the -direction with around thickness. The top illumination image, in Fig. 6(a), shows abundant vasculature in the mouse cortex. However, several diving vessels that extend inward to the deeper brain from the surface of the cortex are invisible at a greater depth. In contrast, the oblique illumination image in Fig. 6(b) clearly resolves the diving vessels. The overlaid image in Fig. 6(c) shows a dual-view mouse brain vascular image made with OR-PAM. Figure 7 shows a volumetric rendering of the overlapped image. An increase in the pulse energy along the imaging depth was used for both the top and oblique illumination, as shown in Fig. 6(d).
Fig. 6.
In vivo DAI-PAM imaging of a mouse brain with (a) the top illumination beam, and (b) the oblique illumination beam. The oblique illumination virtually augments the detection view so that vertical diving vessels (as illustrated by yellow arrows) become visible, unlike in the top illumination scheme of conventional OR-PAM. (c) Overlapped image presenting dual-view vasculature of the mouse cortex. (d) Pulse energies used at different depths for the top (green) and oblique (red) illuminations.
Fig. 7.
A still image of Video 2 (MPEG, 4.15 MB [URL: https://doi.org/10.1117/1.JBO.23.7.076001.2).
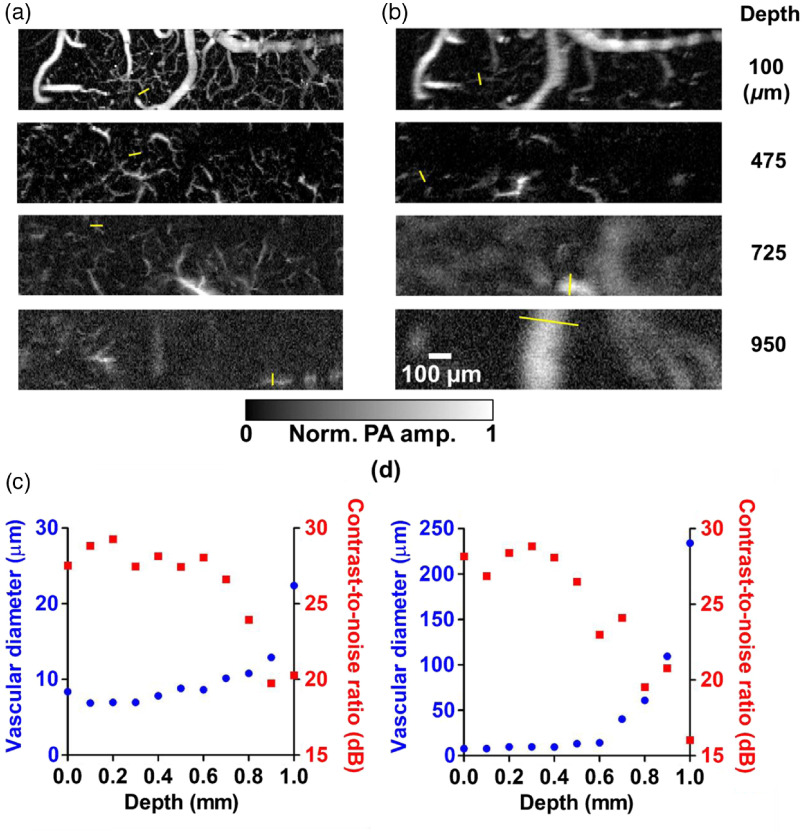
Figures 8(a) and 8(b) show top-view MAP images of a mouse cortex at various depths, imaged by the top and oblique beams, respectively. The MAP depth ranges are for the top illumination images and for the oblique illumination images, values that are within the focal depths along the direction for these two illumination directions. To characterize the depth-dependent transition of lateral resolution, we analyzed the FWHM of the line profile (as illustrated by the yellow bar in the images) across the tiniest vessel that could be found in the images at various depths, and quantified the corresponding contrast-to-noise ratios (CNRs) around the sampled regions, as shown in Figs. 8(c) and 8(d). With CNRs , the confidence of the measurements of the vessel diameters is . The imaged vessel diameters characterize the upper limits of the lateral resolution along the depth direction. The resolution significantly worsens at large depths. For the top illumination, the minimum vascular diameter imaged at depth is twice the minimum diameter imaged on the surface. For the oblique illumination, doubling of the imaged minimum vascular diameter on the surface happens at depth. This phenomenon reflects the different optical path lengths of the top beam and the oblique beam.
Fig. 8.
Maximum amplitude projection (MAP) images at different depths in a mouse brain acquired in vivo, and analysis of vascular diameters. The top illumination image in (a) displays more features than the oblique illumination image (b). The oblique illumination images start to blur at a shallower depth than the top illumination images because the lateral resolution is degraded by optical scattering due to the longer optical path length of the oblique illumination beam in the brain tissue. The depth-dependent lateral resolutions (shown in blue points) were characterized by picking out the smallest vessels within the field of view of the top illumination images (c) and the oblique illumination images (d), as illustrated by the yellow bars in (a) and (b). The corresponding estimated contrast-to-noise ratios (CNRs) around the sampled regions are shown in red squares in (c) and (d).
5. Discussion
In our previous study,28 we demonstrated that PA signals propagating through of brain tissue and of water have a frequency spectrum that can be most readily detected with a 50-MHz transducer. Therefore, ideally we should have used a 50-MHz transducer in our experiments. However, the performance of custom-made, noncommercial ring transducers varies among different examples. Because of an obvious superiority in sensitivity, we chose to use a particular 35-MHz transducer in this study instead of other 50-MHz ring transducers available in the laboratory.
In addition to providing a complementary detection view to conventional OR-PAM, the off-axis geometry of the oblique illumination also offers advantages as dark field imaging, in which signals generated outside the overlapped region of the optical and the acoustic focal zones become less effective to be detected.29 Therefore, surface signal shadowing, which is due to strong acoustic reverberation from absorbers at superficial depth such as highly dense vasculature in a mouse brain, can be reduced, and the PA signals can be better revealed when imaging deep tissues.30
The spatial resolution of the oblique illumination in a plane normal to the inclined optical axis is optically determined and is the same as that of the top illumination. The resolution on the inclined optical axis is acoustically determined, and worse than the axial resolution of the top illumination by a factor of , owing to the inclination angle. However, in the laboratory coordinate system, the resolvability in the horizontal and vertical directions with the oblique illumination could be either optically or acoustically determined, depending on the structures to be resolved. For a thin structure such as the coating on the resolution target, the resolvability in the horizontal or vertical direction was optically determined, as shown in Fig. 4.
While performing the in vivo mouse brain imaging, optical attenuation, including absorption and scattering in the cerebral tissue, has to be taken into account. In our experiment, a near-infrared wavelength was used to increase the penetration depth over that available by visible wavelengths, where hemoglobin, has higher optical absorption.27,31 To maintain a similar signal-to-noise ratio (SNR) at different imaging depths, the pulse energy was adaptively increased at greater depths. In addition, the increment in pulse energy along the depth was larger for the oblique illumination beam than for the top illumination beam, owing to the longer optical path length of that beam. At a depth of 1 mm, the ratio of pulse energies between the oblique and the top beams was around 5 for the two beams. The longer optical path length for the oblique illumination beam also results in faster deterioration of the optical focusing due to optical scattering. As shown in Fig. 8(b), below a depth of 0.8 mm, the lateral resolution was not enough to resolve small vessels that are visible in Fig. 8(a).
Currently, DAI-PAM imaging is demonstrated by raster-scanning the 3-D motorized stage holding the imaged object. For further applications such as full-view monitoring of cerebral hemodynamics, a higher imaging speed will be required. This can be implemented using the geometry of dual-beam illumination on a fast-scanning imaging head or by applying a tunable acoustic gradient lens.32 Moreover, the degradation of lateral resolution due to optical scattering may be partially mitigated within a certain depth range by implementing PAM with adaptive optics.33
DAI-PAM could also benefit quantitative multiwavelength PAM for measuring blood oxygenation in the cortex, such as the oxygen saturation in cerebral diving vessels demonstrated in this study. Because of the nonnegligible wavelength-dependent light attenuation in deep tissue, the main challenge is getting accurate values of oxygen saturation in the quasidiffusive regime (which, in a mouse brain, begins approximately at for the top illumination and for the oblique illumination, based on Fig. 8). By implementing either appropriate fluence models34 or introducing another controlled mechanism that is invariant with the local fluence,35 it is feasible to solve the inverse problem and measure the concentrations of oxy- and deoxy-hemoglobin in the future.
6. Conclusion
In this study, we reported that adding an oblique illumination beam could effectively expand the detection view of conventional OR-PAM. We explained the mechanism through numerical experiments and demonstrated its feasibility by performing phantom experiments and in vivo mouse brain imaging. The dual-view results presented here show that DAI-PAM is promising for cerebral vascular imaging and is potentially useful for other biomedical applications, such as studying the angiogenesis of tumors or lymphatic imaging.
Supplementary Material
Acknowledgments
The authors appreciate Professor James Ballard’s kind help with editing the article. L.W. has a financial interest in Microphotoacoustics, Inc., CalPACT, LLC, and Union Photoacoustic Technologies, Ltd., which, however, did not support this work.
Biographies
Hsun-Chia Hsu received his BS and MS degrees in physics National Taiwan University. Currently, he is a graduate student in biomedical engineering at Washington University in St. Louis and a visiting student at the California Institute of Technology under the supervision of Dr. Lihong Wang. His research focuses on the developments and applications of optical-resolution photoacoustic microscopy.
Lihong V. Wang received his PhD from Rice University, Houston, Texas. Currently, he holds the Bren Professorship of medical engineering and electrical engineering at the California Institute of Technology. He has published 470 peer-reviewed articles in journals and has delivered 460 keynote, plenary, or invited talks. His Google scholar h-index and citations have reached 116 and 56,000, respectively.
Biographies for the other authors are not available.
Appendix.
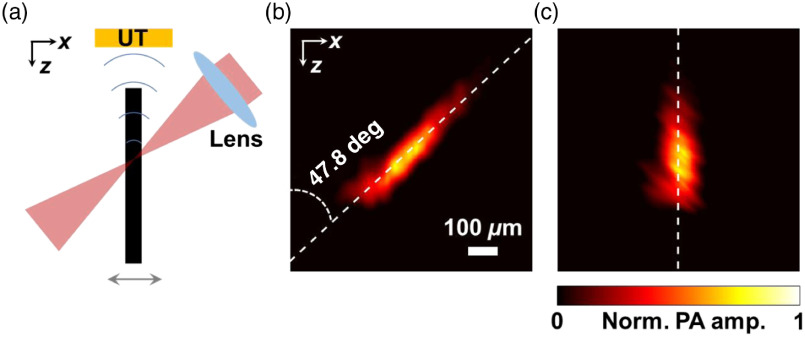
To determine the inclined angle of the oblique illumination beam, we used the oblique illumination beam to acquire a B-scan image of a vertical hair phantom along the plane (which contains the optical axes of both the top and oblique beams). The A-lines within the B-scan image contain PA signals generated from different regions on the phantom illuminated by different parts of the oblique beam. As a result, the B-scan image, shown in Fig. 9, profiles the spatial orientation of the oblique beam. The oblique angle can be determined to be 47.8 deg by fitting the pattern linearly with the least squares method.
Fig. 9.
(a) A vertically mounted hair phantom was imaged with the oblique illumination along the plane to measure the inclined angle more precisely. (b) The original B-scan image profiled the orientation of the oblique beam. The inclined angle was calculated to be 47.8 deg after linear fitting by the least squares method. (c) The real orientation of the object was recovered by implementing a proper shear transformation to the original B-scan image.
Disclosure
This work was supported in part by National Institutes of Health grants DP1 EB016986 (NIH Director’s Pioneer Award), R01 CA186567 (NIH Director’s Transformative Research Award), R01 EB016963, U01 NS090579 (BRAIN Initiative), and U01 NS099717 (BRAIN Initiative).
References
- 1.Xia J., Yao J., Wang L. V., “Photoacoustic tomography: principles and advances,” Electromagn. Waves (Camb) 147, 1 (2014). 10.2528/PIER14032303 [DOI] [PMC free article] [PubMed] [Google Scholar]
- 2.Deán-Ben X. L., et al. , “Advanced optoacoustic methods for multiscale imaging of in vivo dynamics,” Chem. Soc. Rev. 46, 2158 (2017). 10.1039/C6CS00765A [DOI] [PMC free article] [PubMed] [Google Scholar]
- 3.Guo Z., Li L., Wang L. V., “On the speckle-free nature of photoacoustic tomography,” Med. Phys. 36, 4084 (2009). 10.1118/1.3187231 [DOI] [PMC free article] [PubMed] [Google Scholar]
- 4.Preisser S., et al. , “Vessel orientation-dependent sensitivity of optoacoustic imaging using a linear array transducer,” J. Biomed. Opt. 18, 026011 (2013). 10.1117/1.JBO.18.2.026011 [DOI] [PubMed] [Google Scholar]
- 5.Shu W., et al. , “Broadening the detection view of 2D photoacoustic tomography using two linear array transducers,” Opt. Express 24, 12755 (2016). 10.1364/OE.24.012755 [DOI] [PubMed] [Google Scholar]
- 6.Kruger R. A., et al. , “Photoacoustic angiography of the breast,” Med. Phys. 40, 113301 (2010). 10.1118/1.4824317 [DOI] [PMC free article] [PubMed] [Google Scholar]
- 7.Xia J., et al. , “Retrospective respiration-gated wholebody photoacoustic computed tomography of mice,” J. Biomed. Opt. 19, 016003 (2014). 10.1117/1.JBO.19.1.016003 [DOI] [PMC free article] [PubMed] [Google Scholar]
- 8.Li L., et al. , “Single-impulse panoramic photoacoustic computed tomography of small-animal whole-body dynamics at high spatiotemporal resolution,” Nat. Biomed. Eng. 1, 0071 (2017). 10.1038/s41551-017-0071 [DOI] [PMC free article] [PubMed] [Google Scholar]
- 9.Wang L. V., Yao J., “A practical guide to photoacoustic tomography in the life sciences,” Nat. Methods 13, 627 (2016). 10.1038/nmeth.3925 [DOI] [PMC free article] [PubMed] [Google Scholar]
- 10.Estrada H., et al. , “Real-time optoacoustic brain microscopy with hybrid optical and acoustic resolution,” Laser Phys. Lett. 11, 045601 (2014). 10.1088/1612-2011/11/4/045601 [DOI] [Google Scholar]
- 11.Park K., et al. , “Handheld photoacoustic microscopy probe,” Sci. Rep. 7, 13359 (2017). 10.1038/s41598-017-13224-3 [DOI] [PMC free article] [PubMed] [Google Scholar]
- 12.Hu S., Maslov K., Wang L. V., “Second-generation optical-resolution photoacoustic microscopy with improved sensitivity and speed,” Opt. Lett. 36, 1134 (2011). 10.1364/OL.36.001134 [DOI] [PMC free article] [PubMed] [Google Scholar]
- 13.Wong T. T. W., et al. , “Label-free automated three-dimensional imaging of whole organs by microtomy-assisted photoacoustic microscopy,” Nat. Commun. 8, 1386 (2017). 10.1038/s41467-017-01649-3 [DOI] [PMC free article] [PubMed] [Google Scholar]
- 14.Liu W., et al. , “Correcting the limited view in optical-resolution photoacoustic microscopy,” J. Biophotonics 11(2) (2018). 10.1002/jbio.201700196 [DOI] [PubMed] [Google Scholar]
- 15.Hsu H.-C., Wang L., Wang L. V., “In vivo photoacoustic microscopy of human cuticle microvasculature with single-cell resolution,” J. Biomed. Opt. 21, 056004 (2016). 10.1117/1.JBO.21.5.056004 [DOI] [PMC free article] [PubMed] [Google Scholar]
- 16.He Y., et al. , “In vivo label-free photoacoustic flow cytography and on-the-spot laser killing of single circulating melanoma cells,” Sci. Rep. 6, 39616 (2016). 10.1038/srep39616 [DOI] [PMC free article] [PubMed] [Google Scholar]
- 17.Huang B., et al. , “Improving limited-view photoacoustic tomography with an acoustic reflector,” J. Biomed. Opt. 18, 110505 (2013). 10.1117/1.JBO.18.11.110505 [DOI] [PMC free article] [PubMed] [Google Scholar]
- 18.Li G., et al. , “Multiview Hilbert transformation for full-view photoacoustic computed tomography using a linear array,” J. Biomed. Opt. 20, 066010 (2015). 10.1117/1.JBO.20.6.066010 [DOI] [PMC free article] [PubMed] [Google Scholar]
- 19.Shu W., et al. , “Broadening the detection view of 2D photoacoustic tomography using two linear array transducers,” Opt. Express 24, 12755 (2016). 10.1364/OE.24.012755 [DOI] [PubMed] [Google Scholar]
- 20.Gateau J., et al. , “Improving visibility in photoacoustic imaging using dynamic speckle illumination,” Opt. Lett. 38, 5188 (2013). 10.1364/OL.38.005188 [DOI] [PubMed] [Google Scholar]
- 21.Wang L., et al. , “Ultrasonic-heating-encoded photoacoustic tomography with virtually augmented detection view,” Optica 2, 307 (2015). 10.1364/OPTICA.2.000307 [DOI] [PMC free article] [PubMed] [Google Scholar]
- 22.Wang L., Zhang C., Wang L. V., “Grueneisen Relaxation Photoacoustic Microscopy,” Phys. Rev. Lett. 113, 174301 (2014). 10.1103/PhysRevLett.113.174301 [DOI] [PMC free article] [PubMed] [Google Scholar]
- 23.Treeby B. E., Cox B. T., “k-Wave: MATLAB toolbox for the simulation and reconstruction of photoacoustic wave fields,” J. Biomed. Opt. 15, 021314 (2010). 10.1117/1.3360308 [DOI] [PubMed] [Google Scholar]
- 24.Cox B. T., Beard P. C., “Fast calculation of pulsed photoacoustic fields in fluids using k-space methods,” J. Acoust. Soc. Am. 117, 3616 (2005). 10.1121/1.1920227 [DOI] [PubMed] [Google Scholar]
- 25.“MATLAB R2016b,” The MathWorks, Inc., Massachusetts, United States. [Google Scholar]
- 26.Horton N. G., et al. , “In vivo three-photon microscopy of subcortical structures within an intact mouse brain,” Nat. Photonics 7, 205 (2013). 10.1038/nphoton.2012.336 [DOI] [PMC free article] [PubMed] [Google Scholar]
- 27.Hai P., et al. , “Near-infrared optical-resolution photoacoustic microscopy,” Opt. Lett. 39, 5192 (2014). 10.1364/OL.39.005192 [DOI] [PMC free article] [PubMed] [Google Scholar]
- 28.Yao J., et al. , “High-speed label-free functional photoacoustic microscopy of mouse brain in action,” Nat. Methods 12, 407 (2015). 10.1038/nmeth.3336 [DOI] [PMC free article] [PubMed] [Google Scholar]
- 29.Shelton R. L., Applegate B. E., “Off-axis photoacoustic microscopy,” IEEE Trans. Biomed. Eng. 57, 1835 (2010). 10.1109/TBME.2010.2043103 [DOI] [PMC free article] [PubMed] [Google Scholar]
- 30.Maslov K., Stoica G., Wang L. V., “In vivo dark-field reflection-mode photoacoustic microscopy,” Opt. Lett. 30, 625 (2005). 10.1364/OL.30.000625 [DOI] [PubMed] [Google Scholar]
- 31.Yao J., Wang L. V., “Sensitivity of photoacoustic microscopy,” Photoacoustics 2, 87 (2014). 10.1016/j.pacs.2014.04.002 [DOI] [PMC free article] [PubMed] [Google Scholar]
- 32.Yang X., et al. , “Fast axial-scanning photoacoustic microscopy using tunable acoustic gradient lens,” Opt. Express 25, 7349 (2017). 10.1364/OE.25.007349 [DOI] [PubMed] [Google Scholar]
- 33.Jiang M., et al. , “Adaptive optics photoacoustic microscopy,” Opt. Express 18, 21770 (2010). 10.1364/OE.18.021770 [DOI] [PMC free article] [PubMed] [Google Scholar]
- 34.Cox B., et al. , “Quantitative spectroscopic photoacoustic imaging: a review,” J. Biomed. Opt. 17(6), 061202 (2012). 10.1117/1.JBO.17.6.061202 [DOI] [PubMed] [Google Scholar]
- 35.Wen G., Wang L., “Quantitative photoacoustic measurement of absolute oxygen saturation in deep tissue (conference presentation),” Proc. SPIE 10494, 104941B (2018). 10.1117/12.2287319 [DOI] [Google Scholar]
Associated Data
This section collects any data citations, data availability statements, or supplementary materials included in this article.


