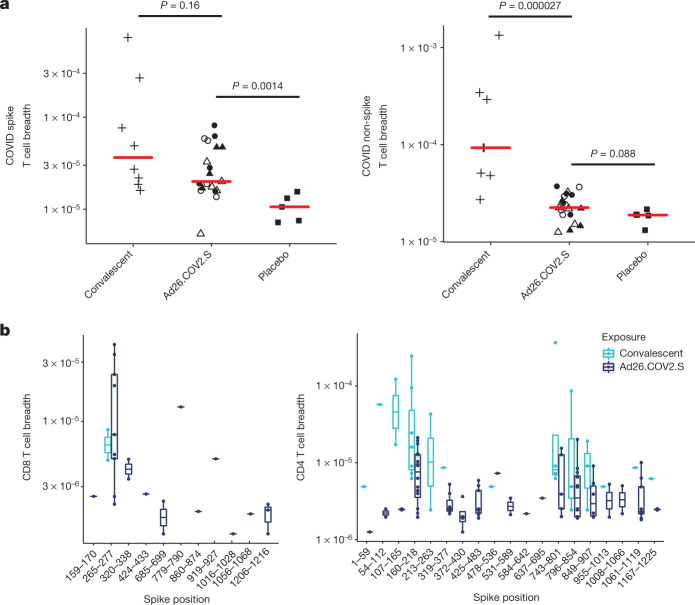
Fig. 4. TCRβ repertoire analysis.
a, Spike and non-spike T cell breadth by TCRβ sequencing on day 63. P values were determined by two-sided Wilcoxon rank-sum tests. Red bars reflect median responses. b, Breadth of spike-specific CD8+ and CD4+ T cell responses. Filled squares denote placebo–placebo; filled circles denote high dose–placebo; open circles denote high dose–high dose; filled triangles denote low dose–placebo; open triangles denote low dose–low dose; and plus signs denote convalescent samples. In the box-and-whisker plots, the middle line reflects the median, the box reflects the 25th–75th percentiles and the whiskers extend the full range up to 1.5× the interquartile range, with outlier points marked individually. n = 32 independent samples (8 SARS-CoV-2 convalescent individuals, 5 placebo recipients, 19 Ad26.COV2.S vaccine recipients).

