

Abstract
High pressure processing of pineapple has potential implication in food industry. The impact of high pressure (HP) processing and minimal processing, on quality parameters of pineapple was analysed. Changes in the pineapple quality in terms of texture, colour, total flavonoids, total polyphenols, vitamin C and sensory properties were investigated within the domain of 100–300 MPa and 5–20 min. Quality changes induced by HP processing was compared with the minimally processed pineapple. High pressure processing significantly (p < 0.0001) affect the firmness, total flavonoids, total polyphenols, vitamin C and colour values and were significantly increased in HP processed samples, while in minimal processed samples, these quality attributes exhibited a major degradation. On the basis of quality analysis, microbial quality and sensory assessment, high pressure treatment at 300 MPa for 10 min was found to be suitable for preserving the quality of pineapple up to 16th day in refrigeration condition.
Keywords: High pressure processing, Pineapple, Minimal processing, Textural property, Nutritional properties and colour deviation
Introduction
Pineapple (Ananus comosus, Bromeliaceae) is an important tropical fruit crop with excellent juiciness, energetic tropical flavor and many health benefits. The origin of pineapple could be traced to South America mainly in coastal Brazil, from where it disseminated to many tropical countries (Bartholomew et al. 2003). In India, the cultivation of pineapple is mostly restricted to areas with high rainfall, in humid coastal belt as well as in hilly areas of North East. At present, pineapple is commercially grown in Assam, Meghalaya, Tripura, Mizoram, West Bengal, Kerala, Karnataka and Goa.
The pineapple production in India is 1,711,000 MT in 2018–19 (Anon 2020a). Major portion of pineapple produced in India is exported to Saudi Arabia, Qatar, Maldives, UAE, Nepal, Oman and Bahrain, despite the huge domestic demand for pineapple. In addition to fresh fruit, pineapple is predominantly exported to these countries as processed products. The increase in export value of pineapple from 1664 to 3501 lakh during 2015–2018 indicates the worldwide demand for pineapple (Anon 2020b). The highly perishable nature, of this fruit demands novel technologies of preservation either in fresh or processed form, with desired quality.
The major concern in processing is to retain the nutritional quality, texture, colour along with extended shelf life. Investigation in minimal processing of pineapple has showed promising result up to nine days of storage (Sudheer et al. 2019). The widely adapted practice for enhancement of shelf life is thermal treatments, which usually affects natural colour, flavour and aroma in many fruits and vegetables, with an adverse impact on organoleptic and nutritional quality of the final product.
To attain a balance between microbial safety and quality, novel non thermal technologies like high pressure processing was investigated as a good alternative to thermal processing (Miguel-Pintado et al. 2013; Cheftel 1995; Deliza et al. 2005; Stinco et al. 2019; Yildiz et al. 2019). High pressure processing, with its minimal effect on the covalent bonds of compounds with low molecular-weight, like colour and flavor, is a viable option to preserve the nutritional quality and the delicate sensory attributes of fruits and vegetables (Oey et al. 2008; Ramirez et al. 2009; Miguel-Pintado et al. 2013; Pokhrel et al. 2019; Sun et al. 2019). Due to these facts many research ware carried out on high pressure processing cut pineapple (Aleman et al. 1998), pineapple juice (Aleman et al. 1996), osmodehydrated pineapple (Rastogi et al. 2000) and pineapple puree (Chakraborty et al. 2014, 2015). Aleman et al. 1998 mainly focused on effect of HPP on the microbial stability, but investigations on the influence of HP processing on quality parameters of cut pineapple have not been yet documented. It is therefore imperative to optimize the different pressure and time combinations of HP and to unravel its role in texture, colour and nutrients of this fruit. Moreover, during the storage of HP processed fruits and vegetables, various biochemical changes due to incomplete inactivation of enzyme and microorganisms might affect the quality which needs to be assessed. Hence, a comparative study was designed to assess the variations in various quality characteristics of pineapple due to HP processing and minimal processing.
Material and methods
Sample preparation
Pineapples (A. comosus L. Cv. Mauritius) were procured from the Thrissur, Kerala, India local market based on several factors like uniform maturity, ripeness and the apparently defect free appearance. Selected pineapples, after washing were peeled and cut into wedge shape of one centimetre thickness. Four number of pineapple pieces in each pouches were vacuum packed in composite film made of LLDPE, nylon and surlyn for HP processing. Another set of pineapples were minimally processed with best preservatives as reported by Sudheer et al. (2019).
HP processing of pineapple
The three determinants of the efficacy of HP processing are temperature, pressure and exposure time. In the present study, only pressure and exposure time were considered for the treatment combinations. High pressure treatments of various combinations were performed at ICAR-Central institute of fisheries technology, Cochin, Kerala, India, in a high pressure processing equipment (Stansted fluid power Ltd. Essex, UK; Model: FPG7100:9/2C; UK). The pineapples were subjected to high pressure at three levels, viz., 100, 200 and 300 MPa for different holding times (5, 10, 15 and 20 min). All the experiments were carried out in room temperature with Di-2-ethyl-hexyl sebacate as the media for pressure transmission. During the process, pressurization rate was.
440 MPa/min and depressurization rate was 600 MPa/min. For every 100 MPa increase in pressure, the adiabatic heating of compression caused a temperature increase of 1 ± 0.5 °C, which was recorded in the system.
Minimal processing of pineapple
Minimal processing was carried out with two best pre-treatment combinations reported by Sudheer et al. (2019). The treatment combination for minimally processed pineapple were 1% NaCl (sodium chloride) + 1% CA (citric acid) + 0.05% SB (sodium benzoate) and 1% CaCl2 (calcium chloride) + 0.05% SB (sodium benzoate). Along with these treatments, one sample without any preservative treatment was vacuum packed and compared with HP processed samples.
All the HP processed, and non-HP processed (i.e., minimal processing) samples were stored under refrigerated condition (4 ± 1 °C temperature and 67 ± 3% relative humidity). Quality parameters of HP processed and minimally processed pineapples in terms of texture, colour, total polyphenols, total flavonoids, vitamin C and total plate count were determined during the storage.
Total flavonoids
Aluminium Chloride colorimetric method (Hossain and Rahman 2011) was utilised to measure the total content of flavonoids, which was expressed in mg rutin equivalents/g fresh sample.
Total polyphenol
Total phenol content was determined using the Folin–Ciocalteu reagent (Carloni et al. 2013) and expressed as Gallic Acid Equivalents (GAE) derived from linear regression value obtained from the gallic acid calibration curve plotted with absorbance values at 760 nm.
Firmness
Instrumental texture analysis of the minimally processed and HP processed pineapple were measured by Texture analyser (Model: EZ-SX500N). Sample was placed on heavy duty platform and cutting probe was lowered down to press the sample and Firmness values were recorded (Wu et al. 2012).
Colour
The colour was measured using CIELAB scale at 10° observer and D65 illuminant (Bierhals et al. 2011) in colour flex meter (Hunter Associates Laboratory, Inc., model: 65/10°). The total colour change (ΔE) is the parameter considered for the overall colour change. Fresh pineapple samples (L*, a*, b*) were used as the reference. Low ΔE value corresponds to a low colour change from the reference samples.
= .
The subscript “0” in the equation represents the colour value of fresh sample.
The yellowness index (YI) of pineapple samples was calculated by b* and L* value (Francis and Clydesdale 1975).
Vitamin C
Estimation of Vitamin C was done by volumetric method (Sadashivam and Manickam 1992).
Microbial analysis
Changes in the microbial population of minimally processed and HP processed pineapple samples were evaluated by total plate count (Silva et al. 2007).
Sensory analysis
The sensory evaluation of fresh, HP processed and minimally processed pineapple samples based on colour, texture, flavour, taste, and overall acceptability was judged on a 9 point Hedonic scale (Ranganna 1986) by a semi-trained judgement panel. Sensory evaluation was carried out after getting consent from the concerned committee after observing allergen hazards and microbial safety of the product. Sensory panel includes 15 members, in which seven male and eight female of age group between 22 and 45. The mean values of the scores obtained were taken for selecting the best sample.
Statistical analysis
All the experiments in the study were conducted in triplicate and mean values were reported. Factorial completely randomised design (FCRD) was used to analyse the data. The significance of each of the coefficients was assessed based on the p-values which, in turn provided a comprehensive evaluation of mutual interactions among the test parameters chosen as variables.
Result and discussion
Firmness
High pressure processing and non HP processing (Vacuum packed, NaCl + CA + SB and CaCl2 + SB pre-treatment) significantly affected the firmness value (p < 0.0001).
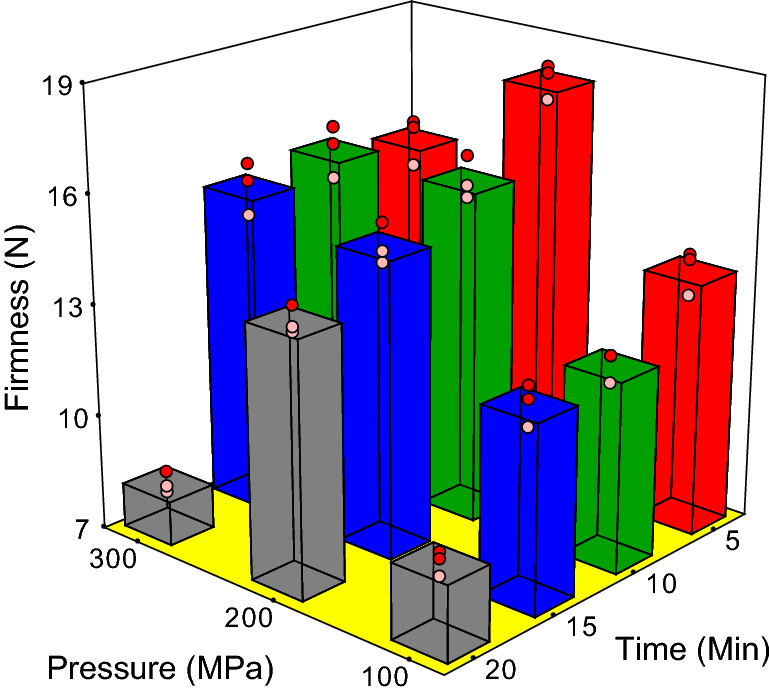
The average initial firmness value of pineapple was 9.96 N. On the 8th day of storage period HP processed samples showed higher firmness (Fig. 1) while non HP processed samples showed lower firmness. The highest firmness value in HP processed sample was 27.58 N, while in non HP processed samples, it was 8.72 N. The lower firmness value in non HP processed samples might be due to degradation of pectin. The higher firmness of HP processed samples might be due to contact of pectin methylesterase with substrate causing demethylation and a gel-network is formed by de-esterified pectin (low methoxy-pectin) with divalent ions (Miguel-Pintado et al. 2013). Among the HP processing treatments, firmness was lowest in samples treated at 300 MPa, which could be due to a lowering of turgor pressure following the disruptions in the integrity of the cell membrane (Tangwongchai et al. 2000). But at given pressure range there was no significant difference in the hardness with increase in holding time. Vazquez-guiterrez et al. (2011) had recorded similar findings in high pressure processed persimmons. On the 16th day of storage, two non HP processed samples (NaCl + CA + SB and CaCl2 + SB pre-treated sample) completely lost its firmness therefore, quality attributes were not analysed further. Firmness value decreased with respect to pressure and holding time on 16th day of storage period. On 16th day storage majority of HP processed samples retained firmness with an average firmness value of 13.77 N which was 38% higher than the initial firmness (Fig. 2).
Fig. 1.

Firmness of High Pressure processed pineapple on 8th day
Fig. 2.
Firmness of High Pressure processed pineapple on 16th day
Total polyphenols
The total polyphenols (TP) content of the fresh pineapple sample prior to treatment was 53.9 mg. g−1 and HP treatments had a highly significant (p < 0.0001) effect on TP content (Table 1). Total polyphenols of HP processed sample in different treatment ranged from 53.77–61.03 mg. g−1, on 8th day of storage. Non HP processed samples showed low TP content than high pressure processed samples. As pressure increased, total polyphenol increased significantly (p < 0.0001), while TP content was not affected significantly by varying holding times (p > 0.05). The increase in total polyphenols was maximum (13%) in samples treated at 300 MPa pressure and 20 min of holding time. High pressure induces distribution and aggregation of phenolic compounds resulting in an increased rate of mass transfer. The resultant increase in solvent penetration into the cells would disrupt the cell walls and hydrophobic bonds in the cell membrane, that eventually leads to high permeability and the release of certain phenolic components as observed by Denoya et al. (2017) and Landl et al. (2010) in cut peaches and apple puree, respectively. Among the non HP processed samples, vacuum packed sample showed higher TP content than other pre-treated samples and it was lower than the initial total polyphenols. An average reduction of 5% was observed from 8th day to 16th day of storage in HP treated samples (Table 2). However a slight decrease in TP content observed during storage could be due to the reaction of partially soluble polymers, the oxidation of phenolic compounds as well as the polymerisation of phenolics with proteins during storage (Cao et al. 2011).
Table 1.
Total polyphenols (mg. g−1) of HP processed and minimally processed samples on 8th day of storage
| Pressure (MPa) Time (Min) |
5 min | 10 min | 15 min | 20 min | Mean | |
|---|---|---|---|---|---|---|
| HP processing | 100 MPa | 53.77 | 54.38 | 55.10 | 55.89 | 54.78C |
| 200 MPa | 56.83 | 57.38 | 57.99 | 58.74 | 57.74B | |
| 300 MPa | 59.77 | 60.24 | 60.89 | 61.03 | 60.48A | |
| Mean | 56.62NS | 57.33 NS | 57.99 NS | 58.55 NS | ||
| CD for pressure: 1.88 | ||||||
| Minimal processing | Vacuum packed | 48.76 | ||||
| NaCl + CA + SB | 41.66 | |||||
| CaCl2 + SB | 37.78 | |||||
Different alphabets in upper case denotes the significant difference among mean value of main factors; NS: not significant
Table 2.
Total polyphenols (mg. g−1) of HP processed and minimally processed pineapple on 16th day of storage
| Pressure (MPa) Time (Min) |
5 min | 10 min | 15 min | 20 min | Mean | |
|---|---|---|---|---|---|---|
| HP processing | 100 MPa | 50.39 | 50.98 | 51.80 | 52.87 | 51.51C |
| 200 MPa | 52.57 | 53.78 | 54.29 | 54.79 | 53.85B | |
| 300 MPa | 55.56 | 56.89 | 57.29 | 57.89 | 56.90A | |
| Mean | 52.84 NS | 53.88 NS | 54.46 NS | 55.18 NS | ||
| CD for pressure: 1.76 | ||||||
| Minimal processing | Vacuum packed | 43.76 | ||||
| NaCl + CA + SB | Spoiled | |||||
| CaCl2 + SB | Spoiled | |||||
Different alphabets in upper case denotes the significant difference among mean value of main factors; NS: not significant
Vitamin C
The average vitamin C content of fresh pineapple sample was 22.85 mg.100 g−1. Vitamin C content of HP processed sample has increased and it ranged from 25.08–30.78 mg.100 g−1 on 8th day of storage period. In non HP processed pineapple, vitamin C content declined to 19.04, 11.9 and 6.11 mg.100 g−1, in vacuum packed, CaCl2 + SB and NaCl + CA + SB treated samples, respectively. The declining trend in vitamin C in minimally processed samples might be due to the reduced firmness which lead to leakage of juice from pineapple.
In HP treated samples there was significant increase (p < 0.0001) in vitamin C with increase in pressure and holding time (Fig. 3). The maximum increase in vitamin C content (40%) was recorded at 300 MPa and 20 min HP processing condition. Similar results were reported by Denoya et al. (2017) for fresh cut peaches. The enhanced permeabilization of the compressed cells, and the associated release of the cytosolic content into the extracellular space induced by HP processing could have a role in improved extractability of the compound.
Fig. 3.

Vitamin C content of High Pressure processed pineapple on 8th day
During storage, vitamin C showed significant decrease in vacuum packed samples than in HP treated samples. The average reduction in vitamin C content in HP processed samples was 10%, however vacuum packed sample showed 17% reduction with respect to 8th day storage. High pressure treated samples showed lower degradation than vacuum packed sample after 16th days of storage (Fig. 4). The better retention of vitamin C in HP treated samples were also observed by Andres et al. (2016) and Landl et al. (2010) for smoothies and apple puree, respectively.
Fig. 4.

Vitamin C content of High Pressure processed pineapple on 16th day
Total flavonoids
The initial TF content of fresh pineapple was 10.10 mg.g−1 and it was significantly affected by HP processing (p < 0.0001). The total flavonoid content of HP processed sample ranged from 10.77 to 13.90 mg.g−1 and non HP processed samples ranged from 6.83 to 8.38 mg.g−1. When compared with fresh sample, the total flavonoids content of the HP processed samples increased whereas that of non HP processed samples decreased.
In HP processed samples, as the pressure increased from 100 to 300 MPa there was a significant (p < 0.0001) increase in total flavonoid and it might be due the higher extractability in HP treated sample (Fig. 5). The highest total flavonoid value was recorded at 300 MPa and 20 min treatment combination whereas, lowest value was at 100 MPa and 5 min treated sample. These suggested that HP processing improved the bioavailability of flavonoids as documented by Roldan-Marin et al. (2009) in High pressure treated onion flavonoids. However, at 8th day storage HP processed samples had a higher retention of total flavonoids. The negative impact of storage on total flavonoids content was evident from the values in 16th day storage sample (Fig. 6). On the 16th day of storage period, the average reduction in total flavonoids in HP processed pineapple was 4% and in case of non HP processed sample it was 27% with respect to 8th day of storage, which clearly indicated the higher reduction of total flavonoids in non HP processed samples during storage.
Fig. 5.
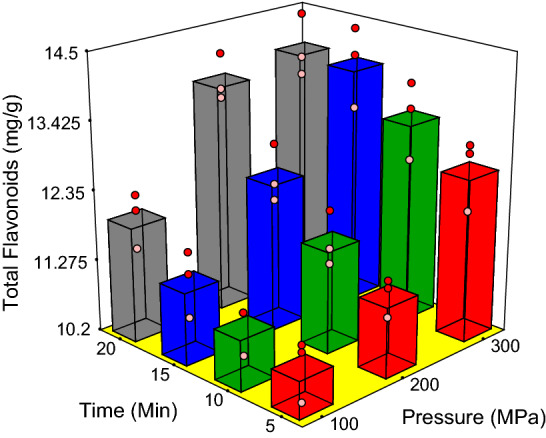
Total flavonoids in High Pressure processed pineapple on 8th day
Fig. 6.

Total flavonoids in High Pressure processed pineapple on 16th day
Colour characteristics
The CIELAB estimates for unprocessed pineapple was L* = 77.07, a* = 7.05 and b* = 47.46. There was significant variation in all the three colour parameter after HP processing and minimal processing (Table 3). The ΔE values between HP and non HP treated samples varied from 19.81 to 37.75 on 8th day. A higher ΔE value was reported in non HP processed samples, conversely HP processed samples reported the lower ΔE value. Among the HP processed pineapple the highest ΔE value of 29.05 was reported in lower pressure and exposure time, and better colour was maintained at high pressure. High pressure processing parameter had significant effect on ΔE value. A significant decrease was observed as the pressure increased from 100 to 200 MPa, while no significant difference was observed on 8th day of storage with holding time beyond 10 min. The reason for higher ΔE value of pineapple which were treated at low pressure may be due to the degradation of ascorbic acid to dehydro-ascorbic acid (Raj et al. 2019). As shown in Table 4 interaction of high pressure and holding time significantly affect the ΔE value. Variation of ΔE value on 16th day of storage followed similar trend of 8th day of storage. Average variation of ΔE value of HP processed sample was 4% however it was 19% in case of non HP processed samples on 16th day of storage. According to Oey et al. (2008), the chemical reactions in the food matrix caused by incomplete inactivation of enzymes and microorganisms might lead to a variation in colour of HP processed perishables like fruits and vegetables during storage.
Table 3.
ΔE and Yellowness value of HP processed and minimally processed pineapple on 8th day of storage
| Pressure (MPa) Time (Min) |
5 min | 10 min | 15 min | 20 min | Mean | 5 min | 10 min | 15 min | 20 min | Mean | |
|---|---|---|---|---|---|---|---|---|---|---|---|
| ΔE Value | Yellowness index | ||||||||||
| HP processing | 100 MPa | 29.06e | 24.78d | 23.20bcd | 24.01 cd | 25.26A | 126.08bc | 145.80d | 129.88c | 146.56d | 137.08A |
| 200 MPa | 25.04d | 20.03a | 21.25ab | 19.81a | 21.53B | 115.75abc | 110.67a | 122.77abc | 115.39ab | 116.14B | |
| 300 MPa | 21.78abc | 20.95ab | 21.44abc | 21.91abc | 21.52B | 127.55bc | 119.98abc | 110.89a | 123.81abc | 120.56C | |
| Mean | 25.29A | 21.92B | 21.97B | 21.91B | 123.12 NS | 125.49 NS | 121.18 NS | 128.59 NS | |||
| CD for pressure: 0.74; CD for time: 0.86 | CD for pressure: 4.0;CD for Time: Not significant | ||||||||||
| Minimal processing | Vacuum packed | 26.31 | 114.42 | ||||||||
| NaCl + CA + SB | 34.95 | 31.79 | |||||||||
| CaCl2 + SB | 26.45 | 37.75 | |||||||||
Different alphabets in upper case denotes the significant difference among mean value of main factors; Different alphabets in lower case denotes the significant difference among interaction value of pressure and time; NS: not significant
Table 4.
ΔE and Yellowness value of HP processed and minimally processed pineapple on 16th day of storage
| Pressure (MPa) Time (Min) | 5 min | 10 min | 15 min | 20 min | Mean | 5 min | 10 min | 15 min | 20 min | Mean | |
|---|---|---|---|---|---|---|---|---|---|---|---|
| ΔE Value | Yellowness index | ||||||||||
| HP processing | 100 MPa | 26.09 cd | 21.92ab | 24.45bcd | 26.50d | 24.74A | 144.19d | 115.71a | 142.32 cd | 120.15a | 130.59 NS |
| 200 MPa | 23.83bcd | 20.99a | 24.36bcd | 22.81ab | 22.99B | 128.43abc | 118.96a | 148.24d | 139.77bcd | 133.85 NS | |
| 300 MPa | 23.34ab | 24.30bcd | 23.68abc | 22.08ab | 23.35B | 127.71abc | 149.47d | 144.92d | 126.11ab | 137.05 NS | |
| Mean | 24.42A | 22.40B | 24.16A | 23.79A | 133.44B | 128.04C | 145.15A | 128.67BC | |||
| CD for pressure: 0.77; CD for time: 0.89 | CD for Time: 4.2 | ||||||||||
| Minimal processing | Vacuum packed | 31.31 | |||||||||
| NaCl + CA + SB | Spoiled | ||||||||||
| CaCl2 + SB | Spoiled | ||||||||||
Different alphabets in upper case denotes the significant difference among mean value of main factors; Different alphabets in lower case denotes the significant difference among interaction value of pressure and time; NS: not significant
The average yellowness index (YI) of HP processed pineapple varied from 110.89 to 145.80. From the Table 3 it is clear that, yellowness was enhanced by HP processing and remarkable reduction in yellowness was observed in non HP processed samples. High pressure have significant effect on yellowness index of pineapple (p < 0.0001), on the other hand holding time did not have significant effect on YI (p > 0.05). The maximum YI of 145.80 was recorded at 100 MPa pressure and 10 min of processing time, which was 21% higher than vacuum packed sample. During the storage period yellowness index did not show specific trend with respect to pressure and holding time combination, however the average YI increased on 16th day of storage. This might be due to the minimal effect of HP processing on covalent bonds of low molecular-weight compounds like those imparting colour.
Microbial analysis
In HP processed pineapple, microbial activity was evidenced at minimum pressure (100 MPa), whereas higher pressure (200 and 300 MPa) processed samples free from microbial activity. Minimally processed sample indicated higher microbial activity on 8th day of storage, though with permissible limits (Food safety and standards authority of India—FSSAI). Among the minimally processed samples, vacuum packed pineapple samples had comparatively less microbial load than other two.
As per the FSSAI (2018) standard maximum permissible microbial limits of aerobic colony count for cut or minimally processed and packed (non-thermally processed) fruit and vegetables was 1 × 10⁶ cfu/gm. In the present study microbial result of all the samples were within the limit set by FSSAI. Minimally processed samples was found to be microbial safe up to 8th day an HP processed samples was microbially safe even after 16th day of refrigerated storage (Table 5). High pressure processed aronia berry puree (Yuan et al., 2018) and blueberry juice (Barba et al. 2013) were also reported to be safe.
Table 5.
Microbial analysis of HP processed and minimally processed samples
| Sl. no | Treatment combinations | Total plate count (cfu) | ||
|---|---|---|---|---|
| Pressure and time | Time (Min) | |||
| 1 | High pressure processed samples on 16th day | 100 MPa | 5 | 1 × 10³ |
| 2 | 100 MPa | 10 | 2 × 10³ | |
| 3 | 100 MPa | 15 | 6 × 10³ | |
| 4 | 100 MPa | 20 | Nil | |
| 5 | 200 MPa | 5 | Nil | |
| 6 | 200 MPa | 10 | Nil | |
| 7 | 200 MPa | 15 | Nil | |
| 8 | 200 MPa | 20 | Nil | |
| 9 | 300 MPa | 5 | Nil | |
| 10 | 300 MPa | 10 | Nil | |
| 11 | 300 MPa | 15 | Nil | |
| 12 | 300 MPa | 20 | Nil | |
| 13 | Minimal processed pineapple on 8th day | Vacuum packed | 5 × 10³ | |
| 14 | CaCl2 + SB | 25 × 104 | ||
| 15 | NaCl + CA + SB | 29 × 104 | ||
Sensory evaluation
Sensory analysis is essential for any product development programme. Sensory analysis was conducted by semi-trained sensory panel. Minimally processed samples were spoiled after 16 days of storage, therefore only high pressure processed samples and vacuum packed samples were assessed on the basis of colour, taste, flavour, texture and overall acceptability characteristics using a nine-point hedonic scale. The HP treated products scored higher than vacuum packed sample during sensory analysis. These results are comparable with those obtained by Delgado-Adamez et al. (2013), who reported a better sensorial quality for high pressure processed olive jam at 600 MPa than traditional thermally treated sample. As the changes in the chemical composition of high pressures processed samples were lower, higher textural and flavour scores in these samples contributed to higher acceptance by the sensory panel.
Panellists preferred the pineapple samples treated with 200 and 300 MPa and it was observed that the holding time did not influence the sensorial attributes. Highest colour score of 8.1 and overall acceptability of 7.52 was observed in pineapple samples processed at 300 MPa. Highest yellowness index might be the reason for the highest colour scores for samples processed at elevated pressure. The sensory taste score (6.6) of high pressure processed pineapples indicated that pressure level of 200 MPa was considered best in terms of mouth taste, and the lowest value (4.7) was obtained for vacuum packed samples. The sensory analysis revealed that high pressure processing had no considerable adverse effect on the sensory characteristics of pineapple.
Conclusion
The study concluded that high pressure processed pineapple have superior textural and nutritional properties compared to minimally processed (Non HP processed) pineapple. High pressure processed sample retained higher firmness and better colour than the non HP processed samples. High pressure processing resulted in enhancement of total polyphenol, total flavonoids and vitamin C content by improving the extractability. The optimum parameters for HP processing of pineapple was 300 MPa pressure and 10 min exposure time. Minimal processing and refrigeration storage could preserve the firmness and nutritional property for 8 days. However HP processing is superior in term of product quality up to 16th day of refrigeration storage. Further investigation should focus on HP process optimization with preservatives and long term storage studies.
Acknowledgement
Present research work is financially assisted by Indian Council of Agricultural Research (ICAR) through National Fellow project.
Footnotes
Publisher's Note
Springer Nature remains neutral with regard to jurisdictional claims in published maps and institutional affiliations.
Contributor Information
Sudheer Kundukulangara Pulissery, Email: kp.sudheer@kau.in.
Sankalpa Kallahalli Boregowda, Email: Sankalpabgowda.27@gmail.com.
Saranya Suseela, Email: sarankalu@gmail.com.
Bindu Jaganath, Email: bindujaganath@gmail.com.
References
- Aleman GD, Ting EY, Farkas DF, Mordre SC, Hawes AC, Torres JA. Comparison of static and step-pulsed ultra-high pressure on the microbial stability of fresh cut pineapple. J Sci Food Agri. 1998;76(3):383–388. doi: 10.1002/(SICI)1097-0010(199803)76:3<383::AID-JSFA958>3.0.CO;2-P. [DOI] [Google Scholar]
- Aleman GD, Walker M, Farkas DF, Torres JA, Ting EY, Mordre SC. Pulsed ultra high pressure treatments for pasteurization of pineapple juice. J Food Sci. 1996;61(2):388–390. doi: 10.1111/j.1365-2621.1996.tb14200.x. [DOI] [Google Scholar]
- Andres V, Vivaracho LM, Guillamon VMJ, Tenorio MD. High hydrostatic pressure treatment and storage of soy-smoothies: Colour, bioactive compounds and antioxidant capacity. LWT Food Sci Technol. 2016;69:123–130. doi: 10.1016/j.lwt.2016.01.033. [DOI] [Google Scholar]
- Anonymous, 2020. https://www.indiastat.com/table/agriculture-data/2/pineapple-production/1343588/14866/data.aspx. Accessed on 27th July 2020.
- Anonymous, 2020. https://www.indiastat.com/table/foreign-trade-data/12/exports/91/1116386/data.aspx. Accessed on 27th July 2020.
- Barba FJ, Esteve MJ, Frigola A. Physicochemical and nutritional characteristics of blueberry juice after high pressure processing. Food Res Int. 2013;50(2):545–549. doi: 10.1016/j.foodres.2011.02.038. [DOI] [Google Scholar]
- Bartholomew D, Paull R, Rohrbach K. The pineapple botony production and used. New York, USA: CAB International; 2003. [Google Scholar]
- Bierhals VS, Chiumarelli M, Hubinger MD (2011) Effect of cassava starch coating on quality and shelf life of fresh-cut pineapple (Ananas ComosusL.Merrilcv “Perola”). J Food Sci 76 1 62–72 [DOI] [PubMed]
- Cao X, Bi X, Huang W, Wu J, Liao, Changes of quality of high hydrostatic pressure processed cloudy and clear strawberry juices during storage. Innov Food Sci Emerg Technol. 2011;16:181–190. doi: 10.1016/j.ifset.2012.05.008. [DOI] [Google Scholar]
- Carloni P, Tiano L, Padella L. Antioxidant activity of white, green and black tea obtained from the same tea cultivar. Food Res Int. 2013;53(2):900–908. doi: 10.1016/j.foodres.2012.07.057. [DOI] [Google Scholar]
- Cheftel JC. Review: High-pressure, microbial inactivation and food preservation. Food Sci Technol Int. 1995;1:75–90. doi: 10.1177/108201329500100203. [DOI] [Google Scholar]
- Chakraborty S, Rao PS, Mishra HN. Effect of pH on enzyme inactivation kinetics in high-pressure processed pineapple (Ananas comosus L.) puree using response surface methodology. Food Bioprocess Technol. 2014;7(12):3629–3645. doi: 10.1007/s11947-014-1380-0. [DOI] [Google Scholar]
- Chakraborty S, Rao PS, Mishra HN. Kinetic modeling of polyphenoloxidase and peroxidase inactivation in pineapple (Ananas comosus L.) puree during high-pressure and thermal treatments. Innov Food Sci Emerg Technol. 2015;27:57–68. doi: 10.1016/j.ifset.2014.11.003. [DOI] [Google Scholar]
- Deliza R, Rosenthal A, Abadio FBD, Silva CHO, Castillo C. Application of high pressure technology in the fruit juice processing: benefits perceived by consumers. J Food Eng. 2005;67:241–246. doi: 10.1016/j.jfoodeng.2004.05.068. [DOI] [Google Scholar]
- Delgado-Adameza J, Francoa MN, Sancheza J, De Miguelb C, Ramireza MR, Martín-Vertedora D. Comparative effect of high pressure processing and traditional thermal treatment on the physicochemical, microbiology, and sensory analysis of olive jam. Grasas Aceites. 2013;64(4):432–441. doi: 10.3989/gya.023613. [DOI] [Google Scholar]
- Denoya GI, Vaudagna SR, Onica CV, Chamorro M, Godoy F, Budde CO, Polenta GA. Suitability of different varieties of peaches for producing minimally processed peaches preserved by high hydrostatic pressure and selection of process parameters. LWT Food Sci Technol. 2017;78:367–372. doi: 10.1016/j.lwt.2017.01.006. [DOI] [Google Scholar]
- Francis FJ, Clydesdale FM. Theory and Applications. Food Colorimetry. Westport CN: AVI Publishing; 1975. [Google Scholar]
- FSSAI (2018) Food safety and standards authority of India. Part III-sec. 4, Controller of Publications, Delhi.
- Hossain MA, Rahman SMM. Total phenolics, flavonoids and antioxidant activity of tropical fruit pineapple. Food Res Int. 2011;44(3):672–676. doi: 10.1016/j.foodres.2010.11.036. [DOI] [Google Scholar]
- Landl A, Abadias M, Sarraga C, Vinas I, Picouet PA. Effect of high pressure processing on the quality of acidified Granny Smith apple puree product. Innov Food Sci Emerg Technol. 2010;11:557–564. doi: 10.1016/j.ifset.2010.09.001. [DOI] [Google Scholar]
- Miguel-Pintado C, Nogales S, Fernandez-Leon AM, Delgado-Adamez J, Hernandez T, Lozano M, Canada-Canada F, Ramirez R. Effect of hydrostatic high pressure processing on nectarine halves pretreated with ascorbic acid and calcium during refrigerated storage. LWT Food Sci Technol. 2013;54:278–284. doi: 10.1016/j.lwt.2013.05.026. [DOI] [Google Scholar]
- Oey I, Lille M, Van-Loey A, Hendrickx M. Effect of high-pressure processing on colour, texture and flavour of fruit- and vegetable-based food products: a review. Trends Food Sci Technol. 2008;19:320–328. doi: 10.1016/j.tifs.2008.04.001. [DOI] [Google Scholar]
- Pokhrel PR, Toniazzo T, Boulet C, Oner ME, Sablani SS, Tang J, Barbosa-Cánovas GV. Inactivation of Listeria innocua and Escherichia coli in carrot juice by combining high pressure processing, nisin, and mild thermal treatments. Innovative Food Sci Emerg Technol. 2019;54:93–102. doi: 10.1016/j.ifset.2019.03.007. [DOI] [Google Scholar]
- Raj AS, Chakraborty S, Rao PS. Thermal assisted high-pressure processing of Indian gooseberry (Embilica officinalis L.) juice–impact on colour and nutritional attributes. LWT Food Sci Technol. 2019;99:119–127. doi: 10.1016/j.lwt.2018.09.051. [DOI] [Google Scholar]
- Ramirez R, Saraiva J, Perez Lamela C, Torres JA. Reaction kinetics analysis of chemical changes in pressure assisted thermal processing. Food Eng Rev. 2009;1:16–30. doi: 10.1007/s12393-009-9002-8. [DOI] [Google Scholar]
- Ranganna, Handbook of analysis of fruit and vegetable products. 2. New Delhi: Tata Mc-Graw-Hill Publication Limited; 1986. [Google Scholar]
- Rastogi NK, Angersbach A, Knorr D. Synergistic effect of high hydrostatic pressure pretreatment and osmotic stress on mass transfer during osmotic dehydration. J Food Eng. 2000;45(1):25–31. doi: 10.1016/S0260-8774(00)00037-6. [DOI] [Google Scholar]
- Roldan-Marin E, Sanchez-Moreno C, Lloria R, Begona-de-Ancos M, Pilar-Cano, Onion high-pressure processing: Flavonol content and antioxidant activity. LWT Food Sci Technol. 2009;42:835–841. doi: 10.1016/j.lwt.2008.11.013. [DOI] [Google Scholar]
- Sadashivam S, Manickam A. Biochemical methods for agricultural sciences. New Delhi: Wiley Eastern Ltd; 1992. pp. 199–201. [Google Scholar]
- Silva RPS, Verdin SEF, Pereira DC, Schatkoski AM, Rott MB, Corçao G. Microbiological quality of minimally processed vegetables sold in Porto Alegre. Brazil Braz J Microbiol. 2007;389(4):594–598. doi: 10.1590/S1517-83822007000400003. [DOI] [Google Scholar]
- Stinco CM, Szczepańska J, Marszałek K, Pinto CA, Inácio RS, Mapelli-Brahm P, Barba FJ, Lorenzo JM, Saraiva JA, Meléndez-Martínez AJ. Effect of high-pressure processing on carotenoids profile, colour, microbial and enzymatic stability of cloudy carrot juice. Food Chem. 2019;299:125112. doi: 10.1016/j.foodchem.2019.125112. [DOI] [PubMed] [Google Scholar]
- Sudheer KP, Sankalpa KB, Saranya S. Effect of preservatives and temperature on microbial and physico-chemical attributes of minimally processed Pineapple. Int J Curr Microbiol Appl Sci. 2019;8(2):541–553. doi: 10.20546/ijcmas.2019.802.062. [DOI] [Google Scholar]
- Sun Y, Kang X, Chen F, Liao X, Hu X. Mechanisms of carrot texture alteration induced by pure effect of high pressure processing. Innovative Food Sci Emerg Technol. 2019;54:260–269. doi: 10.1016/j.ifset.2018.08.012. [DOI] [Google Scholar]
- Tangwongchai R, Ledward DA, Ames J. Effect of high-pressure treatment on the texture of Cherry Tomato. J Agric Food Chem. 2000;48(5):1434–1441. doi: 10.1021/jf990796p. [DOI] [PubMed] [Google Scholar]
- Vazquez-Guiterrez JL, Quiles A, Hernando I, Pernando I, Perez-Munuera, Changes in the microstructure and location of some bioactive compounds in persimmons treated by high hydrostatic pressure. Postharvest Biol Technol. 2011;61:137–144. doi: 10.1016/j.postharvbio.2011.03.008. [DOI] [Google Scholar]
- Wu Z, Zhanga M, Wang S. Effects of high-pressure argon and nitrogen treatments on respiration, browning and antioxidant potential ofminimally processed pineapples during shelf life. J Sci Food. 2012 doi: 10.1002/jsfa.5612. [DOI] [PubMed] [Google Scholar]
- Yildiz S, Pokhrel PR, Unluturk S, Barbosa-Cánovas GV. Identification of equivalent processing conditions for pasteurization of strawberry juice by high pressure, ultrasound, and pulsed electric fields processing. Innovative Food Sci Emer Technol. 2019;57:102195. doi: 10.1016/j.ifset.2019.102195. [DOI] [Google Scholar]
- Yuan B, Danao MGC, Stratton JE, Weier SA, Weller CL, Lu M. High pressure processing (HPP) of aronia berry puree: Effects on physicochemical properties, microbial counts, bioactive compounds, and antioxidant capacities. Innov Food Sci Emerg Technol. 2018;47:249–255. doi: 10.1016/j.ifset.2018.03.009. [DOI] [Google Scholar]