Abstract
The coronavirus pandemic has been globally impacting the health and prosperity of people. A persistent increase in the number of positive cases has boost the stress among governments across the globe. There is a need of approach which gives more accurate predictions of outbreak. This paper presents a novel approach called diffusion prediction model for prediction of number of coronavirus cases in four countries: India, France, China and Nepal. Diffusion prediction model works on the diffusion process of the human contact. Model considers two forms of spread: when the spread takes time after infecting one person and when the spread is immediate after infecting one person. It makes the proposed model different over other state-of-the art models. It is giving more accurate results than other state-of-the art models. The proposed diffusion prediction model forecasts the number of new cases expected to occur in next 4 weeks. The model has predicted the number of confirmed cases, recovered cases, deaths and active cases. The model can facilitate government to be well prepared for any abrupt rise in this pandemic. The performance is evaluated in terms of accuracy and error rate and compared with the prediction results of support vector machine, logistic regression model and convolution neural network. The results prove the efficiency of the proposed model.
Keywords: Coronavirus, Prediction, Diffusion, Support vector machine (SVM), Confirmed cases, Logistic regression (LR), Convolution neural network (CNN), Internet of things (IOT)
Introduction
Access to accurate outbreak prediction models is important to get the better understanding of the probable spread and after effects of contagious diseases. Governments and other statutory organizations majorly rely on outcomes from prediction models for suggesting new strategies. The novel coronavirus is caused by severe acute respiratory syndrome coronavirus 2 (SARS-CoV2) [1]. World Health Organization (WHO) perceived it as a global pandemic [2]. The disease Covid-19 has been become a pandemic due to unavailability of exact treatment, medicine or vaccine, high transmission rate, various mutations of the virus. The virus first appeared in Wuhan, China, and spread exponentially, infecting millions of people across the world [3, 4]. This coronavirus outbreak has now affected more than 218 countries and territories. USA is at the top with 21,857,616 confirmed cases, and India is at second position with 10,395,938 confirmed cases [5], 6.
To control the pandemic, most of the governments have been implementing lockdown as a primarily action to maintain social distancing. Although this step is admirable measure to control the further spreading of virus, it may raise the significant financial crisis. It may also affect the health of the people in terms of stress due to job loss and salary deductions. Specifically, in densely populated countries it may reduce the transmission rate; however, entire control on situation may not be achieved.
Existing mathematical models on theoretical epidemiology significantly contributed for mathematical epidemiology. Number of known and unknown parameters engaged in the spread of virus, the variant population-wide behaviour and different strategies followed in containment zones drastically increased the uncertainty for the existing models [7],8. Hence a suitable mathematical model would not be able to predict the disease. With the advancement of computational tools and software, complex mathematical model has been developed to analyse the disease thoroughly in a scientific manner. In the history of literature, many model-based studies have successfully achieved the global dynamics of the corresponding infectious disease [9–11]. Thus, standard prediction models are facing challenges in providing reliable results.
To overcome these challenges, many authors and researchers introduced new models but with assumptions like social distancing, quarantines, etc. [12–15]. However, nature of Covid-19 depends on these factors as well, so using a single model will not fulfil the need throughout the globe. Quantitative analysis is significantly required for prediction of Covid-19 disease. The simple quantitative and more accurate model can help the government agencies to make the decisions when to take decision for lockdown and unlock which may help to think of economically or healthwise. Unprecedented time and uncertainties linked with this disease may lead to prediction of inaccurate information. As per media sources, USA’s most effective coronavirus prediction model has amended its predictions as earlier predictions was too far from actual values.
Though many predefined machine learning algorithms were used for the prediction, none of them got very far in the accuracy of the model. With this motivation, the present study is introducing a prediction model which is based on the diffusion process of coronavirus disease as it is spreading from human contact [16, 17]. According to the information received, the disease may take around one week or less than a week for the exposure of symptoms of an infected person, although that person able to infect other persons during that period. The present work considers both the cases whether infected person is infecting other persons immediately or after a period. This is the novelty of the proposed model. The proposed novel model not only gives a better accuracy over other state-of-the-art models but also compute the prediction in a much lesser time. This paper assesses the occurrence of coronavirus cases in 4 countries, namely India (second worst position among all countries and territories), France, China (occurrence of first coronavirus case) and Nepal. The data considered for the present work are from March to January 2021.
The main objectives of the present work are:
In this paper, a diffusion-based prediction model is introduced to forecast the confirmed, active, recover and death cases called model as diffusion prediction model.
The study uses this prediction model to predict the future cases in India, France, China and Nepal.
The proposed model is a generalize model and extracting the data directly from John Hopkins University repository which is making use of IOT.
The present work also implemented two machine learning approaches SVM model, LR model and one deep learning approach CNN model to compare the performance in terms of accuracy and error rate. These three models are applied by authors in their work [18–20].
The rest of the paper is organized as follows: Section 2 presents the related work. Section 3 presents the diffusion prediction model for predicting the coronavirus cases. Section 4 discusses the materials and methods used in detail. Section 5 discusses the performance evaluation followed by results & discussions in Sect. 6. Section 7 concludes the present research work along with the limitation of the present work.
Related work
Recently, prediction of coronavirus outbreak has been the focused area by many of the researchers. Number of studies are now available in literature which discusses predictive analysis through various models.
Several statistical approaches based on time series [21], multivariate linear regression [22], grey forecasting models [23, 24], backpropagation neural networks [25, 26] and simulation models [27] have been introduced by authors to predict ubiquitous cases. Many authors have applied models on different applications [28–30]. In another study, authors discussed different factors that affect epidemics and determined the dissemination of the disease [31],32. Wang et al. presented the sparse logistic regression model for finalizing the image retrieval [33]. In contrary research, Kumar et al. applied fuzzy neural technique to predict the risk of parameters in a disease [9].
Recently in coronavirus pandemic situation, number of distinct models presented by authors to assess the rate, pervasiveness and mortality rate of coronavirus. In one of the studies, authors developed a model to forecast the status of coronavirus outbreak in China using statistical approaches [34]. Similar analysis was also conducted for Asia and other European countries [35]. In another work, authors introduced an algorithm to predict the death rate due to coronavirus in China [36]. Effective mortality rate is increased drastically due to the global effect of outbreak.
The global outbreak created a need to analyse and predict the occurrence patterns of coronavirus for other countries also. Sina et al. [37] presented a prediction of coronavirus outbreak in five countries using machine learning approach. Authors concluded that by integrating machine learning models with SEIR models, realistic prediction results can be achieved.
In another study, Singh et al. presented a support vector machine (SVM)-based prediction model to forecast the coronavirus cases for 10 countries having maximum number of coronavirus cases [18]. Yadav et al. [38] also presented the spreading pattern of coronavirus in the top ten infected countries. Authors considered the attributes confirmed, active, recovered and death cases for analysis. In contrary work, Amit et al. [39] presented a mathematical model to present the estimation of peak day for India, USA and Italy. Authors applied the bimodal Gaussian mixture model for forecasting of future cases. Aman et al. [40] introduced various prediction models to predict the coronavirus cases in densely populated countries using machine learning. Various studies applied different models for prediction of coronavirus cases in India. Santanu et al. presented forecasting of cases in India using autoregressive integrated moving average method [41]. Gaurav et al. introduced the predictions of outbreak in India using SEIR and regression model [42]. They analysed the cases till the end of March 2020. Ahmed et al. [43] presented a deep learning approach for prediction. They used the X-ray images for the prediction. Self-supervised learning is another emerging approach for prediction, but it requires immense computational power, which is hard to achieve, and it is very sensitive [44, 45]. Number of studies has presented the prediction of outbreak for India and other countries. Summary of all these approaches is given in Table 1. Each study has applied different approach and presented the accuracy with other performance metrics. However, still there is a scope of exploring models for improving the accuracy of the forecasting results. As per our knowledge through literature review, no one has used the diffusion-based prediction model for forecasting the outbreak.
Table 1.
Summary of models used for prediction of coronavirus outbreak
| Author/year | Model used | Duration | Countries considered |
|---|---|---|---|
| Singh et al. (2020) | SVM machine learning algorithm | 22 January 2020 to 25 April 2020 | China |
| Ardabili et al. (2020) | Adaptive network-based fuzzy inference system | 22 January 2020 to 18 March 2020 | Italy, Germany, Iran, USA and China |
| Ceylan (2020) | Regressive integrated moving average (ARIMA) | 21 February 2020 to 15 April 2020 | Italy, Spain and France |
| Fanelli and Piazza (2020) | Mean field kinetics | 22 January 2020 to 15 March 2020 | China, Italy and France |
| Li et al. (2020) | Function h(t) | 20 January 2020 to 11 February 2020 | China |
| Yadav et al. (2020) | Prophet machine learning algorithm | 22 January 2020 to 15 April 2020 | Italy, China, USA, Iran, Australia, Canada, France, UK, Spain |
| Singhal et al. (2020) | susceptible-infected-recovered (SIR) | 22 January 2020 to 6 June 2020 | India, Italy, and USA |
| Guo and He (2021) | Artificial neural network (ANN) | January 20 to 11 November 2020 | Worldwide |
| Roy et al. (2020) | Regressive integrated moving average (ARIMA) | 30 January 2020 to 26 April 2020 | India |
| Kulkarni et al. (2021) | Linear regression (LR) | 31 December 2019 to 16 May 2020 | India |
| Pandey et al. | SEIR | 30 January 2020 to 30 March 2020 | India |
| Chaurasia and Pal | Regressive integrated moving average (ARIMA) | 22 January 2020 to 29 June 2020 | Worldwide |
| Wieczorek et al. (2020) | Artificial neural network (ANN) | 30 January 2020 to 26 April 2020 | Worldwide |
| Albahli and Albattah (2020) | Convolution neural network (CNN) | NA | Worldwide |
Diffusion prediction model for prediction of corona virus
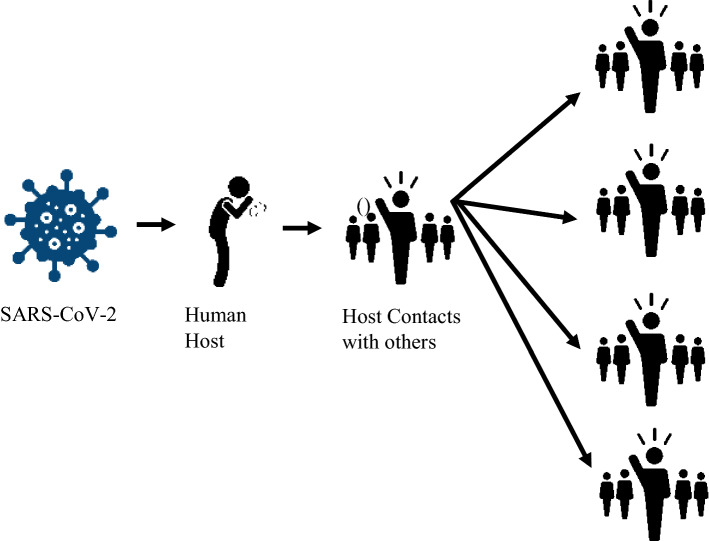
The model uses a process known as the diffusion process. Researchers have been using this process for forecasting of stock market [46], fake news [47], vaccination slot allotment, etc. The word 'diffusion’ has originated from the Latin word ‘diffundre’ hich means ‘to spread’. In 1962, Rogers defined diffusion as ‘the process in which an innovation is communicated through certain channels over time among the members of a social system’. According to him, diffusion of innovation process is basically the spread of a new idea from its source of invention to its end users. The term diffusion very much corelates here for the current pandemic ‘Diffusion process of coronavirus’. The process in which coronavirus is spreading through various channels from one host to another host in a social network as illustrated in Fig. 1. The diffusion of innovation process is dependent on the time series, and the process of spreading of epidemic is significantly sensitive to the origin of the time the epidemic started.
Fig. 1.
Diffusion process for corona virus spread
Process of adapting the new innovations and its spread has been studied over 30 years. Various authors used Rogers’s theory of diffusion of innovations in their research work (1995) [48]. Many of the studies shown the model’s relevance to technological innovations. Hence, the word 'technology' and 'innovation' can be interchanged. According to Roger’s model, the innovation, communication channels, time and social system are the main components of diffusion model.
In the proposed model, authors are considering SARS-CoV-2 as innovation and human contact as main communication channel because in diffusion innovation process, innovation is spreading through communication channels; here, coronavirus is spreading through human contact. Time can be ignored in behavioural research. In this model, time does not intervene explicitly. However, it can be used to predict the cases every month to view the larger picture of the rise in cases. Social system is the main component of proposed diffusion prediction model as entire diffusion process is influenced by the social structure or social behaviour. It is propagating rapidly through social contact of an infected host.
Diffusion prediction model forecasts the coronavirus cases in two forms. One is where model is considering the lag and second where model is working without considering lag. Lag defines the delay in attaining the maximum value. In the current work, lag supports the model to consider a case where the virus takes some time to spread to the next person after infecting one person. When model works without lag, it considers the virus to have immediate effect in the spread. Both the cases are very much important for the model to attain the accuracy as the covid cases start rising after a few days. Hence, in present work, lag () calculation is very crucial task. We can compute the using the below equation.
| 1 |
Here, is representing number of days. Positive and negative values are considered to support two cases. One is where spread occurs before symptoms and second is where symptoms are seen before spread.
When the model is working with lag, it predicts every case () of coronavirus using Eq. (2). Here .
| 2 |
is the forecast of model with lag. Here, is the length of data set used and is Euler’s number which is an irrational mathematical constant base for all natural logarithms. This constant number is used for forecasting either for the financial indices or for the spread of diseases. In the present study, we are making use of for forecasting the spread of coronavirus disease. The growth of the virus eventually follows a pattern control by ‘ as given below:
| 3 |
is representing the coronavirus cases changing from day to day and it can be calculated as
| 4 |
Here, is defining the efficiency of spreading of virus. It is considered as negative to show the attainment of a stage where the virus cannot spread as efficiently due to lower number of unaffected people. ‘t’ is the iterations in the form of days.
‘’ is representing the compounding effect in the calculated value of ‘’ according to the ‘’ chosen. It can be computed as
| 5 |
Here, is representing the learning rate of the model. Number of experiments were conducted using different values of learning rate. The value which gives the best loss without sacrificing speed of training is the optimal learning rate. It is always useful to reduce learning rate as the training progresses. In the present work, learning rate with value 0.5 provides the best results.
When the model is working without lag, it predicts every case () of coronavirus using Eq. (6). It calculates the rate at which there will be increase in cases for the next day.
| 6 |
Here, is defining the coronavirus cases changing from day to day without lag and it can be computed as
| 7 |
and is calculated for number of cases. Mean squared loss can be computed as
| 8 |
Here, is representing the data set. and are representing number of rows and column in data set. is defining the type of case which is predicted by model.
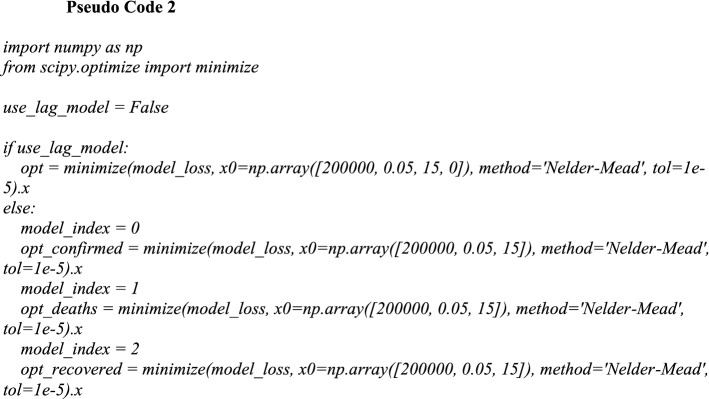
Section 3.1 discusses the pseudocode 1 and pseudocode 2 for implementation of proposed model.
Pseudocode
The lag must be less than +/− 100 days for accuracy of the model. To find a minimum, authors have applied 3-D parameter space using gradient descent. The pseudocode 2 for the same is given below: 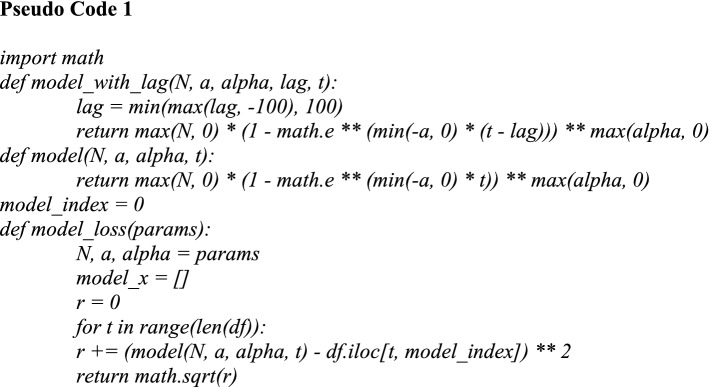
Materials and methods
The present work used real-time coronavirus data sets of India, China, France and Nepal for confirmed, death, active and recovered cases. Data sets of India are taken from the Ministry of Health and Family Welfare, Government of India. Time series data for these four countries have also been taken from Centre for System Science and Engineering (CSSE) at Johns Hopkins University [5]. CSSE has been implementing a real-time geographic information system (GIS) for providing the data or information for coronavirus cases. The system uses IOT to share and distribute data in real-time environment. IOT offers high data processing speed and precision over GPS [49–53]. However, John Hopkins University resource centre has used multiple other data sources for tracking of new cases of coronavirus like twitter feeds, direct communications through dashboards, etc. Usage of IOT has made the task of data-collection semi-automatic [54–56].
Time period for data sets used to execute the predictive analysis with different categories is shown in Table 2.
Table 2.
Time period for data sets for predictive Analysis
| Country | Confirmed cases | Death | Recovered cases | Active cases |
|---|---|---|---|---|
| India | March 2020–2nd Feb 2021 | March 2020–2nd Feb 2021 | March 2020–2nd Feb 2021 | March 2020–2nd Feb 2021 |
| China | Dec 21,019–2nd Feb 2021 | Dec 2019–2nd Feb 2021 | Dec 2019–2nd Feb 2021 | Dec 2019–2nd Feb 2021 |
| France | March 2020–2nd Feb 2021 | March 2020–2nd Feb 2021 | March 2020–2nd Feb 2021 | March 2020–2nd Feb 2021 |
| Nepal | March 2020–2nd Feb 2021 | March 2020–2nd Feb 2021 | March 2020–2nd Feb 2021 | March 2020–2nd Feb 2021 |
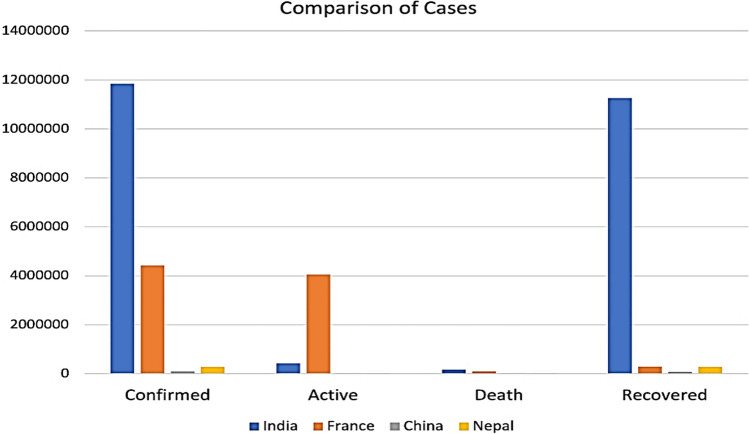
Figure 2 shows the status of coronavirus cases in all four countries in terms of total confirmed cases, active cases, total deaths and total recovered cases till 2 February 2021. It shows an upward trend in case of all mentioned countries.
Fig. 2.
Category-wise coronavirus cases in four countries
Methodology
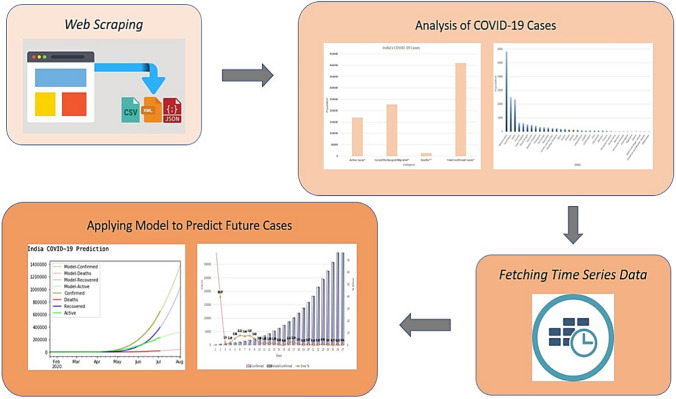
Time series prediction of coronavirus data set includes all the information about the coronavirus cases for all the countries and provinces. Authors extracted the data for each of the four mentioned countries (India, China, France and Nepal) and then selected the data with respect to four attributes, namely confirmed, active, deaths and recovered cases for prediction. The proposed model is applied on the selected columns to calculate the loss or gain in the cases as illustrated in Fig. 3. The extraction and selection of data are done using pandas by applying filtering as needed by the current work. Training a data set is an essential part for making any predictions. Every data set has real and random patterns [55, 56]. The predicted model is exposed to both type of patterns. Random patterns can be in favour or against of the proposed model which affects the accuracy. However, prediction models perfectly fit on the real data set and give the results in an accurate manner [58–60]. But no data are so real; therefore, no model can be 100% accurate. The current study is making the predictions based on the real-time data which is updating every day and for maintaining the accuracy of diffusion prediction model; no testing and validation data can be generated as it can hamper the accuracy of the model. For optimizing the prediction results, 'Nelder-Mead' optimization algorithm is applied [61]. The algorithm minimizes the model loss for confirmed, deaths, active and recovered cases.
Fig. 3.
Research methodology
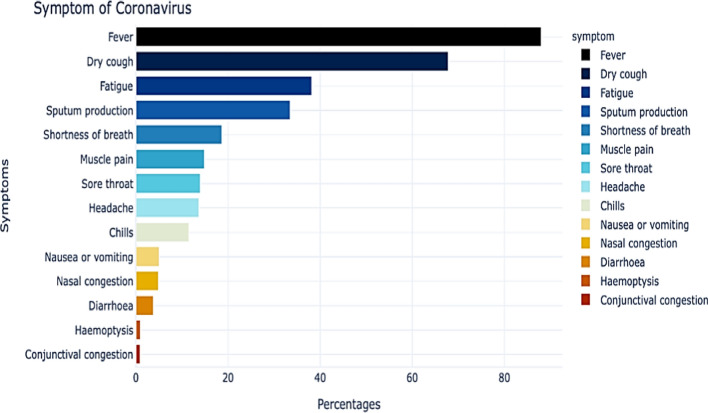
Authors have analysed the common symptoms among people of these four countries who were infected by this disease. Figure 4 illustrates the common symptoms shown by a coronavirus positive patient. From the figure, it can be easily concluded that the fever, dry cough, fatigue are the three most common symptoms among coronavirus patients.
Fig. 4.
Analysis of common symptoms among coronavirus patients
The present work also implemented LR, SVM and CNN models on the same data set. LR attempts to model the relationship between two variables by fitting a linear equation to observed data. One variable is an explanatory variable, which is the time in this case, and the other is a dependent variable, which is the number of cases [19].
SVM can be used as a regression method, maintaining all the main features such as active cases and increase rate, that characterizes the algorithm (maximal margin). The Support vector regression (SVR) uses the same principles as the SVM, with only a few minor differences. The ability of SVM to solve nonlinear regression estimation problems makes SVM successful in time series forecasting [62].
CNNs can be applied to time series forecasting. CNNs can be used to model univariate time series forecasting problems. Univariate time series are data sets comprised of a single series of observations, which is the number of active cases in this case, with a temporal ordering, and a model is required to learn from the series of past observations to predict the next value in the sequence [20].
Simulation environment
Simulation environment has been implemented using Python 3.7 with open-source libraries like Pandas, Numpy, matplotlib, and SciPy [63]. The working environment set-up is built up on Intel(R) Core (TM) i5-10th Gen CPU with 16 GB RAM and 64-bit Windows 10 pro Operating system.
For forecasting the coronavirus cases using diffusion-prediction model, authors have considered the following values for the parameters length of data set, number of days and learning rate as follows:
the value of and are adapting values throughout the simulation on each iteration. The value of is random. Here, is representing the learning rate and is representing the iteration size over the data set for simulation. The execution time taken by the proposed model is 9.23 s which is less than the other state-of-art models. The present work discusses the working of proposed model at iteration 400 for India.
Prediction of number of confirmed cases at
Prediction of number of deaths at
Simulation results
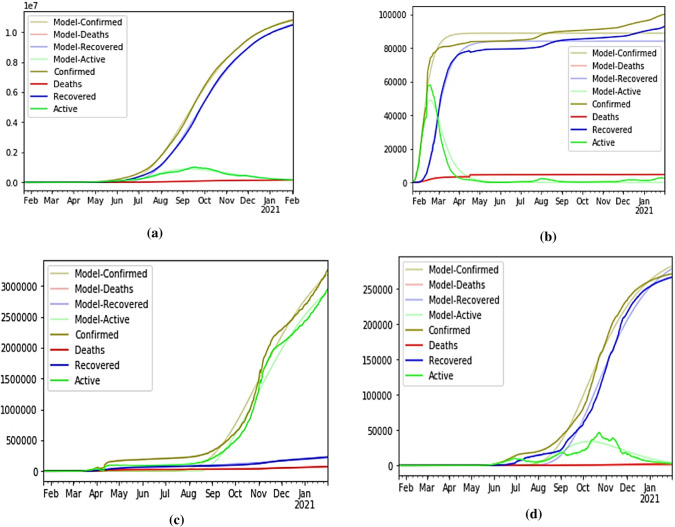
Like information available at John Hopkins University repository, diffusion prediction model also forecasts the confirmed, active, recovered and death cases for India, China, France and Nepal as shown in Fig. 5. Here, light coloured lines are representing the cases predicted by proposed model, whereas bold lines are used for representing actual cases. The diffusion prediction model was executed at the end of month January 2021. Figure 5 shows the exponential increase in the cases of coronavirus confirmed cases and recovered cases. It has been observed that the model is very accurate in giving the desired predicting output as the actual cases lines are superimposing on the lines of the model predicted cases.
Fig. 5.
Confirmed vs. predicted coronavirus cases in a India, b China, c France, d Nepal
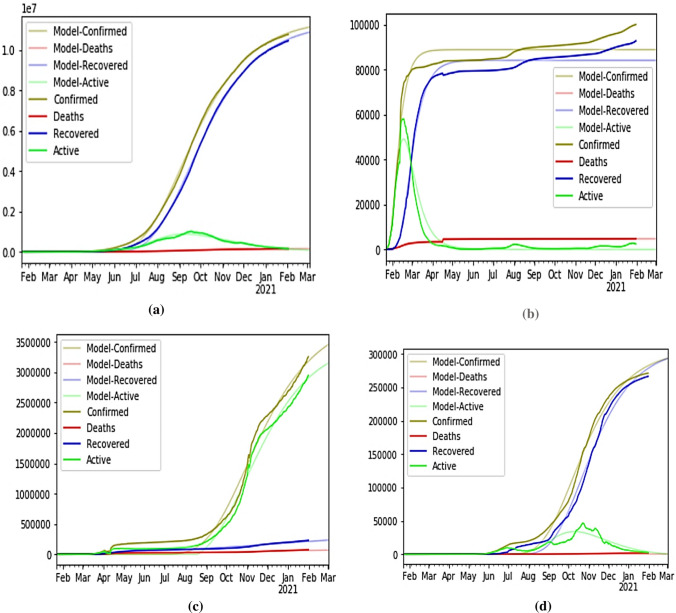
After applying the proposed model on the current data till Jan 2021, the diffusion model has executed for predicting the number of cases for the future. The model is executed on the day of 2 February 2021. Figure 6 shows the results of the cases predicted by the model for the next 4 weeks.
Fig. 6.
Prediction for next 4 weeks coronavirus cases in a India, b China, c France and d Nepal
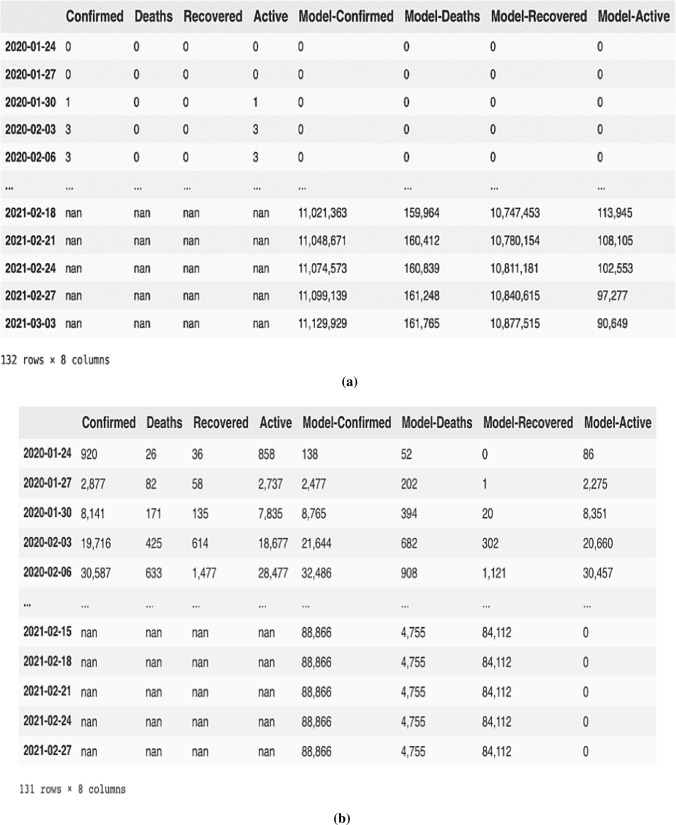
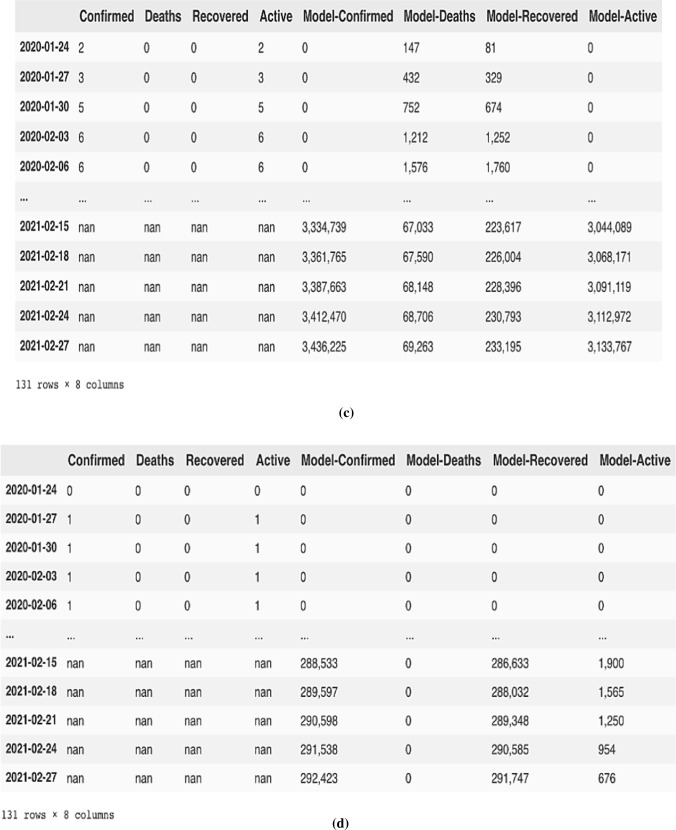
Figure 7 illustrates about the number of cases with a time lag of 3 days. It has taken the data from the day the cases started to rise (30th March 2020) and has successfully predicted the count of confirmed, deaths, recovered and active cases.
Fig. 7.
Number of cases with a time lag of 3 days a India, b China, c France and d Nepal
Performance evaluation
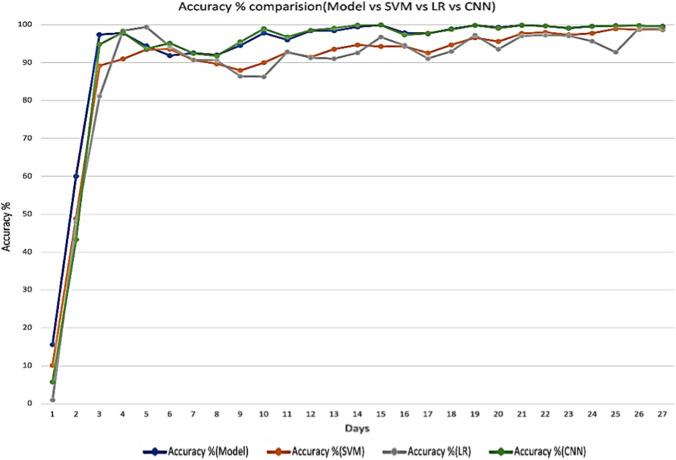
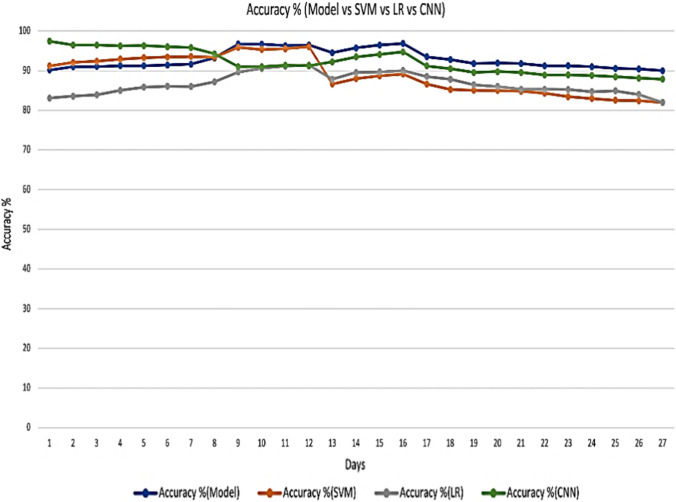
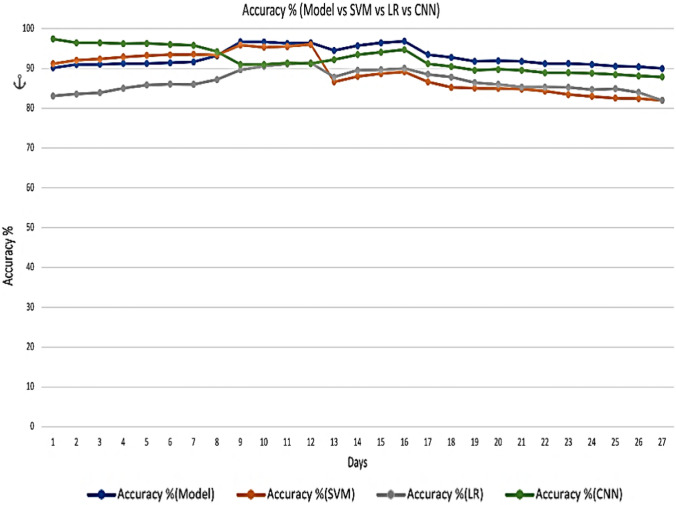
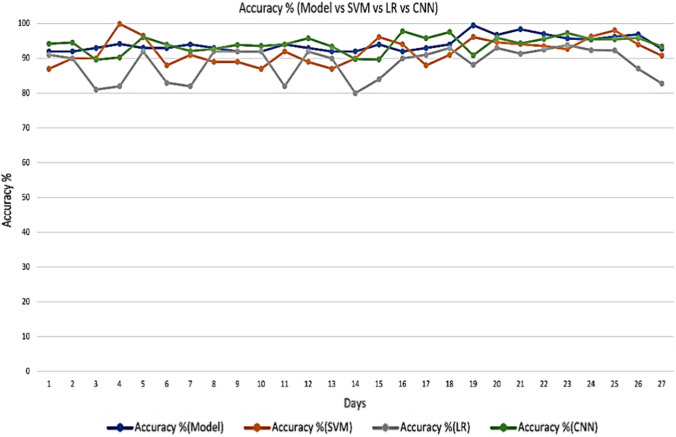
For evaluating the performance of diffusion prediction model, authors have applied the SVM model, LR model and CNN model on the same data set for predicting the coronavirus cases for all these four countries. The performance is compared in terms of two metrics, namely accuracy and error.
Accuracy defines the fraction of actual prediction of the cases and can be computed as mentioned in Eq. (9). Error rate specifies the false prediction of cases and can be computed as given in Eq. (10).
| 9 |
| 10 |
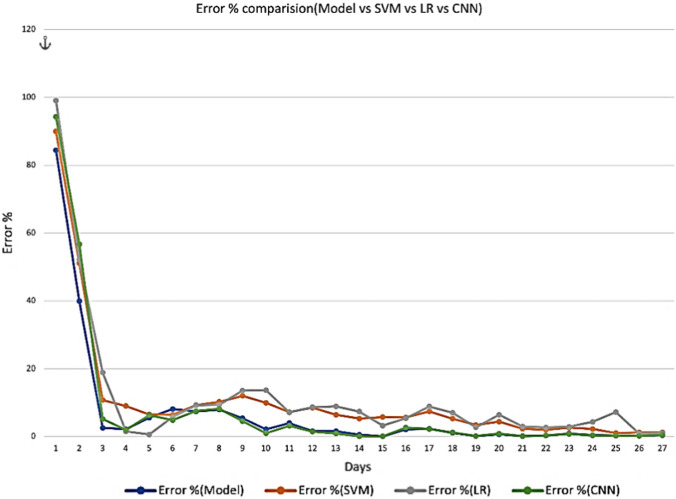
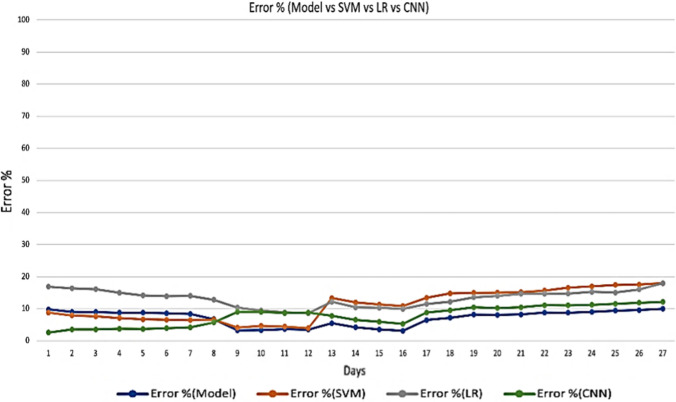
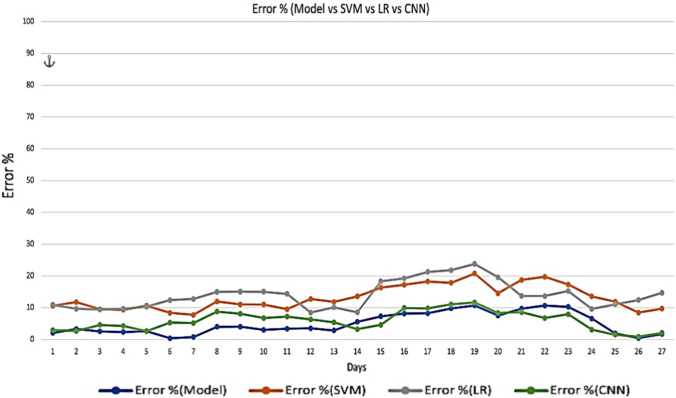
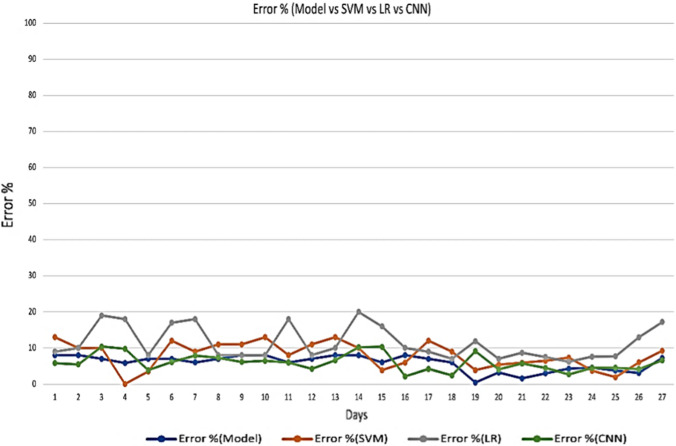
where n specifies the number of cases on the last date, confirmed(i) denotes the actual confirmed cases and ModelConfirmed (i) denotes the confirmed cases by the applied prediction model. The computed accuracy is illustrated for all three models in Figs. 8, 9, 10 and 11 and error rate is illustrated from Figs. 12, 13, 14 and 15. Here model represents the proposed diffusion prediction model; SVM represents SVM prediction model; and LR represents the LR prediction model.
Fig. 8.
Accuracy of proposed model for India
Fig. 9.
Accuracy of proposed model for China
Fig. 10.
Accuracy of proposed model for France
Fig. 11.
Accuracy of proposed model for Nepal
Fig. 12.
Error rate of proposed model for India
Fig. 13.
Error rate of proposed model for China
Fig. 14.
Error rate of proposed model for France
Fig. 15.
Error rate of proposed model for Nepal
Results and discussions
The diffusion prediction model is introduced for predicting the coronavirus cases in India, China, France and Nepal. The model is predicting the total number of confirmed cases, deaths, recovered and active cases. This pandemic situation necessitates efficient and effective approaches to counteract the spread of disease. It is essential for the governing bodies to execute the mandatory activities to retain the national economy growth. Consequently, it vitally raises the need to develop an effective prediction model which can help the government to decide policies in the pandemic situations. This work highlighted the current coronavirus condition of four countries and the ongoing pattern and severity of coronavirus outbreak using diffusion prediction model. The proposed research is an effort to introduce a model to forecast coronavirus cases in these countries. From Fig. 5, it can be seen that the prediction results are almost similar to the actual confirmed cases as both lines are walking together. It can be concluded from analysis of results through graphs and performance metrics that diffusion model outperformed over the other three models. Predicted outcome of diffusion model is extremely comparable with the real-time cases for all four countries.
As per the forecasted findings of diffusion model, authors determined that by 4 March 2021, 1,11,41,015 confirmed coronavirus cases might be in India which are currently 1,07,78,209 (as on 2 February 2021), predicted deaths might reach up to 1,59,419 which are currently (as on 2 February 2021) 1,54,635, active case and recovered cases might be 1,29,352 and 1,08,52,244, respectively, which are now (as on 2 February 2021) 1,57,348 and 1,04,61,700. Official coronavirus data released by John Hopkins University also specified the number of confirmed cases, active cases, recovered cases and deaths as 1,11,73,761 confirmed cases, 1,57,548 deaths, 1,08,39,894 recovered cases, 176,319 (as on 4th March) which are very much closer to our predicted death cases. The detailed analyses of results for other countries are described in Table 3. LR, SVM and CNN models are also implemented to check the performance as these models are widely accepted for making predictions. Table 3 also presents the predicted cases for all countries after applying LR, SVM and CNN models.
Table 3.
Actual cases Vs. predicted cases
| Country | Actual cases | Predicted cases | |||
|---|---|---|---|---|---|
| Diffusion prediction | LR | SVM | CNN | ||
| Confirmed cases | |||||
| India | 11,173,761 | 11,141,015 | 9,938,946 | 10,384,709 | 11,089,432 |
| China | 101,055 | 100,489 | 84,629 | 90,483 | 99,494 |
| France | 3,895,430 | 3,817,442 | 4,256,486 | 4,132,422 | 3,792,473 |
| Nepal | 274,488 | 280,942 | 204,711 | 224,441 | 271,344 |
| Deaths | |||||
| India | 157,548 | 159,419 | 204,191 | 198,322 | 169,347 |
| China | 4837 | 4798 | 8038 | 7934 | 3950 |
| France | 87,988 | 85,761 | 97,648 | 96,824 | 86,297 |
| Nepal | 2778 | 2693 | 1948 | 2142 | 2631 |
| Active cases | |||||
| India | 176,319 | 129,352 | 103,849 | 109,382 | 127,593 |
| China | 443 | 397 | 804 | 794 | 530 |
| France | 3,537,968 | 3,489,050 | 3,138,401 | 3,301,138 | 3,569,237 |
| Nepal | 1027 | 1342 | 1854 | 1829 | 1694 |
| Recovered cases | |||||
| India | 10,839,894 | 10,852,244 | 8,934,751 | 9,273,921 | 10,738,481 |
| China | 95,775 | 89,761 | 71,758 | 78,263 | 88,493 |
| France | 269,474 | 264,747 | 290,101 | 290,021 | 264,011 |
| Nepal | 270,683 | 277,535 | 184,849 | 232,546 | 259,374 |
The proposed model gives better accuracy for all four countries as illustrated from Figs. 8, 9, 10 and 11. For India, it gives an accuracy of 93.234%, 93.35% for China, 94.48% for Nepal and 95.05% for France. Though SVM model gives 89.34% accuracy for India, 87.98% for China, 91.22% for Nepal and 86.88% for France, LR model gives an accuracy of 88.84% for India, 86% for China, 86.9% for Nepal and 86% for France. CNN model gives the better accuracy over LR and SVM model but less than proposed diffusion prediction model. It gives 92.37% for India, 92.21% for China, 94.08% for France and 94.04% for Nepal.
Error rate for proposed model is 6.77%, 6.65%, 5.52%, 4.95% for India, China, Nepal and France, respectively, as shown in Figs. 12, 13, 14 and 15. However, SVM gives 10.655%, 12.02%, 8.77%, 13.12% error rate for India, China, Nepal and France correspondingly. LR gives 11.55%, 14%, 13%, 13.9% error rate for India, China, Nepal and France correspondingly. CNN gives 7.63%, 7.78%, 5.91% and 5,91% error rate for India, China, France and Nepal, respectively. From Fig. 8, it can be easily observed that the proposed model is better in terms of accuracy over SVM and LR model and similar is the case with error rate. The results of both performance metrices itself prove the performance of diffusion prediction model. The following are the key points from the present work:
The diffusion prediction model may be implemented as a timely warning alarm to battle against the current coronavirus pandemic.
As the solution presented a real-time prediction, the system can be used to regularly update the predictions by manipulating the actual confirmed cases.
Diffusion prediction model shows the predictions for next one month and which can be considered to check the impact of measures implemented by the governments.
Conclusion and future work
The present research forecasts the total confirmed cases, deaths, recovered and active cases as per reported cases based on coronavirus data released by JH University for India, China, France and Nepal. The present study recommends that an emergency can be there before the proper vaccination process. The proposed model predicted the number of cases in these countries for both the scenarios ‘When diffusion takes time through infected person’ and ‘when immediate diffusion through infected person’. The proposed model is that the number of cases is increasing in coming weeks and this epidemic will continue, but the number of active cases is drastically decreased for three countries except France. For evaluating the performance, SVM, LR and CNN models have also implemented. The results proved the efficacy of proposed model as the actual confirmed cases and the cases predicted by the proposed model are mostly walking together. In future, if more attributes will be available, the model can be expanded to predict more attributes and can also be implemented for other countries.
Authors' contributions
All the authors of the manuscript equally contributed for all the sections of this research work.
Funding
We have not received any specific funding to carry out this research work.
Availability of data and material
The data and code are available on request.
Conflicts of interest
The authors of the manuscript have no conflict of interest.
Footnotes
Publisher's Note
Springer Nature remains neutral with regard to jurisdictional claims in published maps and institutional affiliations.
Contributor Information
Supriya Raheja, Email: supriya.raheja@gmail.com.
Shreya Kasturia, Email: shreyakasturia@gmail.com.
Xiaochun Cheng, Email: xiaochun.cheng@gmail.com.
Manoj Kumar, Email: m.kumar@ddn.upes.ac.in, Email: wss.manojkumar@gmail.com.
References
- 1.Rothan HA, Byrareddy SN. The epidemiology and pathogenesis of coronavirus disease (CORONAVIRUS) outbreak. J Autoimmun. 2020;109:1–4. doi: 10.1016/j.jaut.2020.102433. [DOI] [PMC free article] [PubMed] [Google Scholar]
- 2.World Health Organization (2020) Coronavirus disease 2019 (COVID19): situation report, p 67
- 3.Bogoch II, Watts A, Thomas-Bachli A, Huber C, Kraemer MU, Khan K. Pneumonia of unknown aetiology in Wuhan, China: potential for international spread via commercial air travel. J Travel Med. 2020;27(2):1–3. doi: 10.1093/jtm/taaa008. [DOI] [PMC free article] [PubMed] [Google Scholar]
- 4.Hui DS, Azhar EI, Madani TA, Ntoumi F, Kock R, Dar O, et al. The continuing 2019-nCoV epidemic threat of novel coronaviruses to global health—The latest 2019 novel coronavirus outbreak in Wuhan. China Int J Infect Dis. 2020;91:264–266. doi: 10.1016/j.ijid.2020.01.009. [DOI] [PMC free article] [PubMed] [Google Scholar]
- 5.Johns Hopkins University Coronavirus Repository. Available at: https://coronavirus.jhu.edu/map.html
- 6.Skegg D, Gluckman P, Boulton G, Hackmann H, Karim SSA, Piot P, Woopen C. Future scenarios for the COVID-19 pandemic. The Lancet. 2021;397(10276):777–778. doi: 10.1016/S0140-6736(21)00424-4. [DOI] [PMC free article] [PubMed] [Google Scholar]
- 7.Darwish A, Rahhal Y, Jafar A. A comparative study on predicting influenza outbreaks using different feature spaces: application of influenza-like illness data from Early Warning Alert and Response System in Syria. BMC Res Notes. 2020;13(1):1–8. doi: 10.1186/s13104-020-4889-5. [DOI] [PMC free article] [PubMed] [Google Scholar]
- 8.Nilima BM. The problems of the world of education in the middle of the Covid-19 pandemic. Budapest Int Res Critics Institute BIRCI J Human Social Sci. 2021;4(1):450–457. [Google Scholar]
- 9.Kumar VA, Sharmila S, Kumar A, Bashir AK, Rashid M, Gupta SK, Alnumay WS. A novel solution for finding postpartum haemorrhage using fuzzy neural techniques. Neural Comput Appl. 2021;SI:1–14. doi: 10.1007/s00521-020-05683-z. [DOI] [Google Scholar]
- 10.Mandal M, Jana S, Khatua A, Kar TK. Modeling and control of COVID-19: A short-term forecasting in the context of India. Chaos Interdiscip J Nonlinear Sci. 2020;30(11):113–119. doi: 10.1063/5.0015330. [DOI] [PubMed] [Google Scholar]
- 11.Acuña-Zegarra MA, Olmos-Liceaga D, Velasco-Hernández JX. The role of animal grazing in the spread of Chagas disease. J Theor Biol. 2018;457:19–28. doi: 10.1016/j.jtbi.2018.08.025. [DOI] [PubMed] [Google Scholar]
- 12.Rypdal M, Sugihara G. Inter-outbreak stability reflects the size of the susceptible pool and forecasts magnitudes of seasonal epidemics. Nat Commun. 2019;10(1):1–8. doi: 10.1038/s41467-019-10099-y. [DOI] [PMC free article] [PubMed] [Google Scholar]
- 13.Scarpino SV, Petri G. On the predictability of infectious disease outbreaks. Nat Commun. 2019;10(1):1–8. doi: 10.1038/s41467-019-08616-0. [DOI] [PMC free article] [PubMed] [Google Scholar]
- 14.Zhan Z, Dong W, Lu Y, Yang P, Wang Q, Jia P. Real-time forecasting of hand-foot-and-mouth disease outbreaks using the integrating compartment model and assimilation filtering. Sci Rep. 2019;9(1):1–9. doi: 10.1038/s41598-019-38930-y. [DOI] [PMC free article] [PubMed] [Google Scholar]
- 15.Nilima N, Kaushik S, Tiwary B, Pandey PK. Psycho-social factors associated with the nationwide lockdown in India during COVID-19 pandemic. Clin Epidemiol Global Health. 2021;9:47–52. doi: 10.1016/j.cegh.2020.06.010. [DOI] [PMC free article] [PubMed] [Google Scholar]
- 16.Akour I, Alshurideh M, Al KB, Ali A, Salloum S. Using machine learning algorithms to predict people’s intention to use mobile learning platforms during the COVID-19 pandemic: machine learning approach. JMIR Med Edu. 2021;7(1):1–17. doi: 10.2196/24032. [DOI] [PMC free article] [PubMed] [Google Scholar]
- 17.Majumder A, Adak D, Bairagi N. Persistence and extinction criteria of Covid-19 pandemic: India as a case study. Stoch Anal Appl. 2021 doi: 10.1080/07362994.2021.1894172. [DOI] [Google Scholar]
- 18.Singh V, Poonia RC, Kumar S, Dass P, Agarwal P, Bhatnagar V, Raja L. Prediction of CORONAVIRUS corona virus pandemic based on time series data using Support Vector Machine. J Dis Math Sci Cryptogr. 2020;23(8):1583–1597. doi: 10.1080/09720529.2020.1784535. [DOI] [Google Scholar]
- 19.Kulkarni K, Kulkarni A, Shaikh NS, Sayyed S. CORONAVIRUS pandemic: ARIMA and regression model-based worldwide death cases predictions. J Institution Eng India Ser. 2021;2:1–12. doi: 10.1007/s40031-021-00558-w. [DOI] [Google Scholar]
- 20.Chaurasia V, Pal S. CORONAVIRUS pandemic: ARIMA and regression model-based worldwide death cases predictions. SN Comput Sci. 2020;1(5):1–12. doi: 10.1007/s42979-020-00298-6. [DOI] [PMC free article] [PubMed] [Google Scholar]
- 21.Kurbalija V, Radovanović M, Ivanović M, Schmidt D, Von TGL, Burkhard HD, Hinrichs C. Time-series analysis in the medical domain: A study of Tacrolimus administration and influence on kidney graft function. Comput Biol Med. 2014;50:19–31. doi: 10.1016/j.compbiomed.2014.04.007. [DOI] [PubMed] [Google Scholar]
- 22.Thomson MC, Molesworth AM, Djingarey MH, Yameogo KR, Belanger F, Cuevas LE. Potential of environmental models to predict meningitis epidemics in Africa. Tropical Med Int Health. 2016;11(6):781–788. doi: 10.1111/j.1365-3156.2006.01630.x. [DOI] [PubMed] [Google Scholar]
- 23.Wang YW, Shen ZZ, Jiang Y. Comparison of ARIMA and GM (1, 1) models for prediction of hepatitis B in China. PLoS ONE. 2018;13(9):1–8. doi: 10.1371/journal.pone.0201987. [DOI] [PMC free article] [PubMed] [Google Scholar]
- 24.Zhang L, Wang L, Zheng Y, Wang K, Zhang X, Zheng Y. Time prediction models for echinococcosis based on gray system theory and epidemic dynamics. Int J Environ Res Public Health. 2017;14(3):1–14. doi: 10.3390/ijerph14030262. [DOI] [PMC free article] [PubMed] [Google Scholar]
- 25.Liu Q, Li Z, Ji Y, Martinez L, Zia UH, Javaid A, Wang J. Forecasting the seasonality and trend of pulmonary tuberculosis in Jiangsu Province of China using advanced statistical time-series analyses. Infect Drug Resis. 2019;12:2311–2322. doi: 10.2147/IDR.S207809. [DOI] [PMC free article] [PubMed] [Google Scholar]
- 26.Ren H, Li J, Yuan ZA, Hu JY, Yu Y, Lu YH. The development of a combined mathematical model to forecast the incidence of hepatitis E in Shanghai. China BMC Infect Dis. 2013;13(1):2–6. doi: 10.1186/1471-2334-13-421. [DOI] [PMC free article] [PubMed] [Google Scholar]
- 27.Orbann C, Sattenspiel L, Miller E, Dimka J. Defining epidemics in computer simulation models: How do definitions influence conclusions. Epidemics. 2017;19:24–32. doi: 10.1016/j.epidem.2016.12.001. [DOI] [PubMed] [Google Scholar]
- 28.Esposito C, Ficco M, Gupta BB. Blockchain-based authentication and authorization for smart city applications. Inf Process Manage. 2021;58(2):102468. doi: 10.1016/j.ipm.2020.102468. [DOI] [Google Scholar]
- 29.Yu C, Li J, Li X, Ren X, Gupta BB. Four-image encryption scheme based on quaternion Fresnel transform, chaos and computer-generated hologram. Multimedia Tools Appl. 2018;77(4):4585–4608. doi: 10.1007/s11042-017-4637-6. [DOI] [Google Scholar]
- 30.Mishra A, Gupta N, Gupta BB. Defense mechanisms against DDoS attack based on entropy in SDN-cloud using POX controller. Telecommun Syst. 2021;77(1):1–16. doi: 10.1007/s11235-020-00747-w. [DOI] [Google Scholar]
- 31.Bhatnagar V, Poonia RC, Nagar P, Kumar S, Singh V, Raja L, Dass P. Descriptive analysis of CORONAVIRUS patients in the context of India. J Interdiscip Math. 2020;24(3):1–16. doi: 10.1080/09720502.2020.1761635. [DOI] [Google Scholar]
- 32.AlZu’bi S, Shehab M, Al-Ayyoub M, Jararweh Y, Gupta BB, Parallel implementation for 3d medical volume fuzzy segmentation. Appl Soft Comput. 2020;130:312–318. doi: 10.1016/j.patrec.2018.07.026. [DOI] [Google Scholar]
- 33.Wang H, Li Z, Li Y, Gupta BB, Choi C. Visual saliency guided complex image retrieval. Pattern Recogn Lett. 2020;130:64–72. doi: 10.1016/j.patrec.2018.08.010. [DOI] [Google Scholar]
- 34.Li Q, Feng W, Quan YH. Trend and forecasting of the CORONAVIRUS outbreak in China. J Infect. 2020;80(4):469–496. doi: 10.1016/j.jinf.2020.02.014. [DOI] [PMC free article] [PubMed] [Google Scholar]
- 35.Fanelli D, Piazza F. Analysis and forecast of CORONAVIRUS spreading in China, Italy and France. Chaos Solitons Fractals. 2020;134:1–5. doi: 10.1016/j.chaos.2020.109761. [DOI] [PMC free article] [PubMed] [Google Scholar]
- 36.Ceylan Z. Estimation of CORONAVIRUS prevalence in Italy, Spain, and France. Sci Total Environ. 2020;729:1–23. doi: 10.1016/j.scitotenv.2020.138817. [DOI] [PMC free article] [PubMed] [Google Scholar]
- 37.Ardabili SF, Mosavi A, Ghamisi P, Ferdinand F, Varkonyi-Koczy AR, Reuter U, et al. Coronavirus outbreak prediction with machine learning. Algorithms. 2020;13(10):1–36. doi: 10.3390/a13100249. [DOI] [Google Scholar]
- 38.Yadav D, Maheshwari H, Chandra U. Outbreak prediction of Coronavirus in most susceptible countries. Global J Environ Sci Manage. 2020;6:11–20. [Google Scholar]
- 39.Singhal A, Singh P, Lall B, Joshi SD. Modeling and prediction of CORONAVIRUS pandemic using Gaussian mixture model. Chaos Solitons Fractals. 2020;138:1–10. doi: 10.1016/j.chaos.2020.110023. [DOI] [PMC free article] [PubMed] [Google Scholar]
- 40.Khakharia A, Shah V, Jain S, Shah J, Tiwari A, Daphal P, et al. Outbreak prediction of CORONAVIRUS for dense and populated countries using machine learning. Ann Data Sci. 2020;8:1–19. doi: 10.1007/s40745-020-00314-9. [DOI] [PMC free article] [PubMed] [Google Scholar]
- 41.Roy S, Bhunia GS, Shit PK. Spatial prediction of CORONAVIRUS epidemic using ARIMA techniques in India. Model Earth Syst Environ. 2020;7(2):1–7. doi: 10.1007/s40808-020-00890-y. [DOI] [PMC free article] [PubMed] [Google Scholar]
- 42.Pandey G, Chaudhary P, Gupta R, Pal S SEIR and Regression Model based CORONAVIRUS outbreak predictions in India. arXiv:2004.00958v1:1-10. 10.1101/2020.04.01.20049825
- 43.Sedik A, Hammad M, Abd El-Samie FE, Gupta BB, Abd El-Latif AA. Efficient deep learning approach for augmented detection of coronavirus disease. Neural Comput Appl. 2021;SI:1–18. doi: 10.1007/s00521-020-05410-8. [DOI] [PMC free article] [PubMed] [Google Scholar]
- 44.Masud M, Gaba GS, Alqhtani S, Muhammad G, Gupta BB, Kumar P, Ghoneim A. A lightweight and robust secure key establishment protocol for internet of medical things in COVID-19 patients care. IEEE Internet Things J Accepted. 2020 doi: 10.1109/JIOT.2020.3047662. [DOI] [PMC free article] [PubMed] [Google Scholar]
- 45.Yu K, Tan L, Shang X, Huang J, Srivastava G, Chatterjee P. Efficient and privacy-preserving medical research support platform against COVID-19: a blockchain-based approach. IEEE Consumer Electron Magazine. 2020;10(2):111–120. doi: 10.1109/MCE.2020.3035520. [DOI] [Google Scholar]
- 46.Le NE, Steyer A. La prévision des ventes d'un nouveau produit de télécommunication: probit ou théorie des avalanches. Recherche et Applications en Marketing (French Edition) 1995;10(1):57–68. doi: 10.1177/076737019501000104. [DOI] [Google Scholar]
- 47.Sahoo SR, Gupta BB. Multiple features based approach for automatic fake news detection on social networks using deep learning. Appl Soft Comput. 2021;100:106983. doi: 10.1016/j.asoc.2020.106983. [DOI] [Google Scholar]
- 48.Rogers E. Diffusion of Innovations. New York: Free Press; 1995. [Google Scholar]
- 49.Dan D, Cheng X. Vulnerabilities and limitations of MQTT protocol used between IoT devices. Appl Sci. 2019;9(5):1–10. doi: 10.3390/app9050848. [DOI] [Google Scholar]
- 50.Bahast A, Cheng X (2019) Security solution based on raspberry PI and IoT. In: International symposium on cyberspace safety and security, pp. 162–171. Springer, Cham
- 51.Xiao Z, Liu J, Ba Z, Tao Y, Cheng X. MobiScan: an enhanced invisible screen-camera communication system for IoT applications. Trans Emerging Telecommun Technol. 2020 doi: 10.1002/ett.4151. [DOI] [Google Scholar]
- 52.Gupta BB, Quamara M. An overview of Internet of Things (IoT): architectural aspects, challenges, and protocols. Concurrency Comput Practice Exp. 2020;32(21):1–24. doi: 10.1002/cpe.4946. [DOI] [Google Scholar]
- 53.Stergiou CL, Psannis kE, Gupta BB, IoT-based big data secure management in the fog over a 6G wireless network. IEEE Internet Things J. 2020;8(7):5164–5171. doi: 10.1109/JIOT.2020.3033131. [DOI] [Google Scholar]
- 54.Yu K, Tan L, Aloqaily M, Yang H, Jararweh Y. Blockchain-enhanced data sharing with traceable and direct revocation in IIoT. IEEE Trans Ind Inform Early Access. 2021 doi: 10.1109/TII.2021.3049141. [DOI] [Google Scholar]
- 55.Jararweh Y, Al-Ayyoub M, Benkhelifa E, Vouk M, Rindos A. SDIoT: a software defined based internet of things framework. J Ambient Intell Humaniz Comput. 2015;6(4):453–461. doi: 10.1007/s12652-015-0290-y. [DOI] [Google Scholar]
- 56.Mumtaz S, Alsohaily A, Pang Z, Rayes A, Tsang KF, Rodriguez J. Massive Internet of Things for industrial applications: addressing wireless IIoT connectivity challenges and ecosystem fragmentation. IEEE Ind Electron Mag. 2017;11(1):28–33. doi: 10.1109/MIE.2016.2618724. [DOI] [Google Scholar]
- 57.Guo Z, Yu K, Li Y, Srivastava G, Lin JC. Deep learning-embedded social internet of things for ambiguity-aware social recommendations. IEEE Trans Network Sci Eng Early Access. 2021 doi: 10.1109/TNSE.2021.3049262. [DOI] [Google Scholar]
- 58.Wang S, Liu W, Wu J, Cao L, Meng Q, Kennedy PJ (2016) Training deep neural networks on imbalanced data sets. In: 2016 international joint conference on neural networks (IJCNN), IEEE, pp 4368–4374
- 59.Cao L. Domain-driven data mining: challenges and prospects. IEEE Trans Knowl Data Eng. 2010;22(6):755–769. doi: 10.1109/TKDE.2010.32. [DOI] [Google Scholar]
- 60.Zhou Z, Liao H, Gu B, Huq KMS, Mumtaz S, Rodriguez J. Robust mobile crowd sensing: when deep learning meets edge computing. IEEE Network. 2018;32(4):54–60. doi: 10.1109/MNET.2018.1700442. [DOI] [Google Scholar]
- 61.Singer S, Nelder J. Nelder-mead Algorithm. Scholarpedia. 2009;4(7):2928. doi: 10.4249/scholarpedia.2928. [DOI] [Google Scholar]
- 62.Al-Smadi M, Qawasmeh O, Al-Ayyoub M, Jararweh Y, Gupta BB. Deep recurrent neural network vs. support vector machine for aspect-based sentiment analysis of Arabic hotels’ reviews. J Comput Sci. 2018;27:386–393. doi: 10.1016/j.jocs.2017.11.006. [DOI] [Google Scholar]
- 63.Polina L. Processing oceanographic data by python libraries numpy. SciPy Pandas Aquatic Res. 2019;2(2):73–91. doi: 10.3153/AR19009. [DOI] [Google Scholar]
Associated Data
This section collects any data citations, data availability statements, or supplementary materials included in this article.
Data Availability Statement
The data and code are available on request.


