Abstract
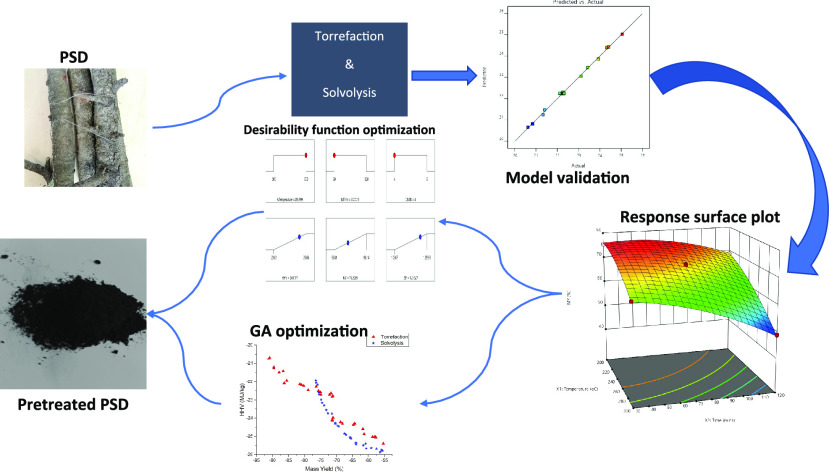
Understanding optimal process conditions is an essential step in providing high-quality fuel for energy production, efficient energy generation, and plant development. Thus, the effect of process conditions such as the temperature, time, nitrogen-to-solid ratio (NSR), and liquid-to-solid ratio (LSR) on pretreated waste pine sawdust (PSD) via torrefaction and solvolysis is presented. The desirability function approach and genetic algorithm (GA) were used to optimize the processes. The response surface methodology (RSM) based on Box–Behnken design (BBD) was used to determine the effect of the process conditions mentioned above on the higher heating value (HHV), mass yield (MY), and energy enhancement factor (EEF) of biochar/hydrochar obtained from waste PSD. Seventeen experiments were designed each for torrefaction and solvolysis processes. The benchmarked process conditions were as follows: temperature, 200–300 °C; time, 30–120 min; NSR/LSR, 4–5. In this study, the operating temperature was the most influential variable that affected the pretreated fuel’s properties, with the NSR and LSR having the least effect. The oxygen-to-carbon content ratio and the HHV of the pretreated fuel sample were compared between the two pretreatment methods investigated. Solvolysis pretreatment showed a higher reduction in the oxygen-to-carbon content ratio of 47%, while 44% reduction was accounted for the torrefaction process. A higher mass loss and energy content were also obtained from solvolysis than the torrefaction process. From the optimization process results, the accuracy of the optimal process conditions was higher for GA (299 °C, 30.07 min, and 4.12 NSR for torrefaction and 295.10 °C, 50.85 min, and 4.55 LSR for solvolysis) than that of the desirability function based on RSM. The models developed were reliable for evaluating the operating process conditions of the methods studied.
1. Introduction
Recently, researchers have focused on studies related to biomass as an alternative source of fuel. This focus is due to the gradual depletion of fossil fuels and its negative environmental effect from its energy production usage. Fossil fuels are the major sources of fuel for energy generation. Still, the overdependency on the use of these fuels for energy production could be reduced through biomass utilization.1
Studies on the valorization of biomass have shown that biomass is a salient renewable fuel that could be converted into different energy forms. However, some of the biomass’ physicochemical properties (e.g., moisture content and others) may affect the energy conversion system’s efficiency if the fuel is not pretreated. Therefore, it will be necessary that the fuel is pretreated to enhance its quality and, hence, meet the global energy demand.2
Several thermochemical conversion methods have been employed to improve the fuel properties of biomass.3−10 Torrefaction and solvolysis are the most common pretreatment methods, and they require a low-temperature operation, thus enabling the processes to be cost-effective.11 Biomass materials are pretreated to improve fuel qualities such as the higher heating value (HHV), carbon content, and hydrogen/oxygen ratio and reduce moisture content.
Other methods in which the fuel quality can be enhanced include acid and alkaline hydrolysis, leaching, fast and slow pyrolysis, etc. These pretreatment methods help remove the high moisture content present in biomass. It also helps one to solubilize the hemicellulose, reduce the crystalline nature of the cellulose, and increase the surface area by improving the grindability and breaking the resistive lignin structure. In this case, the biomass’ shelf life is increased, and the fuel is maximized as a solid fuel for energy production.
Generally, when raw biomass is compared to pretreated biomass, the fuel properties such as good grindability, unyielding characteristics to biodegradation, and effective thermochemical conversion, to mention a few,12−14 are improved for pretreated biomass than raw biomass.
Torrefaction is a process whereby biomass is subjected to temperatures between 200 and 300 °C in an inert atmosphere.15,16 This process is termed a thermal pretreatment process. In this process, nitrogen is used as the inert gas and researchers have used it for pinewood,17,18 beechwood,19 coffee residue,20 and timothy hay21 torrefaction.
Cha et al.22 reviewed the torrefaction of lignocellulosic biomass and highlighted the different reactions taking place, namely, loss of free moisture content, devolatilization of light compounds, decomposition of a fraction of the lignocellulosic composition, and the production of biochar. Yu et al.23 showed that torrefaction offers a remarkable improvement to wood pallets as a solid fuel by improving the energy densities and grindability. Wang et al.24 studied the effect of torrefaction on cotton stalk and wheat straw. An improved HHV, grindability, and a hydrophobic nature were reported.
It was also reported by Chen et al.25 that biomass torrefaction could reduce the tar production during pyrolysis of biochar and also increase the biochar yield. Chen and his co-workers also torrefied rice husk to evaluate the solid, liquid, and gaseous products from the process. They observed apparent deoxygenation effects during the study. The chemical composition analysis also showed that torrefaction is mainly associated with the decomposition of the hemicellulose. The association between increased torrefaction temperatures and increased higher heating values was also reported. Yue et al.26 carried out the torrefaction of biomass (sorghum), and the results indicated that torrefaction is attractive for fuel quality improvement. Similarly, the pretreatment of corn cob carried out by Li et al.27 is in affirmation with the results of the authors mentioned earlier in this section affirming torrefaction as a promising method of enhancing the properties of biomass.
Solvolysis, also referred to as hydrothermal pretreatment, is a pretreatment process that produces a solid product termed hydrochar. This solid hydrochar also exhibits improved fuel properties such as reduced oxygen/carbon ratio, increased higher heating values (HHVs), and improved hydrophobicity compared to raw and torrefied biomass.28 The solvolysis process has also been described as an eco-friendly process because deionized water is used instead of chemicals.29,30 Therefore, solvolysis is defined as a pretreatment process whereby biomass is submerged in water at high temperatures between 150 and 300 °C for some time in an inert atmosphere.31,32
Solvolysis pretreatment has been very efficient in pretreating biomass with high moisture content and biomass with low moisture content.33,34 Due to the subcritical nature of water at a mild temperature range of 150–180 °C, the solvolysis process facilitates the solubilization of the hemicellulose, cellulose, and lignin component at low temperatures compared to torrefaction. This phenomenon is responsible for the low mass yield and the higher HHV attributed to the solvolysis process compared to torrefied biomass.
Several researchers have investigated the effect of solvolysis on the properties of biomass. Lynam et al.1 reported the influence of solvolysis on five different biomasses with loblolly pine included. It was reported that there was a drastic mass loss of 40% for pine with a 1.3 enhancement factor of the HHV. Zhang et al.35 carried out solvolysis treatment on rice husk between 150 and 240 °C for 60 min. Results showed the high dependence of the HHV on the reaction temperature. Similar observations were reported for Miscanthus biomass by Park et al.36 Nakason37 investigated the effect of the liquid-to-solid ratio (LSR) and reported that an increased LSR tends to reduce the mass yield of hydrochar and increase the higher heating value. Hashemi et al.38 enhanced the production of biogas from safflower straw by hydrothermally pretreating it. The authors concluded that the biogas’ yield could significantly be increased only by pretreating biomass.
The operating temperature and residence time have been considered to be critical process conditions that affect the physicochemical properties of both biochar and hydrochar. Other operating conditions are the mass of biomass feed (embedded in the nitrogen-to-solid ratio for torrefaction), the liquid-to-solid ratio for solvolysis, the particle size, the type of reactor, the milling technique, etc. The enhancement of the biomass’ properties (fuel) depends on the pretreatment process’ operating conditions; therefore, the conditions should be well understood. Furthermore, understanding the modeling and optimization process conditions will play a critical role in designing an efficient industrial application process. Based on these focuses, it will be feasible to produce biochar and hydrochar briquettes with a higher bulk energy density. It will serve as an efficient feedstock for the thermochemical conversion process.39,40 According to the authors mentioned above, the reduction in the briquettes’ mass yield at an increased temperature is a massive setback in fuel production. Hence, it is necessary to optimize the process conditions to produce efficient biochar and hydrochar for effective gasification.
Only a few published works have investigated the effect and optimization of process conditions on the solvolysis pretreatment of pine saw dust (PSD). More so, fewer studies have reported the comparative analysis of solid fuel produced from solvolysis and torrefaction under the same operating conditions. Notably, assessing the desirability function and genetic algorithm for optimizing the process conditions for torrefaction and solvolysis pretreatments of biomass (PSD) has not been reported in the literature. As a result of these knowledge gaps stated above, this research aimed to study the effect of process conditions during the torrefaction and solvolysis pretreatments of pine saw dust (PSD) and to determine the optimal process conditions using the desirability function and genetic algorithm approach. The RSM based on the BBD method was used for the experimental design, and the data obtained were employed in the modeling and optimization processes.
2. Materials and Methods
2.1. Material Preparation
The pinewoods (Pinus pinaster) used in this study were obtained as wastes from the precinct of the University of The Witwatersrand, Johannesburg, South Africa. The wood samples were air-dried for 48 h to prepare it for size reduction. The wood samples’ particle size was reduced to an average dimension of 10 × 15 × 20 (l × b × w) mm and finally to 0.6 mm using a Mössner Rekord SSF 520 vertical band saw and a pulverizer, respectively. A mesh sieve was used to ensure a particle size less than 600 μm of pulverized sawdust. The dried pine saw dust (PSD) was then stored in an air-tight plastic bag for further experiments.
2.1.1. Characterization of Feedstock
PSD properties were characterized before and after torrefaction and solvolysis experiments. Specifically, the proximate and ultimate analyses were carried out, and the HHVs for PSD were determined. The proximate analyses were done in compliance with ASTM E872-8241 and E1755-01.42 The free moisture content present in PSD was reported as the mass loss after oven-drying the sample at 105 °C for 24 h. To estimate the volatile matter content in PSD, a thermogravitric analyzer (Q600 SDT) was used to heat 10 mg of oven-dried PSD in a nitrogen atmosphere to a temperature of 950 °C and held for 7 min isothermally. The mass loss recorded by TGA after this process was recorded as the volatile matter content. To estimate the ash content of PSD, 5 g of oven-dried PSD was placed in a crucible and heated in a muffle furnace at 550 °C for 3 h in the presence of air. The mass of the remaining noncombusted sample was recorded as the ash content. The fixed carbon was calculated as the unaccounted mass during this process and is illustrated in eq 1. The ultimate analyses were carried out in compliance with ASTM D3176-89.43 Notably, a Flash 2000 analyzer (Thermo Fisher Scientific, USA) was used for these analyses. The oxygen content of the fuel was estimated by difference, as expressed in eq 2:
| 1 |
FC is the fixed carbon, MC is the moisture content, and VM is the volatile matter.
| 2 |
The HHVs of all samples were determined using a Parr Oxygen Bomb Calorimeter. All analyses were carried in triplicate, and the average values were reported to ensure the repeatability of results.
2.2. Torrefaction Experiment
A 500 mL high-pressure cylindrical stainless-steel reactor (High-Pressure Equipment Company, PA, USA) was used to carry out the torrefaction experiment with a muffle furnace as the heating source. For each run, nitrogen-to-solid ratios (NSRs) of 4, 5, and 6, equivalent to mass feeds of 15, 12, and 10 g, respectively, were placed in the reactor and inserted into the furnace having an inlet and outlet opening for gas. Nitrogen was used as the carrier gas and was kept constant at a flow rate of 60 mL/min throughout the experiment. The torrefaction experiment was allowed to start from room temperature, and 8 min was the allowable time, set for each final temperature to be reached. PSD was held at each final temperature for a designated time as determined by the Box–Behnken experimental design. Stainless steel exhibits some level of heat resistance, so there is bound to be a temperature drop inside the reactor. However, this was considerably compensated during the combustion of the solid fuel inside the reactor. During the pretreatment process, with the use of a type-K thermocouple, the temperature inside the reactor was discovered to be slightly higher than the furnace temperature. This was because the combustion process of the fuel material inside the reactor tends to increase the temperature inside the reactor when compared to the external temperature. This temperature difference was also dependent on the amount of fuel undergoing the combustion process. After each run, the furnace was allowed to cool to room temperature before removing biochar from the reactor to avoid oxidation.
The HHV for each biochar produced was also analyzed using a Parr Oxygen Bomb Calorimeter. Li et al.27 mathematically described the mass yield of torrefied biomass as the percentage ratio of the mass of produced biochar to the mass of biomass fed into the reactor. The energy enhancement factor (EEF) is mathematically described as the ratio of the HHV of biochar to the HHV of the initial feed.44 This EEF shows to what extent the energy content of the biomass has increased. Hence, the mass yield and energy enhancement factor were calculated using eqs 3 and 4, respectively. The ultimate analyses of some selected biochar were performed as described in Section 2.1.1.
| 3 |
| 4 |
MY is the mass yield, Mc is the mass of char, Mf is the mass of feed, EEF is the energy enhancement factor, HHVc is the HHV of char, and HHVf is the HHV of feed.
2.3. Solvolysis Experiment
The solvolysis experiment was performed with the same reactor used for the torrefaction process. However, the setup for the two processes was different due to the differences in carrying out torrefaction and solvolysis processes. A constant mass feed of 10 g was used while varying the volume of deionized water between 40, 50, and 60 mL to account for the liquid/solid ratios of 4, 5, and 6, respectively. Before each run, nitrogen gas was used to purge the reactor for 5 min and then sealed to ensure an inert atmosphere. Like the torrefaction experiment, each run was allowed to begin from room temperature and eventually raised to different final temperatures and kept for a residence time based on the Box–Behnken experimental design. After each run, the moisture hydrochar was rinsed with deionized water and eventually filtered. The residue (hydrochar) was then oven-dried at 105 °C for 24 h to remove any free moisture. The dried hydrochar was further analyzed. The mass yield and EEF were also calculated using eqs 3 and 4, respectively.
2.4. Experimental Design: Box–Behnken Design (BBD)
The response surface methodology (RSM) based on the Box–Behnken design (BBD) model is one of the most conventional methods for developing and optimizing the process conditions involved in any process. It is also efficient in studying the effects on the process involved, with a relatively small number of experimental runs, which saves time, labor, and cost. A three-factor Box–Behnken statistical design approach (BBD) was used to study the interactional and main effects of process conditions as well as the quadratic effect on three responses, namely, mass yield (MY), higher heating value (HHV), and energy efficiency factor (EEF) of biochar/hydrochar. BBD is usually sufficient to fit a quadratic model of the form illustrated in eq 5 and explain how the factors affect the responses.45
| 5 |
where γ is the experimental responses as indicated in Table 1, α0 is the intercept, αj, αjj, and αkj are partial regression coefficients, i represents the number of process conditions, and xj represents the three independent variables.
Table 1. Experimental Process Conditions and Coded Levels in BBDa.
| coded
level factor |
||||
|---|---|---|---|---|
| independent variable input | uncoded factor | –1 | 0 | +1 |
| temperature (°C) | P1 | 200 | 250 | 300 |
| time (min) | P2 | 30 | 75 | 120 |
| NSR/LSR (−) | P3 | 4 | 5 | 6 |
Response: HHV, higher heating value; EEF, energy enhancement factor; MY, mass yield. NSR, nitrogen-to-solid ratio; LSR, liquid-to-solid ratio.
Two experimental designs comprising 17 experiments each, with five center points each to estimate the pure error and lack of fit, were developed to model and optimize the process conditions. The process conditions employed during torrefaction in this study were premised on other studies published in the literature for other biomass types. Similar process conditions were employed for the solvolysis experiment to create a basis for comparison between biochar and hydrochar. The process conditions and coded levels implemented in this design are shown in Table 1.
2.4.1. Statistical Test and Analysis
Design-Expert version 12 software was used to carry out the statistical tests and analyses to make inferences about the developed models in this study. A 95% confidence level (i.e., P = 0.05) was employed to check the significance of each model developed in this study and each variable and interactional effect present in the model equations. Several statistical tests such as P test, F test, lack of fitness (LOF) test, coefficient of determination (R2), adjusted coefficient of determination (adj. R2), and predicted coefficient of determination (pred. R2) were employed to make accurate inferences about the developed models. The model was further used to develop three-dimensional response surface plots to study the interactional effect of process conditions.
2.5. Desirability Function Optimization
The desired function approach deals with simultaneously optimizing a design’s responses by employing a multiresponse analysis while concentrating within a range of process conditions, targeting, minimizing, or maximizing a process condition.46 The methodology explained by Derringer and Suich was adopted in this study. This approach requires that each response be transformed into a dimensionless desirability function (di) in order of importance between 1 and 0 (i.e., 1 being given to the response with the most importance and 0 to the least important). Eventually, the total desirability function (D) is deduced by determining the geometric average of each response’s desirability values as expressed in eq 6:
| 6 |
vi signifies
the importance each response from the model is
allocated and it ranges between 0 and 1 (i.e., 0 ≤ vi ≤ 1). The sum of vi is always 1 (i.e.,  ), where n is the number
of responses (3 in this study). di is
the desirability of each response. In essence, the target is to achieve
a D value close or equal to 1, which will indicate
that all responses achieved their aim. The same importance and desirability
were given to all three responses to achieve a maximum energy content
and a maximum mass yield. The same Design-Expert 12 software was used
in conducting this analysis.
2.6. Genetic Algorithm Optimization
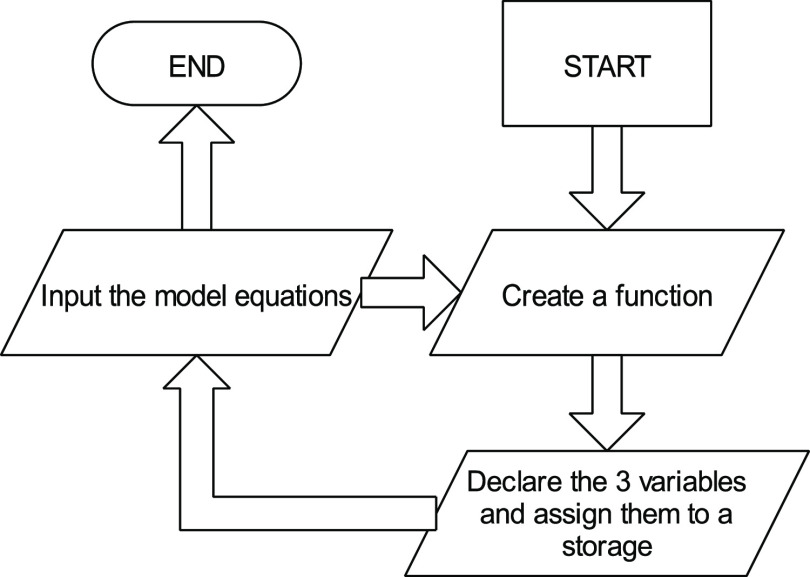
The genetic algorithm (GA) is a common technique used to develop high-quality solutions to optimization problems by applying biological mutation techniques to models, which explains experimental data. GA operates based on the principle of probability and evolution. This technique has been widely suggested to be an efficient method of optimizing models, giving a high accuracy level.47 MATLAB R2020b software was used in carrying out this analysis. The model equations developed using Design-Expert software were used in writing the function code. Figure 1 represents the flow chart used in developing the script for this analysis.
Figure 1.
Flow chart showing the development of the function file for GA optimization.
According to the flow chart, the “optimtool” function is used to call the optimization interface after creating the function file. The multiobjective optimization was chosen as the solver because there was more than one response, and a double vector population type was used. The feasible population was used as the creation and mutation function because it provides the most accurate values.
3. Results and Discussion
3.1. Physiochemical Properties of Raw and Pretreated PSD
The physicochemical properties that bring about the need to explore PSD as a good biofuel source are shown in Table 2. The lignocellulosic analysis of the PSD species (P. pinaster) considered in this study is shown in Table 2. The high volatile matter can be attributed to the high fraction of both hemicellulose and cellulose in PSD. The low ash content (0.59%) suggests that PSD can be efficient in producing biogas because high ash content hinders the thermochemical conversion process of biomass48 and reduces the higher heating value of biomass.49 The low inherent moisture content makes PSD suitable for the torrefaction process, although solvolysis is highly suitable for biomass with high moisture content.
Table 2. Physiochemical Properties and Lignocellulosic Composition of Raw PSDa.
| proximate
analysis (wt %, ad) |
ultimate
analysis (wt %, ad) |
lignocellulosic
composition |
||||||||||
|---|---|---|---|---|---|---|---|---|---|---|---|---|
| M | A | V | FCb | C | H | Ob | N | S | He | Ce | Li | HHV (MJ/kg) |
| 8.55 | 0.59 | 71.80 | 19.06 | 50.54 | 7.08 | 41.66 | 0.15 | 0.57 | 38.02 | 21.60 | 30.10 | 19.89 |
ad, air-dry basis; M, moisture; A, ash; V, volatile; FC, fixed carbon; He, hemicellulose; Ce, cellulose; Li, lignin.
By difference.
The oxygen-to-carbon (O:C) ratio of 0.82 and hydrogen-to-carbon (H:C) ratio of 0.14 obtained for the raw PSD were comparable to studies reported by Sanwal Hussain et al.50 on a lignite coal O:C ratio of 0.73 and a H:C ratio of 0.08. However, the mean O:C and H:C ratios were significantly reduced by torrefaction and solvolysis, as shown in Table 3.
Table 3. Ultimate Analysis of Some Pretreated PSDa.
| ultimate
analysis (%) |
||||||||||
|---|---|---|---|---|---|---|---|---|---|---|
| sample ID | temp (°C) | time (min) | NSR/LSR (−) | C | Ob | H | N | S | O:C | H:C |
| Torr1 | 200 | 30 | 5 | 51.76 | 42.6 | 5.15 | 0.14 | 0.35 | 0.82 | 0.10 |
| Torr2 | 250 | 120 | 4 | 59.56 | 35.69 | 4.33 | 0.15 | 0.27 | 0.60 | 0.07 |
| Torr3 | 250 | 120 | 6 | 61.34 | 34.15 | 4.13 | 0.13 | 0.25 | 0.56 | 0.07 |
| Torr4 | 300 | 30 | 5 | 58.75 | 35.84 | 5.00 | 0.13 | 0.28 | 0.61 | 0.09 |
| Torr5 | 300 | 120 | 5 | 65.56 | 30.18 | 3.90 | 0.13 | 0.23 | 0.46 | 0.06 |
| Solv1 | 200 | 30 | 5 | 56.67 | 37.86 | 4.80 | 0.15 | 0.52 | 0.67 | 0.08 |
| Solv2 | 250 | 120 | 4 | 59.94 | 34.84 | 4.57 | 0.14 | 0.51 | 0.58 | 0.08 |
| Solv3 | 250 | 120 | 6 | 64.96 | 29.81 | 4.66 | 0.14 | 0.43 | 0.46 | 0.07 |
| Solv4 | 300 | 30 | 5 | 60.81 | 33.81 | 4.76 | 0.14 | 0.48 | 0.56 | 0.08 |
| Solv5 | 300 | 120 | 5 | 66.13 | 28.93 | 4.41 | 0.15 | 0.38 | 0.44 | 0.07 |
Torr, torrefaction; Solv, solvolysis; NSR, nitrogen/solid ratio; LSR, liquid/solid ratio; C, carbon; O, oxygen; H, hydrogen; N, nitrogen; S, sulfur.
Calculated by difference.
Although the elemental composition of biochar/hydrochar was not one of the responses considered based on the aim of this study, some selected pretreated samples were analyzed for discussion purposes. Table 3 shows the ultimate analyses of some pretreated samples obtained from the torrefaction and solvolysis experiments designed using the BBD shown in Table 1. Five (5) samples of biochar (torrefaction) and hydrochar (solvolysis) were analyzed each to study the effect of temperature, time, and NSR/LSR on the CHNOS compositions. The selection of these specific samples was done in such a way that while two process conditions were kept constant, the other one was varied. For example, Torr1 and Torr4 varied the temperature, while the time and NSR were kept constant. Torr2 and Torr 3 varied the NSR, while the time and temperature were kept constatnt. Torr4 and Torr5 varied the time, while the temperature and NSR were kept constant.
A similar selection technique was used to carry out the ultimate analyses on some hydrochar samples. For example, Solv1 and Solv4 varied the temperature, while the time and LSR were kept constant. Solv4 and Solv5 varied the time, while the temperature and LSR were kept constant. Solv2 and Solv3 varied the LSR, while the temperature and time were kept constant.
It can be observed from Table 3 that the fraction of carbon significantly increased as the severity (i.e., the operating temperature and residence time) of the experiments increased for both pretreatment processes. Comparing Torr2 and Torr3, it can be seen that the carbon contents increased with NSR. This observation may be attributed to the fact that there is more uniform heating for a lesser mass feed of biomass, thereby breaking the oxygen bonds present in the sample. An increase in the LSR during solvolysis pretreatment increased the carbon content. This observation could be due to the influence of the subcritical nature of water during solvolysis and its tendency to destroy the hydrogen and oxygen bonds present in the biomass, thereby increasing the fraction of the carbon content.
The oxygen and hydrogen contents of pretreated PSD were considerably reduced, resulting from the removal of the volatile compounds having these atoms during torrefaction and solvolysis. The reduction in the oxygen content of torrefied PSD can be attributed to the decarboxylation and deoxygenation reactions during the pretreatment process. Similarly, the removal of the excess moisture content, CO2, CO, and other acidic compounds resulted in the significant reduction in the oxygen content of PSD during torrefaction. The carboxylic group’s removal, which has hydrogen atoms, contributes to the reduction of the hydrogen content of PSD during torrefaction.
The Van Krevelen plots (Figure 2) also show the elemental changes that occur during PSD pretreatment. These significant changes are a result of the different depolymerization reaction taking place during pretreatment processes. It can be observed that there is a linear relationship between the H:C and O:C ratios for both pretreatment processes. The color change is also evident as it changes from a light brown color to a black color as the severity of the pretreatment process increases.
Figure 2.
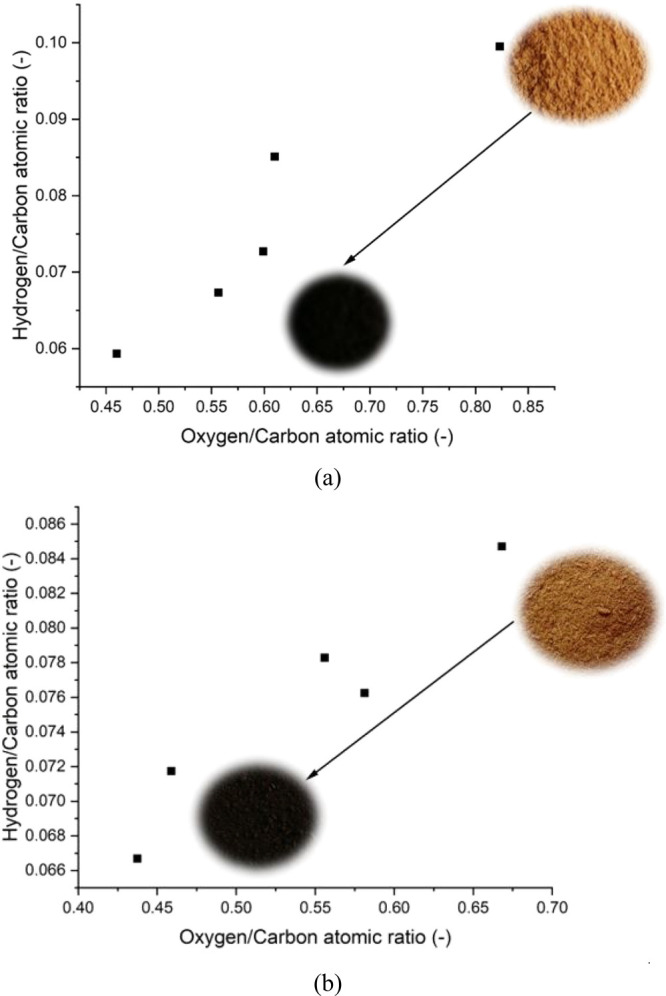
Van Krevelen diagram of PSD in (a) torrefaction and (b) solvolysis.
Conclusively, the increment in the carbon content of PSD after pretreatment can considerably increase the combustion characteristics (i.e., ignition temperature, mass transfer, heat and energy transfer, flammability test, combustion rate and time, etc.) of PSD accompanied by an increase in the higher heating value.36 The changes in the ultimate analysis of pretreated biomass are in agreement with the findings made by Gong et al.2 and Dai et al.12 for the torrefaction of PSD and solvolysis pretreatment of bamboo, respectively. These physicochemical property enhancements show that torrefaction and solvolysis can increase the efficiency of a gasification process whereby the energy content derived from the syn-gas is enough to cover up for the energy utilized in the thermochemical conversion process. This increased efficiency in the thermochemical conversion of biomass will make torrefaction and solvolysis economically viable.18
3.2. BBD Model Development and Statistical Analysis
The detailed experimental runs, including the responses, are presented in Tables 4 and 5 for torrefaction and solvolysis, respectively. A randomized order was observed to reduce the effect of a sequential variation in the results.
Table 4. Experimental Design and Responses for the Torrefaction Process.
| experimental value |
model value |
||||||||
|---|---|---|---|---|---|---|---|---|---|
| run | temp: X1 (°C) | time: X2 (min) | NSR: X3 (−) | HHV (MJ/kg) | mass yield (%) | EEF (−) | HHV (MJ/kg) | mass yield (%) | EEF (−) |
| 1 | 300 | 30 | 5 | 23.92 | 70.78 | 1.20 | 23.72 | 73.11 | 1.20 |
| 2 | 200 | 75 | 6 | 21.33 | 88.72 | 1.07 | 21.20 | 90.68 | 1.06 |
| 3 | 250 | 120 | 4 | 23.11 | 68.33 | 1.16 | 22.96 | 69.16 | 1.16 |
| 4 | 200 | 120 | 5 | 21.41 | 89.14 | 1.08 | 21.41 | 90.19 | 1.08 |
| 5 | 250 | 75 | 5 | 22.28 | 73.88 | 1.12 | 22.16 | 74.35 | 1.12 |
| 6 | 300 | 120 | 5 | 25.06 | 56.81 | 1.26 | 24.89 | 60.19 | 1.26 |
| 7 | 250 | 75 | 5 | 22.31 | 72.13 | 1.12 | 22.16 | 74.35 | 1.12 |
| 8 | 200 | 75 | 4 | 20.84 | 90.14 | 1.05 | 20.77 | 91.64 | 1.04 |
| 9 | 250 | 75 | 5 | 22.11 | 72.96 | 1.11 | 22.16 | 74.35 | 1.12 |
| 10 | 300 | 75 | 6 | 24.41 | 64.27 | 1.23 | 24.30 | 66.03 | 1.22 |
| 11 | 250 | 120 | 6 | 23.44 | 66.45 | 1.18 | 23.37 | 66.58 | 1.18 |
| 12 | 250 | 30 | 6 | 22.25 | 70.62 | 1.12 | 22.20 | 72.96 | 1.12 |
| 13 | 250 | 75 | 5 | 22.28 | 72.87 | 1.12 | 22.16 | 74.35 | 1.12 |
| 14 | 250 | 30 | 4 | 22.26 | 72.07 | 1.12 | 22.14 | 75.11 | 1.12 |
| 15 | 200 | 30 | 5 | 20.62 | 89.82 | 1.04 | 20.60 | 89.61 | 1.03 |
| 16 | 300 | 75 | 4 | 24.32 | 68.43 | 1.22 | 24.27 | 69.79 | 1.23 |
| 17 | 250 | 75 | 5 | 22.29 | 71.97 | 1.12 | 22.16 | 74.35 | 1.12 |
Table 5. Experimental Design and Responses for the Solvolysis Process.
| experimental value |
model values |
||||||||
|---|---|---|---|---|---|---|---|---|---|
| run | temp: X1 (°C) | time: X2 (min) | LSR: X3 (−) | HHV (MJ/kg) | mass yield (%) | EEF (−) | HHV (MJ/kg) | mass yield (%) | EEF (−) |
| 1 | 200 | 30 | 5 | 22.12 | 75.46 | 1.12 | 21.60 | 77.86 | 1.09 |
| 2 | 200 | 75 | 6 | 21.72 | 70.43 | 1.10 | 21.70 | 72.01 | 1.09 |
| 3 | 250 | 75 | 5 | 23.38 | 69.56 | 1.18 | 23.65 | 72.53 | 1.19 |
| 4 | 250 | 120 | 6 | 23.91 | 55.52 | 1.21 | 23.75 | 56.86 | 1.19 |
| 5 | 250 | 30 | 6 | 23.12 | 67.14 | 1.18 | 22.85 | 69.64 | 1.15 |
| 6 | 250 | 75 | 5 | 23.71 | 68.43 | 1.20 | 23.65 | 72.53 | 1.19 |
| 7 | 300 | 30 | 5 | 24.16 | 65.31 | 1.22 | 24.80 | 69.26 | 1.25 |
| 8 | 200 | 75 | 4 | 22.53 | 73.31 | 1.14 | 22.40 | 73.75 | 1.13 |
| 9 | 250 | 120 | 4 | 24.12 | 59.05 | 1.22 | 24.45 | 61.14 | 1.23 |
| 10 | 250 | 75 | 5 | 23.73 | 70.62 | 1.20 | 23.65 | 72.53 | 1.19 |
| 11 | 250 | 75 | 5 | 23.73 | 71.21 | 1.20 | 23.65 | 72.53 | 1.19 |
| 12 | 300 | 75 | 6 | 25.01 | 51.03 | 1.26 | 24.90 | 55.56 | 1.25 |
| 13 | 250 | 75 | 5 | 23.86 | 71.06 | 1.21 | 23.65 | 72.53 | 1.19 |
| 14 | 300 | 75 | 4 | 26.42 | 59.79 | 1.33 | 25.60 | 63.10 | 1.29 |
| 15 | 250 | 30 | 4 | 23.52 | 71.45 | 1.19 | 23.55 | 74.64 | 1.19 |
| 16 | 300 | 120 | 5 | 26.13 | 48.93 | 1.32 | 25.70 | 51.17 | 1.29 |
| 17 | 200 | 120 | 5 | 22.43 | 68.71 | 1.13 | 22.50 | 69.67 | 1.13 |
The relationship between the process conditions and the responses used in this study was developed using the actual equations and coded equations, considering the quadratic regression depicted in eq 5. The coded equations shown in eqs 7–12 were used to study the relative impact of the process conditions on the responses by comparing the factor coefficients and their signs. Meanwhile, the actual equations, as shown in eqs 13–18, were used to make predictions about the responses given any set of process conditions. The actual equations were developed based on the unit and the value scale of each process condition.
| 7 |
| 8 |
| 9 |
| 10 |
| 11 |
| 12 |
| 13 |
| 14 |
| 15 |
| 16 |
| 17 |
| 18 |
An analysis of variance (ANOVA) test was done to determine the experimental results’ statistical significance and the developed models. The developed models for both torrefaction and solvolysis processes were statistically significant, as indicated by the F values reported in Tables 6 and 7, respectively. This observation implies that to a satisfactory confidence level of 95%, the model can adequately describe the experimental results. It is also observed that the HHV and EEF both have the same ANOVA table and, consequently, similar statistical conclusions. This observation was due to the linear relationship between the HHV and the EEF, as shown in eq 4 (i.e., showing high collinearity). A process variable is considered significant if the P value is less than 0.05.
Table 6. Analysis of Variance (ANOVA) of Torrefaction Models.
| source | DF | F value | P value | comment |
|---|---|---|---|---|
| HHV and EEF: higher heating value and energy enhancement factor | ||||
| model | 9 | 362.28 | <0.0001 | significant |
| X1: temp. | 1 | 2877.83 | <0.0001 | |
| X2: time | 1 | 248.51 | <0.0001 | |
| X3: NSR | 1 | 12.77 | 0.0091 | |
| X1X2 | 1 | 3.86 | 0.0901 | |
| X1X3 | 1 | 5.05 | 0.0595 | |
| X2X3 | 1 | 3.65 | 0.0979 | |
| X12 | 1 | 27.91 | 0.0011 | |
| X22 | 1 | 38.50 | 0.0004 | |
| X32 | 1 | 31.04 | 0.0008 | |
| lack of fit | 3 | 1.46 | 0.3523 | not significant |
| R2 = 0.9979; adj. R2 = 0.9951; pred. R2 = 0.9805; adeq. precision = 63.9923 | ||||
| MY: mass yield | ||||
| model | 9 | 165.60 | <0.0001 | significant |
| X1: temp. | 1 | 1189.01 | <0.0001 | |
| X2: time | 1 | 63.62 | 0.0005 | |
| X3: NSR | 1 | 9.92 | 0.0473 | |
| X1X2 | 1 | 44.16 | 0.0014 | |
| X1X3 | 1 | 1.88 | 0.3308 | |
| X2X3 | 1 | 0.0462 | 0.8744 | |
| X12 | 1 | 161.80 | <0.0001 | |
| X22 | 1 | 22.73 | 0.0083 | |
| X32 | 1 | 4.83 | 0.1376 | |
| lack of fit | 3 | 3.23 | 0.0655 | not significant |
| R2 = 0.9920; adj. R2 = 0.9817; pred. R2 = 0.8942; adeq. precision = 32.0294 | ||||
Table 7. Analysis of Variance (ANOVA) of Solvolysis Models.
| source | DF | F value | P value | comment |
|---|---|---|---|---|
| HHV and EEF: higher heating value and energy enhancement factor | ||||
| model | 3 | 57.67 | <0.0001 | significant |
| X1: temp. | 1 | 153.30 | <0.0001 | |
| X2: time | 1 | 12.37 | 0.0038 | |
| X3: LSR | 1 | 7.36 | 0.0178 | |
| lack of fit | 9 | 5.69 | 0.0548 | not significant |
| R2 = 0.9301; adj. R2 = 0.9140; pred. R2 = 0.8593; adeq. precision = 23.1757 | ||||
| MY: mass yield | ||||
| model | 9 | 110.70 | <0.0001 | significant |
| X1: temp. | 1 | 493.77 | <0.0001 | |
| X2: time | 1 | 277.89 | <0.0001 | |
| X3: LSR | 1 | 47.43 | 0.0004 | |
| X1X2 | 1 | 23.18 | 0.0033 | |
| X1X3 | 1 | 8.64 | 0.0321 | |
| X2X3 | 1 | 0.1521 | 0.7338 | |
| X12 | 1 | 28.72 | 0.0018 | |
| X22 | 1 | 36.93 | 0.0009 | |
| X32 | 1 | 64.84 | 0.0002 | |
| lack of fit | 3 | 3.02 | 0.5830 | not significant |
| R2 = 0.9915; adj. R2 = 0.9807; pred. R2 = 0.9434; adeq. precision = 32.5437 | ||||
Furthermore, the coefficient of determination (R2) of the responses explained by the process variables and the lack of fit were analyzed to support the inferences made by the F test. For the sake of inference, Keivani et al.51 suggested that an R2 greater than 0.85 can be considered a reliable model. An R2 of 0.85 means that the process variables can explain 85% of the variance in the responses. From Tables 6 and 7, respectively, the reported R2 values for the HHV and MY for torrefaction and solvolysis are 0.9979, 0.9920, 0.9301, and 0.9915, which validate the significance of the model.
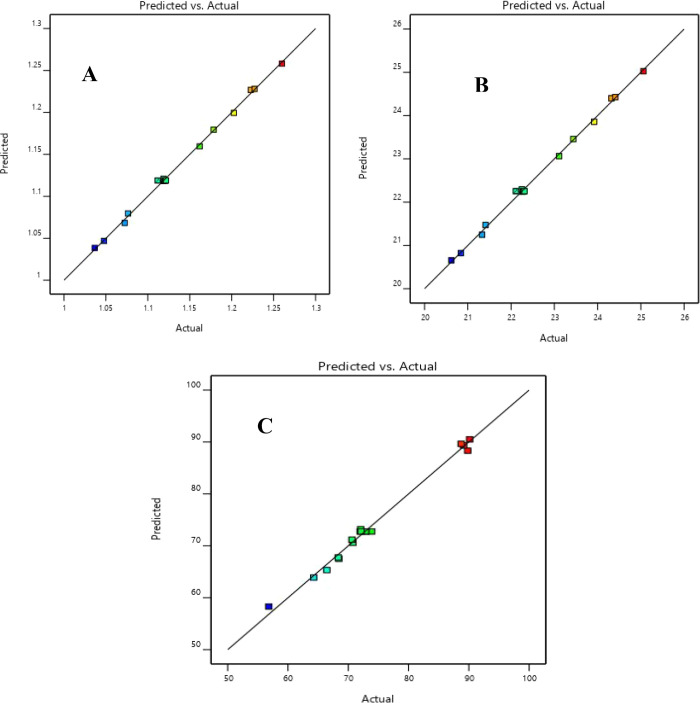
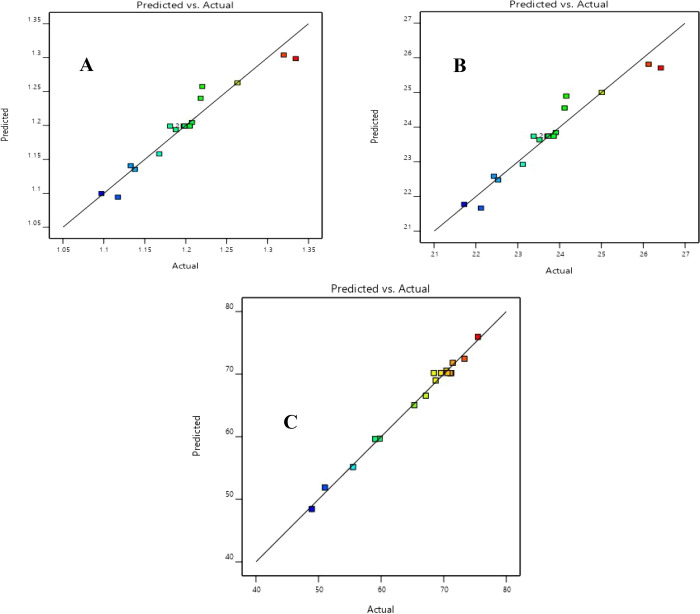
Although the R2 can be overestimated while increasing the number of terms in the model, the adjusted R2 (adj. R2) gives a better view of the model’s significance. All adjusted R2 values were higher than 0.91, supporting the significance of the models. The efficiency of the developed regression models for torrefaction and solvolysis was also verified by plotting the predicted values against the actual values, as shown in Figures 3 and 4. The predicted R2 reported in Tables 6 and 7 also showed values higher than 0.85. Additionally, the adjusted and predicted R2 values were within a difference of less than 0.2, indicating an adequate agreement level.52
Figure 3.
Predicted responses against actual responses of (A) EEF, (B) HHV, and (C) MY for the torrefaction process.
Figure 4.
Predicted responses against actual responses of (A) EEF, (B) HHV, and (C) MY for the solvolysis process.
The lack of fitness test was used to check the acceptability of the models. This test compares the residuals associated with the model and the pure error, estimated by the design’s center points. While employing a 95% confidence level, the LOF’s P values for all models were higher than 0.05, indicating its nonsignificance. There were 35.2 and 6.6% chances that a lack-of-fit F value this large for the HHV model and mass yield model could occur due to noise during torrefaction. Similarly, there were 5.5 and 58.3% chances that a lack-of-fit F value this large for the HHV model and mass yield model could occur due to noise during solvolysis. The LOF should not be significant because we want the model to fit.5
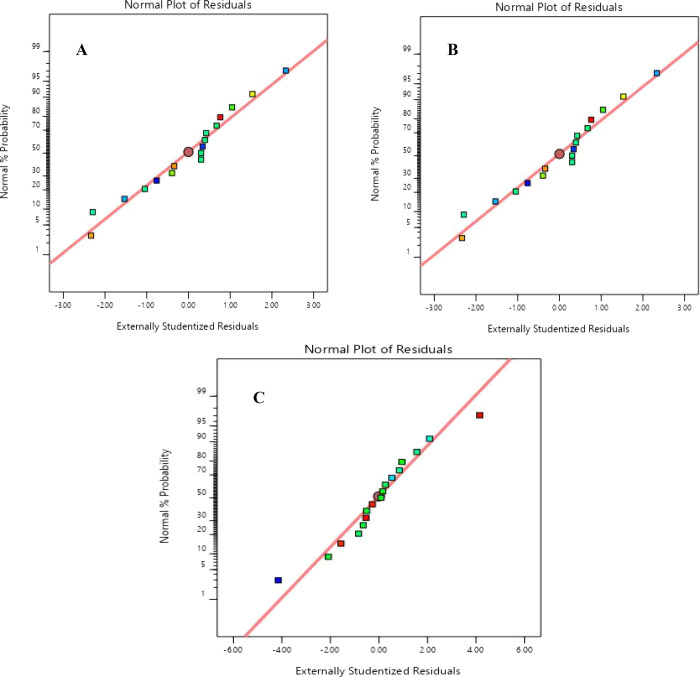
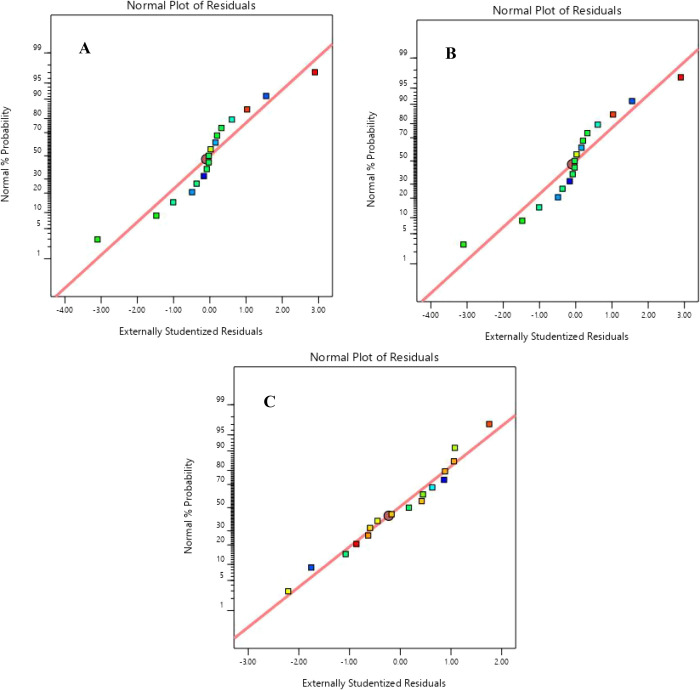
Adequate precision is used to measure the signal-to-noise ratio. It helps one to check if the developed model is adequate to determine the responses within the design space. All models were found to have a ratio greater than 4, indicating an adequate signal. The residuals’ homoscedasticity was studied to ascertain that the normality assumption for a regression model is observed. This study was done through the study of the normal probability plots of the residuals. It can be confirmed that the normality assumption is observed as the residuals between the actual and predicted values were normally distributed at random, exhibited by the straight-line graph as shown in Figures 5 and 6 for torrefaction and solvolysis processes, respectively.
Figure 5.
Normal plot of residuals for (A) HHV, (B) EEF, and (C) MY for the torrefaction process.
Figure 6.
Normal plot of residuals for (A) HHV, (B) EEF, and (C) MY for the solvolysis process.
3.3. Comparative Analysis of the Effect of Process Conditions on Torrefaction and Solvolysis Processes
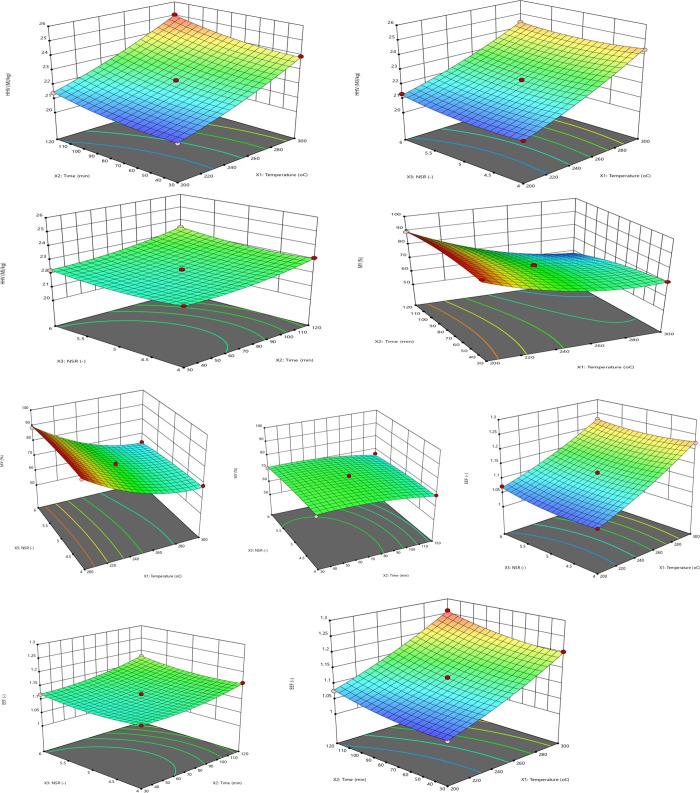
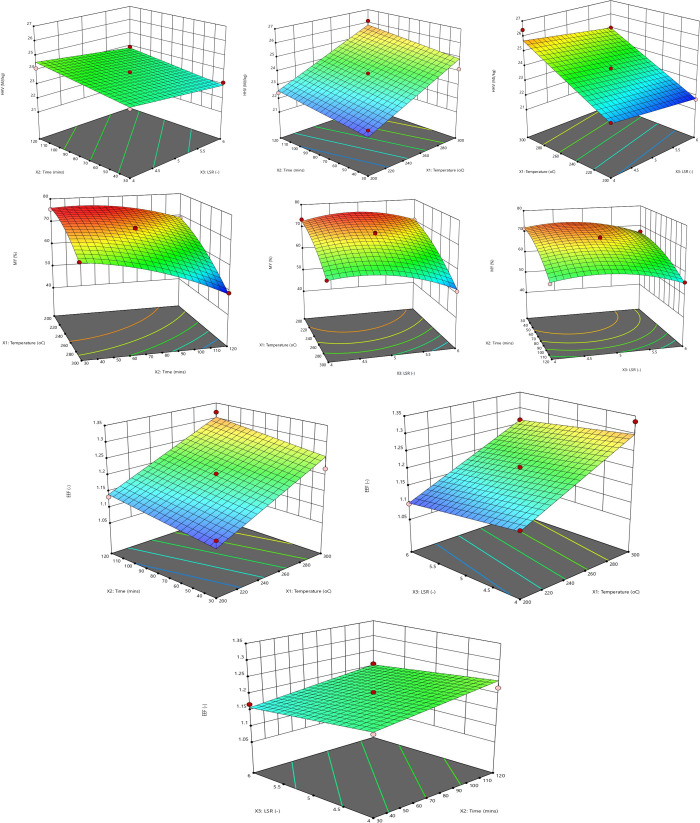
Three responses were used to study and compare the effect of process conditions on torrefaction and solvolysis processes. Three-dimensional response surface plots shown in Figures 7 and 8 were used to study these effects for torrefaction and solvolysis. The 3D surface plots show the effect of any two process conditions on individual responses, keeping the third condition constant (usually the midpoint value). These plots make it possible to study how each response changes while varying process conditions simultaneously, i.e., avoiding considering OFAT (one factor at a time).
Figure 7.
3D response surface plots of HHV, MY, and EEF for the torrefaction process.
Figure 8.
3D response surface plots of HHV, MY, and EEF for the solvolysis process.
3.3.1. Effect of Process Conditions on HHV and EEF
The 3D surface plots describe the effect of all three process conditions (i.e., temperature: X1, time: X2, and NSR/LSR: X3) on the higher heating value of pretreated PSD are shown in Figures 7 and 8. It is shown that the HHV of biomass is highly significantly (i.e., P < 0.0001) influenced by the reaction temperature. From the 3D plots, it can be concluded that there is a linear correlation between the HHV and temperature of biomass. The analysis of the torrefaction model’s variance suggests that only the independent and squared effects of the process conditions were significant in explaining the HHV of PSD (see Table 6). In contrast, only the independent process conditions were the only significant terms in explaining the HHV of PSD during the solvolysis process (see Table 7).
Unlike other developed models, the highly significant HHV model (P < 0.0001) for the solvolysis process only contained the independent terms. This observation was in agreement with the result reported by Gan et al.53 for the pretreatment of palm kernel shells via solvolysis. Like the torrefaction process, the independent temperature term showed the most significance on the HHV of PSD during the solvolysis process. In addition, the temperature and residence time significantly affected the HHV than the LSR/NSR for both processes.
From the coded equations for the torrefaction process (see eqs 7 and 9), an increase in the temperature, time, and NSR (i.e., reduction of mass feed) increases the HHV and EEF of PSD, which agrees with results reported in the literature.5,54−58 Due to the low conductivity property of biomass, it has been reported that there is a limitation in the transference of heat from the heating source of the torrefier to the biomass sample.59,60 As a result of this limitation, higher temperatures will be required to ensure uniform decomposition of the lignocellulosic components throughout the biomass sample, translating into an increase in the HHV. This phenomenon is responsible for increasing HHV and EEF as the mass feed reduces (i.e., an increase in NSR).
Furthermore, as indicated by the coded equations for the solvolysis process (see eqs 10 and 12), unlike LSR, an increase in the reaction temperature and time increases the HHV and EEF. Similar observations have been reported by Bach et al.,61 Chen et al.,62 Gong et al.,2 and He et al.34 The full quadratic coded equation for torrefaction also shows that each independent process condition’s squared effects positively affect the HHV of PSD. These significant terms also suggest that the squared time and NSR term has more effect than the squared temperature term.
While comparing torrefaction and solvolysis using a similar process condition, it was observed that there was a 26% increase in HHV recorded by torrefaction. In comparison, a 31.37% increase in HHV was recorded after solvolysis. This observation can be seen by comparing run 6 of Table 4 and run 16 of Table 5.
Similarly, comparing run 15 of Table 4 and run 1 of Table 5 (i.e., having similar process conditions), torrefaction improved the HHV of PSD by 3.76%, while solvolysis improved the HHV of PSD by 11.21%.
Therefore, it can be concluded that solvolysis tends to improve the HHV of PSD higher than the torrefaction process. Similar observations were made by Bach and Skreiberg63 and Yan et al.28
3.3.2. Effect of Process Conditions on Mass Yield
The graphical representation of the effect of process conditions on the mass yield of fuel is shown in Figures 7 and 8 during torrefaction and solvolysis. It can be observed that the pretreatment of PSD results in a continuous mass loss as the severity of the operating conditions increased. The methoxy group’s removal from the lignin component of PSD and elimination of the carboxyl group from the PSD hemicellulose component can be attributed to these observed mass losses. The removal of both the carbonyl and carboxyl groups from the cellulose component of PSD could also be responsible for the observed mass loss during pretreatment.21,64
Torrefaction and solvolysis indicated that temperature was the most influential variable on the mass yield of the char. The order of influence on the mass yield was temperature > time > NSR/LSR, as indicated by the P values, as shown in Tables 6 and 7. Nizamuddin et al.65 and Kumar et al.5 also reported that the severity (which is most influenced by the reaction temperature) of the pretreatment process dramatically affects the mass yield of char. As shown in Tables 6 and 7, and from the interactional terms, the temperature–time relationship was significant (P < 0.05) for torrefaction. In contrast, both the temperature–time and temperature–LSR relationships were found to be significant for solvolysis. Only the time–LSR term was found to be insignificant for the solvolysis process.
This observation indicates that the LSR relies more on the operating temperature of the process than the residence time to affect the mass yield of hydrochar. All linear terms have negative signs, as shown in eqs 8 and 11, indicating a negative effect on the mass yield of both biochar and hydrochar. As explained earlier, a smaller mass feed of biomass (i.e., increase in NSR) results in a negative effect on biomass’ mass yield.
The mass yield of hydrochar reduces as the LSR increases. This phenomenon was attributed to water behavior at the subcritical temperature region, which readily decomposes the lignocellulosic components.66 Aside from the temperature’s quadratic term, all other terms negatively affect the mass yield of biochar. This observation suggests that the negative effect of temperature on mass yield at too high temperatures tends to reduce at extremely high temperatures. This observation could also be attributed to the reduction in the effect of temperature on the conversion of fixed carbon formed after the volatilization process.
Furthermore, both processes’ residence times exhibit negative effects on the mass yield of the char produced. This negative effect is because a longer residence time implies that biomass spends a longer time in the reactor to form more oxygenated volatile compounds, resulting in a lower mass yield.67
Tables 4 and 5 show that solvolysis negatively affects the mass yield of char than the torrefaction process. Two similar process conditions (i.e., run 6 of Table 4 and run 16 of Table 5) were used to compare the torrefaction and solvolysis processes in terms of mass yield. It can be observed that torrefaction yielded a mass of 56.81%, while solvolysis yielded a mass of 48.93%. Similarly, comparing similar process conditions in run 15 of Table 4 and run 1 of Table 5, torrefaction recorded a higher mass yield of 89.82% than solvolysis (75.46%). This comparison indicates that the solvolysis process negatively affects the mass yield of biomass at lower temperature regions than the torrefaction process.
3.4. Optimization of Process Conditions
Several methods have been employed to carry out the optimization of torrefaction and solvolysis processes. One of these methods is to evaluate the energy yield of biochar/hydrochar, a function of the HHV and the mass yield. However, this method has been considered inefficient in determining the optimum because the energy yield decreases with an increase in the severity of the pretreatment process.56 Hence, an ideal method to estimate the optimal conditions is by simultaneously increasing the mass yield and HHV of biochar/hydrochar.
3.4.1. Optimization Using the Desirability Function
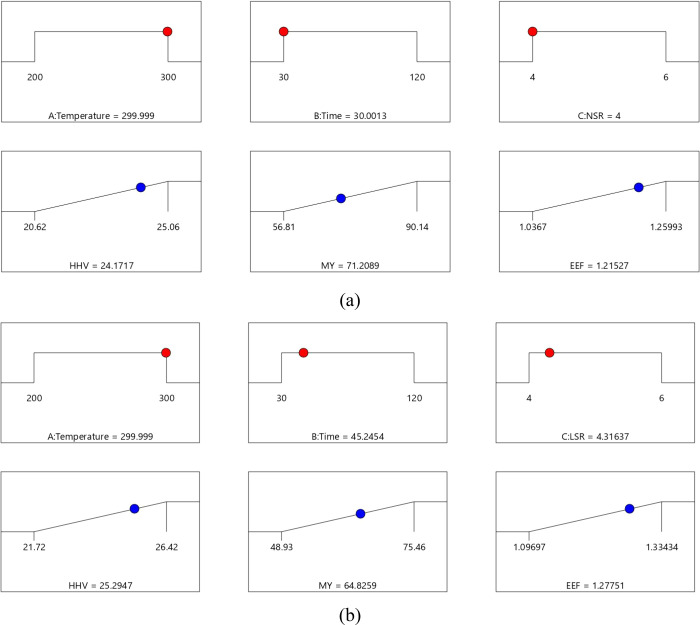
As described in Section 2.5, equal weights of 1 and equal importance were assigned to all responses to determine the optimal conditions within the range of the process conditions. As shown in Figure 9, based on the desirability function approach, the optimal process conditions based on the responses for the solvolysis process were at 299.99 °C, 45.25 min, and 4.32 LSR, while those for the torrefaction process were at 299.99 °C, 30.00 min, and 4.00 NSR. Under the optimal conditions, the desirability values for torrefaction and solvolysis were 0.651 and 0.702, respectively. These desirability values indicate that 65.1 and 70.02% of all responses reached their respective torrefaction and solvolysis process targets, respectively.
Figure 9.
Optimal conditions for (a) torrefaction and (b) solvolysis pretreatment processes.
3.4.2. Optimization Using the Genetic Algorithm (GA)
Although the genetic algorithm has been broadly applied in industry to optimize processes, using the genetic algorithm to optimize the torrefaction and solvolysis processes is scarce in the literature. It is required that before the use of the genetic algorithm for optimization, the objective functions are transformed into a minimizing function. The HHV and MY models, developed using the Box–Behnken design, were used as the objective functions 1 and 2. The EEF model was excluded because it is directly proportional to the HHV (i.e., optimizing the HHV translates to an optimization of the EEF). Figure 10 shows the optimization process’ genealogy, which illustrates how genes are reproduced from generation to generation.
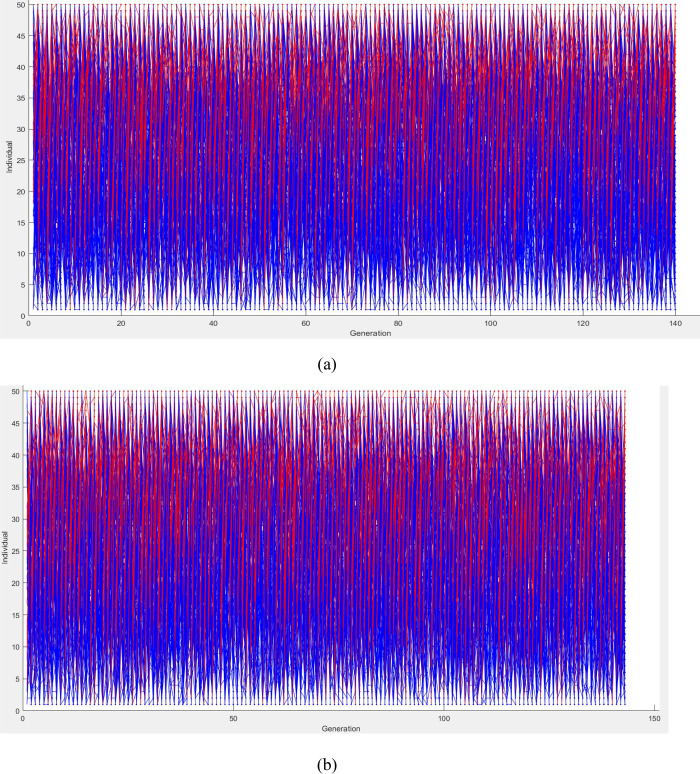
Figure 10.
Genealogy for the optimization: (a) Torrefaction and (b) solvolysis processes.
The errors existing in the optimal conditions are reduced after each generation. The optimization was terminated when the average change in the Pareto solutions’ spread was less than the function tolerance. It can be observed that for both torrefaction and solvolysis optimization, the reproduction terminated at the 140th generation. The Pareto plot, as shown in Figure 11, gives the various optimal conditions that can be possibly estimated depending on the importance given to a response. However, for this study, the optimal conditions were chosen based on values’ closeness with the optimized values estimated using the desirability function.
Figure 11.
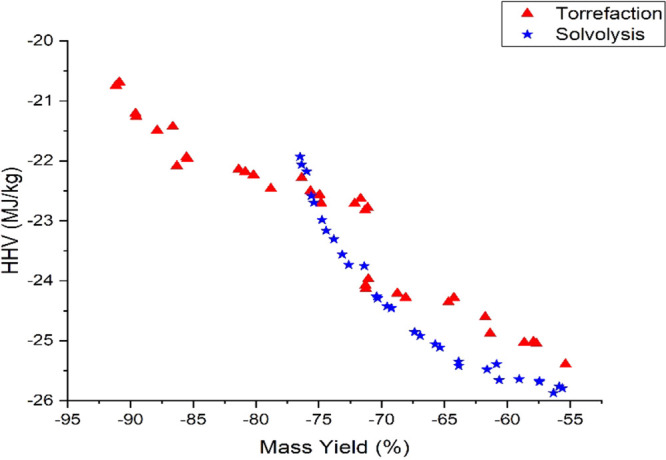
Pareto plots showing the optimal responses for torrefaction and solvolysis.
Hence, the optimal conditions estimated using the genetic algorithm for torrefaction and solvolysis processes were at 299.83 °C, 30.07 min, and 4.12 NSR and 295.10 °C, 50.85 min, and 4.55 LSR, respectively.
3.4.3. Comparison of Optimization Techniques (RSM and GA)
Comparison of the optimization techniques used in this study was done by validating the optimal responses predicted by both the response surface methodology (RSM) and genetic algorithm (GA) with the developed models’ expected responses. As shown in Table 8, the predicted values are the optimized responses obtained from the RSM and GA optimization techniques. In contrast, the calculated values are the responses expected to be obtained via the developed regression model equations for the different optimal process conditions.
Table 8. Comparison between the Predicted and Calculated Values of the Responses under Optimum Process Conditions.
| HHV (MJ/kg) |
MY (%) |
|||||||||
|---|---|---|---|---|---|---|---|---|---|---|
| process | technique | X1 (°C) | X2 (min) | X3 (−) | predicted | calculated | |error| (%) | predicted | calculated | |error| (%) |
| torrefaction | RSM | 299.99 | 30.00 | 4.00 | 24.17 | 24.20 | 0.12 | 71.21 | 71.24 | 0.04 |
| GA | 299.83 | 30.07 | 4.12 | 24.13 | 24.13 | 0.00 | 71.27 | 71.27 | 0.00 | |
| solvolysis | RSM | 299.99 | 45.25 | 4.32 | 25.29 | 25.28 | 0.04 | 64.83 | 64.80 | 0.05 |
| GA | 295.10 | 50.85 | 4.55 | 25.11 | 25.11 | 0.00 | 65.36 | 65.36 | 0.00 | |
As seen in Table 8, the absolute error values indicate the genetic algorithm to show a high level of accuracy compared to a response surface methodology. This accuracy is attributed to the GA’s principle, which involves a natural genetic system of coding each optimization solution as chromosomes and therefore reproducing generations that reduced the error to the bare minimum. Furthermore, although the desirability function approach based on RSM helps assign importance to responses before optimization, GA also offers a series of optimized solutions and allows the user to pick the best conditions based on the most important response.
4. Conclusions
Two pretreatment tests, torrefaction and solvolysis, were carried out using PSD to understand the effect of process conditions such as temperature, time, and NSR/LSR on the fuel properties of biochar/hydrochar produced from the biomass fuel, respectively. The RSM (Box–Behnken design) method was used to design the experiments. The desirability function and genetic algorithm (GA) were employed for modeling and optimization processes. From this study, the following conclusions can be made:
RSM was efficient in developing regression models that could explain process conditions’ interactional effect during the process. The ANOVA gave an informed conclusion on the statistical significance of the developed regression models.
The most influential variables on the responses (HHV, mass yield, and energy enhancement factor) for the pretreated PSD are of the order operating temperature > residence time > NSR/LSR.
The effect of the liquid-to-solid ratio on mass yield during the solvolysis process is highly dependent on the operating temperature than the time.
Although solvolysis pretreatment recorded a higher energy enhancement factor than torrefaction, the torrefaction pretreatment process recorded a higher mass yield than the solvolysis process.
The desirability function approach and GA showed close optimum conditions for torrefaction and solvolysis processes. Still, the GA gave more accurate responses when compared to the calculated values using the regression model.
In this study, the results obtained from the torrefaction and solvolysis processes were promising. Still, it is recommended that more studies should be done on the solvolysis process to exploit its promising future. The design of a torrefier should be considered to achieve more uniform heating when the biomass mass loading is increased. An extensive understanding of the elemental composition changes in pretreated biomass via torrefaction and solvolysis could be considered for future works. Furthermore, GA should be adopted as an optimization technique in this field of study to obtain accurate results that can be implemented in automated energy/coal-fired plants in industry.
Acknowledgments
The authors gratefully thank the Research and Innovation Support and Advancement in collaboration with the National Research Foundation, South Africa (DST-NRF), for the financial support provided to the first author (grant no. 123105). The School of Chemical and Metallurgical Engineering at the University of The Witwatersrand, Johannesburg, South Africa, and the School of Chemical Engineering at the University of Pretoria, Hatfield, South Africa, supported the study with the provision of the experimental facilities used in the course of this study.
The authors declare no competing financial interest.
References
- Lynam J. G.; Reza M. T.; Yan W.; Vásquez V. R.; Coronella C. J. Hydrothermal carbonization of various lignocellulosic biomass. Biomass Convers. Biorefinery 2015, 5, 173–181. 10.1007/s13399-014-0137-3. [DOI] [Google Scholar]
- Gong C.; Huang J.; Feng C.; Wang G.; Tabil L.; Wang D. Effects and mechanism of ball milling on torrefaction of pine sawdust. Bioresour. Technol. 2016, 214, 242–247. 10.1016/j.biortech.2016.04.062. [DOI] [PubMed] [Google Scholar]
- Aguado R.; Cuevas M.; Pérez-Villarejo L.; Martínez-Cartas M. L.; Sánchez S. Upgrading almond-tree pruning as a biofuel via wet torrefaction. Renewable Energy 2020, 145, 2091–2100. 10.1016/j.renene.2019.07.142. [DOI] [Google Scholar]
- Cahyanti M. N.; Doddapaneni T. R. K. C.; Kikas T. Biomass torrefaction: An overview on process parameters, economic and environmental aspects and recent advancements. Bioresour. Technol. 2020, 122737. 10.1016/j.biortech.2020.122737. [DOI] [PubMed] [Google Scholar]
- Kumar R.; Sarkar A.; Prasad J. Effect of torrefaction on the physicochemical properties of eucalyptus derived biofuels: estimation of kinetic parameters and optimizing torrefaction using response surface methodology ( RSM ). Energy 2020, 198, 117369. 10.1016/j.energy.2020.117369. [DOI] [Google Scholar]
- Lu Q.; Li W.; Zhang X.; Liu Z.; Cao Q.; Xie X.; Yuan S. Experimental study on catalytic pyrolysis of biomass over a Ni/Ca-promoted Fe catalyst. Fuel 2020, 263, 116690. 10.1016/j.fuel.2019.116690. [DOI] [Google Scholar]
- Raymundo L. M.; Espindola J. S.; Borges F. C.; Lazzari E.; Trierweiler J. O.; Trierweiler L. F. Continuous fast pyrolysis of rice husk in a fluidized bed reactor with high feed rates. Chem. Eng. Commun. 2020, 1–11. 10.1080/00986445.2020.1798937. [DOI] [Google Scholar]
- Vasudev V.; Ku X.; Lin J. Pyrolysis of algal biomass: Determination of the kinetic triplet and thermodynamic analysis. Bioresour. Technol. 2020, 317, 124007. 10.1016/j.biortech.2020.124007. [DOI] [PubMed] [Google Scholar]
- Wallace C. A.; Afzal M. T.; Saha G. C. Effect of feedstock and microwave pyrolysis temperature on physio-chemical and nano-scale mechanical properties of biochar. Bioresour. Bioprocess. 2019, 6, 1. 10.1186/s40643-019-0268-2. [DOI] [Google Scholar]
- Zhang F.; He Z.; Tu R.; Jia Z.; Wu Y.; Sun Y.; Jiang E.; Xu X. Influence of Ultrasonic/Torrefaction Assisted Deep Eutectic Solvents on the Upgrading of Bio-Oil from Corn Stalk. ACS Sustainable Chem. Eng. 2020, 8, 8562–8576. 10.1021/acssuschemeng.0c00837. [DOI] [Google Scholar]
- Acharya B.; Dutta A.; Minaret J. Review on comparative study of dry and wet torrefaction. Sustain. Energy Technol. Assess. 2015, 12, 26–37. 10.1016/j.seta.2015.08.003. [DOI] [Google Scholar]
- Dai L.; He C.; Wang Y.; Liu Y.; Ruan R.; Yu Z.; Zhou Y.; Duan D.; Fan L.; Zhao Y. Hydrothermal pretreatment of bamboo sawdust using microwave irradiation. Bioresour. Technol. 2018, 247, 234–241. 10.1016/j.biortech.2017.08.104. [DOI] [PubMed] [Google Scholar]
- Gucho E.; Shahzad K.; Bramer E.; Akhtar N.; Brem G. Experimental study on dry torrefaction of beech wood and miscanthus. Energies 2015, 8, 3903–3923. 10.3390/en8053903. [DOI] [Google Scholar]
- Pérez J. F.; Raul M.; Samaniego P.; Garcia M. Torrefaction of Fast-Growing Colombian Wood Species. Waste Biomass Valoriz. 2019, 10, 1655–1667. 10.1007/s12649-017-0164-y. [DOI] [Google Scholar]
- Prins M. J.; Ptasinski K. J.; Janssen F. J. J. G. Torrefaction of wood. Part 1. Weight loss kinetics. J. Anal. Appl. Pyrolysis 2006, 77, 28–34. 10.1016/j.jaap.2006.01.002. [DOI] [Google Scholar]
- Tran K. Q.; Luo X.; Seisenbaeva G.; Jirjis R. Stump torrefaction for bioenergy application. Appl. Energy 2013, 112, 539–546. 10.1016/j.apenergy.2012.12.053. [DOI] [Google Scholar]
- Chen D.; Li Y.; Deng M.; Wang J.; Chen M.; Yan B.; Yuan Q. Effect of torrefaction pretreatment and catalytic pyrolysis on the pyrolysis poly-generation of pine wood. Bioresour. Technol. 2016, 615–622. 10.1016/j.biortech.2016.04.058. [DOI] [PubMed] [Google Scholar]
- Winjobi O.; Shonnard D. R.; Zhou W. Production of Hydrocarbon Fuel Using Two-Step Torrefaction and Fast Pyrolysis of Pine. Part 1: Techno-economic Analysis. ACS Sustain. Chem. Eng. 2017, 5, 4529–4540. 10.1021/acssuschemeng.7b00373. [DOI] [Google Scholar]
- Yılgın M.; Duranay N.; Pehlivan D. Torrefaction and combustion behaviour of beech wood pellets. J. Therm. Anal. Calorim. 2019, 138, 819–826. 10.1007/s10973-019-08250-4. [DOI] [Google Scholar]
- Pathomrotsakun J.; Nakason K.; Kraithong W.; Khemthong P.; Panyapinyopol B.; Pavasant P. Fuel properties of biochar from torrefaction of ground coffee residue: effect of process temperature, time, and sweeping gas. Biomass Convers. Biorefinery 2020, 10, 743–753. 10.1007/s13399-020-00632-1. [DOI] [Google Scholar]
- Nhuchhen D. R.; Afzal M. T.; Parvez A. M. Effect of torrefaction on the fuel characteristics of timothy hay. Biofuels 2018, 7269, 1–14. 10.1080/17597269.2018.1479135. [DOI] [Google Scholar]
- Cha J. S.; Park H. S.; Jung S.-C.; Ryu C.; Jeon J.; Shin M.-S.; Park Y.-K. Production and utilization of biochar: A review. J. Ind. Eng. Chem. 2016, 40, 1–15. 10.1016/j.jiec.2016.06.002. [DOI] [Google Scholar]
- Yu S.; Park J.; Kim M.; Kim H.; Ryu C.; Lee Y.; Yang W.; Jeong Y. Improving Energy Density and Grindability of Wood Pellets by Dry Torrefaction. Energy Fuels 2019, 33, 8632–8639. 10.1021/acs.energyfuels.9b01086. [DOI] [Google Scholar]
- Wang G. J.; Luo Y. H.; Deng J.; Kuang J. H.; Zhang Y. L. Pretreatment of biomass by torrefaction Chinese Sci. Bull. 2011, 56, 1442–1448. 10.1007/s11434-010-4143-y. [DOI] [Google Scholar]
- Chen Z.; Wang M.; Jiang E.; Wang D.; Zhang K.; Ren Y.; Jiang Y. Pyrolysis of Torrefied Biomass. Trends Biotechnol. 2018, 36, 1287–1298. 10.1016/j.tibtech.2018.07.005. [DOI] [PubMed] [Google Scholar]
- Yue Y.; Singh H.; Singh B.; Mani S. Torrefaction of sorghum biomass to improve fuel properties. Bioresour. Technol. 2017, 232, 372–379. 10.1016/j.biortech.2017.02.060. [DOI] [PubMed] [Google Scholar]
- Li S. X.; Chen C. Z.; Li M. F.; Xiao X. Torrefaction of corncob to produce charcoal under nitrogen and carbon dioxide atmospheres. Bioresour. Technol. 2018, 249, 348–353. 10.1016/j.biortech.2017.10.026. [DOI] [PubMed] [Google Scholar]
- Yan W.; Perez S.; Sheng K. Upgrading fuel quality of moso bamboo via low temperature thermochemical treatments: Dry torrefaction and hydrothermal carbonization. Fuel 2017, 196, 473–480. 10.1016/j.fuel.2017.02.015. [DOI] [Google Scholar]
- Jin S.; Zhang G.; Zhang P.; Li F.; Fan S.; Li J. Thermo-chemical pretreatment and enzymatic hydrolysis for enhancing saccharification of catalpa sawdust. Bioresour. Technol. 2016, 205, 34–39. 10.1016/j.biortech.2016.01.019. [DOI] [PubMed] [Google Scholar]
- Lei H.; Cybulska I.; Julson J. Hydrothermal Pretreatment of Lignocellulosic Biomass and Kinetics. J. Sus. Bioenergy Sys. 2013, 03, 250–259. 10.4236/jsbs.2013.34034. [DOI] [Google Scholar]
- Hassan S. S.; Williams G. A.; Jaiswal A. K. Emerging technologies for the pretreatment of lignocellulosic biomass. Bioresour. Technol. 2018, 262, 310–318. 10.1016/j.biortech.2018.04.099. [DOI] [PubMed] [Google Scholar]
- Rackemann D. W.; Bartley J. P.; Doherty W. O. S. Solvolysis of Sugarcane Bagasse: Strategy To Increase the Yields of Secondary Fuel Precursors. Ind. Eng. Chem. Res. 2019, 58, 17736–17745. 10.1021/acs.iecr.9b03711. [DOI] [Google Scholar]
- Alper K.; Tekin K.; Karagöz S.; Ragauskas A. J. Sustainable energy and fuels from biomass: A review focusing on hydrothermal biomass processing. Sustain. Energy Fuels 2020, 4, 4390–4414. 10.1039/D0SE00784F. [DOI] [Google Scholar]
- He C.; Tang C.; Li C.; Yuan J.; Tran K.; Bach Q.; Qiu R.; Yang Y. Wet torrefaction of biomass for high quality solid fuel production: A review. Renew. Sustain. Energy Rev. 2018, 91, 259–271. 10.1016/j.rser.2018.03.097. [DOI] [Google Scholar]
- Zhang S.; Chen T.; Xiong Y.; Dong Q. Effects of wet torrefaction on the physicochemical properties and pyrolysis product properties of rice husk. Energy Convers. Manage. 2017, 141, 403–409. 10.1016/j.enconman.2016.10.002. [DOI] [Google Scholar]
- Park J. H.; Choi Y. C.; Lee Y. J.; Kim H. T. Characteristics of miscanthus fuel by wet torrefaction on fuel upgrading and gas emission behavior. Energies 2020, 13, 2669. 10.3390/en13102669. [DOI] [Google Scholar]
- Nakason K. Hydrothermal Carbonization of Oil Palm Pressed Fiber: Effect of Reaction Parameters on Product Characteristics. Int. Energy Journal 2017, 17, 47–56. [Google Scholar]
- Hashemi S. S.; Karimi K.; Mirmohamadsadeghi S. Hydrothermal pretreatment of safflower straw to enhance biogas production. Energy 2019, 172, 545–554. 10.1016/j.energy.2019.01.149. [DOI] [Google Scholar]
- Atienza-Martínez M.; Rubio I.; Fonts I.; Ceamanos J.; Gea G. Effect of torrefaction on the catalytic post-treatment of sewage sludge pyrolysis vapors using γ-Al2O3. Chem. Eng. J. 2017, 308, 264–274. 10.1016/j.cej.2016.09.042. [DOI] [Google Scholar]
- Wu S.; Zhang S.; Wang C.; Mu C.; Huang X. High-strength charcoal briquette preparation from hydrothermal pretreated biomass wastes. Fuel Process. Technol. 2018, 171, 293–300. 10.1016/j.fuproc.2017.11.025. [DOI] [Google Scholar]
- ASTM International , “ASTM E872–82, Standard Test Method for Volatile Matter in the Analysis of Particulate Wood Fuels,” West Conshohocken, PA, 2013. [Google Scholar]
- ASTM International , “ASTM E1755–01, Standard Test Method for Ash in Biomass,” West Conshohocken, PA, 2015. [Google Scholar]
- ASTM standards-D3176–89, “standard practice for ultimate analysis of coal and coke,” 2002.
- Chen W. H.; Peng J.; Bi X. T. A state-of-the-art review of biomass torrefaction, densification and applications. Renew. Sustain. Energy Rev. 2015, 44, 847–866. 10.1016/j.rser.2014.12.039. [DOI] [Google Scholar]
- Cotana F.; Buratti C.; Barbanera M.; Lascaro E. Bioresource Technology Optimization of the steam explosion and enzymatic hydrolysis for sugars production from oak woods. Bioresour. Technol. 2015, 198, 470–477. 10.1016/j.biortech.2015.09.047. [DOI] [PubMed] [Google Scholar]
- Derringer G.; Suich R. Simultaneous Optimization of Several Response Variables. J. Qual. Technol. 1980, 12, 214–219. 10.1080/00224065.1980.11980968. [DOI] [Google Scholar]
- Whitley D. A genetic algorithm tutorial. Statistics and Computing 1994, 4, 65–85. 10.1007/BF00175354. [DOI] [Google Scholar]
- Nhuchhen D. R.; Abdul Salam P. Estimation of higher heating value of biomass from proximate analysis: A new approach. Fuel 2012, 99, 55–63. 10.1016/j.fuel.2012.04.015. [DOI] [Google Scholar]
- Nhuchhen D. R.; Afzal M. T. HHV predicting correlations for torrefied biomass using proximate and ultimate analyses. Bioengineering 2017, 4, 7. 10.3390/bioengineering4010007. [DOI] [PMC free article] [PubMed] [Google Scholar]
- Sanwal Hussain N. A.; Soomro S. A.; Aziz S.; Ali A. Ultimate and Proximate Coal Analysis Ultimate and Proximate Coal Analysis. Eng. Sci. Technol. Int. Res. J. 2018, 2, 7. [Google Scholar]
- Keivani B.; Gultekin S.; Olgun H.; Atimtay A. T. Torrefaction of pine wood in a continuous system and optimization of torrefaction conditions. Int. J. Energy Res. 2018, 42, 4597–4609. 10.1002/er.4201. [DOI] [Google Scholar]
- Okolie J. A.; Nanda S.; Dalai A. K.; Kozinski J. A. Optimization and modeling of process parameters during hydrothermal gasification of biomass model compounds to generate hydrogen-rich gas products. Int. J. Hydrogen Energy 2020, 45, 18275–18288. 10.1016/j.ijhydene.2019.05.132. [DOI] [Google Scholar]
- Gan M. J.; Lim S. W.; Ng H. X.; Ong M. H.; Gan S.; Lee L. Y.; Thangalazhy-Gopakumar S. Enhancement of Palm Kernel Shell Fuel Properties via Wet Torrefaction: Response Surface, Optimization, and Combustion Studies. Energy Fuels 2019, 33, 11009–11020. 10.1021/acs.energyfuels.9b02229. [DOI] [Google Scholar]
- Barbanera M.; Muguerza I. F. Effect of the temperature on the spent coffee grounds torrefaction process in a continuous pilot-scale reactor. Fuel 2020, 262, 116493. 10.1016/j.fuel.2019.116493. [DOI] [Google Scholar]
- Kanwal S.; Chaudhry N.; Munir S.; Sana H. Effect of torrefaction conditions on the physicochemical characterization of agricultural waste (sugarcane bagasse). Waste Manage. 2019, 88, 280–290. 10.1016/j.wasman.2019.03.053. [DOI] [PubMed] [Google Scholar]
- Lee S. M.; Lee J. W. Optimization of biomass torrefaction conditions by the Gain and Loss method and regression model analysis. Bioresour. Technol. 2014, 172, 438–443. 10.1016/j.biortech.2014.09.016. [DOI] [PubMed] [Google Scholar]
- Siyal A. A.; Mao X.; Liu Y.; Ran C.; Fu J.; Kang Q.; Ao W.; Zhang R.; Dai J.; Liu G. Torrefaction subsequent to pelletization: Characterization and analysis of furfural residue and sawdust pellets. Waste Manage. 2020, 113, 210–224. 10.1016/j.wasman.2020.05.037. [DOI] [PubMed] [Google Scholar]
- Wang Z.; Lim C. J.; Grace J. R.; Li H.; Parise M. R. Effects of temperature and particle size on biomass torrefaction in a slot-rectangular spouted bed reactor. Bioresour. Technol. 2017, 244, 281–288. 10.1016/j.biortech.2017.07.097. [DOI] [PubMed] [Google Scholar]
- Ceylan S. Kinetic analysis on the non-isothermal degradation of plum stone waste by thermogravimetric analysis and integral Master-Plots method. Waste Manage. Res. 2015, 33, 345–352. 10.1177/0734242X15574590. [DOI] [PubMed] [Google Scholar]
- Gajera Z. R.; Verma K.; Tekade S. P.; Sawarkar A. N. Kinetics of co-gasification of rice husk biomass and high sulphur petroleum coke with oxygen as gasifying medium via TGA. Bioresour. Technol. Reports 2020, 11, 100479. 10.1016/j.biteb.2020.100479. [DOI] [Google Scholar]
- Bach Q. V.; Tran K. Q.; Skreiberg Ø. Hydrothermal pretreatment of fresh forest residues: Effects of feedstock pre-drying. Biomass Bioenergy 2016, 85, 76–83. 10.1016/j.biombioe.2015.11.019. [DOI] [Google Scholar]
- Chen W. H.; Ye S. C.; Sheen H. K. Hydrothermal carbonization of sugarcane bagasse via wet torrefaction in association with microwave heating. Bioresour. Technol. 2012, 118, 195–203. 10.1016/j.biortech.2012.04.101. [DOI] [PubMed] [Google Scholar]
- Bach Q.; Skreiberg Ø. Upgrading biomass fuels via wet torrefaction: A review and comparison with dry torrefaction. Renew. Sustain. Energy Rev. 2016, 54, 665–677. 10.1016/j.rser.2015.10.014. [DOI] [Google Scholar]
- Li L.; Huang Y.; Zhang S.; Zheng A.; Zhao Z.; Xia M.; Li H. Uncovering Structure-Reactivity Relationships in Pyrolysis and Gasification of Biomass with Varying Severity of Torrefaction. ACS Sustainable Chem. Eng. 2018, 6, 6008–6017. 10.1021/acssuschemeng.7b04649. [DOI] [Google Scholar]
- Nizamuddin S.; Qureshi S. S.; Baloch H. A.; Siddiqui M. T. H.; Takkalkar P.; Mubarak N. M.; Dumbre D. K.; Griffin G. J.; Madapusi S.; Tanksale A. Microwave hydrothermal carbonization of rice straw: Optimization of process parameters and upgrading of chemical, fuel, structural and thermal properties. Materials 2019, 12, 403. 10.3390/ma12030403. [DOI] [PMC free article] [PubMed] [Google Scholar]
- Ahmed T.; Sajidah A.; Jamari S. S.; Hasbi M.; Rahim A.; Park J.; Kim H. Hydrothermal carbonization of lignocellulosic biomass for carbon rich material preparation: A review. Biomass Bioenergy 2019, 130, 105384. 10.1016/j.biombioe.2019.105384. [DOI] [Google Scholar]
- Mundike J.; Collard F. X.; Görgens J. F. Torrefaction of invasive alien plants: Influence of heating rate and other conversion parameters on mass yield and higher heating value. Bioresour. Technol. 2016, 209, 90–99. 10.1016/j.biortech.2016.02.082. [DOI] [PubMed] [Google Scholar]


