

Abstract
Plants have evolved to grow under prominently fluctuating environmental conditions. In experiments under controlled conditions, temperature is often set to artificial, binary regimes with constant values at day and at night. This study investigated how such a diel (24 hr) temperature regime affects leaf growth, carbohydrate metabolism and gene expression, compared to a temperature regime with a field‐like gradual increase and decline throughout 24 hr. Soybean (Glycine max) was grown under two contrasting diel temperature treatments. Leaf growth was measured in high temporal resolution. Periodical measurements were performed of carbohydrate concentrations, carbon isotopes as well as the transcriptome by RNA sequencing. Leaf growth activity peaked at different times under the two treatments, which cannot be explained intuitively. Under field‐like temperature conditions, leaf growth followed temperature and peaked in the afternoon, whereas in the binary temperature regime, growth increased at night and decreased during daytime. Differential gene expression data suggest that a synchronization of cell division activity seems to be evoked in the binary temperature regime. Overall, the results show that the coordination of a wide range of metabolic processes is markedly affected by the diel variation of temperature, which emphasizes the importance of realistic environmental settings in controlled condition experiments.
Keywords: circadian, controlled conditions, fluctuating temperature, natural environment, storage carbohydrates
Short abstract
Dynamically changing temperature affects soybean leaf growth and regulatory mechanisms in non‐intuitive ways. The results may help improving knowledge transfer between experiments performed under controlled conditions and experiments performed in the field.
1. INTRODUCTION
Leaf growth is tightly coupled to the environment by internal oscillators such as the circadian clock (Farré, 2012; McClung, 2001; Nozue et al., 2007; Ruts, Matsubara, Wiese‐Klinkenberg, & Walter, 2012). By controlling gene expression and metabolic processes, the circadian clock enables plants to synchronize their metabolism with external stimuli, thus optimizing photosynthesis, growth, survival and competitive advantage (Caldeira, Jeanguenin, Chaumont, & Tardieu, 2014; Dodd et al., 2005; Green, Tingay, Wang, & Tobin, 2002). Environmental factors such as light, temperature, water or nutrient availability affect leaf growth (Pantin, Simonneau, & Muller, 2012; Pantin, Simonneau, Rolland, Dauzat, & Muller, 2011). Rapid changes of these factors can potentially alter the short‐term, diel (24 hr) pattern of leaf growth. It was reported frequently that leaves of dicot plants show pronounced diel growth fluctuations that are repetitive but that differ between species and that are largely independent of the diel temperature regime (Bunce, 1977; Nozue et al., 2007; Poiré et al., 2010; Walter, Silk, & Schurr, 2009). In contrast, leaf growth of graminoid, monocot plants has often been reported as tightly linked to diel variations of the temperature regime, which appears to be fairly similar across species (Gallagher, 1979; Nagelmüller, Kirchgessner, Yates, Hiltpold, & Walter, 2016; Sadok et al., 2007; Yates et al., 2019).
Over decades, plant physiological studies have been performed under controlled conditions in climate chambers. There, environmental factors are typically set to a regime that deviates markedly from that under natural conditions in the field: Light intensity, humidity and temperature are often controlled in a rather binary, step‐wise way and not in gradually fluctuating regimes similar to what would be found in the field. With respect to temperature, climate chamber studies often apply day–night temperature differences of less than 6°C in a binary (constant day/constant night temperatures) regime (Poorter et al., 2016). It is unclear whether this feature affects growth, metabolism and gene expression—and if yes, to which extent.
Based on the recent development of a method to analyse dicot leaf growth in the field and in the growth chamber (Mielewczik, Friedli, Kirchgessner, & Walter, 2013), it became obvious that diel patterns of dicot leaf growth might differ markedly when analysed either in the field or in controlled conditions. Differences in the organization of the leaf growth zone between graminoid monocots and dicots might favour the special significance of this effect in leaves of dicot plants (Nelissen, Gonzalez, & Inzé, 2016). In graminoid monocots, the zones of cell division and of cell expansion are clearly separated. The dividing cells of young, graminoid monocots are situated close to the ground and are surrounded by the sheath of older leaves, which protect them from some environmental fluctuations (Allard & Nelson, 1991; Brégard & Allard, 1999). In contrast, dicot leaves show cell division and cell expansion in tissue that is exposed to the sunlight (Avery, 1933; Poethig & Sussex, 1985) and thereby to a very different microclimate compared to the protected growth zone of graminoid monocot leaves. The buffering effect of the ground also benefits rosette or rosette‐like dicot species such as Arabidopsis thaliana or seedlings of Nicotiana tabacum. The difference between monocot and dicot plants becomes more pronounced in species with a less prostrate growth habit, with leaves situated several cm above ground. Therefore, species such as soybean (Glycine max) would be more appropriate model organisms to analyse the influence of differing temperature regimes on dicot leaf growth and metabolism.
The aim of this study was to test the hypothesis that the environmental perception mechanisms of the plant, such as the circadian clock, are sensitive not only to the values of temperature perceived but also to the temporal change in temperature (temporal pattern) to which a growing leaf is exposed. We further hypothesized that this perception affects the underlying metabolism and gene expression, which control the temporal progression of growth processes in G. max. Carbon stable isotopic composition (here given as δ 13C value) of plants can be used to reconstruct plant physiological responses to changing environmental conditions [e.g. temperature and/or vapour pressure deficit (VPD)]. The temporal pattern of these responses over a diel course controlled by the circadian clock is per se not modifying the δ 13C value. We expect that the different temperature regimes will imprint on the carbon isotopic composition of plants.
2. MATERIALS AND METHODS
Leaf growth in soybean [G. max (L.) Merrill, variety Gallec] was measured in preliminary experiments in the field in 2014 and under controlled conditions in 2015. Based on these results, the main experiment presented in this study was performed in 2017 under controlled conditions in climate chambers.
2.1. Leaf growth measurements
Leaf growth was measured using a marker tracking approach through digital image sequences, as described in detail in Friedli and Walter (2015) and Mielewczik et al. (2013). In short, the terminal leaflet of the youngest, most recently unfolded trifoliate leaf of each measured plant was fixed in a metal frame by glueing five strings to the margin of the leaflet and tautening it over a second metal ring with 10 g lead weights. White plastic beads (8 mm in diameter) were threaded onto the strings close to the margin of the leaflet to serve as artificial landmarks for the later tracking. A camera was installed on top of each leaflet, and images were taken every 90 s (120 s in 2017) for around 1 week, when the measurements of fresh plants started. Relative growth rate (RGR) was captured by tracking the displacement of the plastic beads in the resulting image sequence. For the field measurements, weatherproof closed‐circuit television (CCTV) cameras (Lupusnet HD – LE934, CMOS sensor, maximal resolution of 1920 × 1,080 pixels, Lupus‐Electronics GmbH, Germany) were used. In the controlled condition experiments, monochrome CMOS camera (DMK 23GP031, maximal resolution of 2,592 × 1944 pixels, The Imaging Source Europe GmbH, Bremen, Germany) was used.
2.2. Preliminary field experiment 2014
Measurements of field‐grown soybean were conducted at the research station for plant sciences of ETH Zurich in Eschikon, Lindau (Switzerland, 47.449°N, 8.682°E, 520 m a.s.l.; soil type: eutric cambisol) in 2014. Soybean (variety Gallec) was grown in 6.5 m by 1.5 m plots (7 rows per plot, 18 cm row width, 60 seeds/m2) as part of a larger field trial managed according to best agricultural practice with no additional treatment factors. Leaf growth measurements were performed over a period of 4 weeks between 20 June and 21 July 2014. During each week, the youngest, most recently unfolded trifoliate leaves of six independent plants were measured simultaneously. Data from 12 independent leaves grown under comparable weather conditions were combined in one weekly time course (Figure 1a). Relative growth rate (RGR) was captured every 90 s, and data were aggregated to 3‐hr‐mean values.
FIGURE 1.

Diurnal growth pattern of soybean leaves. (a) Green triangles and error bars show the mean relative growth rate (RGR; %hr−1) and SE of soybean leaves grown in the field (n = 12). (b) Blue squares and error bars show the mean RGR ± SE of soybean leaves grown under controlled conditions in climate chambers exposed to a binary temperature regime with constant day and night temperatures (n = 6). RGR was captured every 90 s and aggregated to 3 hr average per leaf. The solid red lines show the air temperature in the field (a) and under controlled conditions (b), shaded areas indicate the dark period. Data for (b) were adapted from fig. S4 of Friedli and Walter (2015), with kind permission of Wiley [Colour figure can be viewed at wileyonlinelibrary.com]
2.3. Preliminary climate chamber experiment 2015: Simulated field conditions and switch to binary temperature regime
Soybean seeds were inoculated with ‘HiStick Soybean Inoculant’ (Becker Underwood Limited, UK) and grown in QuickPot trays (88 cm3 per seedling, Herkuplast Kubern GmbH, Germany) filled with a sterilized substrate (Substrat1, Klasmann‐Deilmann GmbH, Germany) that was autoclaved at 121°C for 30 min prior to sowing. After 18 days, seedlings were transferred to clay pots (12 cm in diameter) filled with a mixture by weight of 2/3 ‘sterile Landerde’ (RICOTER Erdaufbereitung AG, Switzerland) and 1/3 fire‐dried quartz sand (0.7–1.2 mm, Carlo Bernasconi AG, Switzerland). After transplantation, plants were grown in climate chambers (Conviron, Winnipeg, Canada) with climate parameters (temperature, relative humidity, temporal cycle of light intensity) set to match the average conditions of six successive days (21–26 June 2014) recorded during the growth measurements in the field in 2014. In this setting, the temperature gradually changed from 26°C during the light period to 12–15°C during the dark period. Light intensity was 580 ± 75 μmol photosynthetically active radiation (PAR) m−2 s−1. Two types of fluorescent lamps with a 2:1 mixture were installed in the climate chamber (Master TL5 HO 54 W/840, Koninklijke Philips Electronics N.V., Eindhoven, The Netherlands and FHO54W/T5/GRO, Havells Sylvania Europe Ltd, London, UK). Relative humidity (RH) was 60% during the light period and 80% during the dark period, and a light/dark photoperiod of 15.3:8.7 hr was applied. Plants were watered three times per week to ensure unlimited water supply. New plants were grown for each measurement week.
Leaf growth of terminal leaflets of the second to the fourth trifoliate leaf (TL2–TL4) was measured simultaneously on six independent plants for around 1 week per TL. The climate chamber was set to mimic field conditions as described above for the first 2.5 days of the leaf growth measurements. Then, the temperature treatment was switched to a binary regime as used in Friedli and Walter (2015) and kept until the end of the measurement week. Temperature was constant at 24°C during the light period and at 20°C during the dark period, respectively. RH was set to 60% during the light and the dark period, and a light/dark photoperiod of 13:11 hr was applied.
2.4. Climate chamber experiment 2017: Comparison of binary temperature regime and simulated field conditions
In the 2015 climate chamber experiment, the plants experienced different daily mean temperatures and photoperiods depending on the respective treatment. This difference between treatments was realized because the first treatment should represent field conditions, and the second treatment should match the conditions under which soybean leaf growth was measured extensively in previous studies (Friedli & Walter, 2015). In order to directly compare a gradually fluctuating (Gr) temperature regime simulating field conditions to a binary (Bi) temperature regime with constant day and night temperatures, the main experiment of this study was performed in 2017.
In this experiment, photoperiod and mean temperature were the same across both treatments. The photoperiod regime was set to 16 hr light/8 hr dark period. For a 1 hr transition period from light to dark and vice versa, light intensity was gradually decreased or increased, respectively, to simulate dusk and dawn. While maintaining the same mean temperature, the treatments differed in the diel temperature regime. In the Bi treatment, temperature was set constantly to 21°C during the light and to 17°C during the dark period, respectively (Figure 2a). In the Gr treatment, temperature was set to reach a minimum of 13°C at the end of the night and to gradually reach the maximum of 27°C in the early afternoon (Figure 2b).
FIGURE 2.
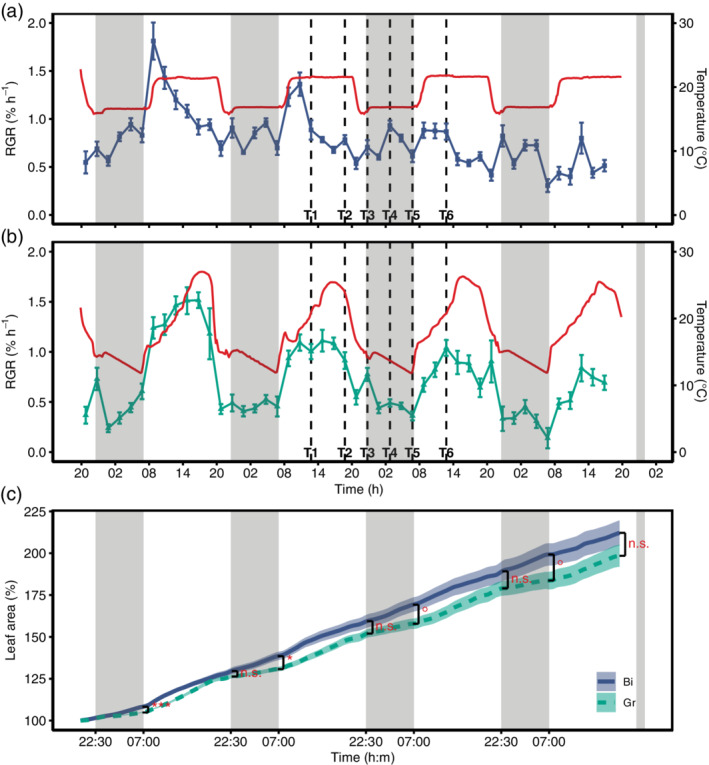
Diurnal growth pattern of soybean leaves under controlled conditions in growth cabinets exposed to contrasting temperature regimes. (a) The relative growth rate (RGR; %hr−1) under binary diurnal temperature conditions (Bi, blue squares) and (b) the RGR under gradual temperature conditions (Gr, green triangles) in relation to temperature (solid red lines). RGR data were aggregated to 2 hr (Mean ± SE, n = 9 replicates per treatment). The vertical black dashed lines indicate the sampling time points (T1–T6) for RNA sequencing and carbohydrate analysis. (c) The mean ± SE of measured leaf area in % of initial leaf area for the respective treatments (Bi, blue solid line; Gr, green dashed line). Black brackets and the corresponding significance indicators (***p < .001; *p < .05; °p < .1; n.s., not significant) indicate differences in leaf area after the respective light and dark periods (visualized by the shaded grey areas) between the treatments [Colour figure can be viewed at wileyonlinelibrary.com]
Plants were cultivated as described above for the 2015 experiment and grown in the same climate chambers, which were set to the Bi conditions. After 14 days, seedlings were transferred to clay pots and then grown in two separate climate chambers under the respective treatment (Bi or Gr) for 7–9 days until the measurement and sampling period at second trifoliate leaf stage.
2.5. Leaf sampling and phenotypic data analysis
In the 2017 experiment, growth analysis was supplemented with carbohydrate and gene expression analysis. Thus, samplings of the second trifoliate leaves of independent plants grown under the respective treatments next to the plants used for growth measurements were taken at six time points within 24 hr between day 2 and 3 for subsequent carbohydrate (n = 5) and gene expression analysis (n = 3). Sampling time points were T1 = mid‐morning, T2 = mid‐afternoon, T3 = after sunset, T4 = middle of the night, T5 = before sunrise and T6 = mid‐morning (Figure 2 and Table S1). Leaf size and RGR were recorded every 2 min and subsequently aggregated to 2 hr intervals. The experiment was repeated twice from 28 February 2017, until 4 March 2017 (RGR measurement of n = 4 plants) and from 16 March 2017 until 20 March 2017 (RGR measurement of n = 5 plants). Growth data of both iterations were combined resulting in n = 9 replicates per treatment. Carbohydrate and gene expression analysis was performed with only the samples from the first iteration.
Relative growth rate (RGR, mean of n = 9 replicates per treatment; %hr−1) for every time point (t) was modelled using a linear model with temperature (T; °C), vapour pressure deficit (VPD; kPa), light (L; kW m−2) and leaf area (A; px) as independent variables with the respective parameter estimates β 1 : 4 following (Nagelmüller, Yates, & Walter, 2018):
| (1) |
Leaf area was included as an age factor to account for the decline in RGR over time. All statistical analyses were performed in the R environment (R Core Team, 2018).
2.6. δ13C values of respired CO2
In order to measure stable carbon isotope composition of dark respired CO2 (δ 13CR), five plants per treatment were removed from the climate chambers at the respective sampling timepoints (T1–T6) and kept for 30 min in the dark to avoid the light‐enhanced dark respiration (LEDR) period (Atkin, Evans, Ball, Lambers, & Pons, 2000; Barbour, Mcdowell, Tcherkez, Bickford, & Hanson, 2007; Tcherkez et al., 2003; Werner, Buchmann, Siegwolf, Kornexl, & Gessler, 2011). The second trifoliate leaf was cut, and the two lateral leaflets were flash‐frozen using liquid nitrogen. The central leaflet was placed immediately into a gas‐tight Tedlar bag (Keyka Ventures) according to Barbour et al. (2011) and Barthel, Cieraad, Zakharova, and Hunt (2014). The bag was flushed multiple times with synthetic CO2‐free air (20% O2 and 80% N2, Pangas, Switzerland) until a CO2‐free atmosphere was measured by an infrared gas analyser (LI‐820, LI‐COR). Afterwards, the bag containing the leaf was put in the dark for about 1 hour, and then bag headspace air was sampled with a gas‐tight syringe (BD Plastipak, Switzerland), transferring 20 mL gas into a 12 mL pre‐evacuated gas‐tight glass vial (‘Exetainer’, Labco, England). The δ 13CR was measured with a modified Gasbench II coupled to a DeltaplusXP isotope ratio mass spectrometer (IRMS, ThermoFisher, Germany) as described by Zeeman et al. (2008). The δ 13C value of ambient CO2 (δ13Cair) was measured in both treatments and averaged to δ 13Cair = −9.29 ± 0.72‰.
2.7. Quantification of starch and water‐soluble sugars
Starch, sucrose, fructose and glucose contents were quantified as described in earlier studies (Ruckle et al., 2017; Ruckle, Bernasconi, Kölliker, Zeeman, & Studer, 2018). The flash‐frozen samples (see above) were lyophilized, and biomass was recorded as lyophilized leaf weight. The lyophilized leaves were homogenized into powder using a Mixer Mill MM 400 (Retsch, Haan, Germany). Water‐soluble carbohydrates were then extracted from 10 mg of the powder with ethanol washes. Starch was digested with α‐amylase and amyloglucosidase (Sigma‐Aldrich, St. Louis, MO). Glucose, fructose and sucrose were quantified based on enzymatic conversion of NADP to NADPH. NADPH was quantified by light absorption at 340 nm using an Enspire plate reader (Perkin Elmer, Waltham, MA).
2.8. δ13C values of bulk organic matter, sugar and starch
From the lyophilized leaf powder used for the quantification of starch and soluble sugars (above), 2 mg was weighed in Sn capsules (5 × 9 mm, Saentis, CH) for δ 13C analysis of bulk leaf organic material (δ 13Cbulk). Measurement of δ 13C values was done using a Flash EA 1112 Series elemental analyser (ThermoFisher, Germany) coupled to a DeltaplusXP IRMS via a ConFlo III as described by Brooks, Geilmann, Werner, and Brand (2003) and Werner, Bruch, and Brand (1999).
Carbohydrates for isotopic analysis were extracted according to Lehmann et al. (2019). In brief, 100 mg lyophilized leaf powder were weighed in 2 mL reaction tubes together with 1.5 mL 85°C deionized water in order to prevent enzymatic activities. These samples were incubated for 30 min at 85°C in a water bath. Afterwards, samples were centrifuged for 2 min at 10,000g, the supernatant was separated for sugar extraction and the remainder (pellet) was kept for starch extraction, respectively. A total of 1 mL of the supernatant was added to a column filled with a cation exchanger (Dowex 50WX8, hydrogen form, 100–200 mesh, Sigma‐Aldrich, CH), that was placed above a second column filled with an anion exchanger (Dowex 1X8, chloride form, 100–200 mesh, Sigma‐Aldrich, CH). The sugar fraction was eluted with 30 mL deionized water. The sugars were then lyophilized, re‐dissolved in deionized water and stored at −20°C for stable isotope analysis. Starch was enzymatically separated from the pellet according to standard protocols (Richter et al., 2009; Wanek, Heintel, & Richter, 2001). The pellet was washed multiple times using an MCW solution (methanol/chloroform/deionized water, 12/5/3, v/v/v) as well as deionized water to remove any organic carbon and dried overnight. On the second day, the pellet was re‐solubilized in water, the starch gelatinized at 100°C for 15 min and then broken down to sugars at 85°C for 2 hr using the heat‐resistant α‐amylase (EC 3.2.1.1, Sigma‐Aldrich, CH). The enzyme was then separated from sugars using centrifugation filters (Vivaspin 500, Sartorius, Germany). For δ 13C measurements, aliquots from the starch‐derived sugar (δ 13Cstarch) and sugar (δ 13Csugars) were pipetted into Sn capsules, dried in an oven at 60°C and analysed with the EA‐IRMS coupling as mentioned above.
2.9. Carbon isotope discrimination and apparent isotope fractionation
In order to calculate carbon isotope discrimination (△), δ 13C of sugars (δ 13Csugars) as the first product of photosynthesis and δ 13C of the ambient climate chamber air (δ 13Cair) as the source of CO2 were used following the equation by Farquhar, Ehleringer, and Hubick (1989):
| (2) |
In addition, the apparent isotope fractionation e was calculated based on δ 13Csugars and the δ 13C of dark respired CO2 (δ 13CR) following Salmon, Buchmann, and Barnard (2016):
| (3) |
2.10. RNA extraction and analysis
Total RNA from all samples was extracted using TRIzol (Invitrogen, Carlsbad, CA) as described by the manufacturer. Then, quality was checked using the Agilent 4200 TapeStation system (Agilent Technologies, Santa Clara, CA). The samples were sequenced using the Illumina HiSeq 4000 system at the Functional Genomics Center Zurich (Zurich, Switzerland). The sequence reads were mapped to the NCBI G. max genome v2.0.39 (Schmutz et al., 2010) using TopHat (v.2.0.13; Kim et al., 2013) with Bowtie2 (v2.2.3; Langmead & Salzberg, 2012). Gene expression was calculated using cufflink (v.2.1.1) with the cuffdiff program (Trapnell et al., 2012) using the Glycine_max_v2.0.39.gff3 annotation data (Schmutz et al., 2010).
To investigate the differences between the treatments, comparisons between Bi and Gr treatments were made per time point to avoid nonspecific circadian‐regulated genes. Genes were defined as differentially expressed (DE) when their expression changed twofold and was significant (adjusted p‐value < .05). DE genes of both treatments across all time points were subjected to a principal component analysis (PCA) in order to obtain an overview of the relationships between samplings and treatments. In order to favour expression dynamics rather than abundance‐driven clustering, the PCA was performed using the sample‐time‐point correlation matrix.
Expression profiles of all DE genes across all time points were z‐score normalized and clustered in a 4x4 self‐organizing map (SOM) using the R kohonen package (v3.0.10; Wehrens & Kruisselbrink, 2018). Functional groups were identified by performing a gene ontology enrichment analysis with Fisher's exact test on each cluster using R TopGO (v.2.34.0; Alexa & Rahnenfuhrer, 2018).
3. RESULTS
3.1. Diel leaf growth in field‐grown soybean follows temperature
In the 2014 field experiment, the relative growth rate (RGR) of leaves of field‐grown soybean was analysed and compared to measurements performed under controlled conditions with a binary temperature regime. The diel growth pattern observed in the field differed considerably from the growth pattern observed under binary controlled conditions. In the field, RGR mirrored the increasing temperature with an increase during the day and with overall lower growth rates at night compared to growth rates at day (Figure 1a). In contrast, the observed RGR in the binary temperature regime displayed the reported pattern for soybean growth, where nocturnal RGR is high, reaching a maximum towards the end of the night/beginning of the day, whereas a minimal growth rate is observed in the mid‐afternoon (Figure 1b; Friedli & Walter, 2015). In order to test whether the observed pattern from the field could be reproduced under controlled conditions, an experiment was performed in 2015 for which the diel temperature mimicked the temperatures experienced in the field (Figure S1a–c). Under the simulated field conditions, leaf RGR reached a maximum in the afternoon, as was observed in the field (see Day 1–2 in Figure S1a,b). This growth pattern immediately switched back to maximum RGR at the end‐of‐night, as soon as the temperature was changed to a classic non‐dynamic, binary regime (see Day 3 in Figure S1a,b).
3.2. A binary temperature regime induces a peak of leaf growth in the early morning
Based on these results, another controlled experiment was set up in 2017 with the same mean temperature and photoperiod in the Bi and Gr treatment to allow for direct comparison. Leaf growth measurements showed pronounced differences in diel RGR patterns between the treatments (Figure 2a,b). Plants in the Bi treatment had a maximum RGR at the beginning of the day. Then, RGR gradually declined towards the dark period, but a second maximum was observed in the middle of the night. In contrast, the growth pattern in the Gr treatment resembled the one observed in the field. RGR peaked in the afternoon and then gradually declined towards the end of the day, with no increase in RGR at night. These contrasting patterns became increasingly apparent when the diel trend (i.e. seasonal, Figure S2b) was extracted through time series decomposition (Figure S2a–d).
In the Bi treatment with constant day and night temperatures, there was no apparent relationship between RGR and temperature (Figure 2a). In contrast, the Gr treatment with a field‐like temperature cycle showed a diel growth pattern highly correlated with temperature (Figure 2b). Beyond this observation, RGR was modelled within each treatment using a simple growth model based on temperature, VPD, light and the leaf size/age (Equation (1); Nagelmüller et al., 2018). For the Gr treatment, the model was able to explain 64% of the variation in RGR (Figure S3a), with significant effects of temperature, light and leaf size (Table 1). In comparison, the model performed poorly for the Bi treatment (R 2 = 0.27, Figure S3b), where only leaf size showed a significant effect (Table 1). Since absolute leaf size is finite, RGR decreased as leaves aged in both treatments. However, the decline was greater and more linear in the Bi treatment in the first half of the experiment compared to the Gr treatment (Figure S2c).
TABLE 1.
ANOVA of the growth model applied to each treatment (Bi, Gr) individually to predict relative growth rate based on temperature (T), vapour pressure deficit (VPD), light (L) and square root of the leaf area (A, see Equation (1)).
| Predictor | Df | Sum Sq | Mean Sq | F value | Pr(>F) | |
|---|---|---|---|---|---|---|
| Gr: Gradually fluctuating temperature regime | ||||||
| T | 1 | 2.756001 | 2.756001 | 60.44055 | 1.16E‐09 | *** |
| VPD | 1 | 0.071798 | 0.071798 | 1.574574 | 0.216482 | n.s. |
| L | 1 | 0.340348 | 0.340348 | 7.464004 | 0.009167 | ** |
| √A | 1 | 0.677035 | 0.677035 | 14.84773 | 0.000393 | *** |
| Residuals | 42 | 1.915139 | 0.045599 | |||
| Bi: Binary temperature regime | ||||||
| T | 1 | 0.092802 | 0.092802 | 1.559247 | 0.218691 | n.s. |
| VPD | 1 | 0.110277 | 0.110277 | 1.852845 | 0.180712 | n.s. |
| L | 1 | 0.000643 | 0.000643 | 0.010809 | 0.91769 | n.s. |
| √A | 1 | 1.061198 | 1.061198 | 17.83003 | 0.000127 | *** |
| Residuals | 42 | 2.499732 | 0.059517 | |||
Abbreviations: n.s.; not significant**p < .01; ***p < .001.
The differences in diel growth pattern are reflected in the increase in leaf size over time between the treatments (Figure 2c). Leaves in the Bi treatment had significantly higher night growth rates (Figure 3c), which was in accordance with the higher night temperature in this treatment (Figure S4e). This resulted in significantly larger leaves in the morning in this treatment. However, this lag was compensated until evening in the Gr treatment (Figures 2c and 3d) due to significantly higher growth rates in the afternoon (Figure 3c), even though the average temperature during the day was the same in both treatments (Figure S4e). Nevertheless, leaves in the Bi treatment showed a slightly higher total growth (Figure 2c; 212 ± 7.5% compared to 198 ± 6.6% SE, p = .195), which is attributed to minor differences in growth conditions. Temperature, relative humidity (RH), VPD and light were monitored throughout the experiment (Figure S4a–d). The temperature sum was similar for the Bi and Gr treatments, but due to technical limitations of growth chamber control, plants in the Bi treatment experienced a slightly higher temperature sum of 76.5°Cd compared to 72.0°Cd in the Gr treatment, due to a difference of 1.13°C in daily mean temperature (Figure S4e).
FIGURE 3.
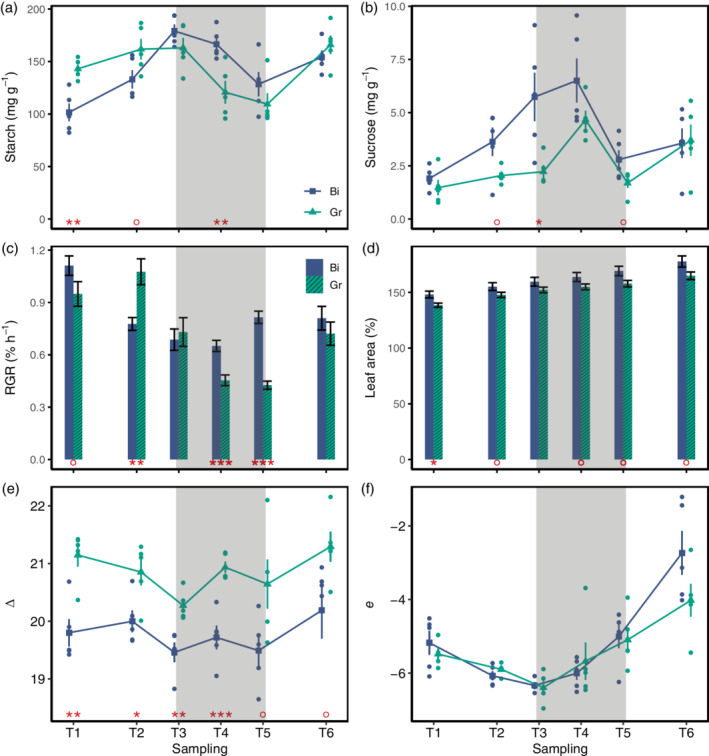
Leaf concentration of starch (a) and sucrose (b) as well as carbon isotope discrimination (e) and apparent isotope fractionation (f) at the six sampling time points (T1–T6). Blue squares and green triangles show the mean of n = 5 samples for the respective treatment and time point (Bi, binary temperature regime, blue squares; Gr, gradual temperature regime, green triangles). Blue and green dots show individual measurement points of the respective treatment and error bars indicate the SE. (c) The average growth rate (RGR, % hr−1) between the sampling timepoints and (d) the leaf are percentage of the initial leaf area at the respective sampling timepoint [mean ± SE of n = 9 leaves per treatment, for (c,d), respectively]. Red asterisks and dots indicate the significance of the differences between the treatments (***p < .001; **p < .01; *p < .05; °p < .1) and shaded areas indicate the dark period [Colour figure can be viewed at wileyonlinelibrary.com]
3.3. Diel fluctuations of starch and soluble sugars feed carbohydrates into the expanding tissue
In order to investigate if the observed differences in growth were aligned with corresponding fluctuations in the leaf carbohydrate content, the leaf concentrations of starch, glucose, fructose and sucrose (mg gdrymatter −1; Figures 3a,b and S5a–c) were measured at six sampling time points. In addition, to determine the effects of temperature on carbon dynamics in the leaves, stable carbon isotope analysis of plant bulk, carbohydrates and respired CO2 (Figure S5d–g) was conducted.
In the Bi treatment, the starch pool increased rapidly throughout the day (T1–T3), decreased during the night (T3–T5) and increased again until the final sampling time point (T6; Figure 3a). In the Gr treatment, the afternoon increase (T2–T3) of starch was less pronounced compared to the Bi treatment. The decrease during the night was comparable for Gr and Bi treatments, and in the morning (T6), the value of ca. 150 mg g−1 was reached again, in both treatments (Figure 3a). Overall, leaves in the Bi treatment showed a higher amplitude of fluctuating concentrations. For both treatments, the starch pool was not depleted completely at the end of the night. For sucrose, a more rapid increase and overall accumulation was observed during the afternoon in the Bi treatment compared to the Gr treatment (Figure 3b). The sucrose pool was not completely depleted at the end of the night either, and values observed at T6 were somewhat higher than those at T1. For glucose and fructose concentrations, no significant differences between the treatments were observed. Both carbohydrates fluctuated in a similar pattern throughout the diel cycle (Figure S5a,b). The total soluble sugars content was higher in the Bi treatment during the night than in the Gr treatment (Figure S5c).
The isotope analysis showed a consistent 13C enrichment in the leaves of plants grown in Bi regime compared to Gr (Figure S5d–g). In order to have a better insight into plant carbon metabolism, carbon isotope discrimination (△) as well as post‐photosynthetic carbon isotope fractionation (e) were calculated. Results showed higher discrimination in plants grown under Gr condition compared to Bi (Figure 3e). However, there was no difference in e between the leaves of plants in the two treatments (Figure 3f).
3.4. Differences in diel temperature pattern cause differences in gene expression
Given the differences in RGR and metabolite accumulation patterns between the two treatments, RNA sequencing (RNAseq) was performed to determine whether growth was actively repressed or growth phases differently partitioned due to metabolic processes. Or alternatively, whether diurnal growth changed due to altered endogenous rhythmicity in response to the temperature treatments. RNAseq and subsequent gene expression analysis identified 5,042 unique differentially expressed genes in a pairwise comparison of the treatments at each time point.
The number of DE genes varied across time points, with T3 having the least (n = 97, Table 2) and T6 having the most (n = 2,469) DE genes. The overlap of DE genes among the time points is illustrated in Figure 4a. To get a holistic overview of the sampling time points and treatments, the 5,042 unique DE genes were subjected to principle component analysis (PCA). Considering the first two components, together explaining 56% of the variation, the two treatments broadly cluster together (Figure 4b). The first principle component, explaining 36% of the variation, mostly discriminated between day (T1, T2 and T6, negative on the x‐axis) and night (T3 and T4, positive on the x‐axis), whereas the second principle component mostly discriminated T5 (before dawn). Thus, whilst there are perturbations of gene expression, the overall transcriptome profiles are diurnal and conserved between treatments.
TABLE 2.
Number of differentially expressed (DE) genes per sampling time point (T1–T6)
| TP | DE genes count |
|---|---|
| T1 | 638 |
| T2 | 2,511 |
| T3 | 97 |
| T4 | 550 |
| T5 | 640 |
| T6 | 2,469 |
| Total | 6,905 |
| Unique total | 5,042 |
FIGURE 4.

4Distribution of differentially expressed (DE) genes between samples and time points. (a) Venn diagram showing the number of unique DE genes per time point and the number of common DE genes between time points. (b) Principal component analysis using the correlation matrix of DE genes per sample (n = 3), time point (T1–T6, see colour legend) and treatment (squares = binary, triangles = gradual diurnal temperature regime) [Colour figure can be viewed at wileyonlinelibrary.com]
To identify changes in biological processes between the two treatments, a 4 × 4 self‐organizing map (SOM) was used to cluster the expression profiles (Figure S6). Using gene ontology (GO) term enrichment analysis, we found clusters enriched for growth (clusters 1, 3 and 10) cell division (clusters 4 and 8), carbon metabolism (cluster 2), photosynthesis (clusters 5, 6 and 11) and circadian rhythm (clusters 12 and 16). Some clusters show inconsistent expression patterns between T1 and T6 (i.e. clusters 7, 14 and 15) in the Bi treatment. A possible explanation for this effect could be leaf ageing from 1 day to the next, which is also represented by the markedly declining growth rate (Figure S2c).
3.5. A binary temperature regime evoked a synchronization of cell division
The SOM analysis yielded two distinct clusters enriched with genes associated with different processes in the cell cycle (Figure S6; clusters 4 and 8). Together, 253 genes contained at least one GO term related to cell division processes, presenting a broad spectrum of molecular functions (Table S2). These include known regulatory groups positively associated with cell division/cell proliferation like KINESINs (Messin & Millar, 2014; Müller, Han, & Smith, 2006; Wordeman, 2010), CYCLINs, CYCLIN‐DEPENDANT KINASEs (Gutierrez, 2009; Vercruysse, Baekelandt, Gonzalez, & Inzé, 2020), SYNTAXIN OF PLANTS 111 (Völker, Stierhof, & Jürgens, 2001) or GROWTH‐REGULATING FACTORS (Vercruysse et al., 2020; Table S2) All of these genes were over‐expressed in the Bi treatment at T2 (Figure 5a), coinciding with a strong decline in RGR after the growth peak in the early morning. In contrast, the expression of these genes was random in the GR treatment.
FIGURE 5.

Expression profiles of genes that were differentially expressed in the binary (Bi, blue solid lines) and the gradual (Gr, green dashed lines) temperature treatment and which were enriched in specific gene ontology terms from gene groups clustered by a self‐organizing map. The expression of all time points (T1–T6) was scaled between 0 and 1 for every gene. (a) Genes associated with cell division up‐regulated at T2 in the Bi treatment. (b) Circadian clock–associated genes up‐regulated in the Bi temperature treatment in the dark period. (c) Circadian clock–associated genes up‐regulated in the Gr temperature regime in the dark period. Time points with significant differential expression are indicated with *p < .05, **p < .01 and ***p < .001. The shaded areas indicate the dark period. Genes were selected form the self‐organizing map clusters 4 and 8 for (a) and from clusters 12 and 16 for (b,c) (see Figure S6) [Colour figure can be viewed at wileyonlinelibrary.com]
3.6. Temperature treatments affect expression of different regulatory genes associated with the circadian clock
Clusters 12 and 16 contained a number of circadian clock genes, which were up‐regulated at night, depending on the treatment (Figure S6). At night (T4, T5), type‐A response regulators (ARR5, ARR6 and ARR9) were up‐regulated in the Bi treatment coinciding with the night growth peak in this treatment (Figure 5b). ARR3 and ARR9 on the other hand were down‐regulated at T2 coinciding with the decline in RGR and with the up‐regulated cell division in the Bi treatment at this time point.
In the Gr treatment with more natural temperature fluctuations, a number of circadian clock genes were up‐regulated at night when temperatures were low (Figure 5c). These were namely the morning loop genes PSEUDO‐RESPONSE REGULATOR 5 (PRR5) and PRR7, the evening components EARLY FLOWERING 4 (ELF4), LUX ARRHYTHMO (LUX) and GIGANTEA (GI) and the clock‐regulated genes COLD CIRCADIAN RHYTHM AND RNA BINDING 2 (CCR2) and CONSTANS‐LIKE 9 (COL9).
4. DISCUSSION
In this study, growth of soybean leaves was analysed in high temporal resolution in the field and under controlled conditions. The first important finding was that diel growth pattern measured in the field was profoundly different from what is expected based on findings from controlled conditions. The expected pattern of maximum growth towards the end of the night is well known from A. thaliana (Pantin et al., 2011), seedlings of N. tabacum (Poiré et al., 2010; Walter et al., 2009) as well as soybean (Friedli & Walter, 2015). However, in the field experiment, plants did not show this pattern; instead, RGR closely followed temperature. It was possible to reproduce the observed growth pattern in the field under controlled conditions by mimicking a natural temperature regime. Not only did this alter the diel growth pattern but resulted in clear differences in metabolism and gene expression. Temperature effects on growth were not detectable in the Bi regime but became apparent in the Gr regime, even though average temperature was kept similar in both treatments.
Accumulation and storage of carbon as starch and sucrose during the afternoon in the Bi treatment was consistent with the reduced afternoon RGR in this treatment. This observation agrees with photosynthates being utilized less for growth processes during the afternoon compared to the Gr treatment (Gibon et al., 2004, 2009; Graf, Schlereth, Stitt, & Smith, 2010; Stitt & Zeeman, 2012). At night, starch concentration decreased in the Bi treatment, while sucrose concentration increased until T3 to then drop sharply towards T4. This aligns well with increased RGR in the second half of the night and conveys that this substrate has been used for growth at night in the Bi treatment. In the Gr treatment, the less pronounced increase of starch and sucrose throughout the day that occurs in parallel to a strong increase in growth activity could be explained by carbohydrates fuelling growth directly from photosynthesis within the growing leaf. Thus, starch synthesis would be in competition with growth. This hypothesis is supported by a strong decrease in total soluble sugar content at this time in the Gr treatment when compared to the values of the Bi treatment. The decrease in starch concentration and coinciding increase in sucrose concentration at night, however, is not reflected in the growth data of the Gr treatment. A possible explanation could be that starch was mobilized and translocated to other plant organs. However, this is speculative, as only one leaf per plant was sampled and carbohydrate fluxes were not analysed.
In this study, plants were grown under long days (16 hr) as this corresponds to the naturally experienced growth conditions in the field. Therefore, carbohydrates are expected not to be limiting for night growth. This is reflected in the starch degradation overnight, which did not deplete starch completely, but reduced it only by about 30% of the starch concentration at the end of the day. This is in accordance with results of other studies (Sulpice et al., 2014) and may explain the small overall differences in diurnal starch concentrations between the two treatments. In both treatments, carbohydrate concentrations increased from T1 to T6 (from 1 day to the next), reflecting the transition of the growing leaf from a sink to a source organ (Pantin et al., 2011; Pilkington et al., 2015; Ruts et al., 2012).
Since there was no difference in post‐photosynthetic carbon isotope fractionation e between treatments, it can be concluded that there is no difference in carbon isotope fractionation due to respiration, mainly for maintenance. Our measured e values fit to the reported range of values (Ocheltree & Marshall, 2004). Consequently, the differences observed in δ 13C of bulk, sugars, starch and respired CO2 are predominately the result of carbon isotope discrimination △ that takes place during the day, when CO2 is fixed and assimilated into sugars during photosynthesis (Figure 3c). Higher △ in Gr compared to Bi indicates a higher c i/c a ratio (the ratio of intercellular to ambient CO2 concentrations; Farquhar et al., 1989) in leaves growing under Gr compared to Bi. High c i /c a can either be due to high stomatal conductance, allowing unrestricted diffusion of ambient CO2 into the leaf, leading to high c i despite high CO2 fixation during photosynthesis, or due to low CO2 fixation, keeping c i high independent of stomatal conductance. Since all plants were watered regularly to unlimited water supply and RGR during the day was higher in plants grown under Gr compared to Bi (Figure 2a), lower CO2 fixation can be excluded as an explanation for higher △ in Gr compared to Bi. Higher stomatal conductance can also explain why we observed higher △ with higher VPD and higher daytime temperature (co‐occurring with higher VPD conditions; Figure S4a–c) in the Gr treatment compared to the Bi treatment. For example, already O'Leary (1995) showed declining δ 13C values with increasing temperature, which is in line with our observations of higher △. Combining our observations of △ (Figure 3e) with the results of the RGR model (Table 1) suggests a larger effect of temperature than of VPD on △, since RGR was unaffected by VPD for both Gr and Bi (probably driven by the unlimited water supply), but strongly affected by temperature for Gr (but not for Bi). Thus, stable carbon isotope data clearly point to a daytime process, that is, a temperature‐related difference in carbon assimilation between these two experimental regimes, also supported by the differences observed earlier in the carbohydrate concentration analysis.
It is known from previous studies with starch‐free Arabidopsis mutants that the carbohydrate status has a direct impact on the amplitude and phasing of diel leaf growth patterns (Wiese, Christ, Virnich, Schurr, & Walter, 2007). Mutants that cannot store carbohydrates produced via photosynthesis during the afternoon show a higher growth rate during this time of the day (similar to soybean plants under the Gr regime). At night, however, these leaves are depleted in energy and carbohydrates for cell wall synthesis which inhibits their growth (Wiese et al., 2007). Similar shifts in growth pattern are seen in this study in the Gr treatment even though carbon can be considered non‐limiting. This points towards the importance of temperature for diel growth processes. Although there were minor differences in diel starch turnover, growth was significantly lower at night in the Gr treatment, along with low temperature. Previous research in Arabidopsis showed that growth and metabolism respond strongly to day temperatures but are largely irresponsive to cool nights (Pyl et al., 2012). Whereas this is in agreement with the carbon metabolite results of this study, the growth data indicate a strong, non‐compensated effect of night temperature. Additionally, pgm mutants (no detectable plastidial phosphoglucomutase) of several plant species have more negative δ 13C values of bulk plant material (Lehmann et al., 2019) corresponding to a higher Δ compared to their wild‐type analogues similar to the soybean plants under Gr in contrast to plants in Bi regime.
The changes in growth pattern and carbohydrate metabolism induced by a change in the diel temperature regime were also reflected in the gene expression data. The expression patterns of the clock genes up‐regulated at night in the Gr treatment align well with the lower night temperatures in this treatment. PRR5 and PRR7 as well as ELF4 and LUX are important components of the temperature compensation mechanism in the A. thaliana circadian clock (Jones, Morohashi, Grotewold, & Harmer, 2019; Salomé, Weigel, & McClung, 2010). Together with ELF3, ELF4 and LUX were reported to regulate the diurnal gating of hypocotyl elongation, peaking at dawn, in A. thaliana (Nusinow et al., 2011). The clock also mediates diurnal starch turnover, with increased starch accumulation in mutants lacking GI (Eimert, Wang, Lue, & Chen, 1995; Izawa et al., 2011; Ruts et al., 2012).
The upregulation of genes associated with cell division processes at T2 in the Bi treatment indicates a synchronization of the remaining cell division activity in the soybean leaves under the binary temperature regime (also: ARR and other activities are aligned with this). This peak in cell division activity might be related to the decline in growth rate in the afternoon, as overexpression of CYCLIN D3 in transformed Arabidopsis leads to an increase in cell division but hampered cell expansion (Breuninger & Lenhard, 2010; Dewitte et al., 2003; Gonzalez, Vanhaeren, & Inzé, 2012). However, this interpretation remains speculative. Although 26 genes of the CYCLIN family as well as the transcriptional activator AINTEGUMENTA were found among the over‐expressed genes at T2 in the Bi treatment, CYCLIN D3 itself was not identified (see Table S2). However, synchronized cell division would lead to a subsequent phase of rapid leaf growth induced by an early phase of intensive cell expansion. This corresponds with the observed peak of leaf growth activity during the night in the Bi treatment. In the Gr treatment on the other hand, the remaining cell division activity is spread out during the diel cycle and mirrors that of the temperature course.
The synchronization of cell cycle was unexpected as there are, to the knowledge of the authors, no reports of naturally occurring cell division synchronization in higher plants. Yet, synchronization of cell cycle has been observed in algae, cyanobacteria and other unicellular organisms, which are controlled by the circadian clock (de Winter, Klok, Cuaresma, Barbosa, & Wijffels, 2013; Mittag, 2001; Mori & Johnson, 2001; Yang, Pando, Dong, Golden, & van Oudenaarden, 2010). Given that the type‐A response regulators negatively regulate the response to the phytohormone cytokinin (To et al., 2004) and because cytokinin plays a key role in plant growth, morphogenesis and cell division (Werner, Motyka, Strnad, & Schmülling, 2001), the expression patterns found for these genes might explain a synchronization of the remaining cell division activity in the tissues of the analysed leaves.
Thus, the results reported here support the view that in the investigated dicot plants, growth is more temperature driven than regulated by the circadian clock—at least under natural temperature regimes and long days. This stands in contrast to the reported temperature independence of dicot leaf growth pattern (Bunce, 1977; Nozue et al., 2007; Poiré et al., 2010; Walter et al., 2009) but is in agreement with findings from the monocot Brachypodium distachyon, where growth follows temperature despite clear circadian gene expression (Matos et al., 2014). Apart from the differentially expressed genes discussed above, the global diurnal gene expression pattern remained largely similar between the treatments in this study, reflecting the similarity of the treatments apart from the diel temperature course. Therefore, other factors such as posttranslational regulation as well as interactions with other environmental stimuli would be important aspects for further investigation into the control of diel leaf growth patterning.
Both temperature and light are important factors for a ‘realistic’ behaviour of plant growth and metabolism under controlled conditions. Annunziata et al. (2017) demonstrated that diel carbon and nitrogen metabolism were significantly altered when Arabidopsis plants were grown in sunlight compared to a binary or sinusoidal artificial illumination. Similar effects on metabolism and gene expression were shown with respect to temperature (Annunziata et al., 2018). The presented findings confirm these results from the literature and directly link them to leaf growth, showing the manifold effects of temperature on plant function. Moreover, the clock appears to synchronize cell division in the late afternoon. Broadly, the core clock is retained regardless of temperature regime, but some elements are recruited for this synchronization. The results suggest that when plants experience a natural diel temperature cycle, similar to that in the field under long days and non‐limiting carbohydrate conditions, their leaf growth follows that of temperature. Yet, under a binary temperature regime, the circadian clock plays a prominent role in leaf expansion.
5. CONCLUSIONS
Together, these results have important implications for further investigations into plant metabolism, plant–environment interactions and the genetic control thereof. If the aim is to understand or predict how plants develop in natural environments, climate conditions set to a more realistic regime could lead to results that are more transferrable. State‐of‐the‐art climate chambers allow mimicking natural conditions in greater extent compared to the current study. Digital controllers, lights and sensors allow for precise, real‐time and dynamic control of temperature, humidity and light (Cruz et al., 2016). In contrast, specific processes (e.g. cell division in the current study) may become more accessible under binary or steady‐state settings. Thus, applying binary or steady‐state settings for one or multiple variables could be beneficial to study processes isolated from the effects of these environmental variables.
CONFLICT OF INTEREST
The authors declare no conflicts of interest.
AUTHOR CONTRIBUTIONS
Lukas Kronenberg supervised the leaf growth measurements, conducted the RNA extraction, analysed the phenotypic and gene expression data and drafted the manuscript. Steven Yates supervised the RNA extraction, processed the sequence data and supervised the gene expression analysis. Shiva Ghiasi and Roland A. Werner conducted the carbon isotope analysis. Lukas Roth and Michael Friedli conducted the preliminary experiments. Michael E. Ruckle quantified starch and soluble sugars. Flavian Tschurr and Melanie Binggeli conducted the leaf growth measurements. Nina Buchmann supervised the carbon isotope analysis and was a consultant for the overall concept. Bruno Studer supervised the gene expression analysis and was a consultant for the overall concept. Achim Walter drafted the grant application, conceived the research question and supervised the overall concept. All authors contributed to the drafting of the manuscript.
Supporting information
Figure S1. Diel growth pattern of soybean in the 2015 experiment.
Figure S2. Time series decomposition of the observed growth pattern for both treatments.
Figure S3. Prediction of RGR using temperature, vapour pressure deficit, light and the square root of the leaf area as predictors in a growth model and applying it on each treatment (Bi, Gr) individually.
Figure S4. Diel course of temperature (a), relative humidity (RH; b), vapour pressure deficit (VPD; c), light (d) and average temperature across 24 hours, during the day and during the night period (e) in the two treatments.
Figure S5. Leaf concentration of glucose (a), fructose (b) and total soluble sugar (c) as well as δ13C values of starch (d), sugars (e), dark respired CO2 (f) and plant bulk matter (g).
Figure S6. Self‐organizing map (SOM) of normalized expression patterns of differentially expressed (DE) genes per treatment across the six time points (T1‐T6).
Table S1. Time points of samplings and day/night change.
Table S2. Arabidopsis thaliana homologs and descriptions of the 253 differentially expressed genes associated with cell division and up‐regulated at T2 in the binary temperature treatment.
ACKNOWLEDGMENTS
We thank Sebastian Nagelmüller for his support in the experimental work, Eduardo Pérez for his contributions to the preliminary experiments and Brigitta Herzog for planting and nursing the seedlings used for the controlled condition experiments in this study. We also thank Hansueli Zellweger who maintained and nursed the field experiments. Further, we thank Norbert Kirchgessner for his support with the analysis software and Martrack Leaf and Hans‐Juerg Lendi for technical maintenance of the climate chambers. This work was supported by the Swiss National Foundation (SNF) in the framework of the projects PhenoCOOL (project no. 169542) and CarIN (project no. 205321_153545).
Kronenberg L, Yates S, Ghiasi S, et al. Rethinking temperature effects on leaf growth, gene expression and metabolism: Diel variation matters. Plant Cell Environ. 2021;44:2262–2276. 10.1111/pce.13958
Funding information Schweizerischer Nationalfonds zur Förderung der Wissenschaftlichen Forschung, Grant/Award Numbers: CarIN / 205321_153545, PhenoCOOL / 169542
REFERENCES
- Alexa A. & Rahnenfuhrer J. (2018) topGO: Enrichment analysis for gene ontology. http://bioconductor.org/packages/release/bioc/html/topGO.html
- Allard, G., & Nelson, C. J. (1991). Photosynthate partitioning in basal zones of tall fescue leaf blades. Plant Physiology, 95, 663–668. [DOI] [PMC free article] [PubMed] [Google Scholar]
- Annunziata, M. G., Apelt, F., Carillo, P., Krause, U., Feil, R., Koehl, K., … Stitt, M. (2018). Response of Arabidopsis primary metabolism and circadian clock to low night temperature in a natural light environment. Journal of Experimental Botany, 69, 4881–4895. [DOI] [PMC free article] [PubMed] [Google Scholar]
- Annunziata, M. G., Apelt, F., Carillo, P., Krause, U., Feil, R., Mengin, V., … Lunn, J. E. (2017). Getting back to nature: A reality check for experiments in controlled environments. Journal of Experimental Botany, 68, 4463–4477. [DOI] [PMC free article] [PubMed] [Google Scholar]
- Atkin, O. K., Evans, J. R., Ball, M. C., Lambers, H., & Pons, T. L. (2000). Leaf respiration of snow gum in the light and dark. Interactions between temperature and irradiance. Plant Physiology, 122, 915–924. [DOI] [PMC free article] [PubMed] [Google Scholar]
- Avery, G. S. (1933). Structure and development of the tobacco leaf. American Journal of Botany, 20, 565–592. [Google Scholar]
- Barbour, M. M., Mcdowell, N. G., Tcherkez, G., Bickford, C. P., & Hanson, D. T. (2007). A new measurement technique reveals rapid post‐illumination changes in the carbon isotope composition of leaf‐respired CO2 . Plant, Cell & Environment, 30, 469–482. [DOI] [PubMed] [Google Scholar]
- Barbour, M. M., Tcherkez, G., Bickford, C. P., Mauve, C., Lamothe, M., Sinton, S., & Brown, H. (2011). δ13C of leaf‐respired CO2 reflects intrinsic water‐use efficiency in barley. Plant, Cell & Environment, 34, 792–799. [DOI] [PubMed] [Google Scholar]
- Barthel, M., Cieraad, E., Zakharova, A., & Hunt, J. E. (2014). Sudden cold temperature delays plant carbon transport and shifts allocation from growth to respiratory demand. Biogeosciences, 11, 1425–1433. [Google Scholar]
- Brégard, A., & Allard, G. (1999). Sink to source transition in developing leaf blades of tall fescue. New Phytologist, 141, 45–50. [Google Scholar]
- Breuninger, H., & Lenhard, M. (2010). Chapter 7: Control of tissue and organ growth in plants. In Timmermans M. C. P. (Ed.), Current topics in developmental biology. Plant development (pp. 185–220). Cambridge, MA: Academic Press. . [DOI] [PubMed] [Google Scholar]
- Brooks, P. D., Geilmann, H., Werner, R. A., & Brand, W. A. (2003). Improved precision of coupled δ13C and δ15N measurements from single samples using an elemental analyzer/isotope ratio mass spectrometer combination with a post‐column six‐port valve and selective CO2 trapping; improved halide robustness of the combustion reactor using CeO2 . Rapid Communications in Mass Spectrometry, 17, 1924–1926. [DOI] [PubMed] [Google Scholar]
- Bunce, J. A. (1977). Leaf elongation in relation to leaf water potential in soybean. Journal of Experimental Botany, 28, 156–161. [Google Scholar]
- Caldeira, C. F., Jeanguenin, L., Chaumont, F., & Tardieu, F. (2014). Circadian rhythms of hydraulic conductance and growth are enhanced by drought and improve plant performance. Nature Communications, 5, 5365. [DOI] [PMC free article] [PubMed] [Google Scholar]
- Cruz, J. A., Savage, L. J., Zegarac, R., Hall, C. C., Satoh‐Cruz, M., Davis, G. A., … Kramer, D. M. (2016). Dynamic environmental photosynthetic imaging reveals emergent phenotypes. Cell Systems, 2, 365–377. [DOI] [PubMed] [Google Scholar]
- de Winter, L., Klok, A. J., Cuaresma, F. M., Barbosa, M. J., & Wijffels, R. H. (2013). The synchronized cell cycle of Neochloris oleoabundans and its influence on biomass composition under constant light conditions. Algal Research, 2, 313–320. [Google Scholar]
- Dewitte, W., Riou‐Khamlichi, C., Scofield, S., Healy, J. M. S., Jacqmard, A., Kilby, N. J., & Murray, J. A. H. (2003). Altered cell cycle distribution, hyperplasia, and inhibited differentiation in Arabidopsis caused by the D‐type cyclin CYCD3. The Plant Cell, 15, 79–92. [DOI] [PMC free article] [PubMed] [Google Scholar]
- Dodd, A. N., Salathia, N., Hall, A., Kévei, E., Tóth, R., Nagy, F., … Webb, A. A. R. (2005). Plant circadian clocks increase photosynthesis, growth, survival, and competitive advantage. Science, 309, 630–633. [DOI] [PubMed] [Google Scholar]
- Eimert, K., Wang, S. M., Lue, W. I., & Chen, J. (1995). Monogenic recessive mutations causing both late floral initiation and excess starch accumulation in Arabidopsis. The Plant Cell, 7, 1703–1712. [DOI] [PMC free article] [PubMed] [Google Scholar]
- Farquhar G D, Ehleringer J R, Hubick K T (1989). Carbon Isotope Discrimination and Photosynthesis. Annual Review of Plant Physiology and Plant Molecular Biology, 40, (1), 503–537. 10.1146/annurev.pp.40.060189.002443. [DOI] [Google Scholar]
- Farré, E. M. (2012). The regulation of plant growth by the circadian clock. Plant Biology, 14, 401–410. [DOI] [PubMed] [Google Scholar]
- Friedli, M., & Walter, A. (2015). Diel growth patterns of young soybean (Glycine max) leaflets are synchronous throughout different positions on a plant. Plant, Cell & Environment, 38, 514–524. [DOI] [PubMed] [Google Scholar]
- Gallagher, J. N. (1979). Field studies of cereal leaf growth. I. Initiation and expansion in relation to temperature and ontogeny. Journal of Experimental Botany, 30, 625–636. [Google Scholar]
- Gibon, Y., Bläsing, O. E., Palacios‐Rojas, N., Pankovic, D., Hendriks, J. H. M., Fisahn, J., … Stitt, M. (2004). Adjustment of diurnal starch turnover to short days: Depletion of sugar during the night leads to a temporary inhibition of carbohydrate utilization, accumulation of sugars and post‐translational activation of ADP‐glucose pyrophosphorylase in the following light period. The Plant Journal, 39, 847–862. [DOI] [PubMed] [Google Scholar]
- Gibon, Y., Pyl, E.‐T., Sulpice, R., Lunn, J. E., Höhne, M., Günther, M., & Stitt, M. (2009). Adjustment of growth, starch turnover, protein content and central metabolism to a decrease of the carbon supply when Arabidopsis is grown in very short photoperiods. Plant, Cell & Environment, 32, 859–874. [DOI] [PubMed] [Google Scholar]
- Gonzalez, N., Vanhaeren, H., & Inzé, D. (2012). Leaf size control: Complex coordination of cell division and expansion. Trends in Plant Science, 17, 332–340. [DOI] [PubMed] [Google Scholar]
- Graf, A., Schlereth, A., Stitt, M., & Smith, A. M. (2010). Circadian control of carbohydrate availability for growth in Arabidopsis plants at night. Proceedings of the National Academy of Sciences, 107, 9458–9463. [DOI] [PMC free article] [PubMed] [Google Scholar]
- Green, R. M., Tingay, S., Wang, Z.‐Y., & Tobin, E. M. (2002). Circadian rhythms confer a higher level of fitness to Arabidopsis plants. Plant Physiology, 129, 576–584. [DOI] [PMC free article] [PubMed] [Google Scholar]
- Gutierrez, C. (2009). The Arabidopsis cell division cycle. In The Arabidopsis book (Vol. 7), Rockville, MD: American Society of Plant Biologists. [DOI] [PMC free article] [PubMed] [Google Scholar]
- Izawa, T., Mihara, M., Suzuki, Y., Gupta, M., Itoh, H., Nagano, A. J., … Nagamura, Y. (2011). Os‐GIGANTEA confers robust diurnal rhythms on the global transcriptome of rice in the field. The Plant Cell, 23, 1741–1755. [DOI] [PMC free article] [PubMed] [Google Scholar]
- Jones M. A., Morohashi K., Grotewold E., Harmer S. L. (2019). Arabidopsis JMJD5/JMJ30 Acts Independently of LUX ARRHYTHMO Within the Plant Circadian Clock to Enable Temperature Compensation. Frontiers in Plant Science, 10, 57. [DOI] [PMC free article] [PubMed] [Google Scholar]
- Kim, D., Pertea, G., Trapnell, C., Pimentel, H., Kelley, R., & Salzberg, S. L. (2013). TopHat2: Accurate alignment of transcriptomes in the presence of insertions, deletions and gene fusions. Genome Biology, 14, R36. [DOI] [PMC free article] [PubMed] [Google Scholar]
- Langmead, B., & Salzberg, S. L. (2012). Fast gapped‐read alignment with Bowtie 2. Nature Methods, 9, 357–359. [DOI] [PMC free article] [PubMed] [Google Scholar]
- Lehmann, M. M., Ghiasi, S., George, G. M., Cormier, M.‐A., Gessler, A., Saurer, M., & Werner, R. A. (2019). Influence of starch deficiency on photosynthetic and post‐photosynthetic carbon isotope fractionations. Journal of Experimental Botany, 70, 1829–1841. [DOI] [PMC free article] [PubMed] [Google Scholar]
- Matos, D. A., Cole, B. J., Whitney, I. P., MacKinnon, K. J.‐M., Kay, S. A., & Hazen, S. P. (2014). Daily changes in temperature, not the circadian clock, regulate growth rate in Brachypodium distachyon . PLoS One, 9, e100072. [DOI] [PMC free article] [PubMed] [Google Scholar]
- McClung, C. R. (2001). Circadian rhythms in plants. Annual Review of Plant Physiology and Plant Molecular Biology, 52, 139–162. [DOI] [PubMed] [Google Scholar]
- Messin, L. J., & Millar, J. B. A. (2014). Role and regulation of kinesin‐8 motors through the cell cycle. Systems and Synthetic Biology, 8, 205–213. [DOI] [PMC free article] [PubMed] [Google Scholar]
- Mielewczik, M., Friedli, M., Kirchgessner, N., & Walter, A. (2013). Diel leaf growth of soybean: A novel method to analyze two‐dimensional leaf expansion in high temporal resolution based on a marker tracking approach (Martrack leaf). Plant Methods, 9, 1–14. [DOI] [PMC free article] [PubMed] [Google Scholar]
- Mittag, M. (2001). Circadian rhythms in microalgae. International Review of Cytology, 206, 213–247. [DOI] [PubMed] [Google Scholar]
- Mori, T., & Johnson, C. H. (2001). Circadian programming in cyanobacteria. Seminars in Cell & Developmental Biology, 12, 271–278. [DOI] [PubMed] [Google Scholar]
- Müller, S., Han, S., & Smith, L. G. (2006). Two kinesins are involved in the spatial control of cytokinesis in Arabidopsis thaliana . Current Biology, 16, 888–894. [DOI] [PubMed] [Google Scholar]
- Nagelmüller, S., Kirchgessner, N., Yates, S., Hiltpold, M., & Walter, A. (2016). Leaf length tracker: A novel approach to analyse leaf elongation close to the thermal limit of growth in the field. Journal of Experimental Botany, 67, 1897–1906. [DOI] [PMC free article] [PubMed] [Google Scholar]
- Nagelmüller, S., Yates, S., & Walter, A. (2018). Diel leaf growth of rapeseed at critically low temperature under winter field conditions. Functional Plant Biology, 45, 1110–1118. [DOI] [PubMed] [Google Scholar]
- Nelissen, H., Gonzalez Sanchez, N., & Inzé, D. (2016). Leaf growth in dicots and monocots: So different yet so alike. Current Opinion in Plant Biology, 33, 72–76. [DOI] [PubMed] [Google Scholar]
- Nozue, K., Covington, M. F., Duek, P. D., Lorrain, S., Fankhauser, C., Harmer, S. L., & Maloof, J. N. (2007). Rhythmic growth explained by coincidence between internal and external cues. Nature, 448, 358–361. [DOI] [PubMed] [Google Scholar]
- Nusinow, D. A., Helfer, A., Hamilton, E. E., King, J. J., Imaizumi, T., Schultz, T. F., … Kay, S. A. (2011). The ELF4–ELF3–LUX complex links the circadian clock to diurnal control of hypocotyl growth. Nature, 475, 398–402. [DOI] [PMC free article] [PubMed] [Google Scholar]
- Ocheltree, T. W., & Marshall, J. D. (2004). Apparent respiratory discrimination is correlated with growth rate in the shoot apex of sunflower (Helianthus annuus). Journal of Experimental Botany, 55, 2599–2605. [DOI] [PubMed] [Google Scholar]
- O'Leary, M. H. (1995). Environmental effects on carbon isotope fractionation in terrestrial plants. In Stable isotopes in the biosphere. Kyoto, Japan: Kyoto University Press. [Google Scholar]
- Pantin, F., Simonneau, T., & Muller, B. (2012). Coming of leaf age: Control of growth by hydraulics and metabolics during leaf ontogeny. New Phytologist, 196, 349–366. [DOI] [PubMed] [Google Scholar]
- Pantin, F., Simonneau, T., Rolland, G., Dauzat, M., & Muller, B. (2011). Control of leaf expansion: A developmental switch from metabolics to hydraulics. Plant Physiology, 156, 803–815. [DOI] [PMC free article] [PubMed] [Google Scholar]
- Pilkington, S. M., Encke, B., Krohn, N., Höhne, M., Stitt, M., & Pyl, E.‐T. (2015). Relationship between starch degradation and carbon demand for maintenance and growth in Arabidopsis thaliana in different irradiance and temperature regimes. Plant, Cell & Environment, 38, 157–171. [DOI] [PubMed] [Google Scholar]
- Poethig, R. S., & Sussex, I. M. (1985). The developmental morphology and growth dynamics of the tobacco leaf. Planta, 165, 158–169. [DOI] [PubMed] [Google Scholar]
- Poiré, R., Wiese‐Klinkenberg, A., Parent, B., Mielewczik, M., Schurr, U., Tardieu, F., & Walter, A. (2010). Diel time‐courses of leaf growth in monocot and dicot species: Endogenous rhythms and temperature effects. Journal of Experimental Botany, 61(6), 1751–1759. [DOI] [PMC free article] [PubMed] [Google Scholar]
- Poorter, H., Fiorani, F., Pieruschka, R., Wojciechowski, T., van der Putten, W. H., Kleyer, M., … Postma, J. (2016). Pampered inside, pestered outside? Differences and similarities between plants growing in controlled conditions and in the field. New Phytologist, 212, 838–855. [DOI] [PubMed] [Google Scholar]
- Pyl, E.‐T., Piques, M., Ivakov, A., Schulze, W., Ishihara, H., Stitt, M., & Sulpice, R. (2012). Metabolism and growth in Arabidopsis depend on the daytime temperature but are temperature‐compensated against cool nights. The Plant Cell, 24, 2443–2469. [DOI] [PMC free article] [PubMed] [Google Scholar]
- Richter, A., Wanek, W., Werner, R. A., Ghashghaie, J., Jäggi, M., Gessler, A., … Gleixner, G. (2009). Preparation of starch and soluble sugars of plant material for the analysis of carbon isotope composition: A comparison of methods. Rapid Communications in Mass Spectrometry, 23, 2476–2488. [DOI] [PubMed] [Google Scholar]
- R Core Team (2018). R: A language and environment for statistical computing. Vienna, Austria: R Foundation for Statistical Computing. [Google Scholar]
- Ruckle, M. E., Bernasconi, L., Kölliker, R., Zeeman, S. C., & Studer, B. (2018). Genetic diversity of diurnal carbohydrate accumulation in white clover (Trifolium repens L.). Agronomy, 8, 47. [Google Scholar]
- Ruckle, M. E., Meier, M. A., Frey, L., Eicke, S., Kölliker, R., Zeeman, S. C., & Studer, B. (2017). Diurnal leaf starch content: An orphan trait in forage legumes. Agronomy, 7, 16. [Google Scholar]
- Ruts, T., Matsubara, S., Wiese‐Klinkenberg, A., & Walter, A. (2012). Diel patterns of leaf and root growth: Endogenous rhythmicity or environmental response? Journal of Experimental Botany, 63(9), 3339–3351. [DOI] [PubMed] [Google Scholar]
- Sadok, W., Naudin, P., Boussuge, B., Muller, B., Welcker, C., & Tardieu, F. (2007). Leaf growth rate per unit thermal time follows QTL‐dependent daily patterns in hundreds of maize lines under naturally fluctuating conditions. Plant, Cell & Environment, 30, 135–146. [DOI] [PubMed] [Google Scholar]
- Salmon, Y., Buchmann, N., & Barnard, R. L. (2016). Effects of ontogeny on δ13C of plant‐ and soil‐respired CO2 and on respiratory carbon fractionation in C3 herbaceous species. PLoS One, 11, e0151583. [DOI] [PMC free article] [PubMed] [Google Scholar]
- Salomé, P. A., Weigel, D., & McClung, C. R. (2010). The role of the Arabidopsis morning loop components CCA1, LHY, PRR7, and PRR9 in temperature compensation. The Plant Cell, 22, 3650–3661. [DOI] [PMC free article] [PubMed] [Google Scholar]
- Schmutz, J., Cannon, S. B., Schlueter, J., Ma, J., Mitros, T., Nelson, W., … Jackson, S. A. (2010). Genome sequence of the palaeopolyploid soybean. Nature, 463, 178–183. [DOI] [PubMed] [Google Scholar]
- Stitt, M., & Zeeman, S. C. (2012). Starch turnover: Pathways, regulation and role in growth. Current Opinion in Plant Biology, 15, 282–292. [DOI] [PubMed] [Google Scholar]
- Sulpice, R., Flis, A., Ivakov, A. A., Apelt, F., Krohn, N., Encke, B., … Stitt, M. (2014). Arabidopsis coordinates the diurnal regulation of carbon allocation and growth across a wide range of photoperiods. Molecular Plant, 7, 137–155. [DOI] [PubMed] [Google Scholar]
- Tcherkez, G., Nogués, S., Bleton, J., Cornic, G., Badeck, F., & Ghashghaie, J. (2003). Metabolic origin of carbon isotope composition of leaf dark‐respired CO2 in French bean. Plant Physiology, 131, 237–244. [DOI] [PMC free article] [PubMed] [Google Scholar]
- To, J. P. C., Haberer, G., Ferreira, F. J., Deruère, J., Mason, M. G., Schaller, G. E., … Kieber, J. J. (2004). Type‐A Arabidopsis response regulators are partially redundant negative regulators of cytokinin signaling. The Plant Cell, 16, 658–671. [DOI] [PMC free article] [PubMed] [Google Scholar]
- Trapnell, C., Roberts, A., Goff, L., Pertea, G., Kim, D., Kelley, D. R., … Pachter, L. (2012). Differential gene and transcript expression analysis of RNA‐seq experiments with TopHat and cufflinks. Nature Protocols, 7, 562–578. [DOI] [PMC free article] [PubMed] [Google Scholar]
- Vercruysse, J., Baekelandt, A., Gonzalez, N., & Inzé, D. (2020). Molecular networks regulating cell division during Arabidopsis leaf growth. Journal of Experimental Botany, 71, 2365–2378. [DOI] [PMC free article] [PubMed] [Google Scholar]
- Völker, A., Stierhof, Y.‐D., & Jürgens, G. (2001). Cell cycle‐independent expression of the Arabidopsis cytokinesis‐specific syntaxin KNOLLE results in mistargeting to the plasma membrane and is not sufficient for cytokinesis. Journal of Cell Science, 114, 3001–3012. [DOI] [PubMed] [Google Scholar]
- Walter, A., Silk, W. K., & Schurr, U. (2009). Environmental effects on spatial and temporal patterns of leaf and root growth. Annual Review of Plant Biology, 60, 279–304. [DOI] [PubMed] [Google Scholar]
- Wanek, W., Heintel, S., & Richter, A. (2001). Preparation of starch and other carbon fractions from higher plant leaves for stable carbon isotope analysis. Rapid Communications in Mass Spectrometry, 15, 1136–1140. [DOI] [PubMed] [Google Scholar]
- Wehrens, R., & Kruisselbrink, J. (2018). Flexible self‐organizing maps in kohonen 3.0. Journal of Statistical Software, 87, 1–18. [Google Scholar]
- Werner, R. A., Bruch, B. A., & Brand, W. A. (1999). ConFlo III – An interface for high precision δ13C and δ15N analysis with an extended dynamic range. Rapid Communications in Mass Spectrometry, 13, 1237–1241. [DOI] [PubMed] [Google Scholar]
- Werner, R. A., Buchmann, N., Siegwolf, R. T. W., Kornexl, B. E., & Gessler, A. (2011). Metabolic fluxes, carbon isotope fractionation and respiration ‐ Lessons to be learned from plant biochemistry: Letter. New Phytologist, 191, 10–15. [DOI] [PubMed] [Google Scholar]
- Werner, T., Motyka, V., Strnad, M., & Schmülling, T. (2001). Regulation of plant growth by cytokinin. Proceedings of the National Academy of Sciences, 98, 10487–10492. [DOI] [PMC free article] [PubMed] [Google Scholar]
- Wiese, A., Christ, M. M., Virnich, O., Schurr, U., & Walter, A. (2007). Spatio‐temporal leaf growth patterns of Arabidopsis thaliana and evidence for sugar control of the diel leaf growth cycle. New Phytologist, 174, 752–761. [DOI] [PubMed] [Google Scholar]
- Wordeman, L. (2010). How kinesin motor proteins drive mitotic spindle function: Lessons from molecular assays. Seminars in Cell & Developmental Biology, 21, 260–268. [DOI] [PMC free article] [PubMed] [Google Scholar]
- Yang, Q., Pando, B. F., Dong, G., Golden, S. S., & van Oudenaarden, A. (2010). Circadian gating of the cell cycle revealed in single cyanobacterial cells. Science, 327, 1522–1526. [DOI] [PMC free article] [PubMed] [Google Scholar]
- Yates, S., Jaškūnė, K., Liebisch, F., Nagelmüller, S., Kirchgessner, N., Kölliker, R., … Studer, B. (2019). Phenotyping a dynamic trait: Leaf growth of perennial ryegrass under water limiting conditions. Frontiers in Plant Science, 10, 344. [DOI] [PMC free article] [PubMed] [Google Scholar]
- Zeeman, M. J., Werner, R. A., Eugster, W., Siegwolf, R. T. W., Wehrle, G., Mohn, J., & Buchmann, N. (2008). Optimization of automated gas sample collection and isotope ratio mass spectrometric analysis of δ13C of CO2 in air. Rapid Communications in Mass Spectrometry, 22, 3883–3892. [DOI] [PubMed] [Google Scholar]
Associated Data
This section collects any data citations, data availability statements, or supplementary materials included in this article.
Supplementary Materials
Figure S1. Diel growth pattern of soybean in the 2015 experiment.
Figure S2. Time series decomposition of the observed growth pattern for both treatments.
Figure S3. Prediction of RGR using temperature, vapour pressure deficit, light and the square root of the leaf area as predictors in a growth model and applying it on each treatment (Bi, Gr) individually.
Figure S4. Diel course of temperature (a), relative humidity (RH; b), vapour pressure deficit (VPD; c), light (d) and average temperature across 24 hours, during the day and during the night period (e) in the two treatments.
Figure S5. Leaf concentration of glucose (a), fructose (b) and total soluble sugar (c) as well as δ13C values of starch (d), sugars (e), dark respired CO2 (f) and plant bulk matter (g).
Figure S6. Self‐organizing map (SOM) of normalized expression patterns of differentially expressed (DE) genes per treatment across the six time points (T1‐T6).
Table S1. Time points of samplings and day/night change.
Table S2. Arabidopsis thaliana homologs and descriptions of the 253 differentially expressed genes associated with cell division and up‐regulated at T2 in the binary temperature treatment.