Abstract
The informatics pipeline for making sense of untargeted LC–MS or GC–MS data starts with preprocessing the raw data. Results from data preprocessing undergo statistical analysis and subsequently mapped to metabolic pathways for placing untargeted metabolomics data in the biological context. ADAP is a suite of computational algorithms that has been developed specifically for preprocessing LC–MS and GC–MS data. It consists of two separate computational workflows that extract compound-relevant information from raw LC–MS and GC–MS data, respectively. Computational steps include construction of extracted ion chromatograms, detection of chromatographic peaks, spectral deconvolution, and alignment. The two workflows have been incorporated into the cross-platform and graphical MZmine 2 framework and ADAP-specific graphical user interfaces have been developed for using ADAP with ease. This chapter summarizes the algorithmic principles underlying key steps in the two workflows and illustrates how to apply ADAP to preprocess LC–MS and GC–MS data.
Keywords: ADAP, MZmine 2, metabolomics, LC-MS, GC-MS, data preprocessing, peak picking, alignment, spectral deconvolution, visualization
1. Introduction
Untargeted metabolomics, detection and relative quantitation of ideally all metabolites in a biological system, has become a powerful discovery tool in many scientific disciplines. It has benefited greatly from advances in mass spectrometry (MS) and chromatography. As a result, liquid chromatography (LC) and gas chromatography (GC) coupled to mass spectrometry (MS) have become primary analytical platforms for untargeted metabolomics.
The informatics pipeline for making sense of the resulting LC–MS and GC–MS data involves preprocessing of the raw mass spectral data to detect chemical species, assignment of specific metabolites to these species, and integration of these metabolites into a coherent and physiologically meaningful integrated multi-omics framework that can yield a holistic understanding of the biological system (Figure 1). As the first step of this informatics pipeline, data preprocessing is critical for the success of a metabolomics study because preprocessing errors can propogate downstream into spurious or missing compound identifications and cause misinterpretation of the metabolome. Data preprocessing workflows (Figure 2) in open-source software tools generally consist of four sequential steps after masses have been detected from profile mass spectra (i.e. converting mass spectra from profile to centroid format). These four steps are construction of extracted ion chromatograms (EIC), detection of chromatographic peaks from EICs, peak grouping for LC-MS data or spectral deconvolution for GC-MS data, and alignment. ADAP (Automated Data Analysis Pipeline) is one such open-source workflow that has been developed for preprocessing both GC–MS and LC–MS data and incorporated into the MZmine 2 framework.1
Figure 1:

Informatics pipeline for making sense of untargeted GC–MS and LC–MS metabolomics data.
Figure 2:

General computational workflows for preprocessing GC–MS and LC–MS data in existing open-source software tools. EIC stands for extracted ion chromatogram.
In sections below, we first briefly describe the evolution of ADAP and subsequently focus on describing how to carry out LC–MS and GC–MS preprocessing workflows using primarily ADAP modules in the MZmine 2 framework. These modules include EIC construction, chromatographic peak detection, spectral deconvolution, and alignment. To facilitate describing how to specify relevant parameters, we provide a brief summary of the algorithmic principles underlying these ADAP modules. To make the workflow complete and this chapter self-contained, we provide information on how to carry out other essential tasks using non-ADAP modules in MZmine 2. These tasks include: (1) import raw LC–MS and GC–MS data files into MZmine 2 and inspect them, (2) detect masses from profile mass spectra (step 1 in Figure 2), (3) group chromatographic peaks (step 4 in Figure 2) detected in LC–MS data, and (4) export preprocessing results for downstream statistical analysis, metabolite identification, and -omics data integration.
2. Evolution of ADAP
Development of ADAP started in 2009. The first version of ADAP was developed by Jiang et. al. for fully automated preprocessing of raw GC–MS untargeted metabolomics data.2 It was comprised of a suite of algorithms for steps 2 to 5 of the preprocessing workflow for GC-MS data (Figure 2). As a critical step in this ADAP-GC workflow, spectral deconvolution has undergone significant improvements over the years made by Ni et al.3,4 for ADAP-GC 3.0 and ADAP-GC 3.0 and Smirnov et al.5 for ADAP-GC 3.2.
The year of 2016 witnessed research and development efforts by Myers et al. to equip ADAP with the capability to preprocess high mass resolution LC–MS untargeted metabolomics data while addressing the high rate of false positive peaks that had been reported.6,7 Toward this end, ADAP algorithms were developed for constructing extracted ion chromatograms (EICs) and for detecting chromatographic peaks from EICs. Following peak detection, alignment methods in MZmine 2 can be used to correct the retention time shift from sample to sample for a complete preprocessing workflow for LC-MS data.
All of the aforementioned ADAP algorithms were written in Java and have been incorporated into the open-source and graphical MZmine 2 framework. Furthermore, specific user-friendly graphical user interfaces (GUI) have been developed to facilitate users with using the ADAP modules within MZmine 2.
3. Install MZmine 2
MZmine 2 can be downloaded at http://mzmine.github.io/download.html. To start MZmine 2, users should unzip the downloaded file and then open MZmine 2 by running the following script files according to the operating system of your computer.
startMZmine_MacOSX.command
startMZmine_Windows.bat
startMZmine_Linux.sh
4. Preprocessing workflow for LC-MS data
4.1. Import and inspection of raw data files
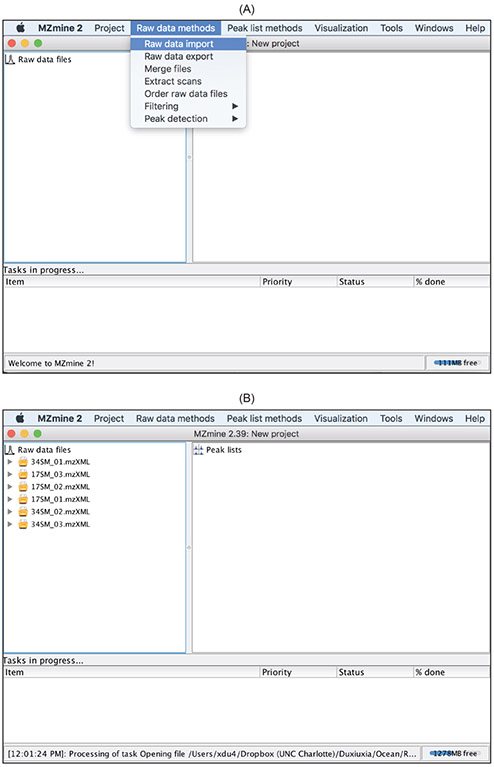
Raw data files are imported into MZmine 2 using the
Raw data methods
drop-down menu as shown in Figure 3. Acceptable file formats include mzXML and netCDF. One of the greatest strengths of MZmine 2 lies in the rich built-in visualization functions that allow users to inspect the raw data, which greatly facilitates users with understanding the data and making informed decisions to specify preprocessing parameters. Herein we demonstrate only the visualization capabilities that can inform data preprocessing. Readers are advised to explore the other visualization capabilities in MZmine 2.
Figure 3:
Raw data importis in the
Raw data methodsdrop-down menu. (B) Imported raw data files are listed under
Raw data fileson the left.
Display of raw mass spectra.
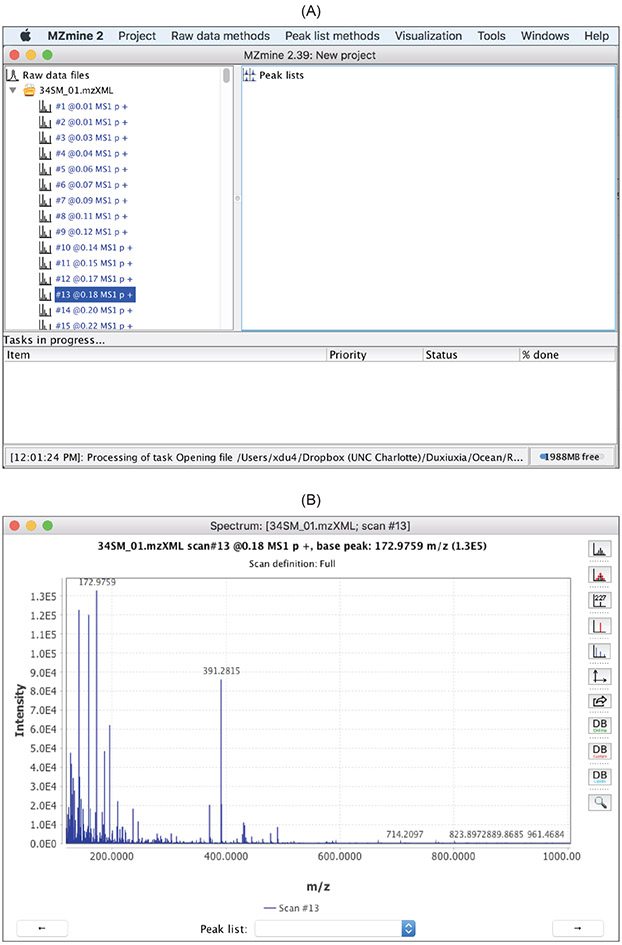
Figure 4 shows the MZmine 2 capabilities to display raw spectra and the spectra meta data that includes spectra level (
MS1
or
MS2
), acquisition time, type (
p
represents profile or
c
represents centroid), and polarity (+ represents positive and − represents negative).
Figure 4:
Capabilities of MZmine 2 that allow users to inspect the raw spectra. (A) List of spectra in a raw data file and the spectra meta data. (B) Double click on any spectrum opens up a separate window displaying it.
Display of chromatograms.
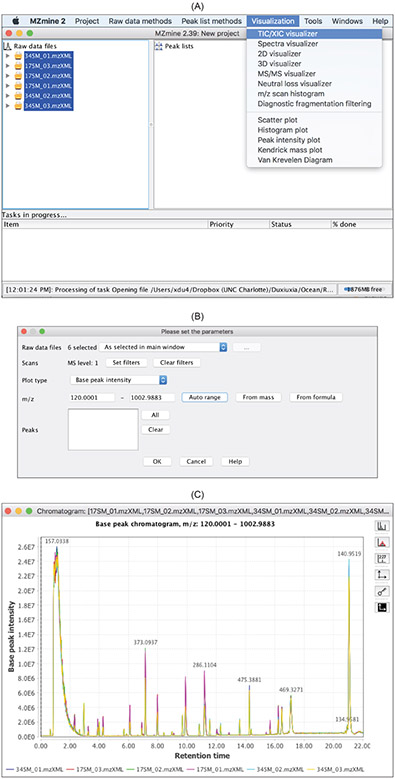
Base peak chromatograms (BPC) and total ion chromatograms (TIC) can reveal retention time shift among the data files and the approximate amount of retention time correction that is needed via alignment. Figure 5 displays the BPCs of 12 data files.
Figure 5:
TIC/XIC visualizerin the
visualizationdrop-down menu. (C) BPCs of 12 data files.
Display of m/z and retention time.
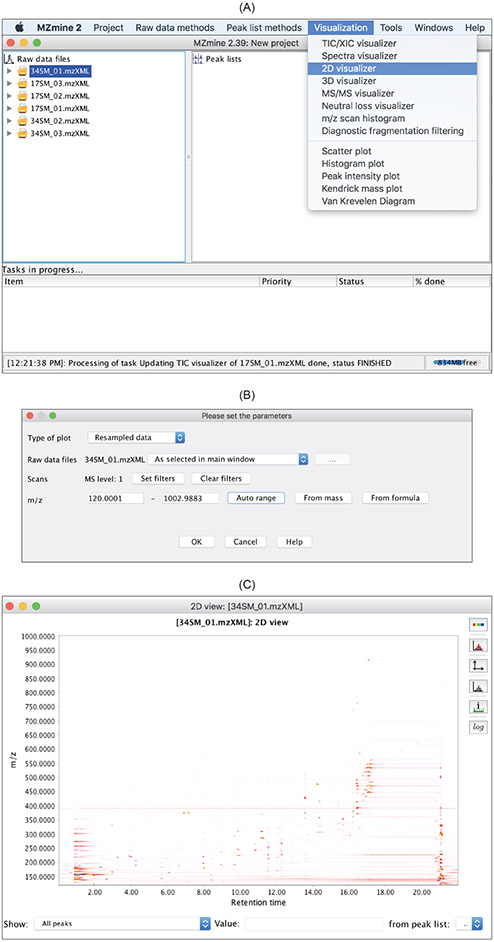
The
2D visualizer
in the
Visualization
drop-down menu can provide an overview of the ion species that should be detected by the peak picking algorithms from the entire data file (Figure 6). Each ion species is characterized by a unique pair of m/z (y-axis) and retention time (x-axis).
Figure 6:
2D visualizercan be accessed via the
Visualizationdrop-down menu. (C) Ion species are displayed via the 2D visualization.
4.2. Detect masses from profile mass spectra
The mass detection step detects mass centroids from profile mass spectra. MZmine 2 provides five centroiding methods that include
Centroid, Exact mass, Local maxima, Recursive threshold
, and
Wavelet transform
. The
Centroid
mass detector is for spectra that have been centroided and the other four detectors are for profile mass spectra only. The
Exact mass
detector is suitable for high-resolution MS data, such as provided by FTMS instruments. The
Local maxima
mass detector simply detects all local maxima within a spectrum, except those signals below the specified noise level. The
Recursive threshold
mass detector is suitable for data that has too much noise for the
Exact mass
detector to be used. The
Wavelet transform
mass detector is suitable for both high-resolution and low-resolution data. It uses the Ricker wavelet (also called Mexican Hat wavelet) and carry out a continuous wavelet transform (CWT) of the continuous profile spectra.
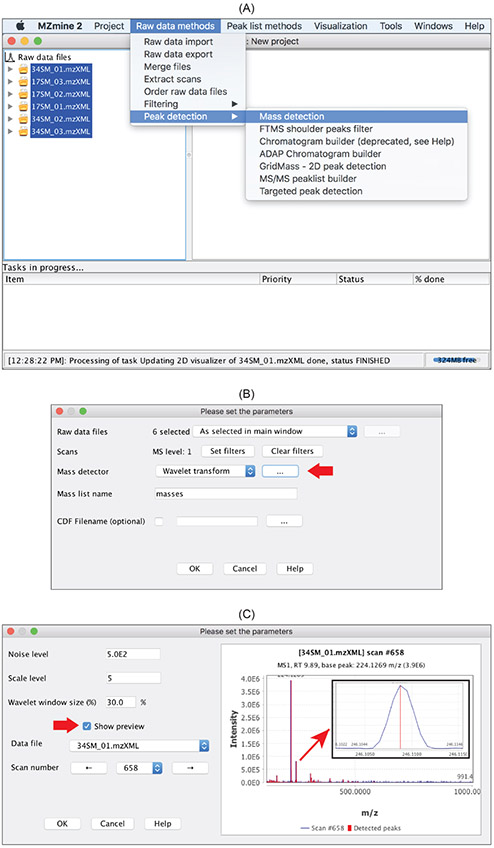
This
Wavelet transform
mass detector provides a sensitive and robust way to detect masses (Figure 7) and we describe it in more detail herein. It requires users to set three parameters: noise level, scale level, and wavelet window size. Noise level specifies the minimum intensity level for a data point to be considered part of a spectrum. All data points below this intensity level are ignored. scale level is the scale factor that either dilates or compresses the wavelet signal. When it is small (e.g. below 10), the Ricker wavelet is more contracted which in turn results in more noisy peaks being detected.
Wavelet window size (%)
is the size of the window used to calculated the wavelet signal. When the size of the window is small, more noisy peaks can be detected. Among the three parameters, Scale level, in particular, can have a large impact on mass detection.
Figure 7:
Raw data methodsdraw-down menu. (B)
Wavelet transformis one of the mass detection methods. Click the button pointed to by the red arrow would open the window in (C) for specifying parameters (C) User-defined parameters for the
wavelet transformmethod. Check
Show previewopens up the preview window. Effect of parameter changes is displayed almost immediately, which greatly facilitates specifying parameters. The inset shows the profile mass peak in blue and the detected mass centroid in red.
When the scale level is small, a significant number of very narrow noise peaks can be detected. They are passed to the subsequent EIC construction and can form false EIC peaks. As the scale level increases, the number of detected noise peaks decreases. However, a larger scale level could cause a noticeable shift in the centroid
m/z
values. Figure 8C-D depict the
m/z
values detected from consecutive scans when scale levels are set at 5 and 15, respectively. Compared to the
m/z
values detected at scale level equal to 5, most of the
m/z
values detected at scale level 15 are larger. When the final representative
m/z
for a chromatographic peak is calculated as the weighted average of all of the centroid
m/z
values along the EIC as shown in Figure 8B, the difference in the final representative
m/z
values between using scale level=5 and scale level=15 is ~19ppm. This difference in the mass values is big enough to cause different compounds to be eventually identified.
Figure 8:
Differences in the resulting mass values caused by different scale levels when using the wavelet transform-based mass detection in MZmine 2. (A) One of the consecutive mass spectra from which the mass indicated by red arrow is to be detected. (B) The EIC of the mass. The mass values of the blue dots along the elution profile are depicted in (C) and (D) with scale level being 5 and 15, respectively.
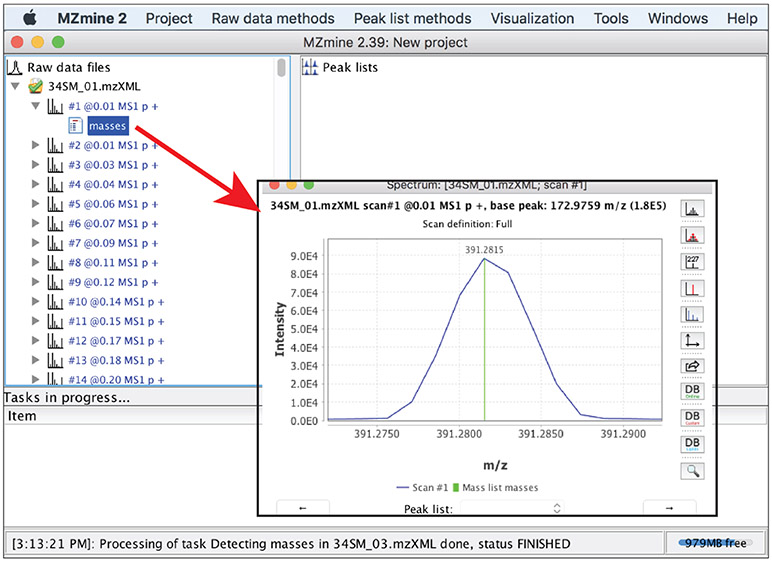
Regardless of which of the mass detectors is used, the results of mass detection for a particular profile mass spectrum can be accessed by clicking
masses
under the profile mass spectrum (Figure 9). It is relevant to note that mass detection can also be carried out by using msConvert that is part of ProteoWizard.8 msConvert detects masses by either using a CWT-based method or calling functions provided by vendors of mass spectrometers. The resulting centroid data can be imported into MZmine 2 for data preprocessing.
Figure 9:
Examine mass detection results for a particular profile mass spectrum. Vertical lines in green indicate mass values that have been detected.
4.3. Construct EICs by ADAP
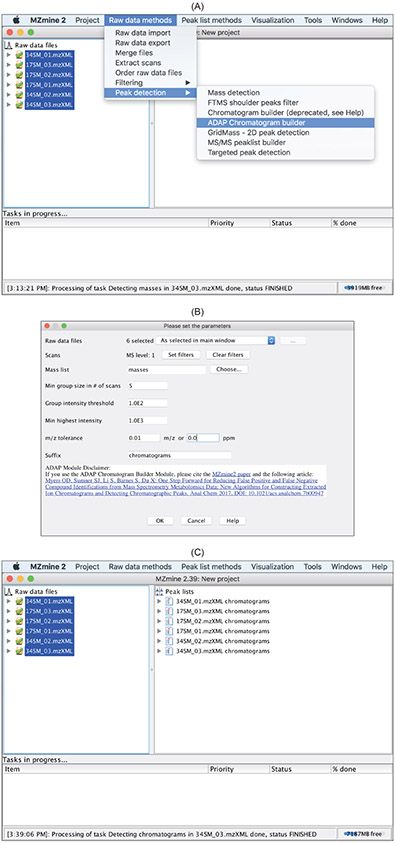
In untargeted metabolomics, the masses of ion species that have been detected by a mass analyzer are unknown prior to data preprocessing. It is up to the step of EIC construction to determine. With mass centroids detected from profile mass spectra, construction of EICs can begin. Figure 10 shows how to carry out this step using ADAP. ADAP examines all of the data points in the entire data file and works from the largest intensity data point down to the smallest. As a result, a list of ions is produced that have been detected by the mass analyzer over a continuous retention time period. This approach in constructing EICs is in contrast to the EIC construction process in other open-source software tools such as XCMS where EICs are built chronologically in retention time. The advantage of starting an EIC from the highest intensity point among all of the data points belonging to this EIC is that the reference mass for the EIC has the highest possible mass measurement accuracy. This is particularly important for TOF-type mass analyzers whose mass measurement accuracy tends to be higher for more intense signals.
Figure 10:
ADAP Chromatogram buildermethod. (B) Parameters relevant to this method. (C) A list of EICs is produced for each data file.
Construction of EICs by ADAP requires that the following four parameters be specified:
Min group size in number of scans. In the entire chromatogram there must be at least this number of sequential scans having points above the Group intensity threshold set by the user.
Group intensity threshold. See above
Min highest intensity. There must be at least one point in the chromatogram that has an intensity greater than or equal to this value.
m/z tolerance. Maximum m/z difference of data points in consecutive scans in order to be connected to the same chromatogram.
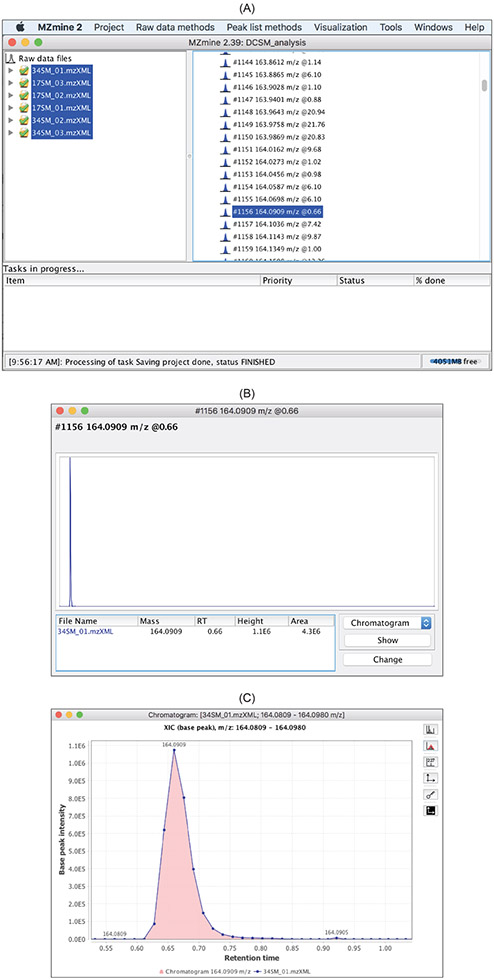
As a result of the EIC construction, a list of EICs is produced for each data file (Figure 10C). Each EIC can be examined by double clicking it and opening up a window as shown in Figure 11.
Figure 11:
Chromatogramand click
Showopens the EIC in (C) for visual examination.
4.4. Detect Chromatographic Peaks by ADAP
After EICs have been constructed, ADAP detects chromatographic peaks from each of these EICs using the continuous wavelet transform (CWT) that is similar to what the
wavelet transform
mass detector uses. Specifically, wavelet coefficients are first calculated as the inner product between the EIC and the Ricker wavelets at different wavelet scales and locations. Subsequently, peak location and boundaries are determined through ridgeline detection and simple local minima search. Finally, peak boundaries are adjusted using a local minima search. This boundary adjustment is necessary because the rough estimates for the left and right boundary based on ridgeline detection are symmetric, i.e. having the same distance from the peak location.
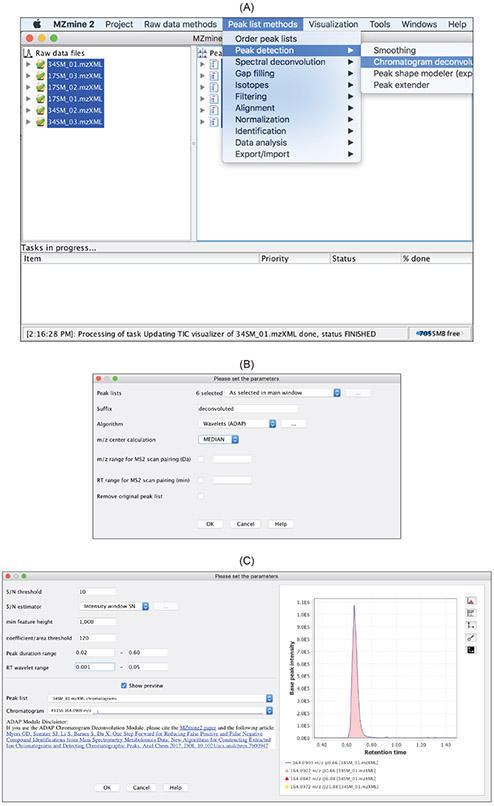
This ADAP peak detection method is accessed via
Chromatogram deconvolution
in the
Peak list methods
drop-down menu (Figure 12A). To choose the parameters appropriately, we strongly recommend that users check the
Show preview
box. The preview function allows a user to see the effect of parameter changes immediately on peak detection for a chosen EIC. Any EIC from any of the data files can be chosen using the
Peak list
and
Chromatogram
drop-down menu (Figure 12B). The following six parameters need to be specified:
Figure 12:
Chromatogram deconvolutionin the
Peak list methodsdrop-down menu. (B) Specification of parameters is facilitated by the
Show previewfunction.
SNR Threshold.
signal-to-noise threshold to filter out noise peaks. For details about how SNR is calculated, we refer readers to the publication by Myers et. al.9Min feature height.
The smallest intensity a peak can have and be considered a real feature.Coefficient/area threshold.
The best coefficient (largest inner product of wavelet with peak in ridgeline) divided by the area under the curve of the feature.Peak duration range.
The acceptable range of peak widths. Peaks with widths outside this range will be rejected.RT wavelet range.
The range of wavelet scales used to build matrix of coefficients. Scales are expressed as RT values (minutes) and correspond to the range of wavelet scales that will be applied to the chromatogram. Choose a range that is similar to the range of peak widths expected to be found from the data.
4.5. Alignment
Alignment intends to identify corresponding peaks across samples. MZmine 2 provides four alignment algorithms:
Join aligner, RANSAC aligner, Hierarchical aligner (GC)
, and
ADAP Aligner
. The first two algorithms,
Join aligner
and
RANSAC aligner
, are for aligning LC-MS data and and the latter two,
Hierarchical aligner (GC)
, and
ADAP Aligner
, are for aligning GC-MS data. Both of the two algorithms for aligning LC-MS data achieve alignment by finding chromatographic peaks that have similar
m/z
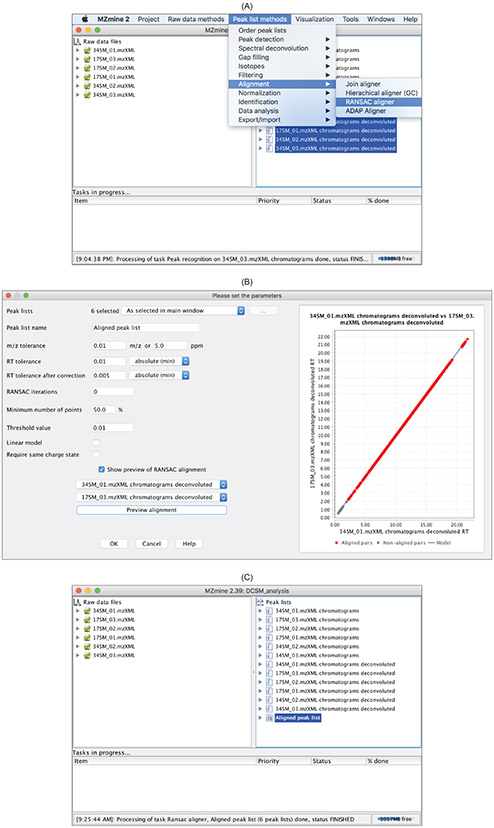
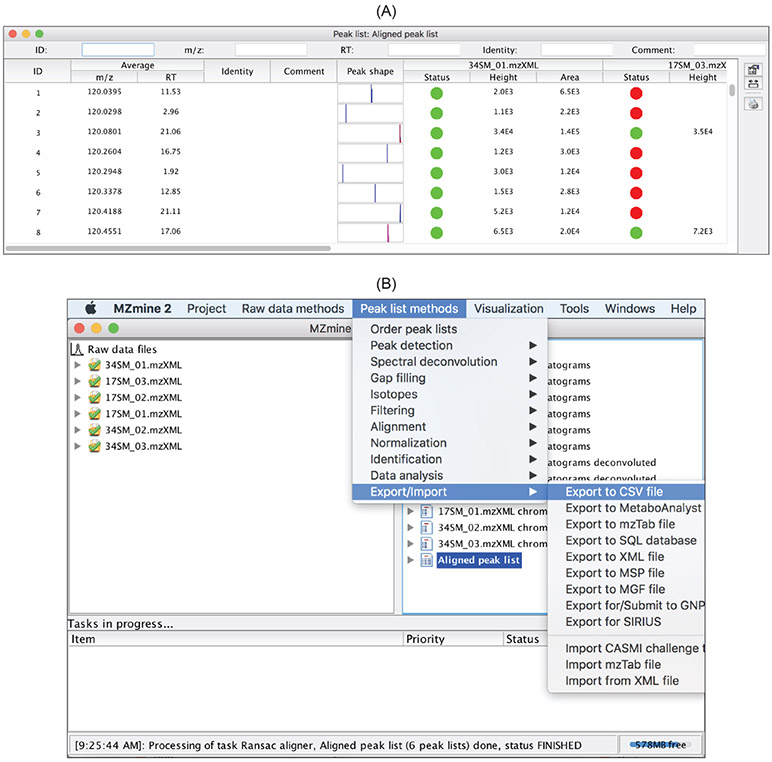
and retention time. Figure 13 shows how to perform alignment using the RANSAC aligner in MZmine 2. Aligned peaks can be examined and exported (Figure 14). The exported peak list can be used for univariate and multivariate statistical analysis for determining the significant metabolites between phenotypes and training a predictive model for predicting phenotypes.
Figure 13:
Peak list methodsdrop-down menu. (B) It is strongly recommended to use the preview function for specifying parameters. (C) After alignment, an
Aligned peak listis produced and can be exported.
Figure 14:
Aligned peak listopens up the list of peaks for visual examination. (B) The aligned peak list can be exported in .csv, MetaboAnalyst, or other format.
5. Preprocessing workflow for GC-MS data
As shown in Figure 2, the preprocessing workflows for both LC-MS and GC-MS data contain the steps of mass detection, EIC construction, and detection of EIC peaks. The corresponding methods and the procedures that have been described above for LC-MS data preprocessing can be used for GC-MS data preprocessing as well. However, the GC-MS workflow contains a step called spectral deconvolution that is unique. This stems from the fact that the commonly used electron ionization used in GC-MS analysis fragments molecular ions into product ions in the ionization source. When compounds are not resolved chromatographically, product ions from different molecular ions co-exist in the same mass spectrum. In order to eventually identify/annotate the compounds that correspond to each molecular ion, spectral deconvolution needs to be performed to produce a pure mass spectrum of product ions and the molecular ion for the compound. Spectral deconvolution is especially necessary for low mass resolution GC-MS data that is still commonly acquired.
In addition to the unique spectral deconvolution in GC-MS preprocessing, the ADAP-GC preprocessing workflow features an alignment algorithm that is compound-based, rather than peak-based. Specifically, the ADAP-GC alignment algorithm look for similar compounds across samples based on spectral similarity and proximity in retention time. This is very different from the RANSAC alignment algorithm and other peak-based algorithms that aligns chromatographic peaks only. If
n
-alkanes was added into the samples and therefore retention index of compounds can be calculated, alignment of compounds should take advantage of the retention index information, but ADAP-GC is currently not equipped with this capability yet.
5.1. Spectral Deconvolution
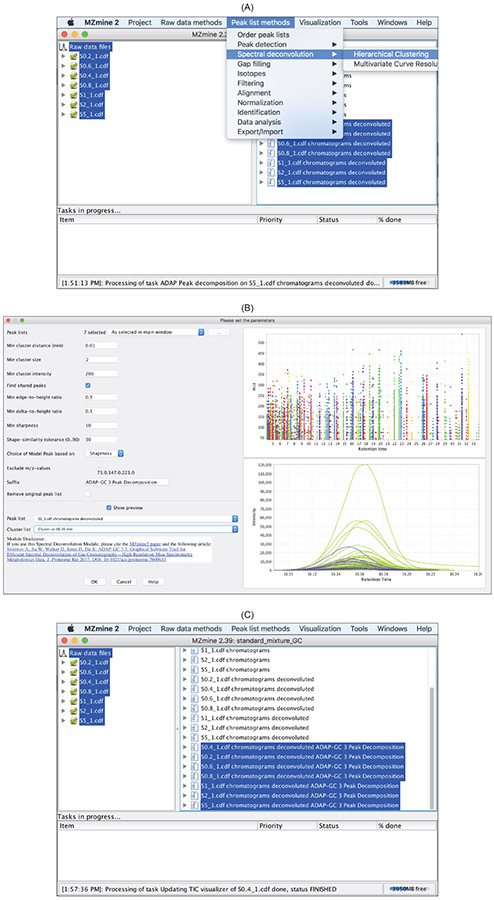
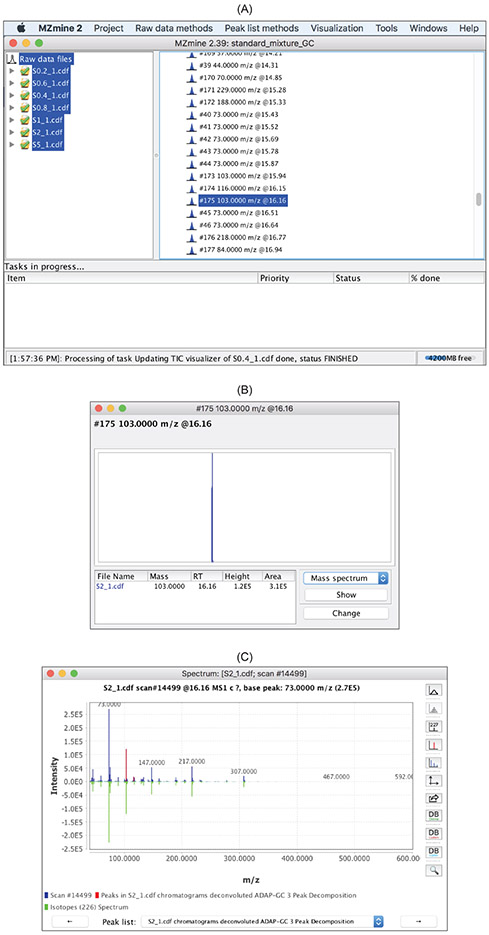
The most recent version of the ADAP-GC spectral deconvolution algorithm is 3.2.5 The algorithm starts with automated determination of deconvolution windows. For each deconvolution window, a sequence of four computational steps are carried out including: (1) two rounds of hierarchical clustering for estimating the number of compounds in the window, (2) selection of the sharpest and unique chromatographic peaks as the model peaks, (3) construction of pure mass spectrum for each compound, and (4) correction of splitting issues. Figure 15 shows how to access ADAP-GC 3.2 in MZmine 2 and lists the user-defined parameters. Similar to ADAP peak detection described earlier, it is strongly recommended that users use the
Show preview
function to make informed decisions about the parameters (Figure 15B). After spectral deconvolution completes, a list of pure mass spectra is produced for each data file (Figure 16).
Figure 15:
Peak list methods → Spectral deconvoluiton → Hierarchical Clustering. (B) User-defined parameters and the preview function that helps with specifying these parameters. (C) After spectral deconvolution, a list of pure mass spectra is produced for each data file.
Figure 16:
Mass spectrumand click
Showto open the window in (C). The constructed pure spectrum is shown in green in the context of the raw spectrum shown in blue.
5.2. Alignment
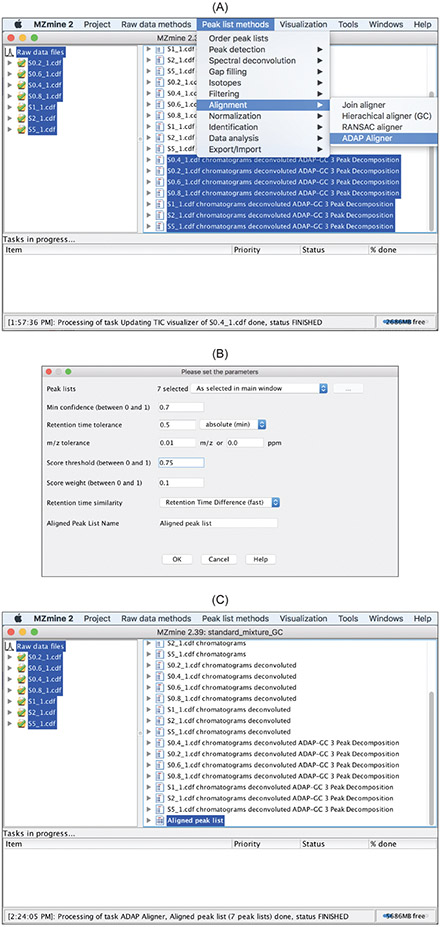
GC-MS samples are aligned by finding the same compounds across the data files based on spectral similarity and retention time proximity. Specifically, a score is calculated as follows to measure the likelihood that two spectra,
c1
and
c2
, correspond to the same compound.
| (1) |
where
Stime
is the retention time proximity between
c1
and
c2
and
Sspec
is the spectrum similarity between
c1
and
c2
.
w
is a weighting factor specifying the relative importance of Stime and Sspec. Sspec is calculated as the normalized dot product between
c1
and
c2
. Figure 17 shows how to use the alignment method. The following parameters need to be specified.
Figure 17:
Alignmentmethod can be accessed in the drop-down menu of
Peak list methods → Alignment → ADAP Aligner. (B) Specify parameters whose meaning can be found in the
Helpfile. (C) The aligner produces the
Aligned peak list.
Min confidence: minimum fraction of samples where aligned components must be present. It takes values between 0.0 and 1.0.
Retention time tolerance: maximum retention time difference between aligned compounds in different samples.
- m/z tolerance: maximum
m/z
difference to consider twom/z
values in two spectra as the same. This is used for determining the quantitation mass for a particular compound. This mass is defined as the most frequent mass across all of the spectra for this compound. - Score threshold: minimum score as calculated in eqn. (1) to consider
c1
andc2
to correspond to the same compound. It takes values between 0.0 and 1.0. The default value is 0.75. - Score weight:
w
in eqn. (1) and takes values between 0.0 and 1.0. The default value is 0.1. - Retention time similarity:
Stime
in eqn. (1) as the difference in retention time.
5.3. Export of GC-MS preprocessing results
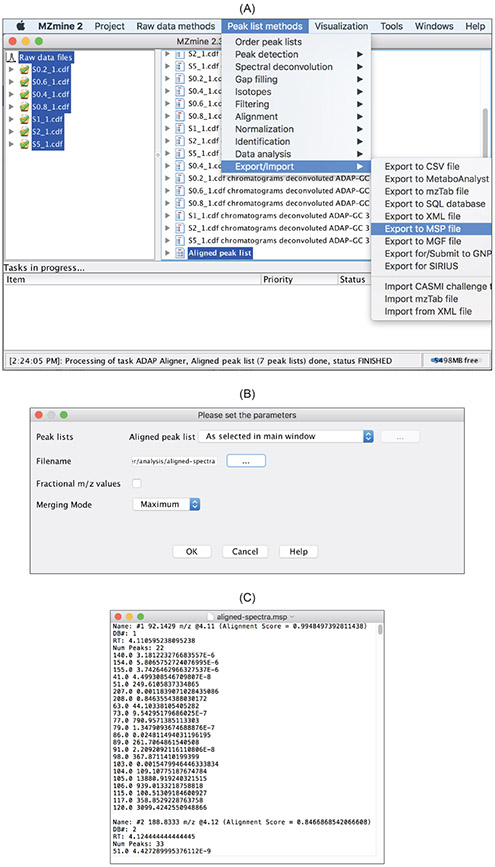
The pure mass spectra that the spectral deconvolution step has constructed can be exported in .msp or .mgf format for matching the spectra against spectral libraries for compound identification or annotation. Figure 18 shows the procedure. The resulting .msp file can be directly imported to the NIST MS Search software tool for compound identification or annotation.
Figure 18:
Aligned peak listand specify the export file name. (B) An example of the exported spectra produced by the spectral deconvolution. (C) Exported GC-MS spectra are stored in an .msp file.
6. Conclusions
ADAP is a suite of computational algorithms and the associated graphical user interface for preprocessing untargeted LC–MS and GC–MS metabolomics data. Incorporation of these algorithms into the prevalent MZmine 2 take advantage of the rich visualization capabilities in MZmine and benefits users of MZmine 2.
Acknowledgement
We thank the USA National Science Foundation award 1262416 and National Institutes of Health/National Cancer Institute grant U01CA235507 for funding the research and development of ADAP.
References
- [1].Pluskal T, Castillo S, Villar-Briones A, and Oresic M. MZmine 2: modular framework for processing, visualizing, and analyzing mass spectrometry-based molecular profile data. BMC Bioinformatics, 11:395, 2010. [DOI] [PMC free article] [PubMed] [Google Scholar]
- [2].Jiang W, Qiu Y, Ni Y, Su M, Jia W, and Du X. An automated data analysis pipeline for GC-TOF-MS metabonomics studies. J Proteome Res, 9(11):5974–81, 2010. [DOI] [PubMed] [Google Scholar]
- [3].Ni Y, Qiu Y, Jiang W, Suttlemyre K, Su M, Zhang W, Jia W, and Du X. ADAP-GC 2.0: deconvolution of coeluting metabolites from GC/TOF-MS data for metabolomics studies. Anal Chem, 84(15):6619–29, 2012. [DOI] [PubMed] [Google Scholar]
- [4].Ni Y, Su M, Qiu Y, Jia W, and Du X. ADAP-GC 3.0: Improved Peak Detection and Deconvolution of Co-eluting Metabolites from GC/TOF-MS Data for Metabolomics Studies. Anal Chem, 88(17):8802–11, 2016. [DOI] [PMC free article] [PubMed] [Google Scholar]
- [5].Smirnov A, Jia W, Walker DI, Jones DP, and Du X. ADAP-GC 3.2: Graphical Software Tool for Efficient Spectral Deconvolution of Gas Chromatography-High-Resolution Mass Spectrometry Metabolomics Data. J Proteome Res, 17(1):470–478, 2018. [DOI] [PubMed] [Google Scholar]
- [6].Coble JB and Fraga CG. Comparative evaluation of preprocessing freeware on chromatography/mass spectrometry data for signature discovery. J Chromatogr A, 1358:155–64, 2014. [DOI] [PubMed] [Google Scholar]
- [7].Rafiei A and Sleno L. Comparison of peak-picking workflows for untargeted liquid chromatography/high-resolution mass spectrometry metabolomics data analysis. Rapid Commun Mass Spectrom, 29(1):119–27, 2015. [DOI] [PubMed] [Google Scholar]
- [8].Chambers MC, Maclean B, Burke R, Amodei D, Ruderman DL, Neumann S, Gatto L, Fischer B, Pratt B, Egertson J, Hoff K, Kessner D, Tasman N, Shulman N, Frewen B, Baker TA, Brusniak MY, Paulse C, Creasy D, Flashner L, Kani K, Moulding C, Seymour SL, Nuwaysir LM, Lefebvre B, Kuhlmann F, Roark J, Rainer P, Detlev S, Hemenway T, Huhmer A, Langridge J, Connolly B, Chadick T, Holly K, Eckels J, Deutsch EW, Moritz RL, Katz JE, Agus DB, MacCoss M, Tabb DL, and Mallick P. A cross-platform toolkit for mass spectrometry and proteomics. Nat Biotechnol, 30(10):918–20, 2012. [DOI] [PMC free article] [PubMed] [Google Scholar]
- [9].Myers OD, Sumner SJ, Li S, Barnes S, and Du X. One Step Forward for Reducing False Positive and False Negative Compound Identifications from Mass Spectrometry Metabolomics Data: New Algorithms for Constructing Extracted Ion Chromatograms and Detecting Chromatographic Peaks. Anal Chem, 89(17):8696–8703, 2017. [DOI] [PubMed] [Google Scholar]


