

Abstract
Key points
Few days of unloading are sufficient to induce a decline of skeletal muscle mass and function; notably, contractile force is lost at a faster rate than muscle mass.
The reasons behind this disproportionate loss of muscle force are still poorly understood.
We provide strong evidence of two mechanisms only hypothesized until now for the rapid muscle force loss in only 10 days of bed rest.
Our results show that an initial neuromuscular junction instability, accompanied by alterations in the innervation status and impairment of single fibre sarcoplasmic reticulum function contribute to the loss of contractile force in front of a preserved myofibrillar function and central activation capacity.
Early onset of neuromuscular junction instability and impairment in calcium dynamics involved in excitation–contraction coupling are proposed as eligible determinants to the greater decline in muscle force than in muscle size during unloading.
Abstract
Unloading induces rapid skeletal muscle atrophy and functional decline. Importantly, force is lost at a much higher rate than muscle mass. We aimed to investigate the early determinants of the disproportionate loss of force compared to that of muscle mass in response to unloading. Ten young participants underwent 10 days of bed rest (BR). At baseline (BR0) and at 10 days (BR10), quadriceps femoris (QF) volume (VOL) and isometric maximum voluntary contraction (MVC) were assessed. At BR0 and BR10 blood samples and biopsies of vastus lateralis (VL) muscle were collected. Neuromuscular junction (NMJ) stability and myofibre innervation status were assessed, together with single fibre mechanical properties and sarcoplasmic reticulum (SR) calcium handling. From BR0 to BR10, QFVOL and MVC decreased by 5.2% (P = 0.003) and 14.3% (P < 0.001), respectively. Initial and partial denervation was detected from increased neural cell adhesion molecule (NCAM)‐positive myofibres at BR10 compared with BR0 (+3.4%, P = 0.016). NMJ instability was further inferred from increased C‐terminal agrin fragment concentration in serum (+19.2% at BR10, P = 0.031). Fast fibre cross‐sectional area (CSA) showed a trend to decrease by 15% (P = 0.055) at BR10, while single fibre maximal tension (force/CSA) was unchanged. However, at BR10 SR Ca2+ release in response to caffeine decreased by 35.1% (P < 0.002) and 30.2% (P < 0.001) in fast and slow fibres, respectively, pointing to an impaired excitation–contraction coupling. These findings support the view that the early onset of NMJ instability and impairment in SR function are eligible mechanisms contributing to the greater decline in muscle force than in muscle size during unloading.
Keywords: Ca2+ dynamics, muscle atrophy, NCAM, neuromuscular junction instability, sarcoplasmic reticulum, single fibre atrophy, single fibre contractile impairment, unloading
Key points
Few days of unloading are sufficient to induce a decline of skeletal muscle mass and function; notably, contractile force is lost at a faster rate than muscle mass.
The reasons behind this disproportionate loss of muscle force are still poorly understood.
We provide strong evidence of two mechanisms only hypothesized until now for the rapid muscle force loss in only 10 days of bed rest.
Our results show that an initial neuromuscular junction instability, accompanied by alterations in the innervation status and impairment of single fibre sarcoplasmic reticulum function contribute to the loss of contractile force in front of a preserved myofibrillar function and central activation capacity.
Early onset of neuromuscular junction instability and impairment in calcium dynamics involved in excitation–contraction coupling are proposed as eligible determinants to the greater decline in muscle force than in muscle size during unloading.
Introduction
Skeletal muscle unloading is accompanied by morphological and functional decline (Berg et al. 1997; Kawakami et al. 2001; Trappe et al. 2004; de Boer et al. 2007a; Campbell et al. 2013). The decrease of muscle mass is very fast: about 2% of quadriceps cross‐sectional area (CSA) is lost in just 2 days of immobilization by knee bracing (Kilroe et al. 2020) or after 3 days of dry immersion (Demangel et al. 2017), and about 5% is lost after 14 days of unilateral lower limb suspension (ULLS) (de Boer et al. 2007a). Importantly, the associated loss of muscle strength is considerably greater than that of muscle size, about 9% after 3 days of dry immersion (Demangel et al. 2017) or 5 days of immobilization (Wall et al. 2014) and 15−27% after 14 or more days of unloading (Berg et al. 1997; Jones et al. 2004; Urso et al. 2006; de Boer et al. 2007a; Glover et al. 2008). In turn, such loss of muscle force is associated with an even greater loss of mechanical power (Ferretti, 1997; Rejc et al. 2015, 2018), which is the most relevant parameter for an effective performance of most daily‐life motor activities. At the single fibre level, the reduction in specific force, Po (resulting from a greater decrement in isometric force, Fo, than CSA), is a major determinant of the loss of peak power, while maximum shortening velocity seems less affected by disuse (Widrick et al. 1998; Trappe et al. 2004; Fitts et al. 2007).
Since short‐term unloading is a common condition experienced by both young and elderly people, when bedridden following either injury (Suetta et al. 2009; Costa et al. 2018; Howard et al. 2020) or surgery (Enninghorst et al. 2013; Krell et al. 2014; Nordströ et al. 2015; Pascal et al. 2020), and by critically ill patients (Puthucheary et al. 2013), the investigation of the possible determinants of the disproportionate reduction in muscle force compared with that of muscle size is of considerable relevance.
However, a clear and exhaustive explanation of why contractile force declines faster than muscle mass is still lacking. Only partial answers have been obtained from the analysis of the myofibrillar force generation process (Larsson et al. 1996; Fitts et al. 2000; Hvid et al. 2011; Campbell et al. 2013; Lamboley et al. 2016) and from the force transmission through the extracellular matrix and tendons (Reeves et al. 2005; de Boer et al. 2007a; Couppé et al. 2012) to bones.
A possible clue has been given by a recent study (Demangel et al. 2017) which showed that dry immersion, an extreme form of disuse, is able to induce in only 3 days a very initial and partial progression of fibre denervation. This finding is in line with previous observations on the impact of 14 days’ bed rest (BR) in a cluster of men and women in their sixth decade, thus prone to age‐related alterations of the neuro‐muscular connection (Arentson‐Lantz et al. 2016). On the basis of these considerations, we sought to investigate further the stability of the neuromuscular junction (NMJ), representing the connection between muscles and nerves, linked to myofibre innervation. Additionally, we aimed to extend the analysis upstream to the central nervous system voluntary capacity of muscle activation and downstream to the intracellular calcium signals, linking the action potential triggered at the NMJ to the myofibrillar motors.
Thus, we designed a short‐term BR experiment of 10 days in order to gain further insights into the early determinants of marked unloading‐related strength loss. Accordingly, we investigated neuromuscular system morphology, integrity and function before, during and at the end of the BR period. We sought to test the hypotheses that, (i) early impairment of the neuromuscular transmission, possibly based on NMJ instability, might develop shortly after unloading exposure, (ii) impaired neuromuscular transmission might be accompanied by alterations of intra‐fibre calcium signalling, and (iii) that such changes might be accompanied by impairments in activation capacity.
Methods
Ethical approval
The present study was conducted in accordance with the standards set by the latest revision of the Declaration of Helsinki, and was approved by the National Ethical Committee of the Slovenian Ministry of Health on 17 July 2019, with reference number 0120–304/2019/9. Participants were informed about all experimental procedures through an interview, information sheet, kinesiological and medical examination and had the possibility to ask questions of the selection committee; after signing the written consent form they were enrolled in the study with the possibility to withdraw at any stage.
Participants
Ninety‐three young males applied to participate in this study. Forty‐six of them were invited to the interviews and 16 passed all inclusion/exclusion criteria and medical examination. In order to reach a statistical power >0.85, the 10 most homogeneous participants were selected, with two additional volunteers as reserves.
Finally, 10 healthy young subjects took part in the study (baseline age: 22.9 ± 4.7 years; body height: 181.2 ± 3.9 cm; body mass: 77.5 ± 10.0 kg; body mass index: 23.6 ± 2.5 kg·m−2). All volunteers passed kinesiological and medical examinations, a physical activity questionnaire (GPAQ), body composition analysis, resting and exercise electrocardiography with blood pressure assessment, medical questionnaires, functional movement assessment and a nutrition interview.
Inclusion and exclusion criteria
Inclusion criteria were: 20–32 years old; 21 < body mass index < 28 kg m−2; moderate to vigorous physical activity <90 min/day; all‐eating diet; normal electrocardiography and blood pressure; functional movement score <18; muscle mass >16%. Exclusion criteria were: international level athletes; regular alcohol consumption; ferromagnetic implants; history of deep vein thrombosis with D‐dimer >500 µg L−1; acute or chronic skeletal, neuromuscular, metabolic and cardiovascular disease conditions; pulmonary embolism. None of the subjects experienced any significant disease and none was taking medications regularly or made use of any medication known to influence physical performance.
Experimental protocol
The present study was conducted in the General Hospital of Izola (Izola, Slovenia). The protocol included 3 days of familiarization with the study environment and diet, pre‐BR data collection (BR0), 10 days of BR and post‐BR (BR10) data collection.
The following parameters were collected at BR0 and BR10: anthropometric features, quadriceps femoris (QF) and vastus lateralis (VL) muscle volume through magnetic resonance imaging (MRI), knee‐extensors maximum voluntary isometric contraction (MVC), time‐to‐63%‐force and activation capacity through the interpolated twitch technique. In addition, ultrasound images of QF and VL CSA, biopsies of the VL muscle and blood samples were collected at BR0, BR5 and BR10.
The timeline of data collection was as follows:
one day before BR, baseline muscle functional tests (MVC, time‐to‐63%‐force and activation capacity) were carried out.
At BR0 (day 1 of BR), (i) ultrasound measurements were obtained after 2 h of the beginning of BR, to allow for fluid shift to be complete and avoid confounding factors when comparing baseline and follow‐up measurements; (ii) muscle biopsies were obtained; (iii) MRI scans were performed.
At BR5, (i) ultrasound images were collected before (ii) performing the biopsy.
At BR10, (i) ultrasound images were collected; (ii) muscle biopsies were obtained; (iii) MRI scans were performed; (iv) after 3 h of participants standing, functional tests were carried out. Blood samples were always collected at 7 a.m. on the day of interest.
Bed rest
The participants were housed in standard air‐conditioned hospital rooms (five participants per room) and were under constant visual surveillance with 24 h medical care, 24 h heart rate and physical activity monitors. During BR, volunteers performed all daily activities in bed with no deviations from the horizontal lying position permitted, and neither exercise nor muscle contraction tests were allowed in the period BR0–BR10. All participants received hospital meals three times a day and followed an individually controlled eucaloric diet during the whole hospital stay. Dietary energy requirement was designed for each subject multiplying resting energy expenditure by factors of 1.2 and 1.4 in the BR and ambulatory periods, respectively (Biolo et al. 2008). The macronutrient food content was set at 60% carbohydrate, 25% fat and 15% protein. The sleeping time was between 22:00 and 07:00.
Measurements
Muscle size measurements: magnetic resonance imaging
All MRI data were acquired on a 3T scanner (Magnetom Skyra, Siemens, Erlangen, Germany). Participants were positioned supine on the MRI patient bed after at least 8 h of BR, that allowed for body fluid shift stabilization. Afterwards, turbo spin‐echo T1‐weighted data sets of both thighs were acquired in the axial (transverse) orientation. Acquisition parameters were as follows. Sequence: vibe, TR/TE: 7.8/3.69 ms, flip angle: 20°, field of view: 450 × 337.5 mm, voxel size: 0.9 × 0.9 × 6 mm, no inter‐slice gap, slice thickness: 6 mm, readout‐bandwidth 320 Hz/pixel (278 kHz). In the corresponding images, contours of the QF and VL were digitized in randomized order using the OsiriX DICOM image analysis software (Version 11; Pixmeo Sarl, RRID:SCR_013618). Within the scan, QF and VL muscle CSA contours were carried out every two axials; VL and QF volumes were derived by summing a series of truncated cones between two axial images (∼20–25 images evaluated per scan).
Muscle size measurements: ultrasound extended‐field‐of‐view
Muscle CSA of the QF was measured in vivo using extended‐field‐of‐view (EFOV) ultrasonography imaging (Mylab70, Esaote, Genoa, Italy). The EFOV technique relies on texture mapping algorithms to merge sequences of images collected during real‐time scanning, which serve to reconstruct large images. Briefly, the ultrasound transducer is moved along the skin surface and along the plane of interest (in our case, the transverse plane). While moving the transducer, successive frames are recored and stitched toghether by the algorithm, in order to obtain a panoramic image (Franchi et al. 2018). The full procedure followed during ultrasound data collection has been described in detail elsewhere (Monti et al. 2020). Briefly, a 47 mm, 7.5 MHz linear array probe was used to obtain images at different muscle length percentages. Different regions of interest were identified at 30%, 50% (CSA50) and 70% of the femur length (measured from greater trochanter to the mid‐patellar point) and marked on the skin. We considered the mid‐patellar point as the beginning of the QF and VL muscles (0%), and the great trochanter as their end (100%). The operator then positioned the probe transversally on the medial portion of the leg, thus starting the acquisition when the medial borders of the vastus medialis had been identified. The acquisition consisted in moving the transducer along the transverse plane and it was stopped after visualizing the lateral borders of the VL. An adjustable guide was used in each acquisition in order to keep the same transverse path. Care was taken in order to keep as constant as possible both pressure during all the image acquisition and acquisition velocity throughout the different testing sessions. Two CSA images per femur length percentage were acquired and used for analysis.
QF and VL only CSAs were measured tracing the muscle contours using ImageJ image analysis software (https://imagej.net, RRID:SCR_003070). Two measurements per parameter were taken on each image, and their average was considered.
QF and VL CSAmean were calculated as the average value of the 30%, 50% and 70% femur length CSAs per each subject and time point.
Knee‐extensor MVC, rate of force development and activation capacity
Peak QF force of the right leg was assessed during an MVC at a 90° knee angle with hip fixed at 90° using a custom‐made knee dynamometer fitted with a load cell (RS 206–0290). Prior to the testing session, participants were familiarized with the ergometer and the movement, being instructed to push as fast and as strongly as they could. A warm‐up consisting of 10 short sub‐maximal contractions was performed before the test began.
Three contractions of 4 s duration, interspaced by 60 s rest, were recorded. Loud verbal encouragement was provided throughout the MVC testing procedure. The load‐cell output was fed into an acquisition system (BIOPAC MP100, Biopac INC, Santa Barbara, USA), sampled at 2 kHz and analyzed using Ackqnowledge software (RRID:SCR_014279). The contraction with the highest force value was considered as the real MVC. Knee extensor MVC was then normalized to QF CSApeak to obtain MVC per cross‐sectional area (N m/cm2).
Explosiveness of the movement was measured as the time required to reach the 63% of the MVC for each contraction; this value was chosen as it represents the classical definition of time constant.
Activation capacity was assessed using the interpolated twitch technique, as previously described (Quinlan et al. 2018). Briefly, during the MVC procedures, participants received electrical stimulation delivered through a stimulator device (Digitimer DS7AH, Digitimer Ltd, Welwyn Garden, Hertfordshire, UK) via two pads placed proximally and distally to the thigh.
The stimulation consisted of three supra‐maximal single pulses: two of them were supplied when a plateau was reached during contraction, with a 2 s interval between them, while the third was applied at rest, 1 s post‐contraction. The electrical current required for each individual's supra‐maximal stimulation was assessed before testing. The supra‐maximal current was acquired by monitoring force output during a succession of stimuli with increasing current. At the point when no additional force was observed for a further increase in current, the current was recorded and utilized during the assessment. Muscle activation was subsequently calculated using the following equation (Allen et al. 1995):
| (1) |
where A is the superimposed twitch torque and B is the resting control twitch torque.
Blood sampling
Blood samples were taken from each participant's medial cubital vein at 07:00 on BR0, BR5 and BR10.
Right after being collected, samples were centrifuged (CENTRIC 400, Tehtnica Železniki) at 2480 g for 10 min in order to separate serum and plasma.
After this procedure, 500 µl aliquots of both serum and plasma were prepared; samples were cooled and consequently stored in liquid nitrogen at −80° until analysis.
Serum C‐terminal agrin factor (CAF) detection
Serum levels of CAF were determined using a commercially available enzyme‐linked immunosorbent assay (ELISA) kit (Human Agrin SimpleStep ELISA, Ab216945, Abcam, Cambridge, United Kingdom) following the manufacturer's instructions. All samples were assessed in duplicate. Sera were four times diluted using the appropriate diluent purchased with the kit. The obtained CAF concentrations were read through a microplate ELISA reader (Tecan, Infinite M200). In order to assess CAF serum concentrations, a standard curve (loaded with known and increasing CAF concentrations) was prepared and read at 450 nm. Serum CAF concentrations were interpolated from the CAF standard curve and corrected for sample dilution.
Biopsy procedures
In order to analyse skeletal muscle adaptations to BR, muscle samples (about 150 mg) were obtained by percutaneous biopsy from the mid‐right VL of all participants at BR0 and BR10, and from the mid‐left VL at BR5.
Biopsy sampling was done after anaesthesia of the skin, subcutaneous fat tissue, and muscle fascia with 2 ml of lidocaine (2%). A small incision was then made to penetrate skin and fascia, and the tissue sample was collected with a Weil–Blakesley conchotome (Gebrüder Zepf Medizintechnik GmbH & Co. KG, Dürbheim, Germany).
After the biopsy, muscle samples were divided into three parts. The first was used for dissection of single muscle fibres for determination of CSA, force (Fo) specific tension (Po), caffeine‐responsiveness and force‐pCa curve. The second part of the biopsy was frozen in isopentane, cooled down on liquid nitrogen and stored at −80°C for subsequent immunohistochemical analysis, and the third part was frozen in liquid nitrogen and stored at −80°C for protein and mRNA analysis. After the procedure, no complications were registered.
Immunohistochemistry for NCAM (neural cell adhesion molecule) detection
Frozen samples were cut with a semiautomatic cryostat (MC 4000 microtome cryostat, Histo‐Line Laboratories) producing 8 µm thick sections.
Detection and quantification of denervated myofibres were performed by NCAM immunolabelling as described. Serial cryosections (8 µm thick) were fixed in cold methanol for 10 min at 20°C, and after washes in PBS, blocked in 10% FBS/PBS and labelled for 1 h (RT) using rabbit polyclonal antibody directed against NCAM (Chemicon, Millipore, cat. n. AB5032, Milan, Italy, RRID:AB_2291692) or against laminin (Sigma‐Aldrich, cat. N. L9393, MO, USA, RRID:AB_477163), 1:200 and 1:100 diluted in 2% goat serum in PBS, respectively. Sections were then rinsed 3 × 5 min in PBS, blocked for 10 min in 10% goat serum in PBS and then incubated for 1 h (RT) with goat anti‐rabbit IgG Alexa Fluor 594 red fluorescent dye (Thermo Fisher Scientific, A‐11012, MA USA, RRID:AB_2534079) 1:500 diluted in PBS. Negative controls were performed by omitting the primary antibodies from sample incubations. After washes, sections were coverslipped using ProLong Diamond Antifade Mountant with DAPI dye (Thermo Fisher Scientific, D1306, MA USA, RRID:AB_2629482) and observed under a Zeiss microscope connected to a Leica DC 300F camera. NCAM‐positive fibres were counted on captured images, using Image software (https://imagej.net, RRID:SCR_003070) and expressed as the number of positive myofibres per total number of myofibres detected in the biopsy area by laminin staining (approximately 400 muscle fibres). On the same sections, using laminin staining to define fibre sarcolemma, CSA of approximately 200 fibres per participant at each time point was measured. Images were processed with Fiji free software (RRID:SCR_002285) (Schindelin et al. 2012) and the CSA was determined by measuring the polygon area drawn within each fibre.
Single muscle fibre experiments
For single fibre experiments on calcium uptake and release with caffeine, the following solutions (mM composition) were prepared:
Skinning solution: K propionate 170, Mg propionate 2.5, K2EGTA 5, imidazole 10, Na2ATP 2.5, free Mg2+ 0.38.
Relaxing solution: K propionate 172, Mg propionate 2.4, K2EGTA, imidazole 10, Na2ATP 5, NaN3 1, free Mg2+ 0.09.
Activating solution: K propionate 172, Mg propionate 3, Ca EGTA 5, imidazole 10, Na2ATP 5, NaN3 1 with 25 mM PCr and 300 U/ml CPK, free Mg2+ 0.14 mM, free Ca2+ 0.013 (pCa = 4.88).
Loading solution: K propionate 172, Mg propionate 2.4, K2EGTA 2.68, imidazole 10, Na2ATP 5, Ca EGTA 1.6, NaN3 1, free Mg2+ 0.16, free Ca2+ 0.16 (pCa = 6.7).
Washing solution: K propionate 177, Mg propionate 2.4, K2EGTA 0.1, imidazole 10, Na2ATP 5, NaN3 1, free Mg2+ 0.09. Caffeine at various concentrations was added to the washing solution.
Two different caffeine concentrations were selected: (1) a concentration of 4 mM was chosen to induce a submaximal Ca2+ release. Our preliminary experiments, in accordance with published data (Salviati & Volpe, 1988; Mitsumoto et al. 1990; Lamb et al. 2001; Rossi et al. 2014; Barone et al. 2017), show that not all fibres respond at 4 mM and, when they do respond, the Ca2+ release is smaller than that obtained with a concentration able to induce a maximal response (20 mM, see below). Thus, the stimulation with 4 mM allowed an estimation of the responsiveness of the fibre; (2) a concentration of 20 mM was chosen to induce maximal release (Salviati & Volpe, 1988; Fryer & Stephenson, 1996; Lamb et al. 2001; Lamboley et al. 2015). Our previous experiments (Rossi et al. 2014; Barone et al. 2017) showed that a maximal Ca2+ release, as measured by the area below the curve of tension development divided by the amplitude of the maximal isometric contraction (Endo, 1977; Endo & Iino, 1988; Rossi et al. 2014; Lamboley et al. 2016), was reached with 20 mM caffeine and that higher concentrations were not able to significantly increase the response. Maximal release is generally assumed to completely empty the sarcoplasmic reticulum (SR) (Endo, 1977). However, our preliminary experiments showed that, without reloading, a subsequent exposition to 20 mM is still able to induce a small, but not negligible, response (approximately 25% of the former). For this reason, two subsequent releases induced by 20 mM caffeine, the second without reloading, were adopted to achieve a complete depletion and estimate the maximum SR content. In addition, a further release in response to 20 mM after 5 min reloading was recorded at the end of each fibre test to check the reproducibility and the stability of the response. A typical experiment is shown in Fig. 1 A.
Figure 1. Exemplificative protocol for single fibre mechanical testing.
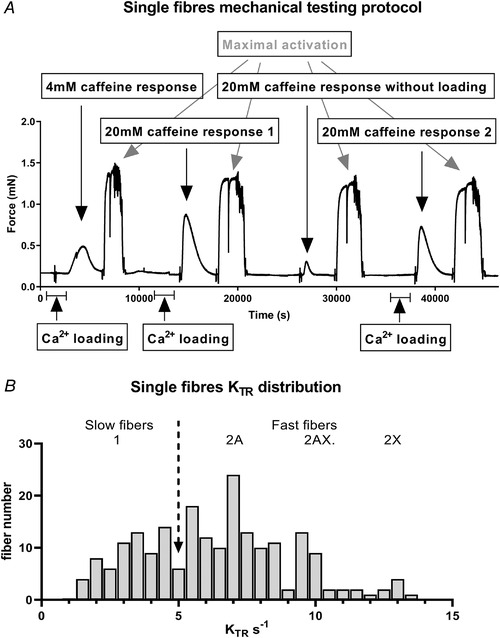
A, typical recording of force responses during sarcoplasmic reticulum Ca2+ loading, calcium release induced with caffeine at 4 mM or 20 mM concentration as indicated and maximal activation. During each maximal activation a Brenner's manoeuvre (fast shortening and relengthening) was carried out and is detectable as a vertical segment. The duration of the calcium loading phases (5 min, indicated with a horizontal segment) has been compressed to emphasize the active responses to caffeine and the maximal calcium activations. B, distribution histogram of KTR in type 1, 2A, 2AX and 2X fibres. The arrow indicates the separation value between slow fibres (KTR < 5) and fast fibres (KTR > 5), as determined with Brenner's manoeuvre.
For force‐pCa curve determination, the following solutions were prepared (mM composition):
Full activation: imidazole 25, K propionate 11.8, Ca EGTA 10, Mg acetate 6.39, Na2ATP 5.65, CrP 20, GSH 10, with 20 mM PCr and 300 U/ml CPK pCa = 4.33, free Mg2+ 0.08.
Relaxing: imidazole 25, K propionate 11.8, EGTA 10, Mg acetate 6.89, Na2ATP 5.65, GSH 10, with 25 mM Na2PCr and 300 U/ml CPK pCa = 4.33, free Mg2+ 0.08.
Protease inhibitors (E64 10 µM and leupeptin 40 µM) were added to all solutions. The pH of all solutions was adjusted to 7.0 at the temperature at which solutions were used (20°C).
Solutions with progressively increasing free calcium concentration were made by mixing the full activation solution with the relaxing solution in various proportions. A series of eight different solutions were used: pCa 9.0 (relaxing solution, 100% EGTA), pCa 6.7, 6.42, 6.39, 6.31, 6.25, 6.16, 5.92 and pCa 4.3 (maximal activating solution, 100% Ca‐EGTA). The values of pCa and free Mg2+ were calculated using the Maxchelator program (Bers et al. 2010) with the affinity constants according to the National Institute Standard Technology. The apparent affinity constant of Ca2+ to EGTA at pH 7.00 was assumed to be 0.4 µM.
Protocol and analysis of single fibre experiments
Muscle fibre bundles, pinned straight on small sylgard platforms, were kept at −20°C in skinning solution mixed with 50% glycerol. On the experiment day, bundles were transferred to a small petri dish and washed with ice‐cold skinning solution containing ATP. Single fibres were manually dissected under a stereomicroscope (10−60x magnification). Fibre segments of 1−2 mm length were cut, and light aluminium clips were applied at both ends. The segments were then transferred to the experimental setup, which was placed on the stage of an inverted Zeiss Axiovert 25 microscope (Zeiss, Milano, Italia) and were mounted between the force transducer (AME‐801 SensorOne, Sausalito, CA) and the electromagnetic puller (SI, Heidelberg, Germany) equipped with a displacement transducer. The segments were mounted in relaxing solution at slack length and then stretched by ∼20% to reach a sarcomere length close to 2.8 µm, i.e. at the upper edge of the plateau of the tension–length relationship (Walker & Schrodt, 1974; Ottenheijm et al. 2009). Sarcomere length and three diameters on the horizontal plane equally spaced along the segment were measured on the images collected at high (320x) magnification with a digital camera (Optikam B5, Optika, Bergamo, Italy). On those images, CSA was calculated from the average of the three diameters assuming a circular shape without corrections for fibre swelling.
Once mounted in the setup each fibre underwent a protocol (shown in Fig. 1 A) including caffeine‐induced calcium releases and maximal activations. Maximal activations were achieved by immersing the fibre in activating solution at pCa 4.8. When tension development had reached the maximum, a shortening–relengthening manoeuvre, also known as Brenner's manoeuvre (Brenner & Eisenberg, 1986), was carried out. The drop of tension to zero at the start of the manoeuvre allowed the measurement of isometric force (Fo), the interpolation of the tension redevelopment phase allowed the determination of a rate constant KTR of tension redevelopment and its reciprocal, the time constant 1/KTR, which is approximately the time to develop 63% of the maximal tension (see below).
Caffeine‐induced calcium release was intended to test the function of the SR. The loading of the SR was obtained by immersing the fibre segment for 5 min in the specific loading solution (Salviati et al. 1982). Each fibre was exposed in sequence to (1) 4 mM caffeine after a full loading of the SR to assess the responsiveness at submaximal stimulation, (2) to 20 mM after a full loading of the SR to induce a maximal release, (3) to 20 mM without reloading to obtain a complete depletion of the SR and finally again to (4) 20 mM after a full loading of the SR to induce a maximal release, to check the stability of the fibre and the reproducibility of the previous response to 20 mM. Fibres were discarded if they had lost more than 10% between the first and the second response to 20 mM or more than 10% between the first and the last maximal direct activation. About 4% of the fibres were discarded because of such exclusion criteria.
The outputs of the force and displacement transducers after A/D conversion (interface CED 1401 plus, Cambridge, UK) were stored in a personal computer and analysed with the software Spike 2 (CED, Cambridge, UK, RRID:SCR_000903).
To provide an efficient analysis of more than 200 muscle fibres, each with the 4 steps as described above, and to avoid potential operator‐dependent bias, we used a home‐made program of analysis running in Matlab (RRID:SCR_001622), working as follows.
The input data were obtained from the Spike traces sampled at 1 kHz for the force and the displacements, synchronized in time; the synchronization is needed to easily extrapolate the exact time of the Brenner manoeuvre, since the position trace is much more stable than the force trace (see Fig. 1 A). The beginning of each Brenner manoeuvre was associated with the time ti s (shortening) and its end to the time ti l (lengthening) where the index i indicates the ith manoeuvre. The average tension between ti s and ti l was assumed as the basal tension (TB i). The maximum tension generated at the ith activation was obtained as the difference between the average tension in the interval of time from 1000 ms to 500 ms before ti s and TB i.
The maximum tension redeveloped Trdv after the Brenner manoeuvre was determined iteratively, computing the averages of tension in time windows of 200 ms starting from ti l, as long as its value increased. The kinetics of redevelopment are characterized by the time needed to recover 63% of ∆Trdv = Trdv‐TB i, starting from ti l. This is assumed to be the time constant 1/KTR which is the reciprocal of the rate constant KTR of tension redevelopment.
Starting from the localization of its maximum, the tension–time curve during caffeine activation was analysed between the starting and ending points where the first derivative of the average tension was zero within a given error. The response to caffeine was measured as the area below the curve (see Endo, 1977; Uttenweiler et al. 1998) divided by the amplitude of the maximal isometric contraction (pCa 4.7). Thus, the unit was time (s). The absence of response in some 4 mM caffeine activations limits the automatic analysis, therefore a manual check of all caffeine responses was performed by a trained operator. Finally, in order to identify fibre type (whether the fibres were attributable to type 1 or type 2 phenotypes) the rate constant tension redevelopment KTR during Brenner's manoeuvre was exploited: fibres were considered slow or type 1 fibres if they had KTR values lower than 5 s−1, while they were considered fast or type 2 fibres when their KTR values were higher than 5 s−1. Such seemingly arbitrary division was performed based on the distribution histogram reported in Fig. 1 B, after checking a number of fibres with MyHC isoform electrophoretic separation, following the protocol described in the appropriate section.
On a separate set of fibres, the response of myofibrils to various concentrations of free calcium was analysed by exposing permeabilized single fibres to a sequence of solutions with progressively higher free Ca2+ concentrations. Force responses were calculated as the difference between that reached in submaximal or maximal activating solutions to that present when immersed in relaxing solution. Force measured in each submaximal activating solution was normalized to that generated during a maximal activation.
Using nonlinear curve fitting (GraphPad Prism 8.0, GraphPad Software Inc., CA, USA, RRID:SCR_002798), the data were interpolated with the sigmoidal equation with variable slope:
| (2) |
This allowed the numerical identification of the following parameters: the activation threshold (the concentration of free Ca2+ needed to elicit 10% of maximal force, pCa10), the Ca2+ sensitivity (the concentration of free Ca2+ needed to elicit 50% of maximal force, pCa50), the Hill coefficient (indication of the slope of the force‐pCa curve, nH).
Immunoblotting analysis
A tiny amount of biopsy was solubilised in Laemmli solution (62.5 mM Tris‐HCl pH 6.8, 2.3% SDS, 10% glycerol) (Laemmli, 1970), treated with one cycle of thermal shock at 65οC for 3 min and then stored at −20οC to allow the complete resuspension of proteins and breaking of membranes. Protein concentration was determined by the Folin–Lowry method, using BSA as standard (Lowry et al. 1951). For loading onto SDS‐PAGE, 40 µg of proteins were mixed with Laemmli solution at 5% β‐mercaptoethanol, boiled for 3 min and separated on home‐made acrylamide mini‐gel with Mini‐PROTEAN Tetra Handcast System (Bio‐Rad), realized at 4% acrylamide for stacking and 12% acrylamide for separating. Afterwards, proteins were transferred to a nitrocellulose paper on a Mini Trans‐Blot System (Bio‐Rad) at 100 V constant for 1 h in cold transfer buffer containing 25 mM Tris, glycine 192 mM and 20% methanol. Membranes were blocked with 5% BSA fraction V (A7906, Sigma Aldrich) or 5% milk (nonfat dried milk powder, A0830, 0500 PanReac AppliChem) in TBSt pH 7.6 (Tris 0.02 M, NaCl 0.137 M and 0.1% Tween‐20) at orbital shaking. Then, membranes were incubated for 1 h at room temperature with primary antibodies in 5% BSA TBSt at specific dilution (see Table 1). Subsequently, after a brief washing from the primary antibody, the membrane was incubated with HRP‐conjugated secondary antibody in 5% BSA TBSt or 5% milk TBSt for 1 h, as appropriate. Prior to detection, membranes were washed again and the protein signal was visualized by the enhanced chemiluminescence (ECL Blotting Reagents, GE Healthcare, RPN2109) method using a digital imaging system and analysed (C‐DiGit Blot Scanner, LI‐COR; Image Studio Lite Software analysis system, RRID:SCR_013715). Signal normalization was performed on actin bands obtained from Red Ponceau staining on the membrane, prior to any process for detection of the specific protein.
Table 1.
Specifics and dilution of the antibodies used in western blot experiments
| Antibody | Code | Saturation | Primary Ab dilution | Secondary Ab dilution |
|---|---|---|---|---|
| CSQ | MA3‐913 | 5% Milk | 1:1000 | Mouse 1:10,000 |
| SERCA1 | MA3‐912 | 5% Milk | 1:4000 | Mouse 1:10,000 |
| SERCA2 | MA3‐910 | 5% BSA | 1:10,000 | Mouse 1:10,000 |
| TOM20 | sc‐11415 | 5% BSA | 1:1000 | Rabbit 1:10,000 |
| NCAM | AB5032 | 10% FBS | 1:200 | Rabbit 1:500 |
| Laminin | L9393 | 10% FBS | 1:100 | Rabbit 1:500 |
The primary antibodies used for immunoblotting were: calsequestrin (monoclonal, mouse; Thermo Fisher Scientific, MA3‐913, RRID:AB_325496), SERCA1 ATPase (monoclonal, mouse; Thermo Fisher Scientific, MA3‐912, RRID:AB_2061281), SERCA2 ATPase (monoclonal, mouse; Thermo Fisher Scientific, MA3‐910, RRID:AB_2227681), TOM20 (polyclonal, rabbit: Santa Cruz Biotechnology, sc‐11415, RRID:AB_2207533). The secondary antibodies used were anti‐mouse and anti‐rabbit (goat anti‐mouse abcam, ab205719, RRID:AB_2755049, and goat anti‐rabbit abcam, ab205718, RRID:AB_2819160). The molecular weight of protein bands was detected with ECL DualVue Western Markers (Sigma‐Aldrich, GERPN810) at appropriate dilution, co‐incubated with secondary antibody.
Analysis of MyHC isoforms
For the extraction, resuspension and determination of protein concentration, see the immunoblotting section. Proteins from each sample (∼8 µg) were separated on 8% SDS‐PAGE with home‐made mini‐gels (Mini‐PROTEAN Tetra Handcast System, Bio‐Rad) and electrophoresis was run in a cold room for 1 h at 50 V constant and then for ∼40 h at 60 V constant. Afterwards, the gel was stained with the Colloidal Coomassie Blue Staining method, modified from previous protocols (Neuhoff et al. 1988; Kang et al. 2002). Protein bands (MyHC‐1, MyHC‐2A and MyHC‐2X) were quantified by densitometric analysis to assess the relative proportion in each subject.
RNA purification, quality check and RNAseq library construction
Biopsy fragments for RNA extraction were snap‐frozen in liquid nitrogen and stored at −80°C.
Total RNA was purified using Trizol reagent. Briefly, frozen biopsies were homogenized in Trizol reagent using metal beads by means of TissueLyserII (QIAGEN) and RNA extraction was performed following the manufacturer's indications. RNA was finally resuspended in RNAse‐free water and, prior to RNAseq library preparation, tested for quality through Agilent Bioanalyzer.
RNA sequencing libraries were prepared from the Sequencing Core Facility at the Department of Biology, CRIBI, University of Padova, using Quant Seq 3’ mRNAseq Library Prep Kit for Illumina (Lexogen), allowing only the recovery of polyadenylated transcripts. After quality checks, libraries were sequenced in NextSeq 5500 (Illumina) platform producing 75 bp single‐end reads. A target of 15 million reads per sample was used.
RNAseq data processing and analysis
Reads pre‐processing was performed by using fastp v0.20.0 (Chen et al. 2018), applying specific parameters in order to remove residual adapter sequences and to keep only high quality data (Filters: qualified_quality_phred = 20, unqualified_percent_limit = 30, average_qual = 25, low_complexity_filter = True, complexity_threshold = 30). The percentage of uniquely mapped reads resulted high, with a mean value of 88.5% (minimum = 88.02% and maximum = 89.13%).
After passing the above‐described quality control, passing filter reads were mapped to the human genome reference (version GRCh38) using STAR v2.7.0 (Dobin et al. 2013) with standard parameters (except for the sjdbOverhang option which was set on read length). Genome and transcript annotation provided as input were downloaded from v99 of the Ensembl repository.
Alignments were then elaborated by RSEM v1.3.3 (Li & Dewey, 2011), to estimate transcript and gene abundances.
Subsequently, the sample‐specific gene‐level abundances were merged into a single raw expression matrix applying a dedicated RSEM command (rsem‐generate‐data‐matrix). Genes with at least 10 counts in 50% of samples were then selected. Differential expression (pairwise comparisons) was computed by edgeR (McCarthy et al. 2012) from raw counts in each comparison, following authors' instructions. Multiple testing controlling procedure was applied and genes with a P value ≤0.05 were considered differentially expressed. No threshold was applied on log2 (fold change).
Statistical analysis
In order to obtain a statistical power >0.85, power analysis a priori was performed. The power analysis was based on two previously published studies analysing NCAM‐positive fibre percentage variations in response to unloading in humans (Arentson‐Lantz et al. 2016; Demangel et al. 2017). The results of the power analysis indicated that, in order to reach a power of 0.87, it was necessary to recruit nine participants. Thus, 10 participants were finally selected in order to obtain a power of 0.9.
Each dataset normality was assessed with the following tests: Q‐Q plot, skewness and kurtosis calculation and Shapiro–Wilk's normality tests. All the considered variables passed normality test excluding MyHC isoform percentages in gel electrophoresis, fibre CSA measured by laminin staining and the majority of the single fibre parameters: CSA, Po and caffeine response. When the normality test was not passed a correction using the natural logarithm (Ln) or square functions were applied and normality was tested again. All the parameters passed normality tests after transformation except for the MyHC percentage and laminin‐stained fibre CSA values. Thus, these parameters were not transformed, and non‐parametric statistics were used (Wilcoxon's test, BR0 vs BR10).
For all the other variables, parametric statistics were applied in order to investigate whether differences among BR0, BR5 and BR10 were present within the considered parameters. Specifically: (1) for the in vivo variables obtained only at BR0 and BR10 (right QF and VL volume, in vivo muscle function, western blotting (WB) results) Student's paired t test was used; (2) for the parameters collected at BR0, BR5 and BR10 (QF and VL CSA via ultrasound, CAF, NCAM‐positive fibres), one‐way RM‐ANOVA was performed; (3) for the single fibre results (CSA, Po, KTR, caffeine response, EC10%, EC50%, nH) the mixed linear model was applied with participants classified as a random factor, whereas time (BR0 and BR10) and fibre type (1 and 2) were classified as fixed factors. The mixed linear model calculates weighted average ± SEM (no SD calculation is possible); thus, single fibre data are reported as means ± SEM in the figures and means ± confidence intervals (CI) in the tables. For both RM‐ANOVA and the mixed linear model, if significant main effects were found, post hoc analysis with Tukey's test and the Bonferroni correction, respectively, was performed.
If the assumption of sphericity measured by Mauchly's sphericity test or variance homogeneity was violated, the Greenhouse–Geisser correction was used.
All statistical decisions were made at P ≤ 0.05.
GraphPad Prism software (version 8.0; GraphPad software Inc. San Diego, CA, RRID:SCR_002798) was used to perform statistical and post hoc analysis concerning t tests and ANOVA; SPSS (version 26, IBM, Inc. Chicago, IL, USA, RRID:SCR_019096) was used in order to perform statistical and post hoc analysis concerning the mixed linear model.
Results
In vivo muscle size and contractile function
Lower‐limb skeletal muscles responded with a marked loss of mass to the 10 days of BR, as shown in Fig. 2.
Figure 2. Knee‐extensor volume and cross‐sectional area adaptations to 10‐day bed‐rest.
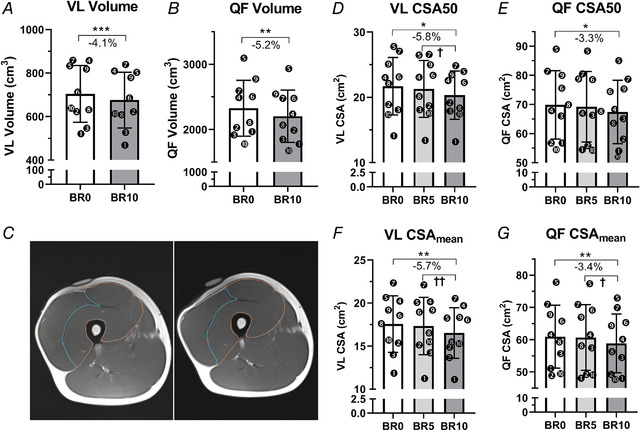
Vastus lateralis (VL) and quadriceps femoris (QF) volume at baseline (BR0) and after 10 days of bed rest (BR10) measured by magnetic resonance imaging (MRI) (A and B, respectively). Representative MRI scans of QF and VL cross‐sectional area (CSA) at BR0 (left) and BR10 (right) acquired at 50% of the femur length (C). A cod‐liver oil tablet was taped upon the thigh in order to better identify the region of interest corresponding to 50% of the femur length. VL and QF CSA measured at 50% of the femur length (D–E) and CSAmean averaged from the CSAs taken at the 30%, 50% and 70% of the femur length (F–G) at BR0, after 5 days of bed rest (BR5) and at BR10 measured by ultrasound. Results shown as means ± SD, individual data represented as scatter plots. * P < 0.05 BR10 vs BR0, ** P < 0.01 BR10 vs BR0, *** P < 0.001 BR10 vs BR0, † P < 0.05 BR10 vs BR5, †† P < 0.01 BR10 vs BR5.
Indeed, right VL volume decreased by 4.1 ± 2.6% (P = 0.0003), while QF muscle volume decreased by 5.2 ± 3.8% (P = 0.003) from BR0 to BR10 (Fig. 2 A and B, respectively). Muscle mass decreases were more pronounced in the second half of the BR, between BR5 and BR10, as observed by the VL and QF CSA calculation from ultrasound images: VL CSAmean decreased by 5.7 ± 3.8% from BR0 to BR10 (P = 0.006), with about the 4.4 ± 2.6% (P = 0.004) of loss between BR5 and BR10 (Fig. 2 F); similarly, QF CSAmean decreased by 3.4 ± 2.5% from BR0 to BR10 (P = 0.007) among which 2.8 ± 2.3% (P = 0.015) was lost between BR5 and BR10 (Fig. 2 G). A very similar time‐course was observed for VL and QF CSA50 (Fig. 2 D and E, respectively).
The loss of muscle mass was accompanied by an even more pronounced contractile impairment, detectable comparing knee‐extensors’ functional parameters obtained at BR0 and BR10 (Fig. 3). Knee‐extensor MVC decreased by 14.3 ± 7.2% (P = 0.0003, Fig. 3 A), accompanied by a decreased explosiveness of the movement expressed by an increased time to reach the 63% of peak force (+22.5 ± 25.1%, P = 0.023, Fig. 3 B). Conversely, activation capacity, measured through the interpolated twitch technique, did not show any significant impairment at BR10 compared with BR0 (P = 0.279, Fig. 3 C).
Figure 3. Knee‐extensor contractile function adaptations to 10‐day bed rest.
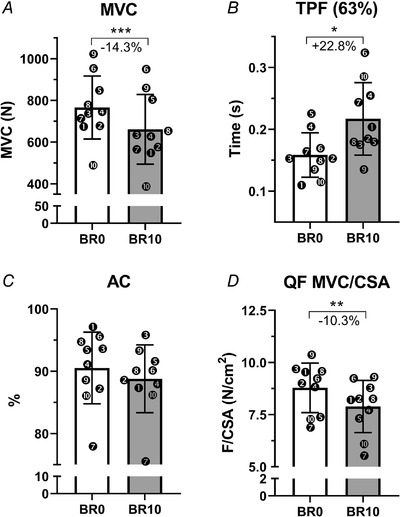
Knee‐extensor isometric maximum voluntary contraction (MVC) (A), time to reach 63% of the MVC (TPF) (63%) (B), activation capacity (%) (AC) (C) at BR0 and BR10. Knee‐extensor maximum voluntary force normalized for quadriceps cross‐sectional area (QF MVC/CSA) (D) at BR0 and BR10. Results shown as means ± SD, individual data represented as scatter plots. * P < 0.05 BR10 vs BR0, ** P < 0.01 BR10 vs BR0, *** P < 0.001 BR10 vs BR0.
As a direct consequence of the greater MVC loss when compared with QF volume and CSA decrements, force normalized for the QF CSApeak was 10.3 ± 6.7% lower at BR10 than at BR0 (P = 0.001, Fig. 3 D).
Neuromuscular junction instability and alterations in the innervation pattern
In order to assess the possible contribution of altered neuromuscular transmission to the loss of force, we evaluated the expression of NCAM, a protein which is physiologically accumulated in the proximity of the NMJ in the adult myofibres and transiently re‐expressed along the sarcolemma and in the sarcoplasm when innervation is lost (Covault & Sanes, 1985). We examined muscle biopsies at BR0, BR5 and BR10 for localization of NCAM: immunofluorescent analyses identified some positive synaptic endplates at BR0 (Fig. 4, arrowed in panel B), and NCAM‐positive fibres at BR5 and BR10 with different staining patterns (Fig. 4 C–G). At BR5 both clusters of interstitial NCAM‐positive cells and myofibres with incomplete sarcolemmal ring staining and negative sarcoplasm were observed (arrowed in panel C, and indicated by dots in panel D, respectively). At BR10, NCAM‐positive fibres showed a diffuse and intense cytoplasmic staining with a complete sarcolemmal ring (Fig. 4 F–G, fibres with dots), and were detected either as single scattered fibres or in clusters. The fibres with signs of NCAM redistribution increased from BR0 to BR10 (BR0: 0.13 ± 0.18 % vs BR10: 3.40 ± 2.80 %; P = 0.016). At BR5, only three subjects presented NCAM‐positive fibres; the total average percentage was 0.71 ± 1.11%, not different from BR0 (P = 0.344).
Figure 4. Biomarkers of neuromuscular junctions remodelling in response to 10‐day bed rest.
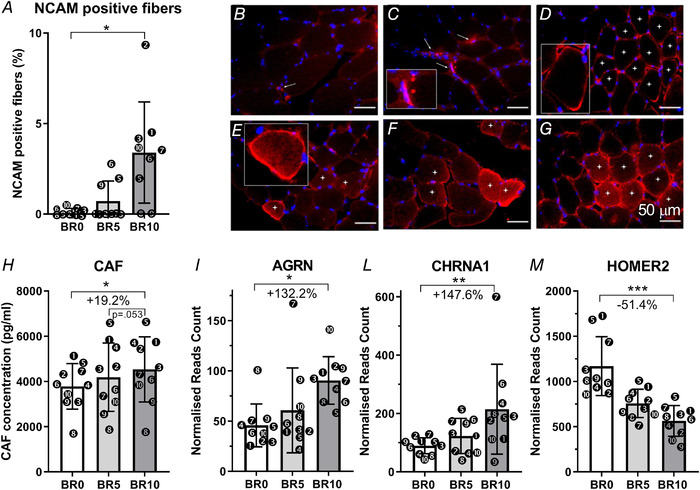
Neural cell adhesion molecule (NCAM)‐positive fibres expressed as a percentage of the total numbers of fibres (A). NCAM‐positive staining at baseline (BR0) (B), 5 days of bed rest (BR5) (C, D) and 10 days of bed rest (BR10) (E–G). Serum C‐terminal agrin fragment (CAF) levels measured at BR0, BR5 and BR10 (H). AGRN gene expression (encoding for agrin) (I); CHRNA1 gene expression (encoding for acetylcholine receptor α1 subunit) (L) and HOMER2 gene expression (encoding for homer2 protein) (M). All RNA transcripts are reported as normalized read count at BR0, BR5 and BR10. Results shown as means ± SD, individual data represented as scatter plots. * P < 0.05 BR10 vs BR0.
The observation of fibres with signs of denervation prompted us to assess the serum concentration of the CAF. CAF is secreted into the blood circulation (VanSaun & Werle, 2000; Hettwer et al. 2013; Drey et al. 2013) upon neurotrypsin cleavage of agrin at the synaptic cleft (Stephan et al. 2008; Bolliger et al. 2010), with a consequent destabilization of the NMJ through degeneration of its endplate (Drey et al. 2013). CAF serum concentrations were measured at BR0, BR5 and BR10 (Fig. 4 B) and found to increase by 10.6 ± 25.4% (P = 0.434) at BR5 and by 19.2 ± 19.9% from BR0 to BR10 (BR0: 3782.7 ± 1005.6 pg/ml vs BR10: 4535.1 ± 1442.0 pg/ml; P = 0.031). Agrin gene expression, evaluated in muscle homogenates by RNAseq, revealed a twofold increase of the AGRN gene transcript (Fig. 4 I and Table 2; adjusted P = 0.017), pointing to a possible compensative effect for the higher protein cleavage at the NMJ.
Table 2.
RNA gene expression: RNA levels measured in muscle homogenates by RNA sequencing
| BR5 | BR10 | ||||||
|---|---|---|---|---|---|---|---|
| Ensembl | Symbol | FC | P value | P adjusted | FC | P value | P adjusted |
| ENSG00000196218 | RYR1 | 1.611 | 0.041 | 0.208 | 2.015 | 0.004 | 0.021 |
| ENSG00000143318 | CASQ1 | 1.292 | 0.210 | 0.481 | 1.155 | 0.483 | 0.630 |
| ENSG00000118729 | CASQ2 | 0.303 | 0.000 | <0.001 | 0.162 | 0.000 | <0.001 |
| ENSG00000196296 | ATP2A1 | 1.733 | 0.021 | 0.145 | 1.764 | 0.019 | 0.062 |
| ENSG00000174437 | ATP2A2 | 0.988 | 0.951 | 0.983 | 0.684 | 0.067 | 0.154 |
| ENSG00000264424 | MYH4 | 2.152 | 0.027 | 0.166 | 3.324 | 0.001 | 0.006 |
| ENSG00000109061 | MYH1 | 1.911 | 0.011 | 0.104 | 2.719 | 0.000 | 0.003 |
| ENSG00000125414 | MYH2 | 1.334 | 0.219 | 0.490 | 1.095 | 0.698 | 0.802 |
| ENSG00000092054 | MYH7 | 0.915 | 0.709 | 0.867 | 0.563 | 0.026 | 0.077 |
| ENSG00000078814 | MYH7B | 0.799 | 0.309 | 0.586 | 0.412 | 0.001 | 0.005 |
| ENSG00000133020 | MYH8 | 2.718 | 0.006 | 0.074 | 4.021 | 0.0003 | 0.003 |
| ENSG00000109063 | MYH3 | 0.629 | 0.083 | 0.298 | 0.748 | 0.253 | 0.403 |
| ENSG00000138435 | CHRNA1 | 1.451 | 0.109 | 0.342 | 2.268 | 0.001 | 0.009 |
| ENSG00000169684 | CHRNA5 | 1.018 | 0.944 | 0.978 | 1.107 | 0.694 | 0.798 |
| ENSG00000175344 | CHRNA7 | 0.566 | 0.005 | 0.061 | 0.802 | 0.226 | 0.372 |
| ENSG00000170175 | CHRNB1 | 1.006 | 0.970 | 0.990 | 0.889 | 0.476 | 0.624 |
| ENSG00000135902 | CHRND | 1.220 | 0.327 | 0.602 | 1.384 | 0.122 | 0.239 |
| ENSG00000188157 | AGRN | 1.359 | 0.162 | 0.420 | 1.997 | 0.003 | 0.017 |
| ENSG00000109819 | PPARGC1A | 0.567 | 0.023 | 0.155 | 0.416 | 0.001 | 0.009 |
| ENSG00000152413 | HOMER1 | 1.314 | 0.132 | 0.379 | 1.235 | 0.246 | 0.394 |
| ENSG00000103942 | HOMER2 | 0.726 | 0.016 | 0.126 | 0.470 | 0.000 | <0.001 |
| ENSG00000051128 | HOMER3 | 1.075 | 0.423 | 0.682 | 1.025 | 0.783 | 0.861 |
Values expressed as fold‐changes (FC) from BR0 to BR10.
Such increase in CAF serum concentration and NCAM‐positive fibres, suggesting an augmented instability of the NMJ and a possible early‐stage alteration of the innervation pattern, induced us to further investigate whether other proteins, involved in innervation and NMJ structure and function maintenance, might be differentially regulated from BR0 to BR10. Interestingly, the CHRNA1 gene, encoding for the α1 subunit of the acetylcholine receptor, was found to be upregulated (+148%, Fig. 4 L and Table 2, adjusted P = 0.009), possibly indicating a re‐activation of its expression in the extra‐junctional myonuclei where it is inhibited under normal‐activity conditions (Buffelli et al. 2018). In contrast, the HOMER2 transcript, encoding for Homer2 proteins which control the expression of synaptic genes (Salanova et al. 2011), was downregulated at BR10 if compared with BR0 (−51.4%, Fig. 4 M and Table 2, adjusted P = 0.0001).
Further, the expression of the gene PPARGC1A coding for PCG‐1α, which when phosphorylated by neuregulins is an important activator of NMJ stabilizing gene expression (Handschin et al. 2007), was downregulated at BR10 (Table 2, adjusted P = 0.009).
Single fibre contractile properties
Next, we investigated how individual VL muscle fibres responded to BR‐induced unloading and inactivity.
To this end, we measured force responses in a total of 220 skinned muscle fibres isolated from randomly selected subjects (uneven numbers from S1 to S9), with successful data for 105 fibres at BR0 and 107 muscle fibres at BR10. The results are reported in Figs 5 and 6, Tables 3, 4 and 5.
Figure 5. Vastus lateralis single muscle fibre size and contractile performance changes in response to 10‐day bed rest.
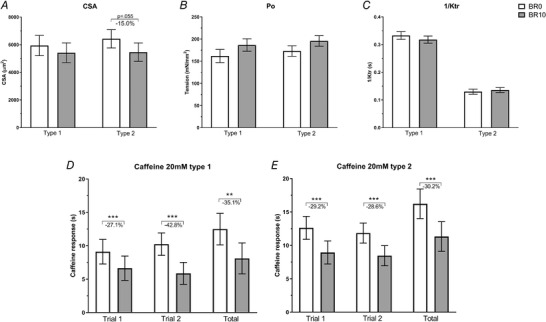
Single fibre cross‐sectional area (CSA) (A), tension (Po) (B) and kinetics of tension redevelopment during maximal activation (1/KTR) (C). Results shown as means ± SEM at baseline (BR0) (n = 105) and after 10 days of bed rest (BR10) (n = 107). Single fibre response to 20 mM caffeine exposure (D, E) in two different repeated cycles (trial 1 and trial 2) and total tension developed (total) calculated as the average of trial 1 and trial 2 with the addition of the response developed after the no‐loading cycle (see Methods). Results shown as means ± SEM at BR0 (n = 100) versus BR10 (n = 103) for type 1 (D) and type 2 (E) fibres. ** P < 0.01 BR10 vs BR0, *** P < 0.001 BR10 vs BR0.
Figure 6. Vastus lateralis single muscle fibre force‐pCa curves changes in response to 10‐day bed rest.
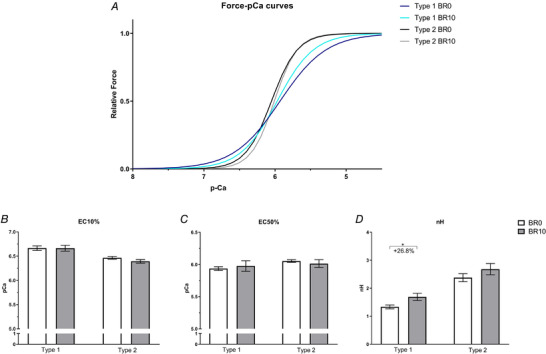
Force‐pCa curves of type 1 (blue–light blue) and type 2 (black–grey) fibres at BR0 and BR10 (A), obtained according to equation 2 with the parameters showed in panels B, C and D. Calcium concentration (pCa) required to elicit the10% (EC10%) (B) and the 50% (EC50%) (C) of the maximum tension in type 1 and type 2 fibres at BR0 (n = 15) and BR10 (n = 13). Hill coefficient (nH) of type 1 and type 2 fibres at BR0 (n = 15) and BR10 (n = 13) (D). Results shown as means ± SEM. * P < 0.05 BR10 vs BR0.
Table 3.
Single fibre cross‐sectional area (CSA), tension (Po) and kinetics of tension redevelopment during maximal activation (1/KTR): single fibres CSA, Po and 1/ KTR of type 1 and type 2 single fibres at BR0 (n = 105) and BR10 (n = 107)
| Fibre type | BR0 | BR10 | PTime | PType | PTime × Type | |
|---|---|---|---|---|---|---|
| CSA (μm2) | Type 1 | 5942 [4235, 7649] | 5417 [3720, 7115] | |||
| Type 2 | 6426 [4728, 8123] | 5460 [3764, 7156] | ||||
| Sqrt(CSA) | Type 1 | 67.7 [55.4, 79.9] | 62.8 [50.6, 75.0] | 0.037 | 0.453 | 0.926 |
| Type 2 | 69.7 [57.5, 81.9] | 64.4* [52.2, 76.6] | ||||
| Po (mN/μm2) | Type 1 | 161.8 [130.7, 192.8] | 186.6 [156.7, 216.6] | |||
| Type 2 | 172.9 [145.6, 200.2] | 195.9 [168.5, 223.4] | ||||
| Ln(Po) | Type 1 | 4.68 [4.41, 4.95] | 4.73 [4.47, 4.98] | 0.164 | 0.200 | 0.392 |
| Type 2 | 4.72 [4.49, 4.94] | 4.92 [4.69, 5.15] | ||||
| 1/KTR (s) | Type 1 | 0.333 [0.306, 0.360] | 0.318 [0.293, 0.343] | 0.687 | <0.001 | 0.344 |
| Type 2 | 0.130### [0.111, 0.148] | 0.136### [0.118, 0.154] |
Results shown as means with [95% confidence intervals (CI)].
Transformations to correct normal distribution were applied: natural logarithm in Po and square in CSA, while no transformation was required for 1/KTR, as the data were already normally distributed. Therefore, both original means with 95% CI and transformed values are reported. All statistical decisions using mixed linear modelling were done on normally distributed variables.
different between BR10 and BR0 at P = 0.055.
different between fibre types at P < 0.001.
Table 4.
Single fibre response to 20 mM caffeine: tension developed in response to caffeine‐induced calcium release by type 1 and type 2 fibres at BR0 (n = 100) and BR10 (n = 103)
| Fibre type | BR0 | BR10 | PTime | PType | PTime × Type | |
|---|---|---|---|---|---|---|
| Caff20mM_1 (s) | Type 1 | 9.11 [4.61, 13.6] | 6.64 [2.14, 11.1] | |||
| Type 2 | 12.63 [8.09, 17.2] | 8.94 [4.40, 13.5] | ||||
| Ln(Caff20mM_1) | Type 1 | 2.25 [1.76, 2.74] | 1.86*** [1.37, 2.35] | <0.001 | 0.005 | 0.444 |
| Type 2 | 2.54### [2.04, 3.03] | 2.02*** [1.52, 2.51] | ||||
| Caff20mM_NL (s) | Type 1 | 3.28 [1.67, 4.88] | 1.61 [0.024, 3.20] | |||
| Type 2 | 3.71 [2.14, 5.29] | 2.44 [0.859, 4.01] | ||||
| Ln(Caff20mM_NL) | Type 1 | 1.33 [0.880, 1.77] | .89** [0.448, 1.34] | <0.001 | 0.181 | 0.446 |
| Type 2 | 1.37 [0.923, 1.82] | 1.06** [0.612, 1.51] | ||||
| Caff20mM_2 (s) | Type 1 | 10.24 [6.36, 14.1] | 5.86 [2.00, 9.71] | |||
| Type 2 | 11.85 [8.01, 15.7] | 8.46 [4.62, 12.3] | ||||
| Ln(Caff20mM_2) | Type 1 | 2.35 [1.89, 2.82] | 1.78*** [1.32, 2.24] | <0.001 | 0.092 | 0.673 |
| Type 2 | 2.46 [2.00, 2.93] | 1.96*** [1.49, 2.43] | ||||
| Total (s) | Type 1 | 12.49 [6.70, 18.3] | 8.11 [2.31, 13.9] | |||
| Type 2 | 16.23 [10.4, 22.1] | 11.33 [5.48, 17.2] | ||||
| Ln(Total) | Type 1 | 9.11 [4.61, 13.6] | 6.64** [2.14, 11.1] | <0.001 | 0.013 | 0.908 |
| Type 2 | 12.63## [8.09, 17.2] | 8.94*** , # [4.40, 13.5] |
Results shown as means with [95% confidence intervals (CI)].
Natural logarithm transformation was applied for all variables to achieve normal distribution.
Therefore, both original means with 95% CI and transformed values are reported. All statistical decisions using mixed linear modelling were done on normally (transformed) distributed variables.
different between BR10 and BR0 at P < 0.050
different between BR10 and BR0 at P < 0.010
different between BR10 and BR0 at P < 0.001
different between fibre types at P < 0.050
different between fibre types at P < 0.010
different between fibre types at P 0<.001
Two different cycles of 20 mM caffeine exposure after 5 min of Ca2+ loading were performed (Caff20mM_1 and Caff20mM_2); in addition, one cycle of caffeine 20 mM exposure without Ca2+ loading (Caff20mM_NL) was run. The last two rows report the ‘Total’ tension developed in response to 20 mM caffeine exposure, calculated as the average response of the two repeated cycles with Ca2+ loading with the addition of the tension developed in response of the ‘no‐loading’ cycle.
Table 5.
Single fibre response to 4 mM caffeine: single fibre response to 4 mM caffeine at BR0 (n = 100) and BR10 (n = 105)
| Caffein4mM_3bcategories | |||||||
|---|---|---|---|---|---|---|---|
| 1 | 2 | 3 | Total | ||||
| Type1 | Time | BR0 | Count | 8 | 12 | 10 | 30 |
| % fibres in subcategory | 26.7% | 40.0% | 33.3% | 100.0% | |||
| Adjusted residual | −0.8 | −0.1 | 1.0 | ||||
| BR10 | Count | 13 | 15 | 8 | 36 | ||
| % fibres in subcategory | 36.1% | 41.7% | 22.2% | 100.0% | |||
| Adjusted residual | 0.8 | 0.1 | −1.0 | ||||
| Total° | Count | 21 | 27 | 18 | 66 | ||
| % fibres in subcategory | 31.8% | 40.9% | 27.3% | 100.0% | |||
| Type2 | Time | BR0 | Count | 21 | 9 | 40 | 70 |
| % fibres in subcategory | 30.0% | 12.9% | 57.1% | 100.0% | |||
| Adjusted residual | −1.9 | −1.0 | 2.6 | ||||
| BR10 | Count | 31 | 13 | 24 | 68 | ||
| % fibres in subcategory | 45.6% | 19.1% | 35.3% | 100.0% | |||
| Adjusted residual | 1.9 | 1.0 | −2.6 | ||||
| Total° | Count | 52 | 22 | 64 | 138 | ||
| % fibres in subcategory | 37.7% | 15.9% | 46.4% | 100.0% | |||
| Total° | Time | BR0 | Count | 29 | 21 | 50 | 100 |
| % fibres in subcategory | 29.0% | 21.0% | 50.0% | 100.0% | |||
| Adjusted residual | −2.0 | −1.0 | 2.8 | ||||
| BR10 | Count | 44 | 28 | 32 | 104 | ||
| % fibres in subcategory | 42.3% | 26.9% | 30.8% | 100.0% | |||
| Adjusted residual | 2.0 | 1.0 | −2.8 | ||||
| Total° | Count | 73 | 49 | 82 | 204 | ||
| % fibres in subcategory | 35.8% | 24.0% | 40.2% | 100.0% | |||
°: Total = Type 1 + Type 2 fibres
Time: BR0, BR10.
Response to 4 mM caffeine exposure: subcategories 1 (response = 0); 2 (0 > response > 50% of maximum force); 3 (response > 50% of maximum force).
Time (BR0, BR10) * Caffeine 4 mM (0, from 0 to 5, >5) * Fibre type (Type 1, 2) cross tabulation.
Single fibre CSA showed a trend to 15% reduction in type 2 fibres only (P = 0.055, Fig. 5 A and Table 3), accompanied by a similar reduction in maximal isometric force generation (Fo). Consequently, specific tension (Po = Fo/CSA), developed during maximal calcium‐activated contraction, did not change (Fig. 5 B and Table 3).
The kinetics of tension redevelopment during maximal activation, 1/KTR (Brenner & Eisenberg, 1986), differed between slow and fast fibres (P < 0.001) before and after BR but did not differ between BR0 and BR10 (Fig. 5 C and Table 3).
Signs of fibre atrophy were also detectable when fibre CSA was measured on cross‐sections stained for laminin. Average fibre CSA was found to be 4301.1 ± 869.4 µm2 at BR0 and 3937.2 ± 1042.5 µm2 at BR10 (−7.3%, P = 0.23).
In physiological conditions in vivo, however, the level of activation of the myofibrillar motors depends on the amount of Ca2+ released from the SR, and there is existing evidence that denervation (Delbono, 1992, 2003) and disuse (Lamboley et al. 2016) can impair SR function. We therefore tested whether calcium uptake and release in single fibres was altered by 10 days of unloading. This was achieved through an indirect approach based on tension development in response to caffeine‐induced Ca2+ release in permeabilized fibres, according to an ad hoc designed protocol inspired by a series of previous studies (Endo, 1977), see Fig. 1 A.
Ca2+ release induced by 20 mM caffeine after a prolonged SR loading was reduced at BR10 compared with BR0 (P < 0.001), both in type 1 and type 2 fibres. This was confirmed in two subsequent loading–release cycles (trial 1 and trial 2 in Fig. 5 D and E and Table 4). In view of a possible incomplete release or a partial re‐uptake of Ca2+ during the 20 mM release, we determined the residual content of Ca2+ in the SR, by inducing a new release with 20 mM caffeine without loading phase (see Fig. 1 A). The total response (response after loading + residual response without loading) may be considered an indicator of the total amount of Ca2+ in the SR. This was also found to be significantly reduced at BR10 compared with BR0 by 35.1% (P = 0.002) and 30.2% (P < 0.001) in type 1 and type 2 fibres, respectively.
Further, we tested the responsiveness of fibres to a sub‐maximal dose of caffeine (4 mM), which is close to the threshold of response (Rossi et al. 2014; Barone et al. 2017). Fibres were divided into three groups (see Table 5): (i) fibres which did not respond, (ii) fibres with a response below 50% of the response to 20 mM, and (iii) fibres with a response above 50% of the response to 20 mM. The percentage of type 1 fibres belonging to each of the three categories was not different at BR10 if compared with BR0. In contrast, the percentage of type 2 fibres classified as non‐responders increased from about 30% at BR0 to about 46% at BR10, and the percentage of fibres belonging to group (ii) was higher at BR10 (about 19%) than at BR0 (about 13%), indicating that the reduced Ca2+ content of the SR was accompanied by a reduced responsiveness of the release channel.
Since our experimental approach to determining Ca2+ release was based on force development by the myofibrils (see Methods), we thought to confirm that the difference between BR0 and BR10 in the response to caffeine was due to changes in the amount of Ca2+ release by SR and not to a different responsiveness of myofibrils. To this end, we determined the force‐pCa curves in a set of fast and slow fibres at BR0 and BR10. As can be seen in Fig. 6, the myofibrillar responsiveness was not changed, as no difference was detectable in the pCa required to elicit the 10% and the 50% of the Po (Fig. 6 B and C, respectively). The Hill coefficient nH, however, was unchanged in type 2 fibres, while being 26.8% higher at BR10 compared with BR0 (P = 0.021) in type 1 fibres (Fig. 6 D). As can be seen in Fig. 6 A, the force‐pCa curves for type 2 fibres at BR0 and BR10 curves are perfectly overlapping, while for type 1 fibres the greatest difference is about by 7% (at pCa ∼5.5 to 5.7), due to an increased slope of BR10 curve.
Changes in protein expression
In the attempt to investigate the possible reasons behind the lower SR functionality observed, we determined the expression of some proteins involved in Ca2+ handling.
Expression of CASQ1/CASQ2, SERCA1 and SERCA2 by WB (Fig. 7 A and B) revealed no difference in the amount of CASQ1/CASQ2 and SERCA1 between BR0 and BR10. In contrast, SERCA2 was 45.1% downregulated at BR10 if compared with BR0 (P = 0.004). When assessing the expression levels of the genes coding for those proteins, we observed no change in CASQ1 gene expression (Fig. 7 C and Table 2) and strong downregulation of the CASQ2 gene (−81.2% at BR10 vs BR0, Fig. 7 D and Table 2, adjusted P < 0.001), accompanied by a trend for an upregulation of SERCA1 (+78.1%, Fig. 7 E and Table 2, adjusted P = 0.062). SERCA2 gene levels were lower, although not significantly, at BR10 compared with BR0 (−26.4%, Fig. 7 F and Table 2, adjusted P = 0.154). In addition, the RYR1 gene was strongly upregulated (+103.6%, Fig. 7G and Table 2, adjusted P = 0.021).
Figure 7. Variations of gene and protein expression involved in Ca2+ handling in response to 10‐day bed rest.
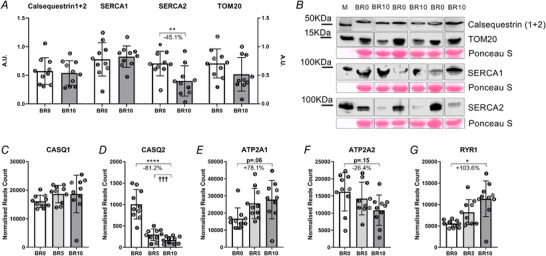
Calsequestrin1‐2, SERCA1, SERCA2 and TOM20 amount in muscle homogenates as obtained by western blot at baseline (BR0) and after 10 days of bed rest (BR10) (A). Representative western blot of CASQ1‐2, SERCA1, SERCA2 and TOM20 (B). CASQ1 and CASQ2 gene expression (encoding for Calsequestrin1 and Calsequestrin2, respectively) (C, D), ATP2A1 and ATP2A2 gene expression (encoding for SERCA1 and SERCA2, respectively) (E, F); RYR1 gene expression (encoding for Ryanodine Receptor 1) (G). All RNA transcripts are reported as normalized read count at BR0, after 5 days of bed rest (BR5) and at BR10. Results shown as means ± SD, individual data represented as scatter plots. * P < 0.05 BR10 vs BR0, ** P < 0.01 BR10 vs BR0, **** P < 0.0001 BR10 vs BR0.
The change in SERCA isoform redistribution prompted us to assess possible signs of changes in fibre type. We thus determined by WB the expression of TOM20 and by electrophoresis the MyHC isoform distribution as markers of fibre type in metabolism and, respectively, myofibrils as shown in Fig. 7 A and B and Fig. 8 A and B. TOM20 was decreased by 23.7%, suggestive of a decreased mitochondrial mass (P = 0.136), while MyHC expression was not altered at BR10 vs BR0, showing only slight and not significant decrements in MyHC‐1 expression and increments in MyHC‐2X. However, the transcripts for MyHC‐2X (MYH1) and MyHC‐1 (MYH7) showed, respectively, upregulation (+178.9%, Fig. 8 C and Table 2, adjusted P = 0.003) and a trend to downregulation (‐40.0%, Fig. 8 C and Table 2, adjusted P = 0.077), suggesting a shift from the slow‐to‐fast phenotype. In addition, the MYH8 gene (coding for the neonatal form of MyHC) was strongly upregulated at BR10 if compared with BR0 (+350.2%, Table 2, adjusted P = 0.003).
Figure 8. Variations in gene and protein expression of myosin heavy chain isoforms in response to 10‐day bed rest.
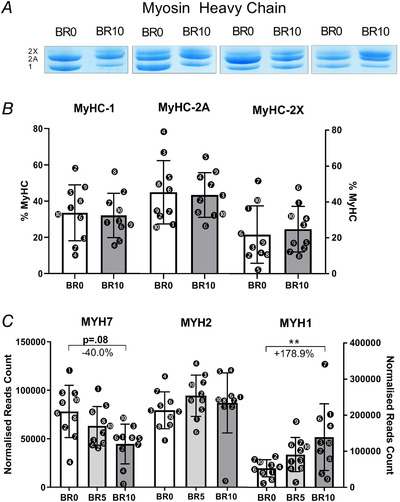
MyHC‐1, MyHC‐2A and MyHC‐2X percentages measured by SDS‐page gel electrophoresis at BR0 and BR10 and representative electrophoresis gels for the dosage of MyHCs percentages (A, B); MYH7, MYH2 and MYH1 gene expression (encoding for MyHC‐1, MyHC‐2A and MyHC‐2X, respectively) (C). RNA transcripts are reported as normalized read count at BR0, after 5 days of bed rest (BR5) and at BR10. Results shown as means ± SD, individual data represented as scatter plots. ** P < 0.01 BR10 vs BR0.
Discussion
The principal observation driving this study was the disproportionate loss of muscle force compared with that of its size that typically occurs with muscle unloading (Berg et al. 1997; Jones et al. 2004; Urso et al. 2006; de Boer et al. 2007a; Glover et al. 2008; Wall et al. 2014; Demangel et al. 2017).
In line with previous findings, the loss of muscle force observed in our work after 10 days of BR largely exceeded the decrease in muscle size, therefore resulting in a reduced specific force. These changes were accompanied by a marked decrease in the rate of force development, as reflected in an increase in the time to 63% of peak force, which may be due to reductions in either tendon stiffness and Young's modulus (de Boer et al. 2007a) or in motor unit firing frequency (Duchateau & Hainaut, 1990; Maffiuletti et al. 2016), or to a combination of both. Instead, although a decrease in the maximum shortening velocity of the contractile component could theoretically contribute to this phenomenon (Wilkie, 1949), this possibility can be excluded since we observed no changes in MyHC protein expression.
The decrease in MVC (−14%) was only partially explained by muscle atrophy (−5%) and, although this is a frequently observed phenomenon (Berg et al. 1997; Jones et al. 2004; Urso et al. 2006; de Boer et al. 2007a; Glover et al. 2008; Wall et al. 2014; Demangel et al. 2017), its causes remain elusive. In this study we specifically investigated the role of neuromuscular junction changes and that of SR calcium dynamics involved in E–C coupling, in the loss of specific muscle force with muscle disuse. The results provided the first robust evidence that alterations in (i) neuromuscular junction stability and (ii) SR function are eligible contributors to the fast decline in muscle contractile performance experienced in the first 10 days of unloading, while (iii) voluntary muscle activation seems unaffected, at least within this short‐term period of disuse.
Neuromuscular degenerative adaptations after 10 days of BR
As to our first hypothesis, the present results show that, starting from a virtually complete absence at BR0, NCAM‐positive fibres were detectable in three subjects at BR5 and in seven out of 10 at BR10, with percentages ranging from 1.94% to 9.34%. This result is in line with the observation by Arentson‐Lantz et al. (2016) investigating the effects of 14‐day BR in seniors, who are, however, more prone to undergo denervation than the young just because of ageing (Aagaard et al. 2010; Lexell, 1997). Moreover, the observed fraction of NCAM‐positive fibres is slightly lower than that reported by the work of Demangel et al. (2017), who focused on the impact of dry immersion, a more severe disuse‐model than BR (Navasiolava et al. 2011; Pandiarajan & Hargens, 2020). At BR5, interstitial NCAM‐positive cells and myofibers having a non‐continuous sarcolemmal ring and negative sarcoplasm were observed, while at BR10 the predominant staining pattern consisted of a complete sarcolemmal ring and diffuse cytoplasmic staining. The presence of NCAM‐positive interstitial cells and myofibres suggests that 10 days of unloading induce, although at a very initial and partial stage, denervation, our results being in line with findings from animal studies (Covault & Sanes, 1985, 1986; Covault et al. 1986). The appearance of NCAM‐positive fibres, however, was not the only sign of early partial denervation/reinnervation processes. For the first time in inactivity conditions, we found evidence of NMJ alterations, as inferred from the increase of CAF serum levels (+19.2%), after just 10 days of BR. At the same time, AGRN gene expression increased, possibly pointing to a compensative mechanism in response to an increased cleavage of this protein at the NMJ.
Further support to the NMJ instability condition is provided by the changes in the expression of genes related to NMJ function. Among these, and of particular relevance, seems the downregulation of both PPARGC1A and HOMER2. The first gene codes for PGC‐1α, which has been demonstrated to influence acetylcholine receptors clustering at the NMJ and enhance, via its binding to the GA‐binding protein, the expression of synaptic genes (Handschin et al. 2007). The second gene codes for the isoform 2 of Homer proteins, which have been reported to localize at the NMJ level, also promoting the expression of synaptic genes (Salanova et al. 2011). Importantly, while downregulation of Homer2 has been reported after prolonged (60 days) inactivity (Salanova et al. 2011), our results show that its downregulation already starts after 10 days. In addition to these genes, also CHRNA1, coding for the subunit α1 of the acetylcholine receptor, was found to be differentially regulated between BR0 and BR10. In innervated fibres, acetylcholine receptor expression is limited to the peri‐junctional myonuclei, while being inhibited in extra‐junctional myonuclei with a mechanism likely linked to fibre electrical activity (Buffelli et al. 2018). It is well known that denervated fibres re‐express acetylcholine receptors over their whole surface (Sanes & Lichtman, 1999; Lomo, 2016), and not only at the NMJ, and thus, in the present conditions, the upregulation of the CHRNA1 can be considered a further sign of the altered neuro‐muscular connection.
Lastly, mRNA levels of MYH8, encoding for the neonatal form of MyHC, were found to be significantly upregulated at BR10 compared with BR0. The neonatal form of MyHC has been shown to be re‐expressed after denervation in animal models (Schiaffino et al. 1988) and in human ageing muscles (Soendenbroe et al. 2019), where it was observed to co‐localise with NCAM‐positive fibres. Hence, the observation of an important upregulation of MYH8 gene (more than 4 times higher at BR10) gave additional support to the finding of an initial stage denervation process occurring during the 10‐day unloading.
Taken together, our data provide evidence of a very early onset of NMJ instability that can lead to a partial denervation, matching with whole muscle and single fibre atrophy and reduced contractility. Although we cannot draw definitive conclusions regarding whether the maladaptations of the NMJ precede or follow those of skeletal muscle fibres, some hypotheses, based on the timing of such adaptations and on previous literature, can be formulated.
NMJ stability is maintained in part by a signalling cascade involving communication from the motoneuron terminal to the myofibre, encompassing, among others, neural agrin and post‐synaptic MuSK activation cascade (Wu et al. 2010). Agrin‐mediated MuSK‐phosphorylation has been reported to induce AChRs clustering at the post‐synaptic level (Bezakova & Ruegg, 2003). The increased levels of CAF may indicate a dysregulation of the agrin–MuSK pathway, potentially inducing NMJ morphological disarrangement by reducing AChRs clustering. In turn, this might have affected the reliability of NMJ action potential transmission, reducing the percentage nerve action potential followed by fibre action potential and contractile response within muscle fibres. The final result of these events would be a lower muscle contractile response to the same excitatory input, thus reducing the total amount of force produced during maximum efforts. In addition, although synaptic stability is known to be regulated by trophic factors released by motoneurons (such as BDNF, NT3, NT4, GDNF, CNTF) and of myotrophin (IGF‐1) (Nishimune et al. 2014), several other peripheral mechanisms are known to be involved in such processes. Among them, autophagy impairments (Carnio et al. 2014), mitochondrial dysfunction (Tezze et al. 2017), ROS accumulation (Jang et al. 2010) and protein synthesis inhibition (McCann et al. 2007) have been shown to affect NMJ health. Intriguingly, some of these processes, such as protein synthesis inhibition (de Boer et al. 2007b), increased oxidative stress due to higher ROS production (Brocca et al. 2012) and augmented autophagy‐related gene and protein expression (Møller et al. 2019) have been reported in response to unloading.
Thus, it might be speculated that both central (reduced motoneuron activity) and peripheral (muscle fibre response to unloading) adaptations may contribute to NMJ instability and consequent partial denervation, in turn affecting and promoting muscle fibre functional decline. In agreement with this view, Deschenes and colleagues, while reporting an increased frequency of NCAM‐positive fibres in young mice after 28‐day hindlimb suspension, suggested that unloading itself, rather than fibre atrophy, might be the cause of the increased expression of NCAM since no change in NT‐4 expression was observed (Deschenes & Wilson, 2003).
Sarcoplasmic reticulum functional impairment after 10 days of BR
Partial denervation and NMJ instability have been assumed to contribute to the dysfunctions of the contractile mechanisms in the elderly (Delbono, 2003). This was based on experimental animal observations that, after partial denervation, a decrease in sarcolemma electrical activity, and in particular charge movement, was followed by alterations in SR calcium release channels (Delbono, 1992). Thus, it seems plausible that a similar mechanism could contribute to the disproportionate loss of muscle force compared with muscle size observed with chronic unloading. A reduced Ca2+ release from SR has been hypothesized, although not proved, to contribute to the increased fatigability after 8 weeks of BR or to the loss of muscle force after 3 days of dry immersion (Mulder et al. 2007; Demangel et al. 2017). A reduction of SR Ca2+ content following prolonged (23 days) disuse has been reported by Lamboley et al. (2016). Some further indications of impaired Ca2+ uptake and release come from hindlimb suspension (Fraysse et al. 2003) and diaphragm denervation (Howell et al. 1997) in mice. The results obtained in the present study provide the first direct experimental evidence that alterations of intra‐fibre Ca2+ dynamics can contribute to the early and fast loss of muscle force, which was our second hypothesis. Indeed, when we tested single fibre mechanical properties under conditions of maximal activation, i.e. with high calcium concentration (pCa = 4.3), their Po was unchanged at BR10 compared with BR0. Accordingly, the rate of acto–myosin interaction, determined with Brenner's manoeuvre during maximal activation, was also unchanged. However, maximal activation in high‐Ca2+ concentration does not reproduce the working conditions of a muscle fibre in vivo, in which force generation is limited by the amount of Ca2+ released from SR upon action potential arrival. Thus, to explore the SR function in taking up, storing and releasing Ca2+, we set up a protocol ad hoc (modified from Endo, 1977), based on repetitive cycles of SR loading of Ca2+ in the presence of ATP and Ca2+ release induced with caffeine, followed by a new SR loading. With this protocol, we observed that a lower number of fibres (especially of fast fibres) would respond to 4 mM caffeine, suggesting a shift of the activation threshold to higher values at BR10 compared with BR0. Even more interestingly, we observed that both slow and fast fibres exhibited a significantly reduced (−35.1% and 30.2%, respectively) Ca2+ release in response to high concentrations of caffeine (20 mM), suggesting a reduced amount of Ca2+ available in the SR. These observations point to a decreased efficiency of E–C coupling after BR, resulting in a reduced contractile response of muscle fibres for the same excitatory stimulus. Importantly, our results show that such impairment already occurs after only 10 days of BR, much earlier than the 23 days of disuse studied by Lamboley and co‐workers (Lamboley et al. 2016). It is also noteworthy that, since the amount of calcium release was measured by the amount of force developed by the myofibrils (as previously proposed by Endo, 1977; Salviati & Volpe, 1988; Lamb et al. 2001 and Reggiani, 2020), the responsiveness of myofibrils to Ca2+ had to be taken into account. For this reason, we determined the force‐pCa curves of slow and fast fibres at BR0 and BR10 and we could exclude that decreased level of force produced in response to caffeine was due to a reduced myofibrillar capacity to produce force in response Ca2+. Indeed, the force‐pCa curves obtained at BR0 and BR10 were virtually superimposable with only a slight increase of the Hill coefficient in type 1 fibres, which was reminiscent of what was observed in soleus slow fibres after 17 days of BR by Widrick et al. (1998).
In order to gain better insights into the molecular basis for the altered Ca2+ handling, we evaluated, via WB and RNAseq, the expression of some proteins relevant for SR Ca2+ uptake and storage (CASQ1, CASQ2, SERCA1, SERCA2, RyR). We found that the total CASQ1+CASQ2 protein complement, as determined by WB, was unchanged, although RNAseq revealed a significant reduction of CASQ2 expression. However, this isoform is considerably less abundant than CASQ1 (which was similarly expressed at BR0 and BR10); thus, the total amount of available intraluminal SR buffer was likely unchanged. As to the Ca2+ pumps, WB showed that SERCA1 protein content was similar between BR0 and BR10, while SERCA2 content was significantly reduced, and RNAseq substantially confirmed these results. In addition, RNAseq revealed a marked increase in RyR1 expression. The above‐mentioned findings are only partially in agreement with those of Lamboley et al. (2016), who reported upregulation of both CASQ and SERCA1 and interpreted this as a compensatory response. However, such changes were observed after 23 days of unloading exposure (more than double those adopted in this work). Hence, both our and Lamboley's results do not provide any indication of a loss of major SR proteins in response to unloading. Thus, the most likely mechanisms responsible for the functional impairment of the SR are an increased leakage of Ca2+ out of the SR and an impaired capability to pump Ca2+ back in the SR owing to oxidation/nitrosylation of the ryanodine receptors and SERCA1, respectively, as shown after long‐term BR in humans by Salanova et al. (2013).
The decrease of CASQ2 and SERCA2 expression together with the increase of RyR1 expression point to an initial slow‐to‐fast myofibre transition. Actually, it is known that disuse and unloading are associated with slow‐to‐fast myofibre transition (Trappe et al. 2004; Fitts et al. 2010) and CASQ2 and SERCA2 are typical isoforms of slow fibres (Schiaffino & Reggiani, 2011), while RyR1 is much more abundant in fast than in slow fibres (Franzini‐Armstrong et al. 1988). Further indications of such fibre type transition came from MyHC isoform expression. A slight increase in MyHC‐2X and a decrease in MyHC‐1 expression measured via gel‐electrophoresis was matched with a significant upregulation of MYH1 (encoding for MyHC‐2X) and downregulation of MYH7 (encoding for MyHC‐1) detected by RNAseq. The discrepancy can be explained taking into account the long MyHC turnover time, while its transcript, known to change faster, can well show significant alterations as early as after 10 days of unloading. The reduced abundance of the mitochondrial mass marker TOM20 (P = 0.14) also played in the direction of a fibre‐type transition.
Activation capacity preservation after 10 days of BR
Lastly, our third hypothesis of an impairment of neural drive to the muscle was not confirmed: indeed, at BR10 muscle voluntary activation remained virtually unchanged. This suggests that alterations of motor unit recruitment do not account for the disproportionate loss of force compared to that of muscle mass, at least during brief periods of unloading. Such observation is consistent with the findings of De Boer et al. (2007a) that no change in muscle activation level occurs after 14 and 23 days of ULLS.
Limitations
We recognize that the present study has two major limitations. First, the number of participants was relatively small, especially considering the normal variability that humans present in response to different stimuli. However, BR studies are usually very expensive and difficult to organize, thus limiting the number of participants that can be recruited. It is noteworthy that a power analysis a priori was performed, based on published data concerning NCAM changes after short‐term immobilization in young and middle‐aged participants (Arentson‐Lantz et al. 2016; Demangel et al. 2017). The results of the power analysis indicated nine subjects as the number of participants to reach a power of 0.87. In addition, the majority of the other parameters investigated, despite the within‐subject variability, resulted in being significantly altered after just 10 days of BR.
Secondly, we acknowledge that the functional data were collected only at BR0 and BR10, thus ruling out the possibility of investigating the detailed time‐course of the considered parameters, and to assess whether, at least in our cohort, the functional decline would precede, follow or accompany the NMJ instability processes. However, obtaining muscle functional measurements during a BR would be clearly counterproductive, as any muscle activity would interfere with the fundamental objective of studying the effects of strict inactivity on the neuromuscular system.
A third, minor limitation may be the performance of the biopsy at BR5 on the left VL, contrarily to BR0 and BR10, which were taken on the right side. This procedure was followed for participants’ safety. Since the data considered at BR0, BR5 and BR10 were consistent, and the majority of the parameters was considered only at BR0 and BR10, we do not feel this procedure would present a major issue for data interpretation and elaboration.
Conclusions
Taken together, our results provide the first consistent experimental identification of early onset of NMJ instability, alterations in the innervation pattern and impairment in Ca2+ dynamics as major determinants of the greater loss of muscle force than of muscle size accompanying unloading inactivity. Thus, the early loss of muscle force induced by inactivity, above the level expected according to the initial loss of contractile mass, does not seem to be related to intrinsic alteration of the contractile material per se, as shown by the unmodified single fibre specific tension and myofibrillar calcium sensitivity, but rather by changes in some mechanisms involved in E–C coupling. The identification of such mechanisms warrants the implementation of early countermeasures against the maladaptive changes of the neuromuscular system to unloading.
Additional information
Competing interests
None of the authors has any conflicts of interest to declare.
Author contributions
Conceptualization, M.V.N., C.R., R.P., B.S.; Methodology, M.V.N., C.R., B.S., M.S., M.V.F., E.M.; Investigation, C.R., B.S., M.M., M.V.F., E.M., F.S., L.N.; Formal analysis, C.R., B.S., M.V.F., E.M., F.S., L.N., G.S., S.Z., L.T., E.G., S.C., A.A.; Software, L.M.; Data curation, E.M.; Writing ‐ original draft, E.M. and C.R.; Writing ‐ review and editing, M.V.N., C.R., R.P., B.S., M.M., M.S., M.V.F., E.M., F.S., L.N., G.S., S.Z., L.T., E.G., L.M., S.C., A.A. Project administration, M.V.N. and R.P.; Funding acquisition, M.V.N.; Resources, M.V.N., C.R., R.P., B.S., M.M.; Supervision, M.V.N. and C.R.
All the authors read, revised and approved the final version of the manuscript. All the authors agreed to be accountable for all aspects of the work, ensuring that questions related to the accuracy or integrity of any part of the work are appropriately investigated and resolved.
Funding
The present study was funded by ASI, MARS‐PRE, Project, n. DC‐VUM‐2017‐006. The authors thank ASI for granting these funds to allow all the experiments to be performed.
Supporting information
Statistical Summary Document
Single fibres raw data concerning caffeine experiments.
Single fibres raw data concerning CSA, Po, Ktr and caffeine experiments.
Single fibres raw data concerning force‐pCa curves experiments
Acknowledgements
The authors thank the participants for their priceless time and effort for the collection of the data, Dr Mladen Gasparini for performing the biopsies, Dr Lorenza Brocca for helping during biopsy collection, and Prof. Stefano Schiaffino for his valuable and precious help in data interpretation and discussion.
Biography
Elena Monti received her Bachelor and Master degree in Sport Science at the University of Milan. During her Master, she was a visiting student at the University Nottingham. Elena moved to Padova and completed her PhD in Biomedical Sciences at the University of Padova under the supervision of Professor Marco Narici. Her research interest focuses on neuromuscular plasticity in loading, unloading, ageing and disease.

Edited by: Scott Powers & Bruno Grassi
Linked articles: This article is highlighted in a Perspectives article by Soendenbroe et al. To read this article, visit https://doi.org/10.1113/JP281761.
This is an Editor's Choice article from the 15 June 2021 issue.
Data availability statement
The data that support the findings of this study are available on request from the corresponding author. The data are not publicly available due to privacy or ethical restrictions.
References
- Aagaard P, Suetta C, Caserotti P, Magnusson SP & Kjær M (2010). Role of the nervous system in sarcopenia and muscle atrophy with aging: Strength training as a countermeasure. Scand J Med Sci Sport 20, 49–64. [DOI] [PubMed] [Google Scholar]
- Allen GM, Gandevia SC & McKenzie DK (1995). Reliability of measurements of muscle strength and voluntary activation using twitch interpolation. Muscle Nerve 18, 593–600. [DOI] [PubMed] [Google Scholar]
- Arentson‐Lantz EJ, English KL, Paddon‐Jones D & Fry CS (2016). Fourteen days of bed rest induces a decline in satellite cell content and robust atrophy of skeletal muscle fibers in middle‐aged adults. J Appl Physiol 120, 965–975. [DOI] [PMC free article] [PubMed] [Google Scholar]
- Barone V, Del Re V, Gamberucci A, Polverino V, Galli L, Rossi D, Costanzi E, Toniolo L, Berti G, Malandrini A, Ricci G, Siciliano G, Vattemi G, Tomelleri G, Pierantozzi E, Spinozzi S, Volpi N, Fulceri R, Battistutta R, Reggiani C & Sorrentino V (2017). Identification and characterization of three novel mutations in the CASQ1 gene in four patients with tubular aggregate myopathy. Hum Mutat 38, 1761–1773. [DOI] [PubMed] [Google Scholar]
- Berg HE, Larsson L & Tesch PA (1997). Lower limb skeletal muscle function after 6 wk of bed rest. J Appl Physiol 82, 182–188. [DOI] [PubMed] [Google Scholar]
- Bers DM, Patton CW & Nuccitelli R (2010). A practical guide to the preparation of Ca2+ buffers. Methods Cell Biol 99, 1–26. [DOI] [PubMed] [Google Scholar]
- Bezakova G & Ruegg MA (2003). New insights into the roles of agrin. Nat Rev Mol Cell Biol 4, 295–309. [DOI] [PubMed] [Google Scholar]
- Biolo G, Agostini F, Simunic B, Sturma M, Torelli L, Preiser JC, Deby‐Dupont G, Magni P, Strollo F, di Prampero P, Guarnieri G, Mekjavic IB, Pišot R & Narici MV (2008). Positive energy balance is associated with accelerated muscle atrophy and increased erythrocyte glutathione turnover during 5 wk of bed rest. Am J Clin Nutr 88, 950–958. [DOI] [PubMed] [Google Scholar]
- de Boer MD, Maganaris CN, Seynnes OR, Rennie MJ & Narici M V (2007a). Time course of muscular, neural and tendinous adaptations to 23 day unilateral lower‐limb suspension in young men. J Physiol 583, 1079–1091. [DOI] [PMC free article] [PubMed] [Google Scholar]
- de Boer MD, Selby A, Atherton P, Smith K, Seynnes OR, Maganaris CN, Maffulli N, Movin T, Narici M V. & Rennie MJ (2007b). The temporal responses of protein synthesis, gene expression and cell signalling in human quadriceps muscle and patellar tendon to disuse. J Physiol 585, 241–251. [DOI] [PMC free article] [PubMed] [Google Scholar]
- Bolliger MF, Zurlinden A, Lüscher D, Bütikofer L, Shakhova O, Francolini M, Kozlov SV., Cinelli P, Stephan A, Kistler AD, Rülicke T, Pelczar P, Ledermann B, Fumagalli G, Gloor SM, Kunz B & Sonderegger P (2010). Specific proteolytic cleavage of agrin regulates maturation of the neuromuscular junction. J Cell Sci 123, 3944–3955. [DOI] [PubMed] [Google Scholar]
- Brenner B & Eisenberg E (1986). Rate of force generation in muscle: Correlation with actomyosin ATPase activity in solution. Proc Natl Acad Sci U S A 83, 3542–3546. [DOI] [PMC free article] [PubMed] [Google Scholar]
- Brocca L, Cannavino J, Coletto L, Biolo G, Sandri M, Bottinelli R & Pellegrino MA (2012). The time course of the adaptations of human muscle proteome to bed rest and the underlying mechanisms. J Physiol 590, 5211–5230. [DOI] [PMC free article] [PubMed] [Google Scholar]
- Buffelli M, Tognana E, Cangiano A & Busetto G (2018). Activity‐dependent vs. neurotrophic modulation of acetylcholine receptor expression: Evidence from rat soleus and extensor digitorum longus muscles confirms the exclusive role of activity. Eur J Neurosci 47, 1474–1481. [DOI] [PubMed] [Google Scholar]
- Campbell EL, Seynnes OR, Bottinelli R, McPhee JS, Atherton PJ, Jones DA, Butler‐Browne G & Narici M V (2013). Skeletal muscle adaptations to physical inactivity and subsequent retraining in young men. Biogerontology 14, 247–259. [DOI] [PubMed] [Google Scholar]
- Carnio S, LoVerso F, Baraibar MA, Longa E, Khan MM, Maffei M, Reischl M, Canepari M, Loefler S, Kern H, Blaauw B, Friguet B, Bottinelli R, Rudolf R & Sandri M (2014). Autophagy Impairment in Muscle Induces Neuromuscular Junction Degeneration and Precocious Aging. Cell Rep 8, 1509–1521. [DOI] [PMC free article] [PubMed] [Google Scholar]
- Chen S, Zhou Y, Chen Y & Gu J (2018). Fastp: An ultra‐fast all‐in‐one FASTQ preprocessor. Bioinformatics 34, i884–i890. [DOI] [PMC free article] [PubMed] [Google Scholar]
- Costa LA, Foni NO, Antonioli E, De Carvalho RT, Paião ID, Lenza M & Ferretti M (2018). Analysis of 500 anterior cruciate ligament reconstructions from a private institutional register. PLoS One 13, 1–15. [DOI] [PMC free article] [PubMed] [Google Scholar]
- Couppé C, Suetta C, Kongsgaard M, Justesen L, Hvid LG, Aagaard P, Kjær M & Magnusson SP (2012). The effects of immobilization on the mechanical properties of the patellar tendon in younger and older men. Clin Biomech 27, 949–954. [DOI] [PubMed] [Google Scholar]
- Covault J, Merlie JP, Goridis C & Sanes JR (1986). Molecular forms of N‐CAM and its RNA in developing and denervated skeletal muscle. J Cell Biol 102, 731–739. [DOI] [PMC free article] [PubMed] [Google Scholar]
- Covault J & Sanes JR (1985). Neural cell adhesion molecule (N‐CAM) accumulates in denervated and paralyzed skeletal muscles. Proc Natl Acad Sci U S A 82, 4544–4548. [DOI] [PMC free article] [PubMed] [Google Scholar]
- Covault J & Sanes JR (1986). Distribution of N‐CAM in synaptic and extrasynaptic portions of developing and adult skeletal muscle. J Cell Biol 102, 716–730. [DOI] [PMC free article] [PubMed] [Google Scholar]
- Delbono O (1992). Calcium current activation and charge movement in denervated mammalian skeletal muscle fibres. J Physiol 451, 187–203. [DOI] [PMC free article] [PubMed] [Google Scholar]
- Delbono O (2003). Neural control of aging skeletal muscle. Aging Cell 2, 21–29. [DOI] [PubMed] [Google Scholar]
- Demangel R, Treffel L, Py G, Brioche T, Pagano AF, Bareille MP, Beck A, Pessemesse L, Candau R, Gharib C, Chopard A & Millet C (2017). Early structural and functional signature of 3‐day human skeletal muscle disuse using the dry immersion model. J Physiol 595, 4301–4315. [DOI] [PMC free article] [PubMed] [Google Scholar]
- Deschenes MR & Wilson MH (2003). Age‐Related Differences in Synaptic Plasticity following Muscle Unloading. J Neurobiol 57, 246–256. [DOI] [PubMed] [Google Scholar]
- Dobin A, Davis CA, Schlesinger F, Drenkow J, Zaleski C, Jha S, Batut P, Chaisson M & Gingeras TR (2013). STAR: Ultrafast universal RNA‐seq aligner. Bioinformatics 29, 15–21. [DOI] [PMC free article] [PubMed] [Google Scholar]
- Drey M, Sieber CC, Bauer JM, Uter W, Dahinden P, Fariello RG & Vrijbloed JW (2013). C‐terminal Agrin Fragment as a potential marker for sarcopenia caused by degeneration of the neuromuscular junction. Exp Gerontol 48, 76–80. [DOI] [PubMed] [Google Scholar]
- Duchateau J & Hainaut K (1990). Effects of immobilization on contractile properties, recruitment and firing rates of human motor units. J Physiol 422, 55–65. [DOI] [PMC free article] [PubMed] [Google Scholar]
- Endo M (1977). Calcium release from the sarcoplasmic reticulum. Physiol Rev 57, 71–108. [DOI] [PubMed] [Google Scholar]
- Endo M & Iino M (1988). Measurement of Ca 2+ Release in Skinned Fibers from Skeletal Muscle. Methods Enzym 157, 12–26. [DOI] [PubMed] [Google Scholar]
- Enninghorst N, McDougall D, Evans JA, Sisak K & Balogh ZJ (2013). Population‐based epidemiology of femur shaft fractures. J Trauma Acute Care Surg 74, 1516–1520. [DOI] [PubMed] [Google Scholar]
- Ferretti G (1997). The effect of prolonged bed rest on maximal instantaneous muscle power and its determinants. Int J Sport Med Suppl 18, 1995–1997. [DOI] [PubMed] [Google Scholar]
- Fitts RH, Riley DR & Widrick JJ (2000). Physiology of a microgravity environment invited review: microgravity and skeletal muscle. J Appl Physiol 89, 823–839. [DOI] [PubMed] [Google Scholar]
- Fitts RH, Romatowski JG, Peters JR, Paddon‐Jones D, Wolfe RR & Ferrando AA (2007). The deleterious effects of bed rest on human skeletal muscle fibers are exacerbated by hypercortisolemia and ameliorated by dietary supplementation. Am J Physiol ‐ Cell Physiol 293, 313–320. [DOI] [PubMed] [Google Scholar]
- Fitts RH, Trappe SW, Costill DL, Gallagher PM, Creer AC, Colloton PA, Peters JR, Romatowski JG, Bain JL & Riley DA (2010). Prolonged space flight‐induced alterations in the structure and function of human skeletal muscle fibres. J Physiol 588, 3567–3592. [DOI] [PMC free article] [PubMed] [Google Scholar]
- Franchi M V., Raiteri BJ, Longo S, Sinha S, Narici M V. & Csapo R (2018). Muscle Architecture Assessment: Strengths, Shortcomings and New Frontiers of in Vivo Imaging Techniques. Ultrasound Med Biol 44, 2492–2504. [DOI] [PubMed] [Google Scholar]
- Franzini‐Armstrong C, Ferguson DG & Champ C (1988). Discrimination between fast‐ and slow‐twitch fibres of guinea pig skeletal muscle using the relative surface density of junctional transverse tubule membrane. J Muscle Res Cell Motil 9, 403–414. [DOI] [PubMed] [Google Scholar]
- Fraysse B, Desaphy JF, Pierno S, De Luca A, Liantonio A, Mitolo CI & Camerino Conte D (2003). Decrease in resting calcium and calcium entry associated with slow‐to‐fast transition in unloaded rat soleus muscle. FASEB J 17, 1916–1918. [DOI] [PubMed] [Google Scholar]
- Fryer MW & Stephenson DG (1996). Total and sarcoplasmic reticulum calcium contents of skinned fibres from rat skeletal muscle. J Physiol 493, 357–370. [DOI] [PMC free article] [PubMed] [Google Scholar]
- Glover EI, Phillips SM, Oates BR, Tang JE, Tarnopolsky MA, Selby A, Smith K & Rennie MJ (2008). Immobilization induces anabolic resistance in human myofibrillar protein synthesis with low and high dose amino acid infusion. J Physiol 586, 6049–6061. [DOI] [PMC free article] [PubMed] [Google Scholar]
- Handschin C, Kobayashi YM, Chin S, Seale P, Campbell KP & Spiegelman BM (2007). PGC‐1α regulates the neuromuscular junction program and ameliorates Duchenne muscular dystrophy. Genes Dev 21, 770–783. [DOI] [PMC free article] [PubMed] [Google Scholar]
- Hettwer S, Dahinden P, Kucsera S, Farina C, Ahmed S, Fariello R, Drey M, Sieber CC & Vrijbloed JW (2013). Elevated levels of a C‐terminal agrin fragment identifies a new subset of sarcopenia patients. Exp Gerontol 48, 69–75. [DOI] [PubMed] [Google Scholar]
- Howard EE, Pasiakos SM, Fussell MA & Rodriguez NR (2020). Skeletal Muscle Disuse Atrophy and the Rehabilitative Role of Protein in Recovery from Musculoskeletal Injury. Adv Nutr 00, 1–13. [DOI] [PMC free article] [PubMed] [Google Scholar]
- Howell S, Zhan W, Sieck GC, Zhan W & Sieck GC (1997). Diaphragm disuse reduces Ca2+ uptake capacity of sarcoplasmic reticulum. J Appl Physiol 82, 164–171. [DOI] [PubMed] [Google Scholar]
- Hvid LG, Ørtenblad N, Aagaard P, Kjaer M & Suetta C (2011). Effects of ageing on single muscle fibre contractile function following short‐term immobilisation. J Physiol 589, 4745–4757. [DOI] [PMC free article] [PubMed] [Google Scholar]
- Jang YC, Lustgarten MS, Liu Y, Muller FL, Bhattacharya A, Liang H, Salmon AB, Brooks S V., Larkin L, Hayworth CR, Richardson A & Van Remmen H (2010). Increased superoxide in vivo accelerates age‐associated muscle atrophy through mitochondrial dysfunction and neuromuscular junction degeneration. FASEB J 24, 1376–1390. [DOI] [PMC free article] [PubMed] [Google Scholar]
- Jones SW, Hill RJ, Krasney PA, O'Conner B, Peirce N & Greenhaff PL (2004). Disuse atrophy and exercise rehabilitation in humans profoundly affects the expression of genes associated with the regulation of skeletal muscle mass. FASEB J 18, 1025–1027. [DOI] [PubMed] [Google Scholar]
- Kang D, Gho YS, Suh M & Kang C (2002). Highly sensitive and fast protein detection with Coomassie brilliant blue in sodium dodecyl sulfate‐polyacrylamide gel electrophoresis [5]. Bull Korean Chem Soc 23, 1511–1512. [Google Scholar]
- Kawakami Y, Akima H, Kubo K, Muraoka Y, Hasegawa H, Kouzaki M, Imai M, Suzuki Y, Gunji A, Kanehisa H & Fukunaga T (2001). Changes in muscle size, architecture, and neural activation after 20 days of bed rest with and without resistance exercise. Eur J Appl Physiol 84, 7–12. [DOI] [PubMed] [Google Scholar]
- Kilroe SP, Fulford J, Jackman SR, Van Loon LJC & Wall BT (2020). Temporal Muscle‐specific Disuse Atrophy during One Week of Leg Immobilization. Med Sci Sports Exerc 52, 944–954. [DOI] [PubMed] [Google Scholar]
- Krell RW, Girotti ME & Dimick JB (2014). Extended length of stay after surgery: Complications, inefficient practice, or sick patients? JAMA Surg 149, 815–820. [DOI] [PMC free article] [PubMed] [Google Scholar]
- Laemmli UK (1970). Cleavage of structural proteins during the assembly of the head of bacteriophage T4. Nature 227, 680–685. [DOI] [PubMed] [Google Scholar]
- Lamb GD, Cellini MA & Stephenson DG (2001). Different Ca2+ releasing action of caffeine and depolarisation in skeletal muscle fibres of the rat. J Physiol 531, 715–728. [DOI] [PMC free article] [PubMed] [Google Scholar]
- Lamboley CR, Wyckelsma VL, Dutka TL, McKenna MJ, Murphy RM & Lamb GD (2015). Contractile properties and sarcoplasmic reticulum calcium content in type I and type II skeletal muscle fibres in active aged humans. J Physiol 593, 2499–2514. [DOI] [PMC free article] [PubMed] [Google Scholar]
- Lamboley CR, Wyckelsma VL, Perry BD, McKenna MJ & Lamb GD (2016). Effect of 23‐day muscle disuse on sarcoplasmic reticulum Ca2+properties and contractility in human type i and type II skeletal muscle fibers. J Appl Physiol 121, 483–492. [DOI] [PubMed] [Google Scholar]
- Larsson L, Li X, Berg HE & Frontera WR (1996). Effects of removal of weight bearing function on contractility and myosin isoform composition in single human skeletal muscle cells. Pflugers Arch Eur J Physiol 432, 320–328. [DOI] [PubMed] [Google Scholar]
- Lexell J (1997). Symposium: Sarcopenia: Diagnosis and Mechanisms Evidence for Nervous System Degeneration with Advancing Age 1. J Nutr 127, 1011–1013. [DOI] [PubMed] [Google Scholar]
- Li B & Dewey CN (2011). RSEM: Accurate transcript quantification from RNA‐Seq data with or without a reference genome. BMC Bioinformatics 12, 323. 10.1186/1471-2105-12-323. [DOI] [PMC free article] [PubMed] [Google Scholar]
- Lomo T (2016). Scientific Discoveries: What Is Required for Lasting Impact. Annu Rev Physiol 78, 1–21. [DOI] [PubMed] [Google Scholar]
- Lowry OH, Rosebrough NJ, Lewis Farr A & Randall NJ (1951). Protein measurement with the Folin phenol reagent. J Biol Chem 193, 265–275. [PubMed] [Google Scholar]
- Maffiuletti NA, Aagaard P, Blazevich AJ, Folland J, Tillin N & Duchateau J (2016). Rate of force development: physiological and methodological considerations. Eur J Appl Physiol 116, 1091–1116. [DOI] [PMC free article] [PubMed] [Google Scholar]
- McCann CM, Nguyen QT, Neto HS & Lichtman JW (2007). Rapid synapse elimination after postsynaptic protein synthesis inhibition in vivo. J Neurosci 27, 6064–6067. [DOI] [PMC free article] [PubMed] [Google Scholar]
- McCarthy DJ, Chen Y & Smyth GK (2012). Differential expression analysis of multifactor RNA‐Seq experiments with respect to biological variation. Nucleic Acids Res 40, 4288–4297. [DOI] [PMC free article] [PubMed] [Google Scholar]
- Mitsumoto H, DeBoer GE, Bunge G, Andrish J., Tetzlaff JE & Cruse R (1990). Fiber‐type Specific Caffeine Sensitivities in Normal Human Skinned Muscle Fibers. Anesthesiology 72, 50–54. [DOI] [PubMed] [Google Scholar]
- Møller AB, Vendelbo MH, Schjerling P, Couppé C, Møller N, Kjær M, Hansen M & Jessen N (2019). Immobilization decreases foxo3a phosphorylation and increases autophagy‐related gene and protein expression in human skeletal muscle. Front Physiol 10, 736. 10.3389/fphys.2019.00736. [DOI] [PMC free article] [PubMed] [Google Scholar]
- Monti E, Franchi M V., Badiali F, Quinlan JI, Longo S & Narici M V (2020). The Time‐Course of Changes in Muscle Mass, Architecture and Power During 6 Weeks of Plyometric Training. Front Physiol 11, 1–14. [DOI] [PMC free article] [PubMed] [Google Scholar]
- Mulder ER, Kuebler WM, Gerrits KHL, Rittweger J, Felsenberg D, Stegeman DF & De Haan A (2007). Knee extensor fatigability after bedrest for 8 weeks with and without countermeasure. Muscle Nerve 36, 798–806. [DOI] [PubMed] [Google Scholar]
- Navasiolava NM, Custaud MA, Tomilovskaya ES, Larina IM, Mano T, Gauquelin‐Koch G, Gharib C & Kozlovskaya IB (2011). Long‐term dry immersion: Review and prospects. Eur J Appl Physiol 111, 1235–1260. [DOI] [PubMed] [Google Scholar]
- Neuhoff V, Arold N, Taube D & Ehrhardt W (1988). Improved staining of proteins in polyacrylamide gels including isoelectric focusing gels with clear background at nanogram sensitivity using Coomassie Brilliant Blue G‐250 and R‐250. Electrophoresis 9, 255–262. [DOI] [PubMed] [Google Scholar]
- Nishimune H, Stanford JA & Mori Y (2014). Role of exercise in maintaining the integrity of the neuromuscular junction. Muscle and Nerve 49, 315–324. [DOI] [PMC free article] [PubMed] [Google Scholar]
- Nordströ P, Gustafson Y, Michaëlsson K & Nordström A (2015). Length of hospital stay after hip fracture and short term risk of death after discharge: A total cohort study in Sweden. BMJ 350, 1–11. [DOI] [PMC free article] [PubMed] [Google Scholar]
- Ottenheijm CAC, Witt CC, Stienen GJ, Labeit S, Beggs AH & Granzier H (2009). Thin filament length dysregulation contributes to muscle weakness in nemaline myopathy patients with nebulin deficiency. Hum Mol Genet 18, 2359–2369. [DOI] [PMC free article] [PubMed] [Google Scholar]
- Pandiarajan M & Hargens AR (2020). Ground‐based analogs for human spaceflight. Front Physiol 11, 716. [DOI] [PMC free article] [PubMed] [Google Scholar]
- Pascal L, Polazzi S, Piriou V, Cotte E, Wegrzyn J, Carty MJ, Chollet F, Sanchez S, Lifante J‐C & Duclos A (2020). Hospital length of stay reduction over time and patient readmission for severe adverse events following surgery. Ann Surg 272, 105–112. [DOI] [PubMed] [Google Scholar]
- Puthucheary ZA, Rawal J, McPhail M, Connolly B, Ratnayake G, Chan P, Hopkinson NS, Phadke R, Dew T, Sidhu PS, Velloso C, Seymour J, Agley CC, Selby A, Limb M, Edwards LM, Smith K, Rowlerson A, Rennie MJ, Moxham J, Harridge SDR, Hart N & Montgomery HE (2013). Acute skeletal muscle wasting in critical illness. JAMA ‐ J Am Med Assoc 310, 1591–1600. [DOI] [PubMed] [Google Scholar]
- Quinlan JI, Maganaris CN, Franchi M V., Smith K, Atherton PJ, Szewczyk NJ, Greenhaff PL, Phillips BE, Blackwell JI, Boereboom C, Williams JP, Lund J & Narici M V (2018). Muscle and Tendon Contributions to Reduced Rate of Torque Development in Healthy Older Males. Journals Gerontol ‐ Ser A Biol Sci Med Sci 73, 539–545. [DOI] [PMC free article] [PubMed] [Google Scholar]
- Reeves ND, Maganaris CN, Ferretti G & Narici M V (2005). Influence of 90‐day simulated microgravity on human tendon mechanical properties and the effect of resistive countermeasures. J Appl Physiol 98, 2278–2286. [DOI] [PubMed] [Google Scholar]
- Reggiani C (2020). Caffeine as a tool to investigate sarcoplasmic reticulum and intracellular calcium dynamics in human skeletal muscles. J Muscle Res Cell Motil; 10.1007/s10974-020-09574-7. [DOI] [PubMed] [Google Scholar]
- Rejc E, Floreani M, Taboga P, Botter A, Toniolo L, Cancellara L, Narici M, Šimunič B, Pišot R, Biolo G, Passaro A, Rittweger J, Reggiani C & Lazzer S (2018). Loss of maximal explosive power of lower limbs after 2 weeks of disuse and incomplete recovery after retraining in older adults. J Physiol 596, 647–665. [DOI] [PMC free article] [PubMed] [Google Scholar]
- Rejc E, di Prampero PE, Lazzer S, Grassi B, Simunic B, Pisot R, Antonutto G & Narici M (2015). Maximal explosive power of the lower limbs before and after 35 days of bed rest under different diet energy intake. Eur J Appl Physiol 115, 429–436. [DOI] [PubMed] [Google Scholar]
- Rossi D, Vezzani B, Galli L, Paolini C, Toniolo L, Spinozzi S, Barone V, Pegoraro E, Bello L, Cenacchi G, Vattemi G, Tomelleri G, Ricci G, Siciliano G, Protasi F, Reggiani C & Sorrentino V (2014). A mutation in the CASQ1 gene causes a vacuolar myopathy with accumulation of sarcoplasmic reticulum protein aggregates. Hum Mutat 35, 1163–1170. [DOI] [PMC free article] [PubMed] [Google Scholar]
- Salanova M, Bortoloso E, Schiffl G, Gutsmann M, Belavý DL, Felsenberg D, Furlan S, Volpe P & Blottner D (2011). Expression and regulation of Homer in human skeletal muscle during neuromuscular junction adaptation to disuse and exercise. FASEB J 25, 4312–4325. [DOI] [PubMed] [Google Scholar]
- Salanova M, Schiffl G, Gutsmann M, Felsenberg D, Furlan S, Volpe P, Clarke A & Blottner D (2013). Nitrosative stress in human skeletal muscle attenuated by exercise countermeasure after chronic disuse. Redox Biol 1, 514–526. [DOI] [PMC free article] [PubMed] [Google Scholar]
- Salviati G, Sorenson MM & Eastwood AB (1982). Calcium accumulation by the sarcoplasmic reticulum in two populations of chemically skinned human muscle fibers. J Gen Physiol 79, 603–632. [DOI] [PMC free article] [PubMed] [Google Scholar]
- Salviati G & Volpe P (1988). Ca2+ release from sarcoplasmic reticulum of skinned fast‐ and slow‐twitch muscle fibers. Am J Physiol 254, 459–465. [DOI] [PubMed] [Google Scholar]
- Sanes JR & Lichtman JW (1999). Development of the vertebrate neuromuscular junction. Annu Rev Neurosci 22, 389–442. [DOI] [PubMed] [Google Scholar]
- Schiaffino S, Gorza L, Pitton G, Saggin L, Ausoni S, Sartore S & Lømo T (1988). Embryonic and neonatal myosin heavy chain in denervated and paralyzed rat skeletal muscle. Dev Biol 127, 1–11. [DOI] [PubMed] [Google Scholar]
- Schiaffino S & Reggiani C (2011). Fiber types in Mammalian skeletal muscles. Physiol Rev 91, 1447–1531. [DOI] [PubMed] [Google Scholar]
- Schindelin J, Arganda‐Carrera I, Frise E, Verena K, Mark L, Tobias P, Stephan P, Curtis R, Stephan S, Benjamin S, Jean‐Yves T, Daniel JW, Volker H, Kevin E, Pavel T & Albert C (2012). Fiji ‐ an Open platform for biological image analysis. Nat Methods 9, 676–82 10.1038/nmeth.2019. [DOI] [PMC free article] [PubMed] [Google Scholar]
- Soendenbroe C, Heisterberg MF, Schjerling P, Karlsen A, Kjaer M, Andersen JL & Mackey AL (2019). Molecular indicators of denervation in aging human skeletal muscle. Muscle and Nerve 60, 453–463. [DOI] [PubMed] [Google Scholar]
- Stephan A, Mateos JM, Kozlov S V., Cinelli P, Kistler AD, Hettwer S, Rülicke T, Streit P, Kunz B & Sonderegger P (2008). Neurotrypsin cleaves agrin locally at the synapse. FASEB J 22, 1861–1873. [DOI] [PubMed] [Google Scholar]
- Suetta C, Hvid LG, Justesen L, Christensen U, Neergaard K, Simonsen L, Ortenblad N, Magnusson SP, Kjaer M & Aagaard P (2009). Effects of aging on human skeletal muscle after immobilization and retraining. J Appl Physiol 107, 1172–1180. [DOI] [PubMed] [Google Scholar]
- Tezze C et al (2017). Age‐associated loss of OPA1 in muscle impacts muscle mass, metabolic homeostasis, systemic inflammation, and epithelial senescence. Cell Metab 25, 1374–1389.e6. [DOI] [PMC free article] [PubMed] [Google Scholar]
- Trappe S, Trappe T, Gallagher P, Harber M, Alkner B & Tesch P (2004). Human single muscle fibre function with 84 day bed‐rest and resistance exercise. J Physiol 557, 501–513. [DOI] [PMC free article] [PubMed] [Google Scholar]
- Urso ML, Clarkson PM & Price TB (2006). Immobilization effects in young and older adults. Eur J Appl Physiol 96, 564–571. [DOI] [PubMed] [Google Scholar]
- Uttenweiler D, Weber C & Fink RHA (1998). Mathematical modeling and fluorescence imaging to study the Ca2+ turnover in skinned muscle fibers. Biophys J 74, 1640–1653. [DOI] [PMC free article] [PubMed] [Google Scholar]
- VanSaun M & Werle MJ (2000). Matrix metalloproteinase‐3 removes agrin from synaptic basal lamina. J Neurobiol 43, 140–149. [PubMed] [Google Scholar]
- Walker SM & Schrodt GR (1974). I segment lengths and thin filament periods in skeletal muscle fibers of the rhesus monkey and the human. Anat Rec 178, 63–81. [DOI] [PubMed] [Google Scholar]
- Wall BT, Dirks ML, Snijders T, Senden JMG, Dolmans J & Van Loon LJC (2014). Substantial skeletal muscle loss occurs during only 5 days of disuse. Acta Physiol 210, 600–611. [DOI] [PubMed] [Google Scholar]
- Widrick JJ, Norenberg KM, Romatowski JG, Blaser CA, Karhanek M, Sherwood J, Trappe SW, Trappe TA, Costill DL & Fitts RH (1998). Force‐velocity‐power and force‐pCa relationships of human soleus fibers after 17 days of bed rest. J Appl Physiol 85, 1949–1956. Available at: http://www.jap.org. [DOI] [PubMed] [Google Scholar]
- Wilkie DR (1949). The relation between force and velocity in human muscle. J Physiol 110, 249–280. [DOI] [PMC free article] [PubMed] [Google Scholar]
- Wu H, Xiong WC & Mei L (2010). To build a synapse: Signaling pathways in neuromuscular junction assembly. Development 137, 1017–1033. [DOI] [PMC free article] [PubMed] [Google Scholar]
Associated Data
This section collects any data citations, data availability statements, or supplementary materials included in this article.
Supplementary Materials
Statistical Summary Document
Single fibres raw data concerning caffeine experiments.
Single fibres raw data concerning CSA, Po, Ktr and caffeine experiments.
Single fibres raw data concerning force‐pCa curves experiments
Data Availability Statement
The data that support the findings of this study are available on request from the corresponding author. The data are not publicly available due to privacy or ethical restrictions.