Abstract
Introduction
Chronic pain is a major public health concern, as is the associated use of opioid medications, highlighting the importance of alternative treatments, such as spinal cord stimulation (SCS). Here, we present the final 24‐month results of the Avalon study, which investigated the use of the first closed‐loop SCS system in patients with chronic pain. The system measures the evoked compound action potentials (ECAPs) elicited by each stimulus pulse and drives a feedback loop to maintain the ECAP amplitude near constant.
Methods
Fifty patients were implanted with the Evoke system (Saluda Medical) and followed over 24‐months. Pain, quality of life (QOL), function, sleep, and medication use were collected at baseline and each scheduled visit. ECAP amplitudes and programming adjustments were also monitored.
Results
At 24 months, responder rates (≥ 50% pain reduction) and high responder rates (≥ 80% pain reduction) for overall pain were 89.5% and 68.4%, respectively, the latter up from 42.2% at 3 months. Significant improvements from baseline were observed in QOL, function, and sleep over the 24 months, including ≥ 80% experiencing a minimally important difference in QOL and > 50% experiencing a clinically significant improvement in sleep. At 24 months, 82.8% of patients with baseline opioid use eliminated or reduced their opioid intake. Over the course of the study, reprogramming need fell to an average of less than once a year.
Conclusion
Over a 24‐month period, the Evoke closed‐loop SCS maintained its therapeutic efficacy despite a marked reduction in opioid use and steady decrease in the need for reprogramming.
Keywords: Chronic, closed‐loop SCS, evoked compound action potential, evoke, feedback, opioid, pain, spinal cord stimulation
Key Points/Highlights.
The Evoke system (Saluda Medical, Sydney, Australia) measures the evoked compound action potentials (ECAPs) elicited by each stimulus pulse and drives a feedback loop to maintain a near‐constant ECAP amplitude.
Over a 24‐month period, the Avalon study (N = 50) showed that the Evoke closed‐loop SCS maintained its therapeutic efficacy despite a marked reduction in opioid use and steady decrease in the need for reprogramming.
At 24 months, responder rates (≥50% pain reduction) and high responder rates (≥80% pain reduction) for overall pain were 89.5% and 68.4% respectively, which demonstrated continuous improvement over time from 3-month and 12-month responder and high responder rates.
More than 80% of patients experienced a minimally important difference in QOL, and >50% experienced a clinically significant improvement in sleep, while 82.8% of patients with baseline opioid use eliminated or reduced their opioid intake with 41.4% eliminating opioid use altogether.
INTRODUCTION
Chronic pain is a major public health concern on a world scale. In Australia, 20% of general practitioner consultations involve chronic pain, and medications are used in close to 70% of chronic pain management consultations.1 In the United States and elsewhere, the opioid epidemic has received widespread attention and highlighted the need for nonopioid‐based treatments.2
Spinal cord stimulation (SCS) is an alternative treatment for chronic pain and has the advantage of being highly localized, reversible, safe, and having a limited side effect profile.3 SCS was developed as a treatment for chronic pain based on the principles of the Gate Control Theory described by Melzack and Wall in 1965.4 In simplified terms, the theory postulates that activating sensory fibers would reduce or eliminate pain by closing the pain processing gate in the dorsal horn, which relays pain signals from the periphery to the central nervous system. SCS systems are therefore designed to deliver pulses of electric current via electrodes placed in the epidural space above the dorsal columns, targeting levels that allow for activation of sensory fibers of the painful dermatomes.
If the stimulus amplitude does not vary, changes in the distance and/or orientation of the spinal cord in relation to the electrodes can lead to a change in the level of neural activation, and in turn to overstimulation (uncomfortably strong stimulation) or understimulation (lack of therapeutic benefit). The changes in neural activation that occur either periodically (eg, heartbeat or breathing) or from changes in posture are often too rapid for a patient to manually adjust their stimulation level. Furthermore, understimulation can be difficult to detect without an objective measure. Other SCS systems provide a constant stimulation amplitude that must be manually adjusted. Some are programmed to avoid any stimulation sensation but these systems are not able to assess whether neural activation, and thus inhibition of the pain pathway, is occurring at all.
The evoked compound action potential (ECAP) is the sum of the individual action potentials of the dorsal column fibers elicited by an electrical stimulation pulse. Therefore, the amplitude of the ECAP is a measure of the amount of neural activation. Using this amplitude measure as input to a feedback loop, the stimulus current can be controlled automatically in order to maintain the ECAP amplitude, and therefore the level of neural activation, near a set target level.
This process is used in the Evoke SCS system (Saluda Medical, Australia), which makes real‐time adjustments (3.5 million adjustments per day, on average) based on ECAP measurements so that each patient is treated consistently and periods of under and overstimulation are minimized. The Evoke SCS System is being investigated in the Avalon single‐arm, open‐label trial (ACTRN12615000713594), and the Evoke double‐blind randomized controlled trial (NCT02924129). Outcomes of these 2 studies have been reported out to 12 months of follow‐up.5, 6 Here, we report the final 24‐month outcomes of the Avalon trial.
METHODS
Study design and data collection
The Avalon study was a prospective, multicenter, single‐arm study approved by local ethics committees. The protocol was publicly registered at the Australian New Zealand Clinical Trials Registry (ACTRN12615000713594) on July 9, 2015. The first patient enrolled in this study on August 24, 2015. Originally, the study was designed to be executed over a 12‐month period but was subsequently amended to extend up to 24 months and includes a total of 50 implanted patients. Patients enrolled prior to the amendment could complete the study after the initially planned 12 months, if desired, or be followed through the extended 24‐month time frame.
Written informed consent was obtained prior to collecting the baseline assessment. Patients meeting the eligibility criteria were enrolled after undergoing a trial with an external closed‐loop stimulator (eCLS) and temporary leads implanted in the epidural space for an average of 7 days. If the trial was deemed successful (≥ 40% pain reduction), the patient was offered the choice to receive the Evoke SCS System. Patients implanted with the Evoke SCS System were followed at 1, 3, 6, 12, 15, 18, 21, and 24 months. In between scheduled visits, patients were able to return to the clinic for reprogramming as needed.
At each scheduled study visit, assessments included ratings of pain (100‐mm VAS),7 impact of pain (Brief Pain Inventory [BPI]),8 functional disability (Oswestry Disability Index [ODI]),9 sleep quality (Pittsburgh Sleep Quality Index [PSQI]),10 quality of life (EuroQol instrument [EQ‐5D‐5L]),11 and medication usage. The morphine milligram equivalent daily dose (MME/day) was calculated based on the Australian Faculty of Pain Medicine (FPM) conversion factors for all patients with opioid use at baseline (38 out of 50 implanted patients). Performance (ie, ability to program in closed‐loop) was assessed for all patients. ECAP amplitude and device usage automatically recorded by the stimulator were extracted and analyzed. A patient’s therapeutic window was defined as the range of ECAP amplitudes between self‐reported stimulation perception and maximum (the maximum activation level the patient can withstand). Adverse events were assessed throughout the study for all enrolled patients. The need for programming was determined by any visit (scheduled or unscheduled) during which a program change was performed. Programming was conducted following the ethics committee approved clinical manual and performed in the same manner for all patients with oversight from the investigators. Stimulation therapy settings were within the range of conventional parameters. Programming utilized each individual’s unique ECAP measurements and spinal cord sensitivity to provide personalized, objective waveforms for therapy optimization.
Evoke system
This system uses the measured ECAP (ie, the patient’s neural response to electrical stimulation), in a feedback mechanism to provide consistent spinal cord activation. The feedback mechanism adjusts stimulation current continuously, millions of times per day and automatically to maintain a target ECAP amplitude during physiological changes and movement. By maintaining the neural response within a narrow range, abrupt changes in stimulation (over or understimulation) resulting from the movement of the electrode with respect to the spinal cord during physiological changes and movement are minimized.
Participants
Patients with chronic back and/or leg pain (with or without previous back surgery) were consented at 5 clinical sites in Australia. Patients were screened to determine if they met the following criteria (a full list is available on the trial registry website): a diagnosis of chronic, intractable pain (VAS ≥ 6 cm for the past week) that was refractory to conservative therapy for at least 3 months, and having had stable prescription pain medication dosage(s) for at least 4 weeks. Patients with a contraindication to SCS; a medical, psychiatric, or social condition that was likely to interfere with study conduct or treatment outcome evaluation, or involvement in litigation involving their pain condition, were excluded.
Data management and analysis
The study was powered to demonstrate programmability using the closed‐loop system in at least 80% of patients (assuming a true effect size of 90%) with a power of 0.85. Throughout the study, data were processed according to standard data management procedures and monitored periodically by an independent clinical research organization to ensure data quality. Standardized questionnaires were analyzed consistent with their validated methodology. Along with raw scores and percent change from baseline, VAS data were also analyzed as responders (≥ 50% pain reduction) and high responders (≥ 80% pain reduction). Paired t‐tests (against baseline) were performed in SAS Enterprise Guide 7.1 to determine if the mean change from baseline was significantly different from 0 at an alpha of 0.05. Results presented as mean (± standard deviation) unless otherwise noted.
RESULTS
Patients, demographics, and baseline characteristics
Of 50 implanted subjects, 38 (76%) completed the full 24‐month study period: 3 subjects did not consent to study participation beyond the original 12‐month follow‐up period, 3 subjects withdrew consent, 3 subjects were exited due to adverse events, 1 subject was withdrawn by the investigator, 1 subject had a device failure (damage to the device subsequent to use of electrocautery), and 1 subject missed the 24 month assessments and was subsequently exited (see Figure 1).
FIGURE 1.
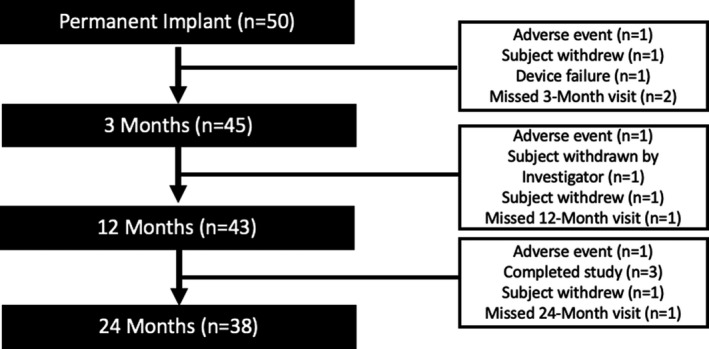
Study flow chart for the permanently implanted patients. Note: Missing visit means that the subjects still in the study and only missed that particular visit. The other reasons in the right boxes resulted in the exit of the subject from the study.
Demographics and baseline characteristics for the cohort of implanted patients are presented in Table 1. Persistent or recurrent pain following spinal surgery (failed back surgery syndrome [FBSS]) was the main diagnosis across the cohort (56.0%), and the lower back was the most commonly reported primary pain area (78.0%).
TABLE 1.
Baseline Demographics and Characteristics for Permanently Implanted and 24‐Month Completer Patients
| Implanted Patients N = 50 | 24‐Month Patients N = 38 | |
|---|---|---|
| Age (years) at enrollment | ||
| Mean (SD) | 56.7 (12.2) | 55.7 (11.9) |
| Gender, n (%) | ||
| Male | 23 (46.0) | 19 (50.0) |
| Female | 27 (54.0) | 19 (50.0) |
| Primary diagnosis, n (%) | ||
| FBSS | 28 (56.0) | 20 (52.6) |
| Radiculopathy | 9 (18.0) | 8 (21.1) |
| Other | 13 (26.0)a | 10 (26.3)b |
| Primary region of pain, n (%) | ||
| Lower back | 39 (78.0) | 27 (71.1) |
| Leg | 8 (16.0) | 8 (21.1) |
| Foot | 3 (6.0) | 3 (7.9) |
| Prior history of SCS, n (%) | ||
| Yes | 3 (6.0) | 3 (7.9) |
| No | 47 (94.0) | 35 (92.1) |
| Duration (years) of pain | ||
| Mean (SD) | 15.0 (11.0) | 16.2 (11.5) |
Abbreviations: FBSS, failed back surgery syndrome; SCS, spinal cord stimulation; SD, standard deviation.
Other diagnoses: Discogenic back (or lower back) pain/internal disc disruption (n = 5), lumbar spondylosis (n = 4), lumbar degenerative disease (n = 1), neuropathic pain/neuropathic low back pain post trauma (n = 1), peripheral neuropathy (n = 1), and sciatica and gluteal tendinopathy (n = 1).
Other diagnoses: Discogenic back (or lower back) pain/internal disc disruption (n = 4), lumbar spondylosis (n = 2), lumbar degenerative disease (n = 1), neuropathic pain/neuropathic low back pain post trauma (n = 1), peripheral neuropathy (n = 1), and sciatica and gluteal tendinopathy (n = 1).
Pain relief outcomes
Among all permanently implanted patients (Table 2), mean rating of back pain was 81.3 mm (± 9.5) at baseline (n = 46 patients). After 24 months of treatment, back pain rating was reduced by 62.5 mm (± 26.5, P < 0.001) to 18.6 (± 25.9), a mean percent reduction of 77.3% (± 30.6). At 24 months, 85.3% of patients were back pain responders (≥ 50% pain reduction), with 67.6% being classified as high responders (≥ 80% pain reduction). Individual patient responses for back pain at 24 months are shown in Figure 2. Similar results were observed for leg pain and overall pain (see Table 2, and Figures 3 and 4). We conducted a sensitivity analysis using a last value carried forward (LVCF) imputation method (not shown) and found no significant differences in the results.
TABLE 2.
Summary of Back, Leg, and Overall Pain Visual Analogue Scale Scores Over Time for Permanently Implanted Patients
| Baseline | 3‐Month | 12‐Month | 24‐Month | |
|---|---|---|---|---|
| Back pain | ||||
| N | 46 | 41 | 39 | 34 |
| Mean raw VAS score, mm (SD) | 81.3 (9.5) | 24.9 (22.1) | 22.7 (25.7) | 18.6 (25.9) |
| Mean percent improvement in VAS scores (SD) | — | 69.2 (27.6) | 72.0 (31.0) | 77.3 (30.6) |
| Mean improvement in VAS scores, mm (SD, P value) | — | 56.7 (23.6, P < 0.001) | 57.9 (26.1, P < 0.001) | 62.5 (26.5, P < 0.001) |
| Responders (≥ 50% pain reduction) % | — | 75.6 | 76.9 | 85.3 |
| High responders (≥ 80% reduction) % | — | 53.7 | 56.4 | 67.6 |
| Leg pain | ||||
| N | 35 | 32 | 29 | 26 |
| Mean raw VAS score, mm (SD) | 77.7 (10.8) | 18.6 (19.0) | 21.1 (25.1) | 15.8 (22.0) |
| Mean percent improvement in VAS scores (SD) | — | 75.7 (24.3) | 72.1 (33.0) | 79.0 (30.3) |
| Mean improvement in VAS scores, mm (SD, P value) | — | 59.6 (22.0, P < 0.001) | 56.6 (27.6, P < 0.001) | 63.0 (26.0, P < 0.001) |
| Responders (≥ 50% pain reduction) % | — | 87.5 | 79.3 | 88.5 |
| High responders (≥ 80% reduction) % | — | 53.1 | 58.6 | 65.4 |
| Overall pain | ||||
| N | 50 | 45 | 43 | 38 |
| Mean raw VAS score, mm (SD) | 81.3 (11.2) | 22.8 (19.2) | 21.0 (22.3) | 15.3 (20.6) |
| Mean percent improvement in VAS scores (SD) | — | 71.2 (27.0) | 73.6 (28.0) | 81.2 (24.0) |
| Mean improvement in VAS scores, mm (SD, P value) | — | 58.6 (22.3, P < 0.001) | 59.8 (24.7, P < 0.001) | 66.1 (22.7, P < 0.001) |
| Responders (≥ 50% pain reduction) % | — | 80.0 | 81.4 | 89.5 |
| High responders (≥ 80% reduction) % | — | 42.2 | 53.5 | 68.4 |
P values resulting from paired t‐test that the mean change from baseline was significantly different from 0 with an alpha of 0.05.
Abbreviations: FBSS, failed back surgery syndrome; SCS, spinal cord stimulation; SD, standard deviation; VAS, visual analogue scale.
FIGURE 2.
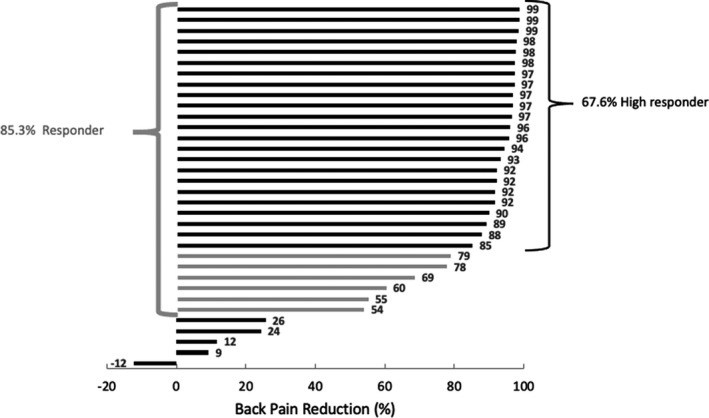
Individual back pain reduction for all patients who completed the 24‐month follow‐up visit. Patients having scored a pain reduction between 50% and 80% are marked in light grey.
FIGURE 3.
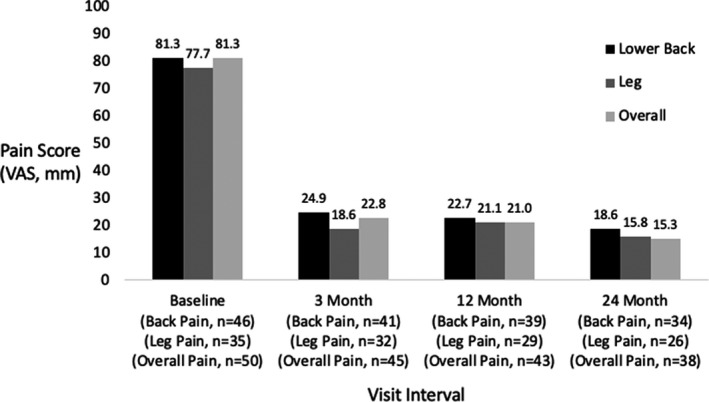
Average pain scores for the permanently implanted patients over time for lower back, leg, and overall pain. VAS, Visual Analogue Scale.
FIGURE 4.
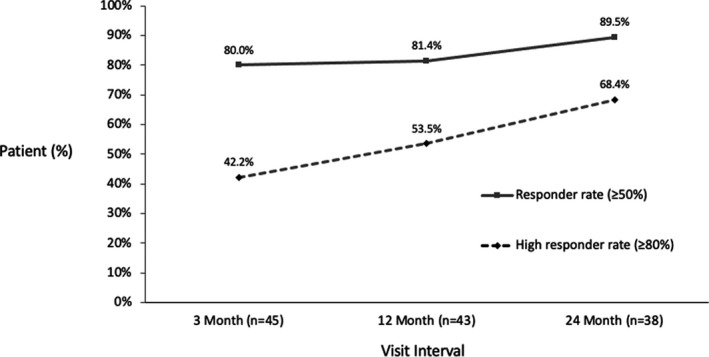
Responder and high responder rates for the permanently implanted patients for overall pain over time.
Other patient‐reported outcomes
Significant and clinically important quality of life improvements were observed for BPI, EQ‐5D‐5L, ODI, and PSQI for permanently implanted patients at 24 months compared with baseline. Outcomes at 24 months are described below, and outcomes at other timepoints can be found in Table 3 and Figure 5. Values are mean (± standard deviation) unless otherwise noted.
TABLE 3.
Summary of Secondary Outcomes Over Time for Permanently Implanted Patients
| Baseline | 3‐Month | 12‐Month | 24‐Month | |
|---|---|---|---|---|
| BPI | ||||
| N | 50 | 45 | 43 | 38 |
| Mean severity score (SD) | 6.8 (1.1) | 3.3 (2.0) | 3.1 (2.1) | 2.8 (2.6) |
| Mean change from baseline, severity score (SD, P value) | — | 3.5 (1.7, P < 0.001) | 3.6 (1.9, P < 0.001) | 3.9 (2.9, P < 0.001) |
| Mean interference score (SD) | 7.1 (1.6) | 3.5 (2.7) | 3.2 (2.6) | 2.7 (2.8) |
| Mean change from baseline, interference score (SD, P value) | — | 3.5 (2.6, P < 0.001) | 3.8 (2.8, P < 0.001) | 4.2 (3.0, P < 0.001) |
| EQ‐5D‐5L | ||||
| N | 50 | 45 | 43 | 38 |
| Mean EQ index score (SD) | 0.404 (0.215) | 0.637 (0.193) | 0.633 (0.223) | 0.645 (0.277) |
| Mean change from baseline, EQ index score (SD, P value) | — | 0.233 (0.245, P < 0.001) | 0.214 (0.213, P < 0.001) | 0.221 (0.288, P < 0.001) |
| Minimally important difference from baseline, EQ index score (≥ 0.074) % | — | 80.0 | 88.4 | 81.6 |
| Mean EQ Health VAS score (SD) | 53.3 (20.6) | 73.2 (16.9) | 71.4 (21.9) | 77.1 (21.1) |
| Mean change from baseline, EQ Health VAS (SD, P value) | — | 18.4 (25.1, P < 0.001) | 17.4 (26.8, P < 0.001) | 22.2 (31.4, P < 0.001) |
| ODI | ||||
| N | 50 | 44 | 43 | 38 |
| Mean ODI score (SD) | 52.3 (12.3) | 34.6 (13.7) | 31.2 (16.1) | 31.5 (20.7) |
| Mean change from baseline, ODI score (SD, P value) | — | 17.1 (11.9, P < 0.001) | 20.3 (13.9, P < 0.001) | 18.4 (20.3, P < 0.001) |
| Minimum detectable change from baseline, ODI (≥ 10%) % | — | 70.5 | 76.7 | 71.1 |
| PSQI | ||||
| N | 50 | 45 | 42 | 38 |
| Mean PSQI score (SD) | 12.0 (4.2) | 8.4 (4.4) | 8.6 (5.4) | 7.8 (5.0) |
| Mean change from baseline, PSQI global score (SD, P value) | — | 3.5 (4.6, P < 0.001) | 3.1 (4.5, P < 0.001) | 3.8 (5.0, P < 0.001) |
| Clinically meaningful change from baseline (reduction ≥ 3 from baseline) % | — | 64.4 | 52.4 | 57.9 |
P values resulting from paired t‐test that the mean change from baseline was significantly different from 0 with an alpha of 0.05.
Abbreviations: BPI, Brief Pain Inventory; EQ‐5D‐5L, EuroQOL instrument; ODI, Oswestry Disability Index; PSQI, Pittsburgh Sleep Quality Index; SD, standard deviation; VAS, visual analogue scale.
FIGURE 5.
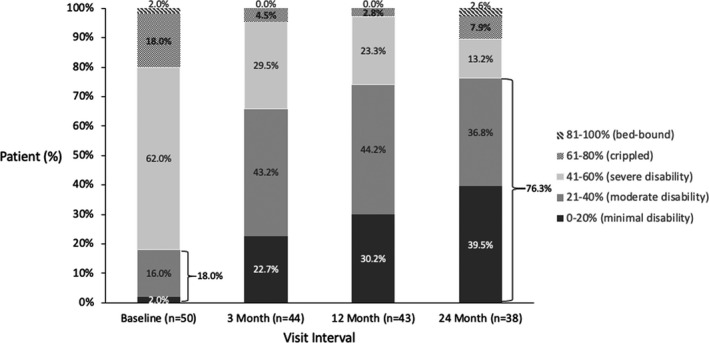
Disability as measured by the Oswestry Disability Index (ODI) score for the permanently implanted patients over time.
The mean BPI severity score, a measure to assess the severity of pain and the impact on pain on daily function, was more than halved over the 24‐month follow‐up period, with a mean change of 3.9 (± 2.9, P < 0.001). The mean BPI interference score decreased by 4.2 (± 3.0, P < 0.001) from a baseline of 7.1 (± 1.6).
The mean EQ‐5D‐5L index score, a standardized measure of health status, increased significantly from baseline to 24 months by 0.221 (± 0.288, P < 0.001); similarly, the EQ‐5D‐5L Health VAS score increased significantly by 22.2 (± 31.4, P < 0.001). At 24 months, 81.6% of patients experienced at least a minimally important difference (≥ 0.074) in EQ‐5D‐5L index score.12
The mean ODI score, which quantifies disability for low back pain, decreased by 18.4 (± 20.3, P < 0.001) from baseline to 24 months and more than 70% of the patients experienced the minimal detectable difference of 10 points9 or greater in ODI compared to baseline. This resulted in a large shift of the patient population toward lower disability, with 76.3% of implanted patients being only minimally or moderately disabled at 24 months, compared with 18.0% at baseline (Figure 5).
Sleep quality, as measured by the mean PSQI score, was also improved from 12.0 (± 4.2) at baseline to 7.8 (± 5.0) at 24 months, with 22 patients (57.9%) having a clinically meaningful PSQI change at 24 months (≥ 3 point reduction) compared with baseline.13
Opioid reduction
It will be noted that opioid reduction was not an aim of this study and medication was therefore adjusted as per standard of care, however, significant changes were observed. At baseline, 76.0% (38/50) of permanently implanted patients were on opioids with an average daily dose of 62.9 MME/day. The average opioid use decreased throughout the study to 29.1 MME/day after 24 months of treatment (Figure 6). Of those patients who were on opioids at baseline, 82.8% (24/29) had eliminated or reduced their opioid dose at the 24‐month visit (Figure 7).
FIGURE 6.
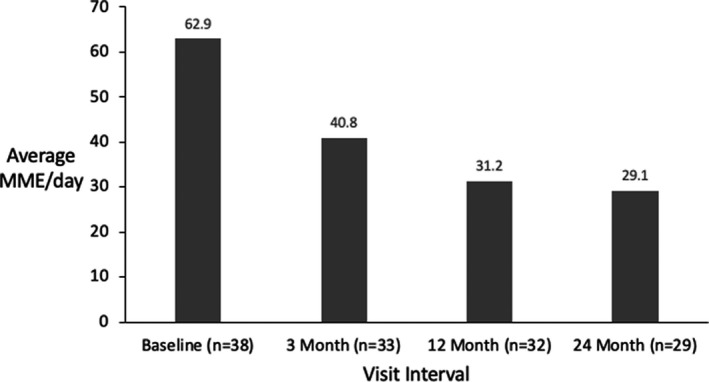
Average morphine milligram equivalent (MME) per day for the permanently implanted patients over time. MME, Morphine Milligram Equivalent.
FIGURE 7.
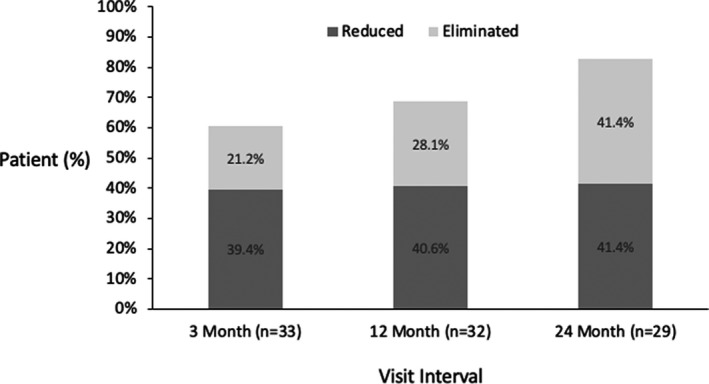
Proportion of permanently implanted patients with opioid use at baseline who reduced or eliminated use over time.
Following the Australian FPM guidelines published in 2015,14 we analyzed the opioid reduction by risk group. The average opioid use in the high‐risk group (≥ 100 MME/day) dropped from 176.5 MME/day to 77.1 MME/day without compromising their pain relief (Figure 8). At the end of their participation in the study, only 2 out of 8 high‐risk group patients remained in that group.
FIGURE 8.
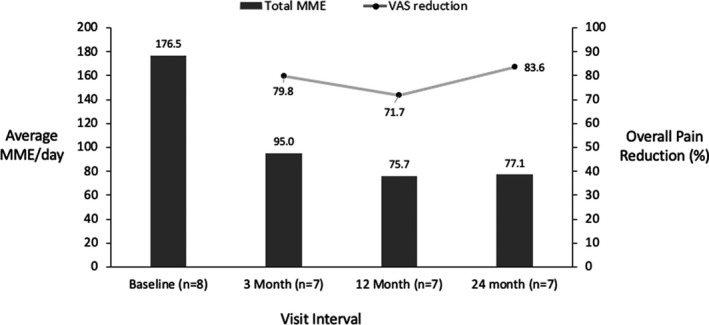
Opioid use and pain relief for the high‐risk group (morphine milligram equivalent [MME] >100 mg/day) for permanently implanted patients over time. MME, Morphine Milligram Equivalent; VAS, Visual Analogue Scale
Patients in the medium‐risk category at baseline (≥ 40 MME/day < 100) reduced their average medication use from 59.1 MME/day to 27.8 MME/day at 24 months without compromising their pain relief (Figure 9). Thus, patients were able to shift to lower risk groups on average.
FIGURE 9.
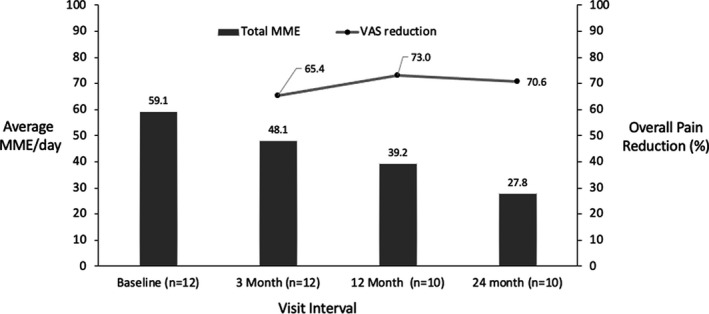
Opioid use and pain relief for the medium‐risk group (40 ≤ morphine milligram equivalent [MME] <100 mg/day) over time for permanently implanted patients. MME, Morphine Milligram Equivalent; VAS, Visual Analogue Scale
ECAP amplitude data
As at 1 month (primary outcome visit interval), closed‐loop stimulation was programmable in all patients at all subsequent visits. The most frequent ECAP amplitudes (the “mode” of the distribution) for the preferred program of each patient during the week prior to the scheduled visit were calculated. The median of the most frequent ECAP amplitude used by patients was 22.5, 28.5, and 25.5 µV at the 3, 12, and 24‐month visits, respectively. Time spent within the therapeutic window across scheduled visits is displayed in Figure 10. At the 3, 12, and 24‐month follow‐up visits, patients were in the therapeutic window a median of 96.7%, 84.9%, and 90.2% of the time, respectively. Subjects were using their devices more than 50% of the time during the week prior to the 3, 12, and 24‐month visits, respectively.
FIGURE 10.
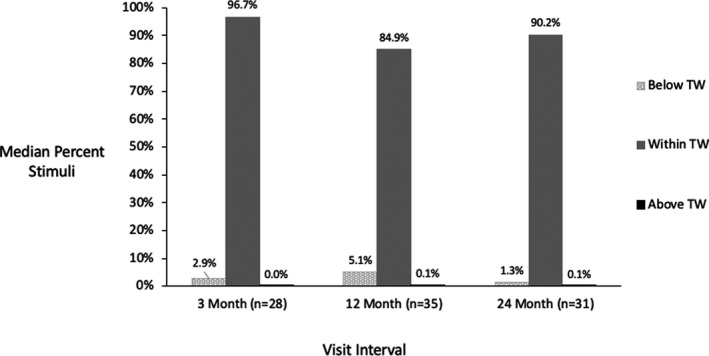
Median time below, within, and above the therapeutic window over time. TW, Therapeutic Window.
Programming
Beside the scheduled follow‐up visits, patients could come back to the clinic for reprogramming if requested or required. In the first month, patients were reprogrammed on average 3 times, and the need for reprogramming decreased by almost a factor of 6 after the first month (Figure 11). In the 3 months leading up to their final visit, the need for reprogramming across the cohort fell to an average of 0.06 visits, which shows the need for reprogramming decreased to less than one visit in a year for each patient.
FIGURE 11.
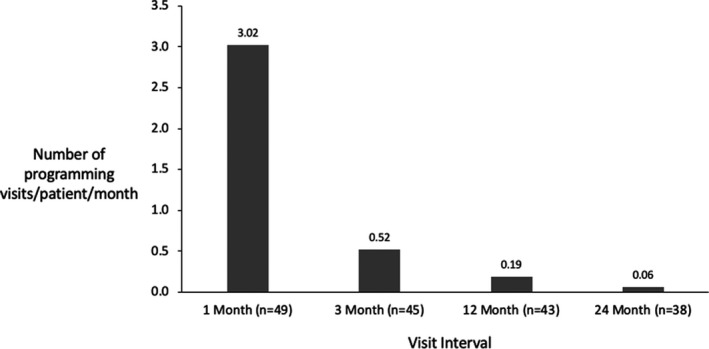
Programming events (including scheduled and unscheduled visits) over time.
Safety outcomes
Among the permanently implanted population, 2 (4.0%) study‐related serious adverse events (SAEs) were reported. One patient developed an allergic reaction to titanium after the implant, and the second experienced postoperative wound dehiscence following the implant procedure due to poor skin integrity. Both SAEs resolved with treatment.
No unanticipated adverse events were recorded, and the type, rate, nature, and severity of adverse events that have occurred in the Avalon study were consistent and comparable with other SCS device studies and to reported adverse events in the literature.15
DISCUSSION
The Avalon study results show a remarkable maintenance of pain relief and other patient‐reported outcomes, including quality of life, function, sleep, and medication usage, over a 24‐month period, and gives support to the 12‐month results of both the Avalon and the Evoke study.5, 6 A large reduction in pain medication use was observed across study patients, and, whereas overall opioid consumption halved on average, pain relief was not negatively affected by the drop in medication. This included patients in the high‐risk opioid use group (≥ 100 MME/day), who dramatically decreased their opioid intake whilst maintaining an average pain relief above 70% throughout the study and an average reduction in pain of over 80% at 24 months. This is an encouraging result and puts closed‐loop SCS forward as a powerful tool to help reduce or eliminate the use of opioids and their associated side effects.
The sustained pain relief translates into a responder rate of 89.5% at 24 months. Looking beyond the classic responder definition, the study has shown a steady increase of the proportion of patients falling into the high responder category (≥ 80% pain reduction), from 42.2% at 3 months to 68.4% at 24 months. Given these results, it is important to consider whether the efficacy of treatments for neuropathic pain should be assessed against more stringent standards than the “50% responder” metric. The high levels of pain relief were accompanied by improvements in all measures of patient wellbeing. Ongoing research using a larger patient pool will investigate whether the degree of pain relief correlates with the degree of improvements in wellbeing when using the Evoke closed‐loop SCS system.
We postulate that the steady level of neural activation achieved with this closed‐loop SCS is in large part responsible for the observed outcomes. Closed‐loop SCS based on ECAP measurements provides objectivity during programming and the avoidance of over and understimulation as the stimulation level stayed in the therapeutic window more than 90% of the time on average. Alternative SCS systems are trying to address overstimulation by exploring sub‐perception stimulation paradigms. Although overstimulation can certainly be avoided that way, it does not allow assessment of the neural activation obtained and optimization relies solely on subjective patient feedback. A system which monitors the level of neural activation gives the clinician a set of objective tools for troubleshooting and eliminates some variables in the complexity of programming spinal cord stimulators for pain relief.
A weakness of this study is its single‐arm nature, which does not allow for comparison with a device without feedback mechanism. The Evoke study, currently underway, addresses this shortcoming by comparing closed‐loop SCS therapy to systems with the closed‐loop mechanism disabled (open‐loop SCS) in a double‐blind, randomized controlled trial. Results out to 12‐months have shown significantly higher therapeutic benefits of closed‐loop SCS compared to open‐loop SCS with outcomes in the closed‐loop arm similar to those found in the Avalon study.6 The 24‐month results of the Evoke study are in preparation for publication. It should be noted that although this study was a single‐arm study where a placebo effect may provide some patient benefit, the excellent outcomes over the long duration of the study, especially when coupled with the comparability of the results to a double‐blinded study showing superiority of ECAP‐based closed‐loop SCS over open‐loop SCS, indicates that these results are likely the result of a robust response to the ECAP‐based SCS therapy. Furthermore, the patient usage and spinal cord activation levels provide objective evidence of therapy delivery.
The completion of this study permits a fair assessment of the adverse event profile. Evoke closed‐loop SCS has been shown to be both safe and effective and has a profound effect on pain relief and general wellbeing for patients with chronic pain.
Finally, ECAP recordings have applications in a wide range of neurophysiological research questions. Although this study did not set out to explore the use of ECAP recordings to investigate the mechanisms of action of SCS, or dive deeper into the neurophysiology of the dorsal columns, we hope that the positive results found in this study will encourage further development and research.
CONFLICTS OF INTEREST
C.B. reports serving as a consultant for Sequirus; and serving as an investigator on sponsored research for Abbott, Medtronic Inc, Phosphagenics, RRMedsciences, Saluda Medical Pty. Ltd., and Spinal Modulation. M.R. reports serving as a consultant for Abbott, Boston Scientific, Mainstay Medical, Medtronic Inc, Nevro Corp., Presidio Medical, Saluda Medical Pty. Ltd., and Stimwave. M.J.C. reports serving as a consultant for Saluda Medical. N.T. reports serving as a consultant for Abbott and Boston Scientific. L.H. has no relevant financial relationships to disclose. R.M. has no relevant financial relationships to disclose. T.B. reports being a consultant for Medtronic, Abbott and NEVRO. RS reports serving as a consultant for Abbott, Medtronic, Nevro, and Seqirus. E.H., G.E.G., N.H.S., and J.P. are employees of Saluda Medical. L.P. reports serving as a consultant for Medtronic, Sollis, and Circuit Tx; being a consultant with stock options for Nalu; serving as a consultant and medical monitor for Saluda Medical; being a principal investigator for the Abbott DRG study; and serving as a past consultant for StimWave and past principal investigator and shareholder for Spinal Modulation.
ACKNOWLEDGEMENTS
The authors thank the following for their dedication to the study and attention to detail in collecting data: Dominic Bailey and the team at Genesis Research, Linda Critchley and Kim Somerville at Royal North Shore Hospital Pain Management and Research Centre, Tom Perkins and Rosemary Kingston at Precision Brain Spine and Pain Centre, and Morgan Weaving at Inner West Pain Centre. In addition, the authors would like to acknowledge Dr. Martine O’Neill, Dr. Rebecca Martin, and Professor Peter Teddy for the contribution to enrollment. This study was funded by Saluda Medical Pty Ltd.
REFERENCES
- 1.Deloitte Access Economics . The cost of pain in Australia. Published online 2019:121. [Cited 2020 Jan 7]. Available from: https://www2.deloitte.com/au/en/pages/economics/articles/cost‐pain‐australia.html.
- 2.Committee on Pain Management and Regulatory Strategies to Address Prescription Opioid Abuse, Board on Health Sciences Policy, Health and Medicine Division, National Academies of Sciences, Engineering, and Medicine . Chapter 5. Evidence on Strategies for Addressing the Opioid Epidemic. In: Bonnie RJ, Ford MA, Phillips JK, editors. Pain management and the opioid epidemic: Balancing societal and individual benefits and risks of prescription opioid use. Washington, DC: National Academies Press, 2017; p. 24781. 10.17226/24781 [DOI] [PubMed] [Google Scholar]
- 3.Hegarty D. Spinal cord stimulation: the clinical application of new technology. Anesthesiol Res Pract. 2012;2012:375691. 10.1155/2012/375691. [DOI] [PMC free article] [PubMed] [Google Scholar]
- 4.Melzack R, Wall PD. Pain mechanisms: a new theory. Science. 1965;150(3699):971–9. [DOI] [PubMed] [Google Scholar]
- 5.Russo M, Brooker C, Cousins MJ, Taylor N, Boesel T, Sullivan R,, et al. Sustained long‐term outcomes with closed‐loop spinal cord stimulation: 12‐month results of the prospective, multicenter, open‐label Avalon study [published correction appears in Neurosurgery. 2020 Sep 1;87(3):611]. Neurosurgery. 2020;87(4):E485–95. 10.1093/neuros/nyaa003. [DOI] [PMC free article] [PubMed] [Google Scholar]
- 6.Mekhail N, Levy RM, Deer TR, Kapural L, Li S, Amirdelfan K, et al. Long‐term safety and efficacy of closed‐loop spinal cord stimulation to treat chronic back and leg pain (Evoke): a double‐blind, randomised, controlled trial. Lancet Neurol. 2020;19(2):123–34. 10.1016/S1474-4422(19)30414-4. [DOI] [PubMed] [Google Scholar]
- 7.Price DD, McGrath PA, Rafii A, Buckingham B. The validation of visual analogue scales as ratio scale measures for chronic and experimental pain. Pain. 1983;17(1):45–56. [DOI] [PubMed] [Google Scholar]
- 8.Tan G, Jensen MP, Thornby JI, Shanti BF. Validation of the Brief Pain Inventory for chronic nonmalignant pain. J Pain. 2004;5(2):133–7. 10.1016/j.jpain.2003.12.005. [DOI] [PubMed] [Google Scholar]
- 9.Fairbank JC, Pynsent PB. The Oswestry disability index. Spine. 2000;25(22):2940–52; discussion 2952. [DOI] [PubMed] [Google Scholar]
- 10.Buysse DJ, Reynolds CF, Monk TH, Berman SR, Kupfer DJ. The Pittsburgh Sleep Quality Index: a new instrument for psychiatric practice and research. Psychiatry Res. 1989;28(2):193–213. [DOI] [PubMed] [Google Scholar]
- 11.EuroQol Group . EuroQol – a new facility for the measurement of health‐related quality of life. Health Policy. 1990;16(3):199–208. [DOI] [PubMed] [Google Scholar]
- 12.Walters SJ, Brazier JE. Comparison of the minimally important difference for two health state utility measures: EQ‐5D and SF‐6D. Qual Life Res. 2005;14(6):1523–32. [DOI] [PubMed] [Google Scholar]
- 13.Buysse DJ, Germain A, Moul DE, Franzen PL, Brar LK, Fletcher ME, et al. Efficacy of brief behavioral treatment for chronic insomnia in older adults. Arch Intern Med. 2011;171(10):887–95. 10.1001/archinternmed.2010.535. [DOI] [PMC free article] [PubMed] [Google Scholar]
- 14.Faculty of Pain Medicine ANZCA . Recommendations regarding the use of Opioid Analgesics in patients with chronic Non‐Cancer Pain. Published online 2015. [Cited 2020 Jan 7]. Available from: https://web.archive.org/web/20200307095309/http://fpm.anzca.edu.au/documents/pm1‐2010.pdf.
- 15.Kumar K, Taylor RS, Jacques L, Eldabe S, Meglio M, Molet J, et al. The effects of spinal cord stimulation in neuropathic pain are sustained: a 24‐month follow‐up of the prospective randomized controlled multicenter trial of the effectiveness of spinal cord stimulation. Neurosurgery. 2008;63(4):762–70. 10.1227/01.NEU.0000325731.46702.D9. [DOI] [PubMed] [Google Scholar]


