

Abstract
Aims
We aimed to derive and validate clinically useful clusters of patients with heart failure with preserved ejection fraction (HFpEF; left ventricular ejection fraction ≥50%).
Methods and results
We derived a cluster model from 6909 HFpEF patients from the Swedish Heart Failure Registry (SwedeHF) and externally validated this in 2153 patients from the Chronic Heart Failure ESC‐guideline based Cardiology practice Quality project (CHECK‐HF) registry. In SwedeHF, the median age was 80 [interquartile range 72–86] years, 52% of patients were female and most frequent comorbidities were hypertension (82%), atrial fibrillation (68%), and ischaemic heart disease (48%). Latent class analysis identified five distinct clusters: cluster 1 (10% of patients) were young patients with a low comorbidity burden and the highest proportion of implantable devices; cluster 2 (30%) patients had atrial fibrillation, hypertension without diabetes; cluster 3 (25%) patients were the oldest with many cardiovascular comorbidities and hypertension; cluster 4 (15%) patients had obesity, diabetes and hypertension; and cluster 5 (20%) patients were older with ischaemic heart disease, hypertension and renal failure and were most frequently prescribed diuretics. The clusters were reproduced in the CHECK‐HF cohort. Patients in cluster 1 had the best prognosis, while patients in clusters 3 and 5 had the worst age‐ and sex‐adjusted prognosis.
Conclusions
Five distinct clusters of HFpEF patients were identified that differed in clinical characteristics, heart failure drug therapy and prognosis. These results confirm the heterogeneity of HFpEF and form a basis for tailoring trial design to individualized drug therapy in HFpEF patients.
Keywords: Heart failure with preserved ejection fraction, Comorbidities, Treatment, Latent class analysis, Clusters, Phenotyping, External validation
Latent class analysis identified 5 patient clusters with differences in clinical characteristics in 6909 patients from the Swedish Heart Failure Registry. BMI, body mass index; COPD, chronic obstructive pulmonary disease; eGFR, estimated glomerular filtration rate; HFpEF, heart failure with preserved ejection fraction; IHD, ischaemic heart disease; NYHA, New York Heart Association.

Introduction
Left ventricular ejection fraction (LVEF) is the most commonly used marker to distinguish clinical phenotypes and determine therapy in heart failure (HF). Based on LVEF, patients are classified into HF with reduced ejection fraction (HFrEF; LVEF <40%), mid‐range ejection fraction (HFmrEF; LVEF 40–49%), and preserved ejection fraction (HFpEF; LVEF ≥50%).1 In contrast to HFrEF, LVEF seems to insufficiently reflect the heterogeneity of this chronic disease in patients at the higher end of the ejection fraction spectrum, i.e. HFmrEF and especially HFpEF.2, 3
To date, all major clinical trials in HFpEF were neutral.4 However, in subgroup or post‐hoc analyses, HFrEF drugs seemed to be effective in HFmrEF but not HFpEF.5, 6, 7, 8 The heterogeneity in HFpEF pathophysiology is proposed as one of the key reasons for the failure of clinical trials to establish effective interventions. It is suggested that treatment in HFpEF patients should therefore be matched to distinct phenotypes, thus identifying patient groups most likely to benefit from targeted interventions. Possible effective HFpEF therapy could thus be determined by the identification of distinct HFpEF patient clusters.9, 10 Previous studies were conducted in smaller and selected HFpEF populations or included many characteristics that are often unavailable clinically or in commonly used registries.9, 10, 11, 12, 13, 14
The aim of this study was to derive and validate clinically useful HFpEF clusters with advanced analytics that distinguish clinical characteristics and outcomes based on easily accessible characteristics, creating HFpEF clusters that are widely applicable in different settings, including clinical trial design.
Methods
Derivation cohort
The Swedish Heart Failure Registry (SwedeHF) has been previously described in detail.15 Briefly, SwedeHF was established in 2000 and broadly implemented throughout Sweden by 2003. The only inclusion criterion is clinician‐judged HF. Patients are registered at discharge from hospital or after outpatient clinic visit on a web‐based case report form and entered into the database (managed by Uppsala Clinical Research Center, Uppsala, Sweden). All permanent residents in Sweden have unique personal identification numbers that allow linking of disease‐specific health registries and governmental health and statistical registries. SwedeHF was linked to the National Patient Registry and the Cause of Death Registry, which provided additional data on baseline comorbidities, cause‐specific outcomes and all‐cause mortality.
In this study, we included 6909 patients with known LVEF ≥50% and registered between 1 January 2013 and 31 December 2016 (online supplementary Figure S1 A). We excluded patients with in‐hospital death (n = 215), unknown medication treatment (n = 215) and if a patient had multiple registrations we only considered the first registration (n = 2733 multiple registrations excluded). This analysis received ethics committee approval. Patients are informed of entry into national quality registries and allowed to opt out.
External validation cohort
The Chronic Heart Failure ESC‐guideline based Cardiology practice Quality project (CHECK‐HF) registry is a cross‐sectional registration of unselected patients from 34 Dutch hospitals with the diagnosis of chronic HF treated at outpatient HF clinics (96%) or general cardiology outpatient clinics of the same hospitals (4%) in the period between September 2013 and September 2016.16 As this was a cross‐sectional registry, no follow‐up data were available.
Patients were included if they were 18 years or older and had a HF diagnosis based on the European Society of Cardiology guidelines.1 We included 2153 patients with HFpEF, classified as a LVEF ≥50% with no previously known reduced LVEF (online supplementary Figure S1 B). We excluded 114 patients with unknown medication treatment. No informed consent of the participants in this registry was required. This study was approved by the medical ethics committee 2017 at Maastricht University Medical Center (Maastricht, The Netherlands).
Statistical analyses
Baseline continuous variables are presented as mean ± standard deviation, or median with interquartile range (IQR); categorical data are presented as counts and percentages. Continuous variables were compared with a t‐test or Kruskal–Wallis test, categorical variables were compared with a Chi‐square test. All analyses were performed using R version 4.0.2.
Latent class analysis (LCA) with the poLCA package was used to identify clusters of individuals with similar clinical profiles. The clustering model was estimated from the fully observed cases (n = 2879) and the model was then applied to the whole population. Clusters with all patients were derived using maximum‐likelihood estimation over 10 iterations to identify the most common patterns of the pre‐defined variables for a range of 2–7 subgroups with a minimum of 5% of patients assigned to each cluster.
We wielded a pragmatic approach to select the variables for the analyses, based on clinician input and presence of the variable in both registries. We selected the 10 most important features for the analyses with the Boruta package: age (<65 years, 65–75 years, 75–85 years, and >85 years), sex (male/female), New York Heart Association (NYHA) class (I/II vs. III/IV), body mass index (BMI) (<25 kg/m2, 25–30 kg/m2, >30 kg/m2), estimated glomerular filtration rate (eGFR) (<30, 30–60 and >60 mL/min/1.73 m2), and the comorbidities: atrial fibrillation, chronic obstructive pulmonary disease (COPD), diabetes, hypertension, and ischaemic heart disease (yes/no). Variable definitions can be found in online supplementary Table S1. The optimal number of clusters (n = 5) was determined using the first minima of the Bayesian Information Criterion (BIC) and chi‐squared statistic. Pairwise comparisons were used for comparing cluster 2–5 with cluster 1 (reference), significance was determined with P < 0.05 and P‐values were adjusted using the Bonferroni method.
We assessed the association between clusters with the primary endpoint composite of cardiovascular (CV) mortality and HF hospitalization, and the individual components of the composite outcome. For secondary endpoints, we assessed the association between clusters with all‐cause and non‐CV mortality. Outcome definitions can be found in online supplementary Table S1. The cumulative incidence function was used to calculate the incidence for competing events in CV/non‐CV and HF hospitalization/all‐cause mortality. We used a Fine–Grey sub‐distribution hazard model for competing events in CV/non‐CV and HF‐hospitalization/all‐cause mortality. In a sensitivity analysis, we also performed a cause‐specific Cox proportional hazard model censoring for non‐CV, CV and HF hospitalization events, respectively. Results are presented as hazard ratios (HR) with 95% confidence intervals (95% CI) and visualized with cumulative incidence curves, taking into account competing events. We adjusted the analyses for age and sex.
Medication profiles were compared between clusters for the following types of medication: beta‐blockers, mineralocorticoid receptor antagonists (MRAs), diuretics, statins, digoxin, and renin–angiotensin system (RAS) inhibitors [angiotensin‐converting enzyme (ACE) inhibitors and angiotensin II receptor blockers (ARB)]. The clusters found in SwedeHF were validated in CHECK‐HF by applying the subgroup probabilities (online supplementary Table S2) to the validation cohort. Patients were classified according to the highest probability of cluster membership.
Results
Baseline characteristics
Baseline patient characteristics are shown in Table 1. Overall, in SwedeHF, the median age was 80 years [IQR 72–86 years] and 52% were female. Comorbidities were common, of which hypertension (82%), atrial fibrillation (68%) and ischaemic heart disease (48%) were most prevalent. Beta‐blockers were the most frequently prescribed type of HF medication (83%), followed by diuretics (81%) and RAS inhibitors (73%) (Table 1).
Table 1.
SwedeHF and CHECK‐HF baseline patient characteristics
| SwedeHF | % missing | CHECK‐HF | % missing | |
|---|---|---|---|---|
| Patients, n | 6909 | 2153 | ||
| Age (years), median [IQR] | 80.0 [72.0–86.0] | 0 | 77.0 [69.0–84.0] | 0.1 |
| Female sex, n (%) | 3623 (52.4) | 0 | 1170 (54.5) | 0.3 |
| HF measurements | ||||
| NYHA class III/IV, n (%) | 1408 (36.5) | 44.2 | 660 (31.1) | 1.6 |
| NT‐proBNP (pg/mL), median [IQR] | 2031.0 [883.8–4272.3] | 33.1 | 1019.1 [369.5–3187.4] | 73 |
| Implantable devicesa, n (%) | 137 (2.1) | 6 | 104 (8.8) | 45.3 |
| Clinical measurements | ||||
| SBP (mmHg), mean (SD) | 131.5 (21.4) | 1.7 | 134.8 (22.9) | 0.6 |
| DBP (mmHg), mean (SD) | 72.6 (11.9) | 1.7 | 72.7 (12.2) | 0.5 |
| BMI (kg/m2), mean (SD) | 28.2 (6.2) | 26.1 | 28.5 (5.9) | 7.8 |
| <25 | 1674 (32.8) | 599 (30.2) | ||
| 25–29.9 | 1770 (34.7) | 707 (35.6) | ||
| ≥30 | 1659 (32.5) | 680 (34.2) | ||
| eGFR (mL/min/1.73 m2), median [IQR] | 55.9 [40.4–74.2] | 2.5 | 53.6 [36.2–77.0] | 41.4 |
| ≥60 | 2911 (43.2) | 535 (42.4) | ||
| 30–60 | 3102 (46.1) | 538 (42.7) | ||
| <30 | 720 (10.7) | 188 (14.9) | ||
| Comorbidities, n (%) | ||||
| Ischaemic heart disease | 3324 (48.1) | 0 | 616 (29.4) | 2.7 |
| Atrial fibrillation | 4662 (67.5) | 0 | 822 (38.5) | 0.8 |
| Hypertension | 5695 (82.4) | 0 | 1092 (54.6) | 7.1 |
| Valvular disease | 2555 (37.0) | 0 | 532 (25.4) | 7.1 |
| COPD | 1212 (17.5) | 0 | 412 (20.6) | 2.7 |
| Diabetes | 2130 (30.8) | 0 | 645 (32.2) | 7.1 |
| Malignant cancer | 851 (12.3) | 0 | 242 (14.0) | 19.8 |
| Medication use, n (%) | ||||
| Diuretic | 5592 (80.9) | 0 | 1710 (79.4) | 0 |
| RAS inhibitor | 5037 (72.9) | 0 | 1450 (67.3) | 0 |
| Beta‐blocker | 5726 (82.9) | 0 | 1685 (78.3) | 0 |
| MRA | 2108 (30.5) | 0 | 828 (38.5) | 0 |
| Digoxin | 863 (12.5) | 0.2 | 388 (18.0) | 0 |
| Statin | 3036 (44.0) | 0.1 | 1754 (81.5) | 0 |
BMI, body mass index; COPD, chronic obstructive pulmonary disease; DBP, diastolic blood pressure; eGFR, estimated glomerular filtration rate; HF, heart failure; IQR, interquartile range; MRA, mineralocorticoid receptor antagonist; NYHA, New York Heart Association; RAS, renin–angiotensin system; SBP, systolic blood pressure; SD, standard deviation.
Implantable cardioverter‐defibrillator or cardiac resynchronization therapy.
In CHECK‐HF, patients had a median age of 77 years [IQR 69–84 years] and 55% were female. The distribution of most prevalent comorbidities were similar to in SwedeHF. Medication use was also similar, with beta‐blockers and diuretics as most frequently prescribed HF medication (Table 1). Overall, comorbidities were more prevalent in SwedeHF, while implantable devices (implantable cardioverter‐defibrillator and/or cardiac resynchronization therapy) (9%), MRA (39%), digoxin (18%) and statin use (82%) were more prevalent in CHECK‐HF.
Cluster analysis
Based on LCA, a total of five distinct clinical clusters were identified. Out of 6909 patients, a total of 694 patients (10%) were assigned to cluster 1, 2066 patients (30%) to cluster 2, 1709 patients to cluster 3 (25%), 1069 (15%) to cluster 4, and 1371 patients to cluster 5 (20%). The patient characteristics per cluster classification are shown in Table 2. All variables used in the LCA showed high distinctive discrimination between clusters (P < 0.001), this was confirmed in pairwise comparisons between cluster 1 (reference) and clusters 2–5. Median probabilities with IQR for each cluster classification are provided in online supplementary Table S3 and show a clear distinction per cluster.
Table 2.
SwedeHF patient characteristics per cluster
| Cluster 1 | Cluster 2 | Cluster 3 | Cluster 4 | Cluster 5 | P‐value | |
|---|---|---|---|---|---|---|
| Patients, n (%) | 694 (10.0) | 2066 (29.9) | 1709 (24.7) | 1069 (15.5) | 1371 (19.8) | |
| Age (years), median [IQR] | 59.0 [51.0–64.0] | 78.0 [72.0–82.0] | 88.0 [86.0–91.0] | 71.0 [66.0–74.0] | 82.0 [79.0–86.0] | <0.001 |
| Female sex, n (%) | 293 (42.2) | 956 (46.3)† | 1090 (63.8) | 350 (32.7) | 934 (68.1) | <0.001 |
| HF measurements | ||||||
| NYHA class III/IV, n (%) | 69 (14.3) | 277 (22.5) | 365 (44.9) | 255 (43.2) | 442 (60) | <0.001 |
| NT‐proBNP (pg/mL), median [IQR] | 500.0 [158.0–1612.0] | 1685.0 [784.0–3516.5] | 3100.0 [1703.0–6290.8] | 1311.5 [623.0–3175.5] | 2620.0 [1333.0–5300.0] | <0.001 |
| Implantable devicesa, n (%) | 28 (4.2) | 59 (3.1)† | 11 (0.7) | 27 (2.7)† | 12 (0.9) | <0.001 |
| Clinical measurements | ||||||
| SBP (mmHg), mean (SD) | 125.5 (20.0) | 129.6 (20.3) | 133.0 (22.4) | 134.8 (20.6) | 133.0 (22.2) | <0.001 |
| DBP (mmHg), mean (SD) | 74.5 (11.6) | 73.5 (11.6) | 71.7 (12.5) | 73.0 (11.4) | 71.4 (11.9) | <0.001 |
| BMI (kg/m2), mean (SD) | 29.3 (7.1) | 27.0 (5.3) | 23.9 (3.4) | 31.8 (6.6) | 31.5 (5.4) | <0.001 |
| <25 | 133 (28.4) | 534 (35.6) | 824 (66.2) | 108 (12.9) | 75 (7.1) | |
| 25–29.9 | 139 (29.7) | 651 (43.3) | 381 (30.6) | 249 (29.7) | 350 (33.3) | |
| ≥30 | 196 (41.9) | 317 (21.1) | 39 (3.1) | 482 (57.4) | 625 (59.5) | |
| eGFR (mL/min/1.73 m2), median [IQR] | 84.7 [71.5–96.2] | 65.8 [52.1–79.6] | 47.4 [35.9–59.1] | 62.3 [43.7–80.2] | 40.1 [29.8–52.0] | <0.001 |
| >60 | 602 (91.9) | 1245 (62.2) | 397 (23.6) | 556 (53.1) | 111 (8.2) | |
| 30–60 | 40 (6.1) | 754 (37.7) | 1030 (61.3) | 384 (36.7) | 894 (66.3) | |
| <30 | 13 (2.0) | 3 (0.1) | 254 (15.1) | 107 (10.2) | 343 (25.4) | |
| Comorbidities, n (%) | ||||||
| Ischaemic heart disease | 161 (23.2) | 805 (39.0) | 900 (52.7) | 677 (63.3) | 781 (57.0) | <0.001 |
| Atrial fibrillation | 215 (31.0) | 1490 (72.1) | 1269 (74.3) | 555 (51.9) | 1133 (82.6) | <0.001 |
| Hypertension | 318 (45.8) | 1568 (75.9) | 1406 (82.3) | 1036 (96.9) | 1367 (99.7) | <0.001 |
| Valvular disease | 162 (23.3) | 773 (37.4) | 800 (46.8) | 307 (28.7)† | 513 (37.4) | <0.001 |
| COPD | 51 (7.3) | 448 (21.7) | 171 (10.0)† | 276 (25.8) | 266 (19.4) | <0.001 |
| Diabetes | 33 (4.8) | 47 (2.3)† | 133 (7.8) | 1013 (94.8) | 904 (65.9) | <0.001 |
| Malignant cancer | 54 (7.8) | 289 (14.0) | 228 (13.3) | 122 (11.4)† | 158 (11.5)† | <0.001 |
| Medication use, n (%) | ||||||
| Diuretic | 364 (52.4) | 1569 (75.9) | 1510 (88.4) | 896 (83.8) | 1253 (91.4) | <0.001 |
| RAS inhibitor | 549 (79.1) | 1596 (77.3)† | 1099 (64.3) | 832 (77.8)† | 961 (70.1) | <0.001 |
| Beta‐blocker | 556 (80.1) | 1732 (83.8)† | 1349 (78.9)† | 918 (85.9) | 1171 (85.4) | <0.001 |
| MRA | 198 (28.5) | 622 (30.1)† | 471 (27.6)† | 371 (34.7)† | 446 (32.5)† | 0.001 |
| Digoxin | 43 (6.2) | 317 (15.4) | 224 (13.1) | 112 (10.5) | 167 (12.2) | <0.001 |
| Statin | 229 (33.1) | 839 (40.7) | 490 (28.7)† | 776 (72.7) | 702 (51.2) | <0.001 |
BMI, body mass index; COPD, chronic obstructive pulmonary disease; DBP, diastolic blood pressure; eGFR, estimated glomerular filtration rate; HF, heart failure; IQR, interquartile range; MRA, mineralocorticoid receptor antagonist; NYHA, New York Heart Association; RAS, renin–angiotensin system; SBP, systolic blood pressure; SD, standard deviation.
Implantable cardioverter‐defibrillator or cardiac resynchronization therapy.
P‐value for pairwise comparisons did not reach statistical significance (P > 0.05) adjusted for the Bonferroni method for multiple testing.
Cluster 1 could be classified as the young‐low comorbidity burden cluster (Figure 1). Patients in cluster 1 were the youngest (median age 59 years) and were more likely male (58%). These patients had less comorbidities compared to the other clusters, most had NYHA class I/II, low N‐terminal pro‐B‐type natriuretic peptide (NT‐proBNP) values, and normal eGFR (92%). More patients had an implantable device compared to other clusters. Cluster 2 could be seen as an atrial fibrillation‐hypertensive cluster (Figure 1). Patients in cluster 2 had a median age of 77 years and 54% were male. This cluster was characterized by atrial fibrillation (72%) and hypertension (76%), without diabetes (2%) or low eGFR (0.1%). Cluster 3 could be classified as the older‐atrial fibrillation cluster (Figure 1). Patients in cluster 3 were the oldest (median age 88 years), 74% had atrial fibrillation and were more likely female (64%). These patients had the highest NT‐proBNP values but the lowest BMI values compared to the other clusters. Cluster 4 could be classified as a hypertensive‐diabetic cluster (Figure 1). Patients in cluster 4 had a median age of 71 years and were more likely male (67%). Many patients had high BMI values and almost all patients had hypertension (97%) and diabetes (95%). Cluster 5 could be classified as a cardio‐renal cluster (Figure 1). Patients in cluster 5 were older (median age 82 years) and more likely female (68%). These patients more often had NYHA class III/IV (60%), ischaemic heart disease, atrial fibrillation, higher NT‐proBNP and high BMI. All patients had hypertension and a larger proportion of patients had lower eGFR values.
Figure 1.

Patient comorbidity profiles within clusters in SwedeHF. Obesity: body mass index >30 kg/m2. COPD, chronic obstructive pulmonary disease.
We applied the cluster model created in SwedeHF to CHECK‐HF for external validation (Table 3). In CHECK‐HF, compared to SwedeHF, more patients were assigned to cluster 1 (19%), cluster 2 (33%) and cluster 4 (16%), while less patients were assigned to cluster 3 (19%) and cluster 5 (12%). There were more patients with implantable devices in the CHECK‐HF cohort, therefore the percentages were higher, but showed a similar trend. Due to less prevalence of ischaemic heart disease, it only retained an important feature for cluster 4. Median probabilities for each cluster show similar distribution between the derivation and validation cohort (online supplementary Table S3). Overall, the model was robust and we found similar and consistent clusters in the external validation cohort.
Table 3.
CHECK‐HF patient characteristics per cluster
| Cluster 1 | Cluster 2 | Cluster 3 | Cluster 4 | Cluster 5 | P‐value | |
|---|---|---|---|---|---|---|
| Patients, n (%) | 407 (18.9) | 721 (33.5) | 411 (19.1) | 350 (16.3) | 264 (12.3) | |
| Age (years), median [IQR] | 61.0 [54.5–66.0] | 78.0 [74.0–82.0] | 87.0 [86.0–90.0] | 70.0 [66.0–74.0] | 82.0 [79.0–85.0] | <0.001 |
| Female sex, n (%) | 165 (40.5) | 358 (49.8) | 288 (70.2) | 149 (42.8) | 210 (79.8) | <0.001 |
| HF measurements | ||||||
| NYHA class III/IV, n (%) | 51 (12.7) | 135 (19)† | 182 (44.9) | 143 (41.7) | 149 (57.5) | <0.001 |
| NT‐proBNP (pg/mL), median [IQR] | 828.3 [238.5–2105.8] | 847.3 [346.7–1987.0]† | 1742.1 [460.1–5011.7]† | 819.4 [460.4–1682.9]† | 1086.1 [388.3–2748.5]† | 0.002 |
| Implantable devicesa, n (%) | 51 (31.9) | 23 (5.9) | 7 (2.6) | 17 (9.4) | 6 (3.5) | <0.001 |
| Clinical measurements | ||||||
| SBP (mmHg), mean (SD) | 135.8 (21.2) | 134.9 (23.0) | 130.4 (22.1) | 137.6 (24.0) | 136.2 (24.0) | <0.001 |
| DBP (mmHg), mean (SD) | 77.0 (12.2) | 73.2 (12.1) | 68.8 (11.4) | 72.0 (11.7) | 71.6 (12.5) | <0.001 |
| BMI (kg/m2), mean (SD) | 28.9 (6.3) | 27.5 (5.3)† | 24.9 (3.8) | 32.2 (6.0) | 31.2 (5.2) | <0.001 |
| <25 | 105 (27.3) | 231 (34.4) | 208 (56.7) | 29 (8.8) | 26 (11.2) | |
| 25–29.9 | 149 (38.7) | 270 (40.2) | 133 (36.2) | 91 (27.5) | 64 (27.6) | |
| ≥30 | 131 (34.0) | 170 (25.3) | 26 (7.1) | 211 (63.7) | 142 (61.2) | |
| eGFR (mL/min/1.73 m2), median [IQR] | 83.9 [66.4–97.4] | 59.9 [45.7–80.2] | 41.3 [29.3–60.0] | 52.2 [33.6–75.3] | 35.5 [27.2–44.8] | <0.001 |
| >60 | 148 (87.1) | 208 (49.8) | 70 (24.8) | 93 (42.3) | 16 (9.4) | |
| 30–60 | 19 (11.2) | 206 (49.3) | 137 (48.6) | 83 (37.7) | 93 (54.4) | |
| <30 | 3 (1.8) | 4 (1.0) | 75 (26.6) | 44 (20.0) | 62 (36.3) | |
| Comorbidities, n (%) | ||||||
| Ischaemic heart disease | 115 (28.8) | 166 (23.7)† | 99 (25.0)† | 173 (50.7) | 63 (24.4)† | <0.001 |
| Atrial fibrillation | 42 (10.5) | 322 (45.0) | 210 (51.3) | 103 (29.6) | 145 (55.3) | <0.001 |
| Hypertension | 126 (33.4) | 315 (47.1) | 186 (49.9) | 231 (67.7) | 234 (97.1) | <0.001 |
| Valvular disease | 51 (12.8) | 193 (27.6) | 158 (39.9) | 50 (14.7)† | 80 (31.0) | <0.001 |
| COPD | 46 (12.2) | 171 (25.6) | 57 (15.3)† | 92 (27.0) | 46 (19.1)† | <0.001 |
| Diabetes | 39 (10.3) | 57 (8.5)† | 62 (16.6)† | 323 (94.7) | 164 (68.0) | <0.001 |
| Malignant cancer | 44 (12.9) | 82 (14.1)† | 56 (18.2)† | 32 (11.3)† | 28 (13.2)† | 0.159 |
| Medication use, n (%) | ||||||
| Diuretic | 207 (50.9) | 588 (81.6) | 371 (90.3) | 294 (84.0) | 250 (94.7) | <0.001 |
| RAS inhibitor | 275 (67.6) | 517 (71.7)† | 233 (56.7) | 246 (70.3)† | 179 (67.8)† | <0.001 |
| Beta‐blocker | 316 (77.6) | 569 (78.9)† | 304 (74.0)† | 279 (79.7)† | 217 (82.2)† | 0.109 |
| MRA | 107 (26.3) | 288 (39.9) | 184 (44.8) | 132 (37.7) | 117 (44.3) | <0.001 |
| Digoxin | 42 (10.3) | 159 (22.1) | 80 (19.5) | 54 (15.4)† | 53 (20.1) | <0.001 |
| Statin | 362 (88.9) | 584 (81.0) | 289 (70.3) | 319 (91.1)† | 200 (75.8) | <0.001 |
BMI, body mass index; COPD, chronic obstructive pulmonary disease; DBP, diastolic blood pressure; eGFR, estimated glomerular filtration rate; HF, heart failure; IQR, interquartile range; MRA, mineralocorticoid receptor antagonist; NYHA, New York Heart Association; RAS, renin–angiotensin system; SBP, systolic blood pressure; SD, standard deviation.
Implantable cardioverter‐defibrillator or cardiac resynchronization therapy.
P‐value for pairwise comparisons did not reach statistical significance (P > 0.05) adjusted for the Bonferroni method for multiple testing.
Medication profile
The medication use per cluster in SwedeHF is shown in Table 2. Diuretics were prescribed in a large proportion of patients, except for cluster 1, where 52% of the patients had a diuretic. Cluster 3 received less RAS inhibitors, beta‐blockers and MRAs compared to the other clusters. Cluster 4 had the highest proportion of statin users compared to the other clusters.
The medication profile in CHECK‐HF is shown in Table 3. Diuretics, RAS inhibitors and beta‐blockers showed a similar pattern to the derivation cohort. Overall, MRA and statin use was higher in CHECK‐HF compared to SwedeHF, which is also seen in the medication profile from the clusters.
Prognosis
For the overall cohort, median follow‐up time was 1.37 years (95% CI 0.60–2.39). We assessed the association between clusters with the composite outcome, all‐cause mortality, CV mortality, non‐CV mortality and HF hospitalization (Figure 2). All outcomes showed differences in survival between clusters with P < 0.0001 (log‐rank test or K‐sample test for competing events). Cluster 1 had the lowest 3‐year event rates for all outcomes, i.e. 14.8% (95% CI 11.4–18.2) for the composite outcome, 10.0% (95% CI 7.1–13.0) for all‐cause mortality, 3.3% (95% CI 1.4–5.2) for CV mortality, 6.8% (95% CI 4.4–9.1) for non‐CV mortality, and 13.0% (95% CI 9.9–16.0) for HF hospitalization. Cluster 1 was the reference category in all models.
Figure 2.
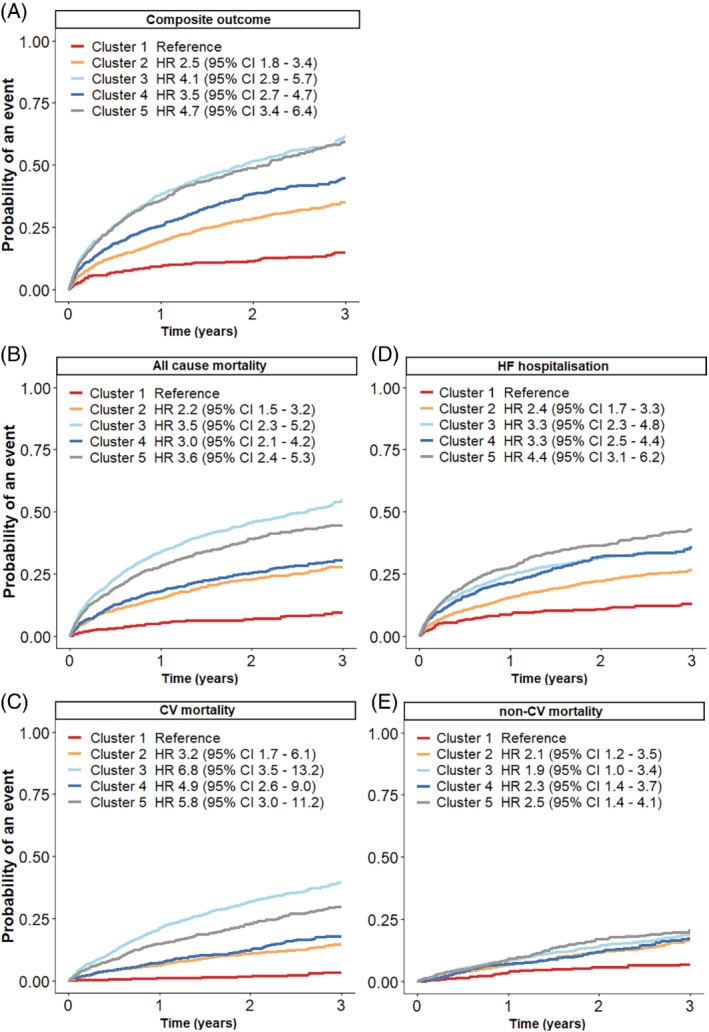
Cumulative incidence curves for the association between clusters and outcomes in SwedeHF patients. (A) Composite outcome, (B) all‐cause mortality, (C) cardiovascular (CV) mortality, (D) heart failure (HF) hospitalization, (E) non‐CV mortality. All models are adjusted for age and sex. The composite outcome consisted of a combination of CV mortality and HF hospitalization. CI, confidence interval; HR, hazard ratio.
For the composite outcome, we found similar event rates and age‐ and sex‐adjusted HRs for cluster 2 and 4, with event rates of 35.1% (95% CI 32.2–37.9) and 44.8% (95% CI 40.6–49.0), respectively (Figure 2A). The event rates and adjusted HRs for cluster 3 and 5 were the highest, with event rates of 61.3% (95% CI 57.8–64.8) and 59.3% (95% CI 55.4–63.2), respectively.
Clusters 2 and 4 had similar event rates of all‐cause mortality: 30.8% (95% CI 27.9–33.6) and 35.0% (95% CI 31.0–39.1), respectively (Figure 2B). Cluster 5 had a worse event rate of 49.9% (95% CI 53.7–46.2) and patients in cluster 3 had the highest event rate of 58.7% (95% CI 55.4–62.0). Patients in clusters 3 and 5 had the highest age‐ and sex‐adjusted HRs.
Cardiovascular mortality occurred similarly for clusters 2 and 4, with an event rate of 14.6% (95% CI 12.4–16.5) and 17.8% (95% CI 14.7–20.9), respectively (Figure 2C). Clusters 3 and 5 had the highest CV mortality rate, with event rates of 39.6% (95% CI 36.5–42.7) and 29.6% (95% CI 26.3–32.9), respectively. The age‐ and sex‐adjusted HRs were also highest for clusters 3 and 5.
For HF hospitalization, differences between clusters were smaller (Figure 2D). The event rate for cluster 2 was 26.6% (95% CI 24.1–29.1). Event rates for clusters 3 and 4 were similar with 35.7% (95% CI 32.8–38.5) and 35.4% (95% CI 31.7–39.1), respectively. The adjusted HRs for clusters 3 and 4 were comparable, while the adjusted HR for cluster 5 was the highest. Cluster 5 had the highest HF hospitalization event rate of 42.9% (95% CI 39.5–46.3).
For non‐CV mortality, differences between clusters were less pronounced (Figure 2E). Similar event rates and adjusted HRs were seen for all clusters. The event rates were 16.3% (95% CI 14.1–18.5) for cluster 2, 19.1% (95% CI 16.6–21.6) for cluster 3, 17.2% (95% CI 14.1–20.4) for cluster 4, and the highest event rate was seen for cluster 5 20.3% (95% CI 17.5–23.2).
Results from the cause‐specific regression models in the sensitivity analysis (online supplementary Table S4) were comparable to the competing risk models.
Discussion
In this study, we analysed two large contemporary HF registries comprising over 9000 patients with HFpEF between 2013–2016, representative of the patients with HFpEF frequently seen in daily clinical practice. This allowed for a novel classification technique to identify clusters of patients, thereby providing more insight in clinical phenotypes of HFpEF. Overall, heterogeneity of HFpEF was considerable and this technique was able to identify five distinct clinical clusters of patients: a young‐low comorbidity burden cluster, an atrial fibrillation‐hypertensive cluster, an older‐atrial fibrillation cluster, an obese‐diabetic cluster, and a cardio‐renal cluster. Patients in the young‐low comorbidity burden cluster had the lowest, while patients in the older‐atrial fibrillation and cardio‐renal cluster had the highest event rates. We were able to validate these distinct clusters in an external validation cohort.
Heart failure with preserved ejection fraction heterogeneity
To date, all major clinical trials investigating the efficacy of therapies in HFpEF patients were neutral.4 The heterogeneity in HFpEF is proposed as the most likely attribute for the failure of clinical trials to establish a clinically relevant effect of interventions in HFpEF patients.4, 9 This has led to the emerging role of phenotyping in HFpEF, where phenotyping patients may lead to more homogeneous patient clusters that could more likely benefit from medical therapies. Several phenotypes have been proposed, based on biomarker, comorbidity, or diastolic dysfunction differences.17, 18, 19 One of the most discussed phenotypes is obesity‐related HFpEF. Because obesity is associated with inflammation, hypertension and insulin resistance, obesity could influence HFpEF pathophysiology.
Here, we performed LCA clustering to study a heterogeneous HFpEF population. In line with previous reports, we found a diabetic‐obesity cluster. This cluster had better survival rates compared to other clusters.20 However, the best prognosis was seen in the young‐low comorbidity burden cluster. Compared to the other clusters, this cluster had the most implantable devices and lowest diuretic prescription. A potential reason for this could be that these patients have less severe HF. Indeed, the majority of patients in this cluster had NYHA class I/II (85%) and lower NT‐proBNP levels. However, it could also be hypothesized that patients in this cluster have recovered HFrEF, due to the higher percentage of patients with an implantable cardioverter‐defibrillator or cardiac resynchronization therapy.
The elderly‐atrial fibrillation cluster and cardio‐renal cluster had the worst prognosis. Patients in these clusters suffered more often from atrial fibrillation, ischaemic heart disease as well as hypertension, and had lower prescriptions of RAS inhibitors compared to the other clusters. A potential reason could be that these patients are older and have more impaired renal function (eGFR <30 mL/min/1.73 m2), thus concerning physicians with frailty, polypharmacy and reduced tolerance or safety. However, studies in SwedeHF have shown that RAS inhibitors and beta‐blockers are associated with improved morbidity and mortality regardless of age. So older age per se should not be a reason to not prescribe these types of medication in elderly patients.21, 22
Differences in clustering techniques and similarities in clusters
The current analysis has clustered the largest HFpEF population to date. Our analysis was conducted in a real‐world registry population, compared other studies which were trials,10, 11, 13 traditional cohorts12, 14 and a small electronic health record study.9 In online supplementary Table S5, we show the differences and similarities between clustering studies. Overall, the clusters that we found were similar to those in previous studies.9, 10, 11, 12, 13, 14 We identified five main HFpEF phenotypes in all studies combined. These phenotypes correspond to the clusters we describe in our study.
The most common phenotype was the diabetic‐obesity cluster, which was described in each clustering study and has been proposed previously.18, 20 The second most described phenotypes were the younger cluster and the cardio‐renal cluster, which were found in five out of seven studies. Finally, an atrial fibrillation‐hypertension phenotype and an older‐atrial fibrillation phenotype were found in three out of seven clustering studies. Interestingly, three out of five phenotypes are characterized by atrial fibrillation, which highlights the relationship of atrial fibrillation with HFpEF and the worse prognosis associated with these phenotypes.23 More research should focus on the detrimental combination of atrial fibrillation and HF.
Even though different approaches and different variables were used to cluster HFpEF patients, there were a lot of similarities between studies, which consolidates the result that we can define clinically relevant clusters within the HFpEF patient group. These results could form a basis for tailoring trial design to discern potential cluster‐specific interventions.
Heart failure with preserved ejection fraction clusters and future trial design
Within these different HFpEF clusters, there could potentially be a more homogeneous response in treatment efficacy. We observed differences in medication profile between clusters, but the real value of these clusters has yet to be proven in predicting homogeneous treatment response within clusters and applicability in trial design. It has previously been shown that in obese older patients with HFpEF, caloric restriction and aerobic exercise training could increase peak oxygen consumption.24 However, several clusters also have overlapping clinical profiles; this is due to the model‐based approach of LCA clustering which classifies patients according to probability; thus treatment responses might not be mutually exclusive. To date, three clustering studies were conducted in trial populations: I‐PRESERVE and TOPCAT.10, 11, 13 Irbesartan and spironolactone were associated with a reduction in risk for the primary outcome in the diabetic‐obesity cluster in these studies.10, 13 Further research is needed to evaluate the treatment response for other phenotypes and the potential to improve hard clinical endpoints. Moreover, it needs to be defined if eventual positive treatment responses are exclusive to specific clusters.
Strengths and limitations
This study has several strengths. First, both SwedeHF and CHECK‐HF are some of the largest and contemporary European HF registries.16 Second, we used a pragmatic and highly feasible approach by choosing to use easily obtainable clinical information to improve the applicability of the model. Another strength of this study is the use of LCA, which allows for flexibility in cluster definition. Lastly, a strength of this study is the validation of the identified clusters in an external cohort.
Limitations of this study include the missing indication for medication prescription, for example 12% of CHECK‐HF patients reported hypercholesterolaemia, while ≥80% of patients were prescribed a statin. Furthermore, we lacked follow‐up data in the validation cohort. However, we were able to report associations between clusters and relevant patient outcomes in the derivation cohort. A third limitation is that we only included a proportion of patients in SwedeHF between 2013–2016, to capture the same timeframe as the CHECK‐HF cohort; however, this might have introduced bias. Furthermore, the clusters are based on one‐time measurements and are not able to account for the progressive nature of HF, including changes in LVEF and clinical status over time.25 Another limitation is the data‐driven approach of phenotypic clustering, this is highly influenced by the cohort. Yet, we were able to discern clusters of patients comparable to previous studies. Finally, there were missing data in some variables which may have influenced results. However, due to the model‐based approach in LCA, a significant impact of missing data on our results is unlikely as a complete case analysis was nearly identical to the full data analysis (data not shown).
Conclusion
This study demonstrates that phenotype clustering may result in clinically meaningful clusters of HFpEF patients. Clinical characteristics of patients between clusters varied considerably, notably regarding age, sex, comorbidity distribution, drug therapy and prognosis. These results signify the heterogeneity in the HFpEF population and may form a basis for tailoring trial design.
Funding
The Swedish Heart Failure Registry is funded by the Swedish National Board of Health and Welfare, the Swedish Association of Local Authorities and Regions, the Swedish Society of Cardiology, and the Swedish Heart‐Lung Foundation. Servier, the Netherlands, partially funded the inclusion of data and software program for CHECK‐HF. The CHECK‐HF steering committee (J.B., G.L., H.P.B.L.R., A.H.) received no funding for this project. The current study was initiated by the authors and was designed, conducted, interpreted, and reported independently of the sponsor. This work has received support from the EU/EFPIA Innovative Medicines Initiative 2 Joint Undertaking BigData@Heart grant n° 116074.
This study was supported by grants to LHL's institution from the Swedish Research Council [grants 2013‐23897‐104604‐23 and 523‐2014‐2336], the Swedish Heart Lung Foundation [grants 20150557 and 20170841], and the Stockholm County Council [grant 20140220, 20170112]. F. W. Asselbergs is supported by UCL Hospitals NIHR Biomedical Research Centre. I.V. is supported by the Dutch Heart Foundation, as part of ‘Facts and Figures’.
Conflict of interest: G.S. reports grants and personal fees from Vifor, AstraZeneca, grants and non‐financial support from Boehringer Ingelheim, personal fees from SPA, Roche, grants from MSD, outside the submitted work. H.P.B.L.R. reports non‐financial support from Servier, during the conduct of the study; grants and personal fees from Novartis, Vifor, Roche Diagnostics, Medtronic, outside the submitted work; and collaboration in INTERREG‐NWE project with eHealth/AI companies (Sananet NL, Exploris CH). J.B. reports grants and personal fees from Vifor and Abbott not related to this project. U.D. reports grants from AstraZeneca, Boehringer Ingelheim, Pfizer, Vifor, Boston Scientific and Roche Diagnostics and personal fees from Novartis, AstraZeneca and Amgen, outside the submitted work. L.H.L. reports personal fees from Merck, Sanofi, AstraZeneca, Bayer, Pharmacosmos, Abbott, Medscape, grants and personal fees from Boehringer Ingelheim, Vifor‐Fresenius, Relypsa, Novartis, Mundipharma, grants from Boston Scientific, outside the submitted work. All other authors have nothing to disclose.
Supporting information
Figure S1. Study flow.
Table S1. Variable definition in SwedeHF and CHECK‐HF.
Table S2. Probabilities for each predefined variable per cluster.
Table S3. Probabilities for each classification per cluster.
Table S4. Cause‐specific hazards in SwedeHF from the cause‐specific Cox proportional hazard model.
Table S5. SwedeHF phenotypic clusters in context of previous studies.
References
- 1.Ponikowski P, Voors AA, Anker SD, Bueno HH, Cleland JG, Coats AJ, Falk V, Gonzalez‐Juanatey JR, Harjola VP, Jankowska EA, Jessup M, Linde C, Nihoyannopoulos P, Parissis JT, Pieske B, Riley JP, Rosano GM, Ruilope LM, Ruschitzka F, Rutten FH, van der Meer P. 2016 ESC Guidelines for the diagnosis and treatment of acute and chronic heart failure: the Task Force for the diagnosis and treatment of acute and chronic heart failure of the European Society of Cardiology (ESC). Developed with the special contribution of the Heart Failure Association (HFA) of the ESC. Eur J Heart Fail 2016;18:891–975. [DOI] [PubMed] [Google Scholar]
- 2.Lund LH, Vedin O, Savarese G. Is ejection fraction in heart failure a limitation or an opportunity? Eur J Heart Fail 2018;20:431–432. [DOI] [PubMed] [Google Scholar]
- 3.Borlaug BA, Redfield MM. Diastolic and systolic heart failure are distinct phenotypes within the heart failure spectrum. Circulation 2011;123:2006–2013. [DOI] [PMC free article] [PubMed] [Google Scholar]
- 4.Borlaug BA. Evaluation and management of heart failure with preserved ejection fraction. Nat Rev Cardiol 2020;17:559–573. [DOI] [PubMed] [Google Scholar]
- 5.Solomon SD, McMurray JJ, Anand IS, Ge J, Lam CS, Maggioni AP, Martinez F, Packer M, Pfeffer MA, Pieske B, Redfield MM, Rouleau JL, van Veldhuisen DJ, Zannad F, Zile MR, Desai AS, Claggett B, Jhund PS, Boytsov SA, Comin‐Colet J, Cleland J, Düngen HD, Goncalvesova E, Katova T, Kerr Saraiva JF, Lelonek M, Merkely B, Senni M, Shah SJ, Zhou J, Rizkala AR, Gong J, Shi VC, Lefkowitz MP; PARAGON‐HF Investigators and Committees . Angiotensin‐neprilysin inhibition in heart failure with preserved ejection fraction. N Engl J Med 2019;381:1609–1620. [DOI] [PubMed] [Google Scholar]
- 6.Solomon SD, Claggett B, Lewis EF, Desai A, Anand I, Sweitzer NK, O'meara E, Shah SJ, Mckinlay S, Fleg JL, Sopko G, Pitt B, Pfeffer MA; TOPCAT Investigators . Influence of ejection fraction on outcomes and efficacy of spironolactone in patients with heart failure with preserved ejection fraction. Eur Heart J 2016;37:455–462. [DOI] [PMC free article] [PubMed] [Google Scholar]
- 7.Cleland JG, Bunting K V, Flather MD, Altman DG, Holmes J, Coats AJ, Manzano L, McMurray JJ, Ruschitzka F, van Veldhuisen DJ, von Lueder TG, Bohm M, Andersson B, Kjekshus J, Packer M, Rigby AS, Rosano G, Wedel H, Hjalmarson A, Wikstrand J, Kotecha D. Beta‐blockers for heart failure with reduced, mid‐range, and preserved ejection fraction: an individual patient‐level analysis of double‐blind randomized trials. Eur Heart J 2018;39:26–35. [DOI] [PMC free article] [PubMed] [Google Scholar]
- 8.Lund LH, Claggett B, Liu J, Lam CS, Jhund PS, Rosano GM, Swedberg K, Yusuf S, Granger CB, Pfeffer MA, McMurray JJ, Solomon SD. Heart failure with mid‐range ejection fraction in CHARM: characteristics, outcomes and effect of candesartan across the entire ejection fraction spectrum. Eur J Heart Fail 2018;20:1230–1239. [DOI] [PubMed] [Google Scholar]
- 9.Shah SJ, Katz DH, Selvaraj S, Burke MA, Yancy CW, Gheorghiade M, Bonow RO, Huang CC, Deo RC. Phenomapping for novel classification of heart failure with preserved ejection fraction. Circulation 2015;131:269–279. [DOI] [PMC free article] [PubMed] [Google Scholar]
- 10.Kao DP, Lewsey JD, Anand IS, Massie BM, Zile MR, Carson PE, McKelvie RS, Komajda M, McMurray JJ, Lindenfeld J. Characterization of subgroups of heart failure patients with preserved ejection fraction with possible implications for prognosis and treatment response. Eur J Heart Fail 2015;17:925–935. [DOI] [PMC free article] [PubMed] [Google Scholar]
- 11.Segar MW, Patel KV, Ayers C, Basit M, Tang WH, Willett D, Berry J, Grodin JL, Pandey A. Phenomapping of patients with heart failure with preserved ejection fraction using machine learning‐based unsupervised cluster analysis. Eur J Heart Fail 2020;22:148–158. [DOI] [PubMed] [Google Scholar]
- 12.Hedman ÅK, Hage C, Sharma A, Brosnan MJ, Buckbinder L, Gan LM, Shah SJ, Linde CM, Donal E, Daubert JC, Mälarstig A, Ziemek D, Lund L. Identification of novel pheno‐groups in heart failure with preserved ejection fraction using machine learning. Heart 2019;106:342–349. [DOI] [PubMed] [Google Scholar]
- 13.Cohen JB, Schrauben SJ, Zhao L, Basso MD, Cvijic ME, Li Z, Yarde M, Wang Z, Bhattacharya PT, Chirinos DA, Prenner S, Zamani P, Seiffert DA, Car BD, Gordon DA, Margulies K, Cappola T, Chirinos JA. Clinical phenogroups in heart failure with preserved ejection fraction: detailed phenotypes, prognosis, and response to spironolactone. JACC Heart Fail 2020;8:172–184. [DOI] [PMC free article] [PubMed] [Google Scholar]
- 14.Schrub F, Oger E, Bidaut A, Hage C, Charton M, Daubert JC, Leclercq C, Linde C, Lund L, Donal E. Heart failure with preserved ejection fraction: a clustering approach to a heterogenous syndrome. Arch Cardiovasc Dis 2020;113:381–390. [DOI] [PubMed] [Google Scholar]
- 15.Savarese G, Vasko P, Jonsson Å, Edner M, Dahlström U, Lund LH. The Swedish Heart Failure Registry: a living, ongoing quality assurance and research in heart failure. Ups J Med Sci 2019;124:65–69. [DOI] [PMC free article] [PubMed] [Google Scholar]
- 16.Brugts JJ, Linssen GC, Hoes AW, Brunner‐La Rocca HP; CHECK‐HF Investigators . Real‐world heart failure management in 10,910 patients with chronic heart failure in the Netherlands: design and rationale of the Chronic Heart failure ESC guideline‐based Cardiology practice Quality project (CHECK‐HF) registry. Neth Heart J 2018;26:272–279. [DOI] [PMC free article] [PubMed] [Google Scholar]
- 17.Shah SJ, Katz DH, Deo RC. Phenotypic spectrum of heart failure with preserved ejection fraction. Heart Fail Clin 2014;10:407–418. [DOI] [PMC free article] [PubMed] [Google Scholar]
- 18.Obokata M, Reddy YN, Pislaru SV, Melenovsky V, Borlaug BA. Evidence supporting the existence of a distinct obese phenotype of heart failure with preserved ejection fraction. Circulation 2017;136:6–19. [DOI] [PMC free article] [PubMed] [Google Scholar]
- 19.Przewlocka‐Kosmala M, Marwick TH, Dabrowski A, Kosmala W. Contribution of cardiovascular reserve to prognostic categories of heart failure with preserved ejection fraction: a classification based on machine learning. J Am Soc Echocardiogr 2019;32:604–615. [DOI] [PubMed] [Google Scholar]
- 20.Chandramouli C, Tay WT, Bamadhaj NS, Tromp J, Teng TH, Yap JJL, MacDonald MR, Hung CL, Streng K, Naik A, Wander GS, Sawhney J, Ling LH, Richards AM, Anand I, Voors AA, Lam CS; ASIAN‐HF Investigators . Association of obesity with heart failure outcomes in 11 Asian regions: a cohort study. PLoS Med 2019;16:e1002916. [DOI] [PMC free article] [PubMed] [Google Scholar]
- 21.Savarese G, Dahlström U, Vasko P, Pitt B, Lund LH. Association between renin‐angiotensin system inhibitor use and mortality/morbidity in elderly patients with heart failure with reduced ejection fraction: a prospective propensity score‐matched cohort study. Eur Heart J 2018;39:4257–4265. [DOI] [PubMed] [Google Scholar]
- 22.Stolfo D, Uijl A, Benson L, Schrage B, Fudim M, Asselbergs FW, Koudstaal S, Sinagra G, Dahlström U, Rosano G, Savarese G. Association between beta‐blocker use and mortality/morbidity in older patients with heart failure with reduced ejection fraction. A propensity score‐matched analysis from the Swedish Heart Failure Registry. Eur J Heart Fail 2020;22:103–112. [DOI] [PubMed] [Google Scholar]
- 23.Zakeri R, Chamberlain AM, Roger VL, Redfield MM. Temporal relationship and prognostic significance of atrial fibrillation in heart failure patients with preserved ejection fraction: a community‐based study. Circulation 2013;128:1085–1093. [DOI] [PMC free article] [PubMed] [Google Scholar]
- 24.Kitzman DW, Brubaker P, Morgan T, Haykowsky M, Hundley G, Kraus WE, Eggebeen J, Nicklas BJ. Effect of caloric restriction or aerobic exercise training on peak oxygen consumption and quality of life in obese older patients with heart failure with preserved ejection fraction: a randomized clinical trial. JAMA 2016;315:36–46. [DOI] [PMC free article] [PubMed] [Google Scholar]
- 25.Iorio A, Rea F, Barbati G, Scagnetto A, Peruzzi E, Garavaglia A, Corrao G, Sinagra G, Di Lenarda A. HF progression among outpatients with HF in a community setting. Int J Cardiol 2019;277:140–146. [DOI] [PubMed] [Google Scholar]
Associated Data
This section collects any data citations, data availability statements, or supplementary materials included in this article.
Supplementary Materials
Figure S1. Study flow.
Table S1. Variable definition in SwedeHF and CHECK‐HF.
Table S2. Probabilities for each predefined variable per cluster.
Table S3. Probabilities for each classification per cluster.
Table S4. Cause‐specific hazards in SwedeHF from the cause‐specific Cox proportional hazard model.
Table S5. SwedeHF phenotypic clusters in context of previous studies.