

Abstract
Background
To evaluate if early improvements in pain and function with subcutaneous tanezumab are meaningful and sustained over 24 weeks.
Methods
Patients with moderate‐to‐severe osteoarthritis (hip or knee) in Europe and Japan were randomized to placebo, tanezumab 2.5 mg or tanezumab 5 mg (baseline, Week 8 and Week 16). Outcomes included: average daily index joint pain score, Western Ontario and McMaster Universities Osteoarthritis Index (WOMAC) subscales, rescue medication use, WOMAC responders (within‐patient ≥30% reduction in WOMAC Pain or Physical Function), Outcome Measures in Rheumatology‐Osteoarthritis Research Society International (OMERACT‐OARSI) responders (within‐patient) and Patient‐reported Treatment Impact Assessment‐Modified questionnaire.
Results
Patients received placebo (n = 282), tanezumab 2.5 mg (n = 283) or tanezumab 5 mg (n = 284). Changes from baseline in average daily index joint pain (within the first week) and WOMAC subscales (Week 2 through Week 24) were greater for each tanezumab group versus placebo (least squares [LS] mean, unadjusted p ≤ .05). Rescue medication use (days/week) was lower for each tanezumab group versus placebo from Week 2 through Week 12 (LS mean, unadjusted p ≤ .05) but not at Week 16 or 24. A higher proportion of each tanezumab group than placebo achieved ≥30% reduction from baseline in WOMAC Pain or Physical Function, or OMERACT‐OARSI response (Week 2 through Week 24, unadjusted p ≤ .05), or were satisfied with treatment at Week 24 (unadjusted p ≤ .05).
Conclusions
Subcutaneous tanezumab, compared with placebo, reduced pain within the first week, and pain and function were improved throughout 24 weeks. The proportions of responders and patients satisfied were higher with tanezumab than placebo.
ClinicalTrials.gov:NCT02709486.
Significance
This exploratory analysis of data from a placebo‐controlled, Phase 3 study of patients with moderate‐to‐severe osteoarthritis of the hip or knee for whom standard analgesics were not effective or could not be taken, found that onset of efficacy of subcutaneous tanezumab was within the first week, and efficacy was maintained through the 24‐week treatment period. Tanezumab was effective in those patients with the most radiologically severe osteoarthritis.
1. INTRODUCTION
Quality of life can be significantly impacted by the pain caused by osteoarthritis (OA) (Osteoarthritis Research Society International, 2016). Commonly used analgesics (acetaminophen, nonsteroidal anti‐inflammatory drugs [NSAIDs] and tramadol/other opioids) (Bannuru et al., 2019; Geenen et al., 2018; Kolasinski et al., 2020) are not adequately effective or suitable for all patients (Kolasinski et al., 2020), and alternative well‐tolerated treatments that provide meaningful and timely pain relief and improved function for a prolonged period are needed.
Studies using intravenous administration of the nerve growth factor monoclonal antibody, tanezumab, showed early and sustained efficacy in patients with hip or knee OA (Brown et al., 2012, 2013; Lane et al., 2010; Spierings et al., 2013). A dose‐titration study of subcutaneous tanezumab in patients in North America with hip or knee OA demonstrated efficacy within the first week that was generally sustained over a 16‐week treatment period (Schnitzer et al., 2019, 2020).
In this placebo‐controlled, Phase 3 study of patients in Europe and Japan with moderate‐to‐severe OA of the hip or knee for whom standard analgesics were inadequate or unsuitable, tanezumab 2.5 mg administered subcutaneously resulted in statistically significant improvements in Western Ontario and McMaster Universities OA Index (WOMAC*) Pain and Physical Function subscales, but not patient's global assessment of OA (PGA‐OA), at Week 24 (Berenbaum et al., 2020). The aim of the current exploratory analysis of data from this study (Berenbaum et al., 2020) was to evaluate if the early pain reduction seen with subcutaneous tanezumab is meaningful and sustained over a 24‐week treatment period. Subgroup analyses assessed efficacy in patients with the most radiographically severe OA and in the subgroup of patients from Japan.
*© 1996 Nicholas Bellamy. WOMAC® is a registered trademark of Nicholas Bellamy (CDN, EU, USA).
2. METHODS
This double‐blind, parallel‐group, randomized, placebo‐controlled Phase 3 study (ClinicalTrials.gov: NCT02709486) of patients enrolled in Europe or Japan comprised a screening period (≤37 days), a double‐blind treatment period (24 weeks), and a safety follow‐up period (24 weeks). Eligibility criteria included OA of the hip or knee (radiographically confirmed by a central reader, Kellgren‐Lawrence [KL] (Kellgren & Lawrence, 1957) grade ≥2); WOMAC (Theiler et al., 2002) Pain subscale score ≥5 in the index joint (at screening and baseline); WOMAC Physical Function subscale score ≥5 in the index joint at baseline; and “fair”, “poor” or “very poor” PGA‐OA at baseline. Patients also had a documented history of: (a) insufficient pain relief from acetaminophen; (b) inadequate pain relief from or intolerance or contraindication to NSAIDs; and (c) inadequate pain relief from or intolerance or contraindication to either tramadol or opioids (or were unwilling to take opioids). This study was not a flare design (i.e., there was no requirement for patients to have increased pain after stopping prior analgesics during the screening phase). Following a washout period of prior analgesics, assessments at baseline, Week 8, and Week 16 were conducted before administration of study medication. Patients received three doses of placebo, tanezumab 2.5 mg or tanezumab 5 mg administered subcutaneously at baseline, Week 8 and Week 16. Except for the 24 hr prior to any study visit for efficacy assessments, acetaminophen (rescue therapy, up to 4,000 mg/day or as permitted by local or national labelling) was allowed for OA or other types of pain or illness prior to randomization and up to 5 days/week through Week 24, and then as needed until Week 32 (Berenbaum et al., 2020). Full methodology for this study has been published previously (Berenbaum et al., 2020).
2.1. Assessments
Efficacy was assessed during the 24‐week double‐blind treatment period. An assessment for rebound pain (pain after treatment effect had subsided, indicated by worsening of pain compared with baseline) was conducted at Week 32, which was 16 weeks after the last dose of study medication.
Using an electronic diary (palm‐held device) each day from randomization, patients assessed their average daily index joint pain during the past 24 hr on an 11‐point numeric rating scale, with higher score indicating worse pain. During the first post‐randomization clinic visit at Week 2 and subsequent clinic visits at Weeks 4, 8, 12, 16, 24 and 32, patients completed the Pain, Physical Function and Stiffness subscales of the WOMAC questionnaire electronically, assessing index joint symptoms within the last 48 hr on 11‐point numeric rating scales (with higher scores indicating higher levels of pain, worse function or more stiffness). The PGA‐OA was assessed on a 5‐point Likert scale with higher score indicating worse assessment. Each day to Week 24, patients electronically recorded any use of rescue medication, with bottles returned at each visit for assessment of compliance. The Patient Reported Treatment Impact Assessment‐Modified (mPRTI) comprised three questions rated on 5‐point Likert scales, with higher scores indicating greater satisfaction, preference or willingness to use the study medication (at Week 16 and 24 only).
2.2. Statistical analyses
The primary efficacy population comprised all randomized patients who received at least one dose of study medication.
Change from baseline in WOMAC Pain, WOMAC Physical Function and PGA‐OA scores were prespecified coprimary (at Week 24) or secondary (at Weeks 2, 4, 8, 12, 16, and 32) endpoints. All other endpoints were prespecified secondary endpoints. As reported previously (Berenbaum et al., 2020), the coprimary endpoints and three key secondary endpoints (proportion of patients with ≥50% improvement in WOMAC Pain score at Week 24, change from baseline to Week 2 in WOMAC Pain score and change from baseline to Week 1 in average daily index joint pain score) were included in a multiple testing procedure to control the family‐wise type 1 error, using a graphical approach of gatekeeping strategy (Bretz et al., 2011). The analyses of these key secondary endpoints were gated by the primary analysis (Berenbaum et al., 2020), and because the tanezumab 2.5 mg dose failed to achieve statistical significance on one coprimary endpoint (PGA‐OA at Week 24) (Berenbaum et al., 2020), hypothesis testing of the three key secondary endpoints could not be performed for the related study objectives. However, the objective of this manuscript was to evaluate overall onset, maintenance, and responder rates, including other secondary endpoints in addition to primary and key secondary endpoints. The data in this manuscript are presented with unadjusted p‐values, least squares (LS) mean or proportion of patients achieving criteria (e.g., ≥30% improvement), and the corresponding 95% confidence interval, for all secondary endpoints. Findings are described as statistically significant (where p ≤ .05 in the framework of gatekeeping strategy) or greater/better (from an exploratory perspective, when point estimate, LS mean, and % responders were better for tanezumab than placebo and unadjusted p ≤ .05).
Between‐group differences in least squares mean change from baseline in average daily index joint pain score (calculated daily for Days 1 through 7, and as weekly means at Weeks 1, 2, 3, 4, 6, 8, 10, 12, 16, 20 and 24) and WOMAC subscales and PGA‐OA (at Weeks 2, 4, 8, 12, 16 and 24) were tested using analysis of covariance (ANCOVA) models with multiple imputation for missing data dependent on the reason for missing data (for details, see Methods S1). Effect sizes (placebo‐adjusted LS mean change from baseline divided by model‐based standard deviation [SD]) were calculated post hoc. Between‐group differences in rescue medication use were analysed at Weeks 2, 4, 8, 12, 16 and 24 using last observation carried forward (LOCF) and a Negative Binomial model. The proportions of patients achieving ≥30%, ≥50%, ≥70% or ≥90% improvements from baseline in WOMAC Pain or Physical Function scores, and the proportion meeting the Outcome Measures in Rheumatology‐Osteoarthritis Research Society International (OMERACT‐OARSI) (Pham et al., 2004) treatment response criteria, were calculated. A within‐patient decrease in WOMAC Pain score of ≥30% is reported to be moderately clinically important (Dworkin et al., 2008; Farrar et al., 2001). OMERACT‐OARSI response is defined as within‐patient improvement from baseline of (a) ≥50% and ≥2 points in either WOMAC Pain or Physical Function scores, or (b) ≥20% and ≥1 point in two of WOMAC Pain, Physical Function, or PGA‐OA scores. Between‐group differences in these responder endpoints were tested using logistic regression with mixed baseline observation carried forward/LOCF, dependent on the reason for the missing data. Between‐group differences in responses to the mPRTI were analysed using a Cochran‐Mantel‐Haenszel test.
Post hoc exploratory subgroup analyses assessed the efficacy of tanezumab in the most severe patients, based on KL grade of the index joint (grade 2 or 3 [KL2/3], or grade 4 [KL4]). Prespecified exploratory analyses assessed the efficacy of tanezumab in the small subgroup of patients from Japan, using the same models as for the total population. Subgroup analyses of the patients from Europe were not conducted since they comprised the majority of the total population.
SAS software version 9.4 (Cary, North Carolina) was used for all statistical analyses.
3. RESULTS
3.1. Demographics and baseline characteristics
The 849 patients were enrolled in Europe (87.5%, 743/849) and Japan (12.5%, 106/849). Of the total population (placebo, n = 282; tanezumab 2.5 mg, n = 283; tanezumab 5 mg, n = 284), 69.1% (587/849) were female, and the index joint was a knee in 83.0% (705/849), KL2 or KL3 in 63.7% (541/849), and KL4 in 36.0% (306/849) of patients (Berenbaum et al., 2020). In the subgroup of patients from Japan (placebo, n = 34; tanezumab 2.5 mg, n = 38; tanezumab 5 mg, n = 34), 69.8% (74/106) were female, and the index joint was a knee in 88.7% (94/106), KL2 or KL3 in 60.4% (64/106), and KL4 in 39.6% (42/106) of patients. At baseline, across the three treatment groups, WOMAC Pain scores (mean) were 6.59 to 6.70 (Berenbaum et al., 2020) in the total population and 6.40 to 6.74 in the subgroup from Japan; WOMAC Physical Function scores were 6.67 to 6.77 (Berenbaum et al., 2020) and 6.51 to 6.80, respectively. The subgroup from Japan had a lower mean body mass index, shorter mean duration since index joint OA diagnosis, and fewer patients had an index joint of KL2 compared with the total population (Table S1). At study entry, the most frequent reason for treatment failure with acetaminophen, NSAIDs and tramadol was inadequate pain relief in both the total population and the subgroup from Japan; the most frequent reason for treatment failure with opioids was that the patient was unwilling to take them, and this was the only reason in the subgroup from Japan (Table S2).
3.2. Early efficacy
In the total population, improvements from baseline in average daily index joint pain score (LS mean) were greater for each tanezumab group compared with the placebo group within the first week, with onset evident at Day 2 (tanezumab 2.5 mg) and Day 4 (tanezumab 5 mg) (Figure 1a). The changes from baseline (LS mean difference [95% confidence interval] vs. placebo) were −0.50 (−0.77, −0.23) for tanezumab 2.5 mg (unadjusted p = .0003) and −0.26 (−0.53, 0.01) for tanezumab 5 mg (unadjusted p = .0638) at Day 2, and −0.65 (−0.93, −0.37) for tanezumab 2.5 mg (unadjusted p < .0001) and −0.48 (−0.77, −0.20) for tanezumab 5 mg (unadjusted p = .0008) at Day 4. At the time of the first post‐randomization clinic assessment (Week 2), LS mean reductions from baseline in WOMAC Pain (Berenbaum et al., 2020), Physical Function, and Stiffness subscale scores and PGA‐OA score were greater in each tanezumab group compared with the placebo group (unadjusted p ≤ .05, Figure 2 and Table 1). Effect sizes for the tanezumab 2.5 mg and 5 mg groups, respectively, were 0.39 and 0.29 for average daily index joint pain at Week 1 and 0.43 and 0.22 for WOMAC Pain at Week 2 (Table S3).
FIGURE 1.
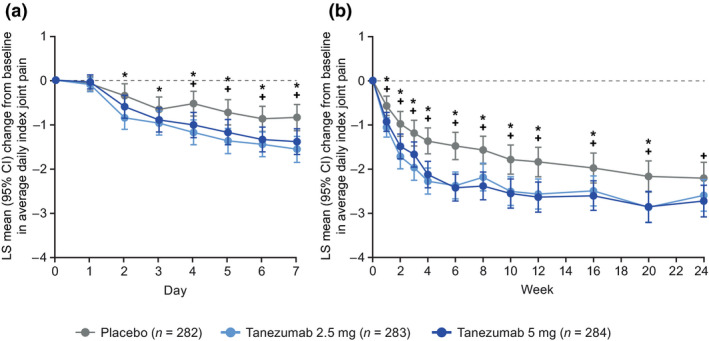
Change from baseline in average daily index joint pain (a) daily during the first week and (b) weekly through the 24‐week treatment period (total population). *Unadjusted p ≤ .05 for tanezumab 2.5 mg versus placebo. +Unadjusted p ≤ .05 for tanezumab 5 mg versus placebo. The LS means with standard errors have been previously published for Week 1 (Berenbaum et al., 2020). Average daily index joint pain during the past 24 hr assessed on an 11‐point numeric rating scale (0 = no pain, 10 = worst possible pain) in response to: “Select the number that best describes your average pain in your index joint (e.g., the right knee) in the past 24 hr.” Multiple ANCOVA models (for each timepoint in panel a and b) with multiple imputation for missing data, including model terms for baseline score, index joint, highest KL grade and treatment group, with study site as a random effect. At baseline, average daily index joint pain scores were (mean ± SD, observed data): 6.79 ± 1.56 (n = 278), 7.03 ± 1.38 (n = 280), and 6.90 ± 1.43 (n = 280), for placebo, tanezumab 2.5 mg and tanezumab 5 mg, respectively. ANCOVA, analysis of covariance; CI, confidence interval; KL, Kellgren‐Lawrence; LS, least squares; SD, standard deviation
FIGURE 2.
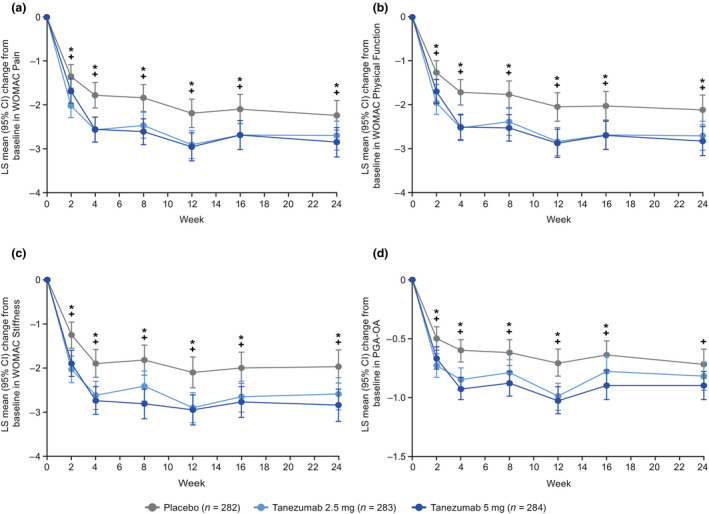
Change from baseline in (a) WOMAC Pain score, (b) WOMAC Physical Function score, (c) WOMAC Stiffness score and (d) PGA‐OA score during the 24‐week treatment period (total population). *Unadjusted p ≤ .05 for tanezumab 2.5 mg versus placebo. +Unadjusted p ≤ .05 for tanezumab 5 mg versus placebo. The LS means with standard errors have been previously published for change from baseline in WOMAC Pain at Week 2 and Week 24, and WOMAC Physical Function and PGA‐OA at Week 24 (Berenbaum et al., 2020). Coprimary endpoints (change in WOMAC Pain, WOMAC Physical Function and PGA‐OA at Week 24) are adjusted for multiplicity. All other p‐values are unadjusted: in line with the predefined gatekeeping strategy, hypothesis testing of the three key secondary endpoints could not be performed in addition to endpoints not defined as coprimary and key secondary endpoints. Pain, Physical Function and Stiffness subscales of the WOMAC questionnaire assessed index joint symptoms within the last 48 hr on 11‐point numeric rating scales (0 = no pain/difficulty/stiffness, 10 = extreme pain/difficulty/stiffness). PGA‐OA assessed on a 5‐point Likert scale (1 = very good, 5 = very poor) in response to the question: “Considering all the ways your osteoarthritis in your hip/knee affects you, how are you doing today?” ANCOVA with multiple imputation for missing data, including model terms for baseline score, baseline average daily index joint pain score, index joint, highest KL grade and treatment group, with study site as a random effect. Baseline scores (mean ± SD) for placebo (n = 281), tanezumab 2.5 mg (n = 282) and tanezumab 5 mg (n = 284) groups, respectively, were: 6.59 ± 0.94, 6.70 ± 0.94 and 6.60 ± 0.89 for WOMAC Pain; 6.67 ± 0.87, 6.77 ± 0.87 and 6.76 ± 0.88 for WOMAC Physical Function; 6.46 ± 1.43, 6.44 ± 1.59 and 6.44 ± 1.53 for WOMAC Stiffness; and 3.55 ± 0.62, 3.61 ± 0.62 and 3.56 ± 0.63 for PGA‐OA. ANCOVA, analysis of covariance; CI, confidence interval; KL, Kellgren‐Lawrence; LS, least squares; PGA‐OA, patient's global assessment of osteoarthritis; SD, standard deviation; WOMAC, Western Ontario and McMaster Universities Osteoarthritis Index
TABLE 1.
Efficacy of subcutaneous tanezumab over the 24‐week treatment period
| Change from baseline | Total population (N = 849) (Berenbaum et al., 2020) | Subgroup of patients from Japan (n = 106) | |||||
|---|---|---|---|---|---|---|---|
|
Placebo (n = 282) |
Tanezumab 2.5 mg (n = 283) |
Tanezumab 5 mg (n = 284) |
Placebo (n = 34) |
Tanezumab 2.5 mg (n = 38) |
Tanezumab 5 mg (n = 34) |
||
| Average daily index joint pain | |||||||
| Week 1 | LS mean (95% CI) | −0.57 (−0.79, −0.35) | −1.06 (−1.28, −0.84) | −0.93 (−1.15, −0.72) | −0.53 (−1.05, −0.02) | −0.57 (−1.11, −0.03) | −0.73 (−1.24, −0.21) |
| LS mean difference (95% CI) versus placebo | −0.49 (−0.70, −0.27) | −0.36 (−0.58, −0.15) | −0.03 (−0.54, 0.47) | −0.19 (−0.71, 0.32) | |||
| Unadjusted p‐value | <0.0001 | 0.0009 | – | – | |||
| Week 24 | LS mean (95% CI) | −2.21 (−2.58, −1.85) | −2.60 (−2.96, −2.24) | −2.73 (−3.09, −2.37) | −0.83 (−1.89, 0.23) | −1.49 (−2.55, −0.42) | −1.59 (−2.61, −0.57) |
| LS mean difference (95% CI) versus placebo | −0.39 (−0.78, 0.00) | −0.52 (−0.91, −0.13) | −0.66 (−1.64, 0.32) | −0.76 (−1.76, 0.24) | |||
| Unadjusted p‐value | 0.0506 | 0.0086 | – | – | |||
| WOMAC Pain | |||||||
| Week 2 | LS mean (95% CI) | −1.35 (−1.62, −1.08) | −2.02 (−2.29, −1.74) | −1.69 (−1.96, −1.41) | −0.48 (−1.22, 0.27) | −1.27 (−2.05, −0.49) | −1.15 (−1.89, −0.40) |
| LS mean difference (95% CI) versus placebo | −0.67 (−0.94, −0.40) | −0.34 (−0.61, −0.07) | −0.79 (−1.53, −0.06) | −0.67 (−1.42, 0.09) | |||
| Unadjusted p‐value | <0.0001 | 0.0149 | – | – | |||
| Week 24 | LS mean (95% CI) | −2.24 (−2.58, −1.90) | −2.70 (−3.03, −2.37) | −2.85 (−3.19, −2.52) | −0.67 (−1.68, 0.33) | −1.66 (−2.67, −0.65) | −1.59 (−2.57, −0.61) |
| LS mean difference (95% CI) versus placebo | −0.46 (−0.81, −0.12) | −0.62 (−0.97, −0.26) | −0.98 (−1.90, −0.07) | −0.92 (−1.86, 0.03) | |||
| p‐value | 0.0088 | 0.0006 | – | – | |||
| WOMAC Physical Function | |||||||
| Week 2 | LS mean (95% CI) | −1.26 (−1.53, −0.99) | −1.95 (−2.21, −1.68) | −1.69 (−1.96, −1.42) | −0.32 (−1.08, 0.43) | −1.33 (−2.13, −0.53) | −1.44 (−2.21, −0.67) |
| LS mean difference (95% CI) versus placebo | −0.69 (−0.95, −0.42) | −0.43 (−0.70, −0.17) | −1.01 (−1.77, −0.25) | −1.12 (−1.91, −0.33) | |||
| Unadjusted p‐value | <0.0001 | 0.0014 | – | – | |||
| Week 24 | LS mean (95% CI) | −2.11 (−2.45, −1.77) | −2.70 (−3.03, −2.37) | −2.82 (−3.15, −2.49) | −0.75 (−1.76, 0.26) | −1.87 (−2.90, −0.84) | −1.83 (−2.83, −0.84) |
| LS mean difference (95% CI) versus placebo | −0.59 (−0.93, −0.24) | −0.71 (−1.05, −0.36) | −1.12 (−2.07, −0.18) | −1.09 (−2.08, −0.09) | |||
| p‐value | 0.0008 | <0.0001 | – | – | |||
| PGA‐OA | |||||||
| Week 2 | LS mean (95% CI) | −0.50 (−0.60, −0.40) | −0.73 (−0.83, −0.63) | −0.67 (−0.76, −0.57) | −0.19 (−0.45, 0.07) | −0.50 (−0.77, −0.23) | −0.38 (−0.65, −0.12) |
| LS mean difference (95% CI) versus placebo | −0.23 (−0.33, −0.12) | −0.17 (−0.27, −0.06) | −0.31 (−0.57, −0.05) | −0.19 (−0.47, 0.08) | |||
| Unadjusted p‐value | <0.0001 | 0.0022 | – | – | |||
| Week 24 | LS mean (95% CI) | −0.72 (−0.84, −0.59) | −0.82 (−0.94, −0.70) | −0.90 (−1.02, −0.78) | −0.35 (−0.67, −0.03) | −0.57 (−0.89, −0.25) | −0.64 (−0.95, −0.33) |
| LS mean difference (95% CI) versus placebo | −0.11 (−0.24, 0.02) | −0.19 (−0.32, −0.06) | −0.22 (−0.52, 0.08) | −0.29 (−0.61, 0.03) | |||
| p‐value | 0.1092 | 0.0051 | – | – | |||
The LS means with standard errors have been previously published for the total population for change from baseline in average daily index joint pain (at Week 1), WOMAC Pain (at Week 2 and Week 24) and WOMAC Physical Function and PGA‐OA (at Week 24) (Berenbaum et al., 2020).
Multiple imputation.
– Analyses not conducted.
Unadjusted p‐value: In line with the predefined gatekeeping strategy, hypothesis testing of the three key secondary endpoints could not be performed in addition to endpoints not defined as coprimary and key secondary endpoints.
See footnotes to Figures 1 and 2 for model details and baseline scores for the total population. At baseline in the subgroup of patients from Japan, WOMAC Pain scores (mean ± SD) were 6.40 ± 1.11, 6.74 ± 1.00 and 6.69 ± 0.99; WOMAC Physical Function scores were 6.51 ± 0.96, 6.69 ± 1.03 and 6.80 ± 0.89; PGA‐OA scores were 3.32 ± 0.47, 3.32 ± 0.47 and 3.56 ± 0.66 for the placebo (n = 34), tanezumab 2.5 mg (n = 38) and tanezumab 5 mg (n = 34) groups, respectively; and average daily index joint pain scores were 7.05 ± 1.32 (n = 33), 7.10 ± 1.21 (n = 38) and 7.02 ± 1.32 (n = 34).
Abbreviations: ANCOVA, analysis of covariance; CI, confidence interval; KL, Kellgren‐Lawrence; LS, least squares; PGA‐OA, patient's global assessment of osteoarthritis; SD, standard deviation; WOMAC, Western Ontario and McMaster Universities Osteoarthritis Index.
Rescue medication use (number of days per week) was lower in the tanezumab 2.5 mg (LS mean 2.12 days, unadjusted p = .0001) and 5 mg (2.39 days, unadjusted p = .0067) groups compared with the placebo group (3.17 days) at Week 2 (Table 2). The amount of rescue medication used per week (mg) was lower in the tanezumab 2.5 mg group (LS mean 2,283.4 mg, unadjusted p = .0441) but not the tanezumab 5 mg group (2,703.4 mg, unadjusted p = .1895) compared with the placebo group (3,690.6 mg) at Week 2 (Table S4).
TABLE 2.
Number of days of rescue medication use per week (total population)
| Placebo (n = 282) | Tanezumab 2.5 mg (n = 283) | Tanezumab 5 mg (n = 284) | ||
|---|---|---|---|---|
| Week 2 | LS mean (95% CI) | 3.17 (2.69, 3.74) | 2.12 (1.78, 2.52) | 2.39 (2.02, 2.83) |
| LS mean ratio (95% CI) versus placebo | 0.67 (0.54, 0.82) | 0.75 (0.61, 0.92) | ||
| Unadjusted p‐value | 0.0001 | 0.0067 | ||
| Week 4 | LS mean (95% CI) | 2.82 (2.32, 3.41) | 1.81 (1.49, 2.20) | 2.07 (1.70, 2.52) |
| LS mean ratio (95% CI) versus placebo | 0.64 (0.51, 0.82) | 0.74 (0.58, 0.93) | ||
| Unadjusted p‐value | 0.0003 | 0.0112 | ||
| Week 8 | LS mean (95% CI) | 2.54 (2.09, 3.10) | 1.83 (1.50, 2.24) | 1.92 (1.57, 2.34) |
| LS mean ratio (95% CI) versus placebo | 0.72 (0.56, 0.92) | 0.75 (0.59, 0.96) | ||
| Unadjusted p‐value | 0.0093 | 0.0237 | ||
| Week 12 | LS mean (95% CI) | 2.29 (1.83, 2.88) | 1.70 (1.35, 2.14) | 1.72 (1.37, 2.17) |
| LS mean ratio (95% CI) versus placebo | 0.74 (0.56, 0.98) | 0.75 (0.57, 1.00) | ||
| Unadjusted p‐value | 0.0374 | 0.0468 | ||
| Week 16 | LS mean (95% CI) | 2.11 (1.69, 2.63) | 1.64 (1.31, 2.06) | 1.70 (1.37, 2.13) |
| LS mean ratio (95% CI) versus placebo | 0.78 (0.59, 1.03) | 0.81 (0.61, 1.06) | ||
| Unadjusted p‐value | 0.0751 | 0.1305 | ||
| Week 24 | LS mean (95% CI) | 1.74 (1.36, 2.23) | 1.49 (1.17, 1.89) | 1.43 (1.12, 1.83) |
| LS mean ratio (95% CI) versus placebo | 0.85 (0.63, 1.16) | 0.82 (0.61, 1.11) | ||
| Unadjusted p‐value | 0.3057 | 0.2056 |
Last observation carried forward. Negative Binomial model terms included baseline WOMAC Pain score, baseline average daily index joint pain score, index joint, highest KL grade and treatment group.
Abbreviations: CI, confidence interval; KL, Kellgren‐Lawrence; LS, least squares; WOMAC, Western Ontario and McMaster Universities Osteoarthritis Index.
At Week 2, a higher proportion of patients in the tanezumab 2.5 mg group than in the placebo group achieved ≥30% reduction from baseline in WOMAC Pain (46.8% [132/282] vs. 33.5% [94/281], unadjusted p = .0006, Figure 3a) or Physical Function (44.3% [125/282] vs. 30.2% [85/281], unadjusted p = .0003, Figure 4a) scores, or met the criteria for OMERACT‐OARSI response (63.1% [178/282] vs. 44.1% [124/281], unadjusted p < .0001, Figure 5). The proportion of patients meeting the ≥50% reduction criteria at Week 2 was higher for the tanezumab 2.5 mg group versus placebo for WOMAC Pain (unadjusted p = .0008, Figure 3b) but this was not the case for Physical Function (unadjusted p = .1031, Figure 4b) score. Findings for the tanezumab 5 mg group were generally comparable to the tanezumab 2.5 mg group at Week 2 in terms of WOMAC Pain (Figure 3), Physical Function (Figure 4), and OMERACT‐OARSI (Figure 5) responders.
FIGURE 3.
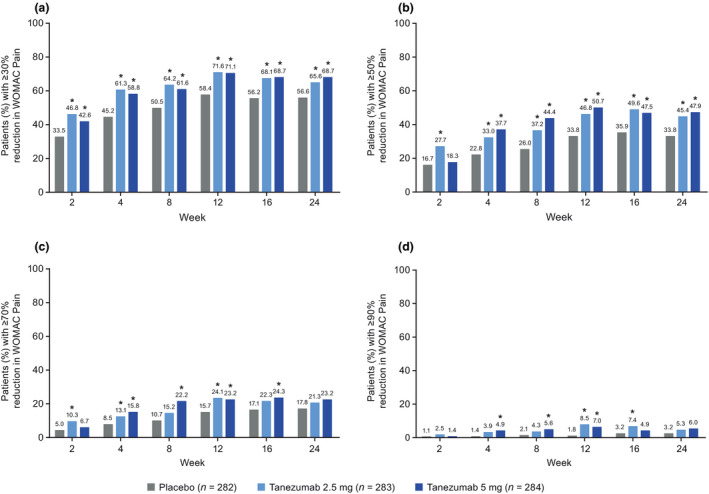
Proportion of patients with (a) ≥30%, (b) ≥50%, (c) ≥70%, or (d) ≥90% reduction from baseline in WOMAC Pain score throughout the treatment period (total population). *Unadjusted p ≤ .05 versus placebo. The data for Week 24 have been previously published (Berenbaum et al., 2020). Two patients not evaluable for this outcome, one in each of the placebo and tanezumab 2.5 mg groups. Logistic regression with mixed baseline/last observation carried forward, with model terms for baseline score, baseline average daily index joint pain score, index joint, highest KL grade and treatment group. KL, Kellgren‐Lawrence; WOMAC, Western Ontario and McMaster Universities Osteoarthritis Index
FIGURE 4.
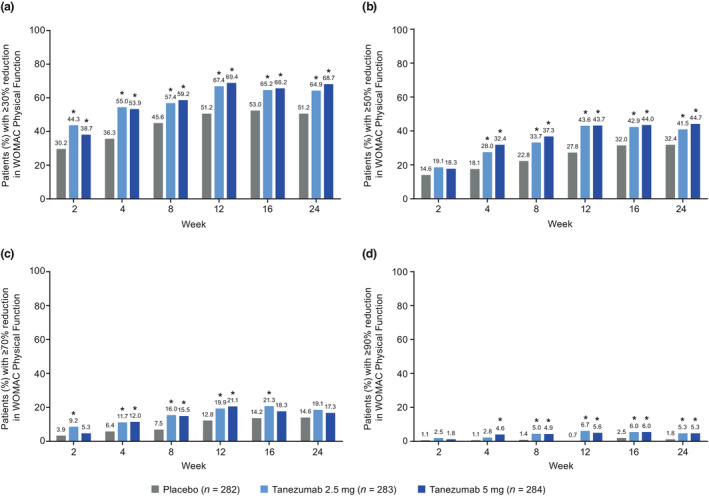
Proportion of patients with (a) ≥30%, (b) ≥50%, (c) ≥70%, or (d) ≥90% reduction from baseline in WOMAC Physical Function score throughout the treatment period (total population). *Unadjusted p ≤ .05 versus placebo. Two patients not evaluable for this outcome, one in each of the placebo and tanezumab 2.5 mg groups. Logistic regression with mixed baseline/last observation carried forward, with model terms for baseline score, baseline average daily index joint pain score, index joint, highest KL grade and treatment group. KL, Kellgren‐Lawrence; WOMAC, Western Ontario and McMaster Universities Osteoarthritis Index
FIGURE 5.
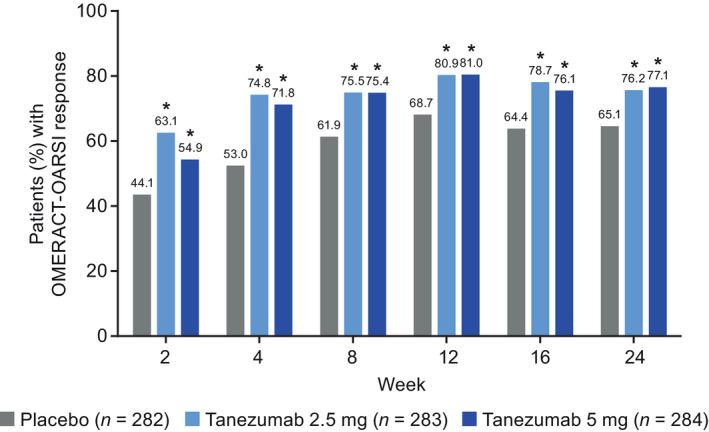
Patients meeting the criteria for OMERACT‐OARSI response during the 24‐week treatment period (total population). *Unadjusted p ≤ .05 versus placebo. Two patients not evaluable for this outcome, one in each of the placebo and tanezumab 2.5 mg groups. Logistic regression with mixed baseline/last observation carried forward, with model terms for baseline WOMAC Pain score, baseline average daily index joint pain score, index joint, highest KL grade and treatment group. KL, Kellgren‐Lawrence; OMERACT‐OARSI, Outcomes Measures in Rheumatology‐Osteoarthritis Research Society International; WOMAC, Western Ontario and McMaster Universities Osteoarthritis Index
3.3. Maintenance of efficacy
In the total population, improvements in pain and function were maintained through the 24‐week treatment period. Reductions from baseline in average daily index joint pain score (LS mean) were greater for each tanezumab group compared with the placebo group at all weekly time points through Week 24 (unadjusted p ≤ .05), with the exception of the tanezumab 2.5 mg group at Week 24 (Figure 1b). Reductions from baseline in WOMAC Pain, Physical Function and PGA‐OA scores (LS mean) were greater for each tanezumab group compared with the placebo group at all time points through Week 16 (unadjusted p ≤ .05, Figure 2) and were statistically significant at Week 24 (Berenbaum et al., 2020) (p ≤ .05) with the exception of PGA‐OA in the tanezumab 2.5 mg group. Effect sizes for WOMAC Pain at Week 24 were 0.24 (tanezumab 2.5 mg) and 0.32 (tanezumab 5 mg) (Berenbaum et al., 2020) (Table S3). Greater reductions from baseline in WOMAC Stiffness score (LS mean) were also seen for each tanezumab group compared with the placebo group at all time points through Week 24 (Figure 2c). After the Week 2 measurement, further improvements from baseline in pain and function were evident at Week 4 (Figures 1b and 2).
Rescue medication use (days per week) was lower for both tanezumab groups compared with the placebo group at Week 4 through Week 12 (LS mean, unadjusted p ≤ .05), but not at Week 16 or 24 (Table 2). There were no differences in the amount of rescue medication used per week (mg) by either tanezumab group compared with the placebo group from Week 4 through Week 24 (Table S4).
At all time points through Week 24, a higher proportion of patients in the tanezumab 2.5 mg group than in the placebo group achieved ≥30% reductions in WOMAC Pain (Figure 3a) and Physical Function (Figure 4a) score and met the criteria for OMERACT‐OARSI response (Figure 5) (unadjusted p ≤ .05). The proportion of patients achieving ≥50% reduction in WOMAC Pain (Figure 3b) or Physical Function (Figure 4b) score was greater for the tanezumab 2.5 mg group versus placebo at Week 4 through Week 24 (unadjusted p ≤ .05). Findings for the tanezumab 5 mg group were generally comparable to the tanezumab 2.5 mg group through the treatment period in terms of WOMAC Pain (Figure 3), Physical Function (Figure 4) and OMERACT‐OARSI (Figure 5) responders.
At Week 16 and Week 24, patient satisfaction based on the mPRTI was better for each tanezumab group compared with placebo (unadjusted p ≤ .05, Table S5).
From Week 24 to Week 32, pain and functional disability gradually returned but did not increase above baseline. At Week 32, changes from baseline (mean ± SD, observed data) for placebo and tanezumab 2.5 mg and 5 mg groups, respectively, were −2.19 ± 2.40, −2.07 ± 2.33, and −2.13 ± 2.40 for average daily index joint pain score; −2.70 ± 2.06, −2.29 ± 1.95 and −2.26 ± 2.24 for WOMAC Pain score; and −2.55 ± 1.98 −2.22 ± 1.92 and −2.24 ± 2.09 for WOMAC Physical Function score. At Week 32, PGA‐OA and WOMAC Stiffness scores also did not increase above baseline (data not shown).
3.4. Subgroup analyses based on KL grade of the index joint
For the KL4 subgroup, there was a greater improvement from baseline in WOMAC Pain and Physical Function scores (LS mean) for each tanezumab group compared with placebo at all time points from Week 2 through Week 24 (unadjusted p ≤ .05). For the KL2/3 subgroup, the LS mean improvement from baseline in WOMAC Pain and Physical Function scores was greater for the tanezumab 2.5 mg group (at Weeks 2, 4, and 12) and the tanezumab 5 mg group (at Weeks 4, 8 and 12), compared with placebo (unadjusted p ≤ .05). In the tanezumab 2.5 mg group, the placebo‐adjusted change from baseline in WOMAC Pain score (LS mean difference) at Week 24 was −0.84 for the KL4 subgroup and −0.19 for the KL2/3 subgroup, and improvements in WOMAC Physical Function were −1.01 and −0.28, respectively (Table 3).
TABLE 3.
Subgroup analyses for patients with index joint of KL grade 2 or 3 (KL2/3) or KL grade 4 (KL4) (total population)
| Change from baseline | KL2/3 | KL4 | ||||||||
|---|---|---|---|---|---|---|---|---|---|---|
|
Placebo (n = 173) |
Tanezumab 2.5 mg (n = 174) |
Tanezumab 5 mg (n = 175) |
Placebo (n = 109) |
Tanezumab 2.5 mg (n = 109) |
Tanezumab 5 mg (n = 109) |
|||||
| WOMAC Pain | ||||||||||
| Week 2 | LS mean (95% CI) | −1.45 (−1.78, −1.12) | −2.06 (−2.39, −1.73) | −1.66 (−1.99, −1.34) | −1.27 (−1.68, −0.85) | −2.02 (−2.43, −1.60) | −1.75 (−2.17, −1.33) | |||
| LS mean difference (95% CI) versus placebo | −0.61 (−0.96, −0.26) | −0.22 (−0.57, 0.13) | −0.75 (−1.18, −0.32) | −0.48 (−0.91, −0.05) | ||||||
| Unadjusted p‐value | 0.0006 | 0.2237 | 0.0006 | 0.0292 | ||||||
| Week 24 | LS mean (95% CI) | −2.55 (−2.96, −2.13) | −2.73 (−3.13, −2.34) | −2.86 (−3.26, −2.47) | −1.66 (−2.19, −1.14) | −2.51 (−3.02, −1.99) | −2.64 (−3.18, −2.11) | |||
| LS mean difference (95% CI) versus placebo | −0.19 (−0.64, 0.27) | −0.32 (−0.77, 0.14) | −0.84 (−1.38, −0.30) | −0.98 (−1.53, −0.43) | ||||||
| Unadjusted p‐value | 0.4194 | 0.1727 | 0.0023 | 0.0005 | ||||||
| WOMAC Physical Function | ||||||||||
| Week 2 | LS mean (95% CI) | −1.42 (−1.74, −1.09) | −1.99 (−2.32, −1.67) | −1.62 (−1.94, −1.30) | −1.03 (−1.43, −0.63) | −1.90 (−2.30, −1.49) | −1.77 (−2.19, −1.36) | |||
| LS mean difference (95% CI) versus placebo | −0.58 (−0.92, −0.23) | −0.20 (−0.54, 0.15) | −0.87 (−1.29, −0.44) | −0.75 (−1.17, −0.33) | ||||||
| Unadjusted p‐value | 0.0011 | 0.2595 | <0.0001 | 0.0005 | ||||||
| Week 24 | LS mean (95% CI) | −2.43 (−2.84, −2.01) | −2.71 (−3.10, −2.31) | −2.83 (−3.22, −2.44) | −1.47 (−1.99, −0.95) | −2.49 (−3.00, −1.98) | −2.56 (−3.08, −2.04) | |||
| LS mean difference (95% CI) versus placebo | −0.28 (−0.73, 0.17) | −0.41 (−0.86, 0.04) | −1.01 (−1.55, −0.48) | −1.08 (−1.63, −0.54) | ||||||
| Unadjusted p‐value | 0.2231 | 0.0749 | 0.0002 | <0.0001 | ||||||
Highest KL grade as a randomization factor was used to identify subgroup: the sample sizes differ from those in Table S1 (see supplementary material) since KL grade as a randomization factor was different from KL grade of the index joint for some patients. Multiple imputation. ANCOVA models included treatment and randomization stratification variable (index joint) as fixed effects, baseline score and average daily index joint pain scores as covariates, and study site as a random effect. At baseline, for the placebo, tanezumab 2.5 mg and tanezumab 5 mg, groups, respectively, WOMAC Pain scores (mean ± SD, observed data) were 6.49 ± 0.92 (n = 172), 6.65 ± 0.97 (n = 173) and 6.56 ± 0.92 (n = 175) for the KL2/3 subgroup and 6.75 ± 0.94 (n = 109), 6.76 ± 0.89 (n = 109) and 6.66 ± 0.85 (n = 109) for the KL4 subgroup; WOMAC Physical Function scores were 6.58 ± 0.86 (n = 172), 6.75 ± 0.89 (n = 173) and 6.72 ± 0.88 (n = 175) for the KL2/3 subgroup and 6.80 ± 0.87 (n = 109), 6.80 ± 0.85 (n = 109) and 6.84 ± 0.87 (n = 109) for the KL4 subgroup.
Abbreviations: ANCOVA, analysis of covariance; CI, confidence interval; KL, Kellgren‐Lawrence; LS, least squares; SD, standard deviation; WOMAC, Western Ontario and McMaster Universities Osteoarthritis Index.
3.5. Subgroup of patients from Japan
The onset and maintenance of efficacy of tanezumab in the subgroup of patients from Japan was consistent with that of the total population, including LS mean reductions from baseline in WOMAC Pain, Physical Function and PGA‐OA scores (the coprimary endpoints) at Week 24 (Table 1).
At Week 2, notably more patients in the tanezumab 2.5 mg (23.7%, 9/38) and 5 mg (29.4%, 10/34) groups than the placebo group (14.7%, 5/34) had ≥30% reduction in WOMAC Pain score; a similar pattern was seen for the ≥50% reduction in WOMAC Pain score criterion (tanezumab 2.5 mg [13.2%, 5/38], tanezumab 5 mg [14.7%, 5/34], placebo [2.9%, 1/34]). At Week 24, ≥30% reduction in WOMAC Pain score was achieved by 63.2% (24/38) of patients in the tanezumab 2.5 mg group, 55.9% (19/34) of patients in the tanezumab 5 mg group and 32.4% (11/34) of patients in the placebo group; a similar pattern was seen for the ≥50% reduction in WOMAC Pain score criterion (tanezumab 2.5 mg [36.8%, 14/38], tanezumab 5 mg [44.1%, 15/34], placebo [14.7%, 5/34]). However, the small sample size of the subgroup of patients from Japan means that interpretation of those findings should be treated cautiously.
3.6. Safety
Safety data for the total population are reported in full elsewhere (Berenbaum et al., 2020). In the subgroup of patients from Japan, safety outcomes were not markedly different from those of the total population during the double‐blind treatment period, although the sample size was small.
4. DISCUSSION
This exploratory analysis found that in patients with moderate‐to‐severe OA for whom standard analgesics were inadequate or could not be taken, the onset of efficacy of subcutaneous tanezumab was within the first week, and efficacy was maintained through the 24‐week treatment period.
The early and sustained efficacy of tanezumab seen in the current study in patients enrolled in Europe and Japan is supported by a previous study in North America with primary endpoints at Week 16 (Schnitzer et al., 2020). Both studies showed greater improvement from baseline in WOMAC Pain, Physical Function and PGA‐OA scores (LS mean) at Week 16 for tanezumab compared with placebo. For the tanezumab 2.5 mg group, the mean baseline WOMAC Pain score in the current study (6.7) was lower than in the North American study (7.1) (Schnitzer et al., 2020), which may account for the smaller magnitude of the changes from baseline in the current study across all three outcomes at Week 16 (Figure 2 and Table S6). Efficacy was largely similar for tanezumab 2.5 mg and 5 mg in the current study, and the small differences are not considered clinically meaningful. Only limited additional efficacy was seen previously with dose titration from 2.5 mg to 5 mg (Schnitzer et al., 2020), but more joint safety findings have been observed with tanezumab 5 mg than tanezumab 2.5 mg (Berenbaum et al., 2020).
The improvements in pain seen in the current study are clinically meaningful. The effect sizes for average daily index joint pain at Week 1, WOMAC Pain at Week 2, as well as WOMAC Pain at Week 24 (Berenbaum et al., 2020) are all above the suggested lower threshold for meaningfulness (0.2) (Cohen, 1988) for both tanezumab groups (Table S3). Both tanezumab groups also used less rescue medication (LS mean days per week) compared with the placebo group through Week 12 in the current study.
The problems associated with evaluating effectiveness based on mean improvements have been discussed, including negligible mean benefits that reach statistical significance if the study is sufficiently powered, and the influence of individuals with a very large improvement on the overall mean despite others experiencing worsening pain or little improvement (Dworkin et al., 2008). Furthermore, since each patient experiences pain differently, assessing individual responses to treatment (Dworkin et al., 2008) is arguably more relevant. Within‐patient improvements in WOMAC Pain score of 30% or more relative to baseline are often reported to be moderately clinically important (Dworkin et al., 2008; Farrar et al., 2001). In the current study, 46.8% of patients treated with tanezumab 2.5 mg (compared with 33.5% for placebo) experienced a moderate (≥30%) clinically important (Dworkin et al., 2008) reduction in WOMAC Pain score at Week 2, and 27.7% of patients treated with tanezumab 2.5 mg (compared with 16.7% for placebo) had a substantial (≥50%) clinically important (Dworkin et al., 2008) reduction in WOMAC Pain; this was sustained through the 24‐week study. It should be noted that although a 30% change from baseline in WOMAC Pain score is widely used as a threshold for meaningful relief, a 10%–20% improvement is noticeable to some patients (Dworkin et al., 2008).
These clinically meaningful improvements are supported by the other outcomes. Although clinically relevant improvements in WOMAC Physical Function score remain to be elucidated, applying the same cut‐off criteria (≥30% improvement) as for pain demonstrates greater improvement in function for tanezumab compared with placebo throughout the study. More patients in both tanezumab groups compared with placebo met the criteria for the clinically relevant OMERACT‐OARSI response (Pham et al., 2003, 2004) at all time points through Week 24 (Figure 5). Satisfaction with treatment as reported by patients was greater at Weeks 16 and 24 for patients treated with tanezumab compared with those treated with placebo.
The subgroup analysis based on KL grade of the index joint indicated that subcutaneous tanezumab was effective in patients with the most radiographically severe OA (KL4). Interestingly, the magnitude of the placebo‐adjusted changes from baseline (LS mean) was greater for the KL4 subgroup compared with the KL2/3 subgroup. The tanezumab response was similar but the placebo response was greater for the KL2/3 subgroup versus the KL4 subgroup (Table 3). There are few data available for comparison that examine the efficacy of any analgesic specifically in patients with radiographically severe OA, and considering the often inconsistent association between pain and radiographic findings (Kinds et al., 2011), those findings with tanezumab warrant future investigation.
The efficacy of tanezumab in the small subgroup of patients from Japan was consistent with the total population. At Week 24, the change from baseline in WOMAC Pain and Physical Function and PGA‐OA scores (LS mean) in the placebo group as well as the tanezumab groups was smaller in the Japanese subgroup compared with the total population (Table 1); however, the magnitude of the placebo‐adjusted changes were consistently greater in the subgroup of patients from Japan.
The limitations of this study have been discussed previously (Berenbaum et al., 2020). The post hoc nature of the subgroup analyses based on KL grade of the index joint, and the small sample size of the subgroup of patients from Japan, means that interpretation of those findings should be treated cautiously.
5. CONCLUSIONS
This exploratory analysis found that in patients with moderate‐to‐severe OA for whom standard analgesics were not effective or could not be taken, the onset of efficacy of subcutaneous tanezumab was within the first week, and efficacy was maintained through the 24‐week treatment period. Although the effect sizes were modest, more patients treated with tanezumab than placebo had a clinically important within‐patient reduction in WOMAC Pain, corresponding improvement in WOMAC Physical Function, and met the criteria for OMERACT‐OARSI response, at all time points during the 24‐week treatment period. The tanezumab groups also reported more patient satisfaction compared with placebo. Tanezumab was effective in those patients with the most radiologically severe OA, for whom the placebo response was less pronounced.
CONFLICT OF INTEREST
Francis Berenbaum reports personal fees from Boehringer, Bone Therapeutics, Expanscience, Galapagos, Gilead, GSK, Lilly, Merck Serono, MSD, Nordic, Novartis, Pfizer, Regulaxis, Roche, Sandoz, Sanofi, Servier, UCB, Peptinov, TRB Chemedica and 4P Pharma, outside the submitted work. Richard Langford has received payments for advisory board and speaker activities from Pfizer and Eli Lilly, outside the submitted work, and in addition from Grunenthal, BioQ Pharma, Ipsen and Heron Pharmaceuticals. Serge Perrot has received fees for advisory boards from Lilly and Pfizer. Kenji Miki reports personal fees from Merck, Pfizer, Lilly, Ayumi, Mundi Pharma, Janssen, Nippon Zoki and Daiichi‐Sankyo, outside the submitted work. Francisco J. Blanco has received consulting fees or other remuneration from AbbVie, Pfizer, UCB, Bristol‐Myers Squibb, Roche, Servier, Bioiberica, Sanofi, Grünenthal, GlaxoSmithKline, Lilly, Janssen, Regeneron, Amgen and TRB Chemedica, outside the submitted work. Takaharu Yamabe, Rod Junor, William Carey, Christine R. West, Mark T. Brown and Kenneth M. Verburg are employees of Pfizer with stock and/or stock options. Naoki Isogawa is an employee of Pfizer R&D Japan with stock and/or stock options. Lars Viktrup is an employee of Eli Lilly and Company and owns stock in Lilly.
AUTHOR CONTRIBUTIONS
Lars Viktrup, Christine R. West, Mark T. Brown and Kenneth M. Verburg contributed to the conception or design of the study. All authors contributed to the acquisition, analysis or interpretation of data. Takaharu Yamabe was the study statistician. All authors contributed to drafting the manuscript and revising it critically for important intellectual content. All authors approved the final version to be published and agree to be accountable for all aspects of the work in ensuring that questions related to the accuracy or integrity of any part of the work are appropriately investigated and resolved.
Supporting information
Supplementary Material
ACKNOWLEDGEMENTS
Some of these data were published as an abstract following acceptance for the Osteoarthritis Research Society International (OARSI) World Congress, 2020 (Berenbaum et al., 2020). Osteoarthritis Cartilage, 28 suppl 1, S144–S145). Medical writing support was provided by Kim Russell, PhD, of Engage Scientific Solutions (Horsham, UK) and was funded by Pfizer and Eli Lilly and Company.
Berenbaum F, Langford R, Perrot S, et al. Subcutaneous tanezumab for osteoarthritis: Is the early improvement in pain and function meaningful and sustained?. Eur J Pain. 2021;25:1525–1539. 10.1002/ejp.1764
Funding information
The study was sponsored by Pfizer and Eli Lilly and Company. Pfizer is the manufacturer of tanezumab, which is being investigated for the treatment of patients with chronic pain. The authors received no payment for the preparation of this manuscript. The salaried employees from Pfizer and Eli Lilly and Company included stock and/or stock options in their declarations. Manuscript authors from Pfizer contributed to the study design; data collection, management and interpretation of data; and the preparation, review and approval of the manuscript. Manuscript authors from Eli Lilly and Company contributed to the study design; interpretation of data and the preparation, review and approval of the manuscript.
DATA AVAILABILITY STATEMENT
Upon request, and subject to certain criteria, conditions and exceptions (see https://www.pfizer.com/science/clinical‐trials/trial‐data‐and‐results for more information), Pfizer will provide access to individual de‐identified participant data from Pfizer‐sponsored global interventional clinical studies conducted for medicines, vaccines and medical devices (1) for indications that have been approved in the US and/or EU or (2) in programs that have been terminated (i.e., development for all indications has been discontinued). Pfizer will also consider requests for the protocol, data dictionary, and statistical analysis plan. Data may be requested from Pfizer trials 24 months after study completion. The de‐identified participant data will be made available to researchers whose proposals meet the research criteria and other conditions, and for which an exception does not apply, via a secure portal. To gain access, data requestors must enter into a data access agreement with Pfizer.
REFERENCES
- Bannuru, R. R., Osani, M. C., Vaysbrot, E. E., Arden, N. K., Bennell, K., Bierma‐Zeinstra, S. M. A., Kraus, V. B., Lohmander, L. S., Abbott, J. H., Bhandari, M., Blanco, F. J., Espinosa, R., Haugen, I. K., Lin, J., Mandl, L. A., Moilanen, E., Nakamura, N., Snyder‐Mackler, L., Trojian, T., … McAlindon, T. E. (2019). OARSI guidelines for the non‐surgical management of knee, hip, and polyarticular osteoarthritis. Osteoarthritis Cartilage, 27, 1578–1589. 10.1016/j.joca.2019.06.011 [DOI] [PubMed] [Google Scholar]
- Berenbaum, F., Blanco, F. J., Guermazi, A., Miki, K., Yamabe, T., Viktrup, L., Junor, R., Carey, W., Brown, M. T., West, C. R., & Verburg, K. M. (2020). Subcutaneous tanezumab for osteoarthritis of the hip or knee: Efficacy and safety results from a 24‐week randomised phase 3 study with a 24‐week follow‐up period. Annals of the Rheumatic Diseases, 79, 800–810. 10.1136/annrheumdis-2019-216296 [DOI] [PMC free article] [PubMed] [Google Scholar]
- Bretz, F., Posch, M., Glimm, E., Klinglmueller, F., Maurer, W., & Rohmeyer, K. (2011). Graphical approaches for multiple comparison procedures using weighted Bonferroni, Simes, or parametric tests. Biometrical Journal, 53, 894–913. 10.1002/bimj.201000239 [DOI] [PMC free article] [PubMed] [Google Scholar]
- Brown, M. T., Murphy, F. T., Radin, D. M., Davignon, I., Smith, M. D., & West, C. R. (2012). Tanezumab reduces osteoarthritic knee pain: Results of a randomized, double‐blind, placebo‐controlled phase III trial. The Journal of Pain, 13, 790–798. 10.1016/j.jpain.2012.05.006 [DOI] [PubMed] [Google Scholar]
- Brown, M. T., Murphy, F. T., Radin, D. M., Davignon, I., Smith, M. D., & West, C. R. (2013). Tanezumab reduces osteoarthritic hip pain: Results of a randomized, double‐blind, placebo‐controlled phase III trial. Arthritis and Rheumatism, 65, 1795–1803. 10.1002/art.37950 [DOI] [PubMed] [Google Scholar]
- Cohen, J. (1988). Statistical power analysis for the behavioral sciences. (2nd ed.). Lawrence Erlbaum Associates. [Google Scholar]
- Dworkin, R. H., Turk, D. C., Wyrwich, K. W., Beaton, D., Cleeland, C. S., Farrar, J. T., Haythornthwaite, J. A., Jensen, M. P., Kerns, R. D., Ader, D. N., Brandenburg, N., Burke, L. B., Cella, D., Chandler, J., Cowan, P., Dimitrova, R., Dionne, R., Hertz, S., Jadad, A. R., … Zavisic, S. (2008). Interpreting the clinical importance of treatment outcomes in chronic pain clinical trials: IMMPACT recommendations. The Journal of Pain, 9, 105–121. 10.1016/j.jpain.2007.09.005 [DOI] [PubMed] [Google Scholar]
- Farrar, J. T., Young, J. P., Jr, LaMoreaux, L., Werth, J. L., & Poole, R. M. (2001). Clinical importance of changes in chronic pain intensity measured on an 11‐point numerical pain rating scale. Pain, 94, 149–158. 10.1016/s0304-3959(01)00349-9 [DOI] [PubMed] [Google Scholar]
- Geenen, R., Overman, C. L., Christensen, R., Asenlof, P., Capela, S., Huisinga, K. L., Husebo, M. E. P., Koke, A. J. A., Paskins, Z., Pitsillidou, I. A., Savel, C., Austin, J., Hassett, A. L., Severijns, G., Stoffer‐Marx, M., Vlaeyen, J. W. S., Fernandez‐de‐Las‐Penas, C., Ryan, S. J., & Bergman, S. (2018). EULAR recommendations for the health professional's approach to pain management in inflammatory arthritis and osteoarthritis. Annals of the Rheumatic Diseases, 77, 797–807. 10.1136/annrheumdis-2017-212662 [DOI] [PubMed] [Google Scholar]
- Kellgren, J. H., & Lawrence, J. S. (1957). Radiological assessment of osteo‐arthrosis. Annals of the Rheumatic Diseases, 16, 494–502. 10.1136/ard.16.4.494 [DOI] [PMC free article] [PubMed] [Google Scholar]
- Kinds, M. B., Welsing, P. M., Vignon, E. P., Bijlsma, J. W., Viergever, M. A., Marijnissen, A. C., & Lafeber, F. P. (2011). A systematic review of the association between radiographic and clinical osteoarthritis of hip and knee. Osteoarthritis Cartilage, 19, 768–778. 10.1016/j.joca.2011.01.015 [DOI] [PubMed] [Google Scholar]
- Kolasinski, S. L., Neogi, T., Hochberg, M. C., Oatis, C., Guyatt, G., Block, J., Callahan, L., Copenhaver, C., Dodge, C., Felson, D., Gellar, K., Harvey, W. F., Hawker, G., Herzig, E., Kwoh, C. K., Nelson, A. E., Samuels, J., Scanzello, C., White, D., … Reston, J. (2020). 2019 American College of Rheumatology/Arthritis Foundation Guideline for the management of osteoarthritis of the hand, hip, and knee. Arthritis Care & Research, 72, 149–162. 10.1002/acr.24131 [DOI] [PMC free article] [PubMed] [Google Scholar]
- Lane, N. E., Schnitzer, T. J., Birbara, C. A., Mokhtarani, M., Shelton, D. L., Smith, M. D., & Brown, M. T. (2010). Tanezumab for the treatment of pain from osteoarthritis of the knee. New England Journal of Medicine, 363, 1521–1531. 10.1056/NEJMoa0901510 [DOI] [PMC free article] [PubMed] [Google Scholar]
- Osteoarthritis Research Society International . (2016). White paper: osteoarthritis: a serious disease, submitted to the U.S. Food and Drug Administration December 1, 2016. Retrieved from: https://www.oarsi.org/sites/default/files/docs/2016/oarsi_white_paper_oa_serious_disease_121416_1.pdf [Google Scholar]
- Pham, T., van der Heijde, D., Altman, R. D., Anderson, J. J., Bellamy, N., Hochberg, M., Simon, L., Strand, V., Woodworth, T., & Dougados, M. (2004). OMERACT‐OARSI initiative: Osteoarthritis Research Society International set of responder criteria for osteoarthritis clinical trials revisited. Osteoarthritis Cartilage, 12, 389–399. 10.1016/j.joca.2004.02.001 [DOI] [PubMed] [Google Scholar]
- Pham, T., Van Der Heijde, D., Lassere, M., Altman, R. D., Anderson, J. J., Bellamy, N., Hochberg, M., Simon, L., Strand, V., Woodworth, T., & Dougados, M. (2003). Outcome variables for osteoarthritis clinical trials: The OMERACT‐OARSI set of responder criteria. Journal of Rheumatology, 30, 1648–1654. [PubMed] [Google Scholar]
- Schnitzer, T. J., Easton, R., Pang, S., Levinson, D. J., Pixton, G., Viktrup, L., Davignon, I., Brown, M. T., Verburg, K. M., & West, C. R. (2019). Efficacy and safety of tanezumab for the treatment of osteoarthritis pain in the hip or knee. A Randomized Clinical Trial. JAMA, 322, 37–48. 10.1001/jama.2019.8044 [DOI] [PMC free article] [PubMed] [Google Scholar]
- Schnitzer, T. J., Khan, A., Bessette, L., Davignon, I., Brown, M. T., Pixton, G., Prucka, W., Tive, L., Viktrup, L., & West, C. R. (2020). Onset and maintenance of efficacy of subcutaneous tanezumab in patients with moderate to severe osteoarthritis of the knee or hip: A 16‐week dose‐titration study. Seminars in Arthritis and Rheumatism, 50, 387–393. 10.1016/j.semarthrit.2020.03.004 [DOI] [PubMed] [Google Scholar]
- Spierings, E. L., Fidelholtz, J., Wolfram, G., Smith, M. D., Brown, M. T., & West, C. R. (2013). A phase III placebo‐ and oxycodone‐controlled study of tanezumab in adults with osteoarthritis pain of the hip or knee. Pain, 154, 1603–1612. 10.1016/j.pain.2013.04.035 [DOI] [PubMed] [Google Scholar]
- Theiler, R., Spielberger, J., Bischoff, H. A., Bellamy, N., Huber, J., & Kroesen, S. (2002). Clinical evaluation of the WOMAC 3.0 OA Index in numeric rating scale format using a computerized touch screen version. Osteoarthritis Cartilage, 10, 479–481. 10.1053/joca.2002.0807 [DOI] [PubMed] [Google Scholar]
Associated Data
This section collects any data citations, data availability statements, or supplementary materials included in this article.
Supplementary Materials
Supplementary Material
Data Availability Statement
Upon request, and subject to certain criteria, conditions and exceptions (see https://www.pfizer.com/science/clinical‐trials/trial‐data‐and‐results for more information), Pfizer will provide access to individual de‐identified participant data from Pfizer‐sponsored global interventional clinical studies conducted for medicines, vaccines and medical devices (1) for indications that have been approved in the US and/or EU or (2) in programs that have been terminated (i.e., development for all indications has been discontinued). Pfizer will also consider requests for the protocol, data dictionary, and statistical analysis plan. Data may be requested from Pfizer trials 24 months after study completion. The de‐identified participant data will be made available to researchers whose proposals meet the research criteria and other conditions, and for which an exception does not apply, via a secure portal. To gain access, data requestors must enter into a data access agreement with Pfizer.