

Abstract
Purpose
Electrical epidural spinal cord stimulation (SCS) is used as a treatment for chronic pain as well as to partially restore motor function after a spinal cord injury. Monitoring the spinal cord activity during SCS with fMRI could provide important and objective measures of integrative responses to treatment. Unfortunately, spinal cord fMRI is severely challenged by motion and susceptibility artifacts induced by the implanted electrode and bones. This pilot study introduces multi‐band sweep imaging with Fourier transformation (MB‐SWIFT) technique for spinal cord fMRI during SCS in rats. Given the close to zero acquisition delay and high bandwidth in 3 dimensions, MB‐SWIFT is demonstrated to be highly tolerant to motion and susceptibility‐induced artifacts and thus holds promise for fMRI during SCS.
Methods
MB‐SWIFT with 0.78 × 0.78 × 1.50 mm3 spatial resolution and 3‐s temporal resolution was used at 9.4 Tesla in rats undergoing epidural SCS at different frequencies. Its performance was compared with spin echo EPI. The origin of the functional contrast was also explored using suppression bands.
Results
MB‐SWIFT was tolerant to electrode‐induced artifacts and respiratory motion, leading to substantially higher fMRI sensitivity than spin echo fMRI. Clear stimulation frequency‐dependent responses to SCS were detected in the rat spinal cord close to the stimulation site. The origin of MB‐SWIFT fMRI signals was consistent with dominant inflow effects.
Conclusion
fMRI of the rat spinal cord during SCS can be consistently achieved with MB‐SWIFT, thus providing a valuable experimental framework for assessing the effects of SCS on the central nervous system.
Keywords: epidural stimulation, fMRI, MB‐SWIFT, rats, spinal cord stimulation, zero echo time
1. INTRODUCTION
Electrical stimulation of the nervous system via the spinal cord is a powerful neuromodulation tool that today is applied in the treatment of pain and holds potential for recovery from spinal cord injury.1 Spinal cord stimulation (SCS) can be effectively used not only to manipulate the impaired circuitries of the nervous system but also to understand and assess their state.2 As stated, SCS is already commonly used for treating chronic pain in complex regional pain syndrome, failed back surgery syndrome, and postamputation pain as well as neuropathic and ischemic pain.3, 4
SCS for pain treatment was introduced based on the gate control hypothesis.5 This theory proposes that stimulation of the low‐threshold myelinated fibers of the spinal cord dorsal columns with electrical pulses can suppress the noxious stimuli that are being transferred by the smaller unmyelinated fibers, and thus the pain sensation can be alleviated. Conventionally, the clinical SCS produces paresthesia in the region of pain perception, thus relieving the pain.4 By adjusting the parameters of stimulation, for example, the frequency, amplitude, and duration of the pulses, it is possible to alter the strength of the stimulation and the quality and area of the paresthesia.6 Frequencies above the physiological level (>1 kHz) have been found to evoke analgesia without inducing paresthesia, whereas the usual stimulation frequencies used in the treatment of pain are lower.7 However, the exact mechanism underpinning how SCS relieves these types of pain is still not known.7, 8
In addition to pain treatment, SCS has also been found to be a promising tool for restoring robust, coordinated motor activity in humans after a spinal cord injury,2, 9 and there are reports of potential therapeutic effects of SCS in improving motor symptoms in a variety of motor disorders such as dystonia and Parkinson disease.10, 11, 12, 13
MRI and fMRI of the spinal cord can play a vital role in assessing the mechanisms of SCS regulating the functional circuitry of the nervous system. There is substantial interest in developing further the noninvasive spinal fMRI because the spinal cord is the sensorimotor interface between brain and the rest of the body.14 Furthermore, the spinal cord is involved in several neurological diseases, which makes it a clinically relevant study target.15 However, spinal cord MRI and particularly fMRI are challenging; this is because of the small diameter of the spinal cord, substantial magnetic susceptibility variations caused by bone and soft tissue interfaces, and motion arising from breathing and cardiac pulsation.16 Furthermore, in the case of simultaneous SCS and MRI acquisitions, the implanted electrodes can introduce even more magnetic susceptibility differences, which tend to compromise the fMRI data quality obtained with the conventional EPI pulse sequence and also exacerbate motion during the stimulation. The first spinal cord fMRI reports date from the late 1990s both from humans17 and animals.18 Nonetheless, even today spinal cord fMRI is at a relatively early stage of development. Several investigators have exploited different strategies to characterize and reduce the physiological noise from the spinal cord fMRI data,16, 19, 20 but no single universally accepted method has emerged.21 Recently, a single‐shot fast spin echo sequence based on signal enhancement from extravascular water proteins22 has been used for spinal cord fMRI, and it seems that this technique partially avoids the problems related to sensitivity of EPI or gradient echo sequences to magnetic susceptibility.23, 24
There are studies reporting the fMRI responses of the spinal cord to various stimuli such as electrical stimulation in the periphery23, 24 or thermal stimulation.25 The effects of SCS have been monitored with brain fMRI in humans26, 27, 28 and in rats with dorsal root ganglion stimulation.29 However, fMRI of the spinal cord during simultaneous SCS has not yet been conducted, probably due to the multiple obstacles associated with implanted electrodes.
Multiband sweep imaging with Fourier transformation (MB‐SWIFT) is a 3D radial MRI pulse sequence with virtually no acquisition delay, no echo formation, and high excitation and acquisition bandwidth in all 3 directions, which means that it is insensitive to susceptibility and motion artifacts.30, 31, 32 We recently demonstrated that MB‐SWIFT could provide a robust fMRI contrast in the presence of high magnetic susceptibility artifacts arising from tungsten electrodes in the brain,31 and that MB‐SWIFT was less sensitive to motion‐induced changes in B0 than conventional EPI.32 The fMRI contrast in MB‐SWIFT does not rely on the traditional BOLD effect33 because of the insensitivity to the susceptibility‐induced effects; instead, it likely originates from the in‐flow effect of blood.31
The aim of this pilot study was to demonstrate that MB‐SWIFT overcomes many of the challenges associated with rat spinal cord imaging, thus leading to a robust detection of spinal cord activation during SCS, an achievement not generally attainable with EPI.
2. METHODS
All animal procedures were approved by the animal experiment board in Finland and conducted in accordance with the guidelines set by the European Commission Directive 2010/63/EU. Six adult male Sprague‐Dawley rats (Envigo RMS B.V., Horst, Netherlands; 393‐532 g) were used in the experiments. The animals were maintained on a 12/12 h light–dark cycle at 22 ± 2 °C with 50% to 60% humidity. Food and water were available ad libitum.
All rats were first anesthetized with isoflurane (5% induction and 2% maintenance) in a mixture of N2/O2 (70/30%). Small cannulas were inserted into the femoral vein and artery for administration of muscle relaxant (pancuronium bromide, ∼1 mg/kg/h, intravenous, Pancuronium Actavis, Actavis Group PTC ehf., Hafnarfjordur, Iceland) and extraction of blood samples, respectively. In one rat, only the cannulation of the vein was performed due to technical difficulties during surgery. Next, a tracheal tube was inserted to ensure mechanical ventilation of the animal. Subsequently, the anesthesia was switched from isoflurane to urethane (1.25 g/kg, intraperitoneal, Sigma‐Aldrich, Helsinki, Finland), with urethane being administered in three doses 5 min apart while gradually reducing the isoflurane level. The isoflurane was reduced to ~0.5% and kept at this level until the end of the laminectomy procedure.
Spinal laminectomy was performed to allow the implantation of the stimulation electrode. First, the skin was shaved from the back and disinfected with povidone‐iodine (Betadine100 mg/mL, Takeda Pharma Sp. z o.o.A, Warsaw, Poland). Next, the vertebral levels were identified with reference to superficial markers of bilateral iliac crests and lower costal margins. The target vertebral level of the second lumbar (L2) vertebra was counted back from the sacral bone and L6 vertebra. Lidocaine was injected subcutaneously for local anesthesia. A posterior midline skin incision was made with level L2 at the center and extended both superiorly and inferiorly. The para‐vertebral back muscles were retracted from the vertebrae and dissected, exposing the spinous processes and laminae. The vertebral bones were cleaned from soft tissues. A full laminectomy of L2 vertebra and a partial laminectomy of thoracic (T) vertebra 13 (small window between T13 and L1) were conducted. A wire electrode was passed under the L1 spinous process so that the contact was placed at the vertebral level L2 (corresponding to sacral (S) spinal section S1/S2).
The electrode was made of stainless‐steel wire with formwar coating (diameter 100 µm) (California Fine Wire Company, Grover Beach, CA). A 1‐mm monopolar contact was created by removing the coating from the desired location. The electrode was attached on top of the dura with tissue adhesive (3M Vetbond Tissue Adhesive, 3M, St. Paul, MN). The Ag/AgCl grounding electrode was placed subcutaneously in the back, and the skin was closed loosely with tape.
After positioning the rat in the MRI holder, the stimulation setup was controlled by delivering current outside of the MRI scanner and visually inspecting twitches as a response to stimuli. This made it possible to determine the required level of the current amplitude. The amplitude was set to be the smallest needed to evoke a visible muscular response. The muscle relaxant was administered through the cannula in the vein, and the tracheal tube was connected to the mechanical ventilator (Inspira ASV, Harvard Apparatus Inc., Holliston, MA). The animal’s respiration was monitored, and the ventilator parameters were set so that the respiration was clearly seen from the moving abdomen. If the respiration seemed inadequate, the parameters were altered to improve respiration. Another test of the stimulation was done before transferring the animal to inside the scanner; this ensured that the muscle relaxant was blocking any motion induced by the stimulation. Body temperature was maintained at ∼37 °C with water circulation heating of the holder. Temperature and respiration of the rats were monitored using a small animal monitoring system (Model 1025, Small Animal Instruments Inc., New York, NY) with a rectal temperature probe and a respiration pneumatic sensor.
Arterial blood samples were taken 3 to 4 times during the MRI measurements from five rats and analyzed (i‐STAT Model 300, Abbott Point of Care Inc., Princeton, NJ) for pCO2, pO2, sO2, and pH values. If necessary, ventilation parameters were adjusted based on blood gas analysis results.
2.1. MRI and stimulation paradigms
The MRI measurements were conducted using 9.4 Tesla scanner with Agilent DirectDRIVE console (Palo Alto, CA). The imaging was conducted using an in‐house made transmit–receive surface RF coil, with an inner diameter of 22 mm placed on top of a parafilm layer on the loosely closed back with L2 vertebral level at the center.
High‐resolution anatomical MB‐SWIFT images were collected with TR = 2.96 ms, flip angle = 4°, 128,000 spokes, FOV = 5.0 × 5.0 × 9.6 cm3, and matrix size = 2563. MB‐SWIFT fMRI was acquired with TR = 0.97 ms, 3094 spokes per volume resulting in time resolution of 3 s, flip angle = 4°, bandwidth = 192 kHz, FOV = 5.0 × 5.0 × 9.6 cm3, and matrix size = 643. The stimulation paradigm consisted of a block of 18 s of stimulation followed by 120 s of rest repeated three times. Each paradigm started with 90 s of rest, resulting in 8 min 24 s of total time. Stimulation was achieved using 480 μs symmetric biphasic square pulses, with current amplitudes between 0.2 and 0.4 mA. Different stimulation frequencies were administered in a randomized order in three or five rats, namely 5, 20, 40, 80, 160 (n = 5), 320, and 640 Hz (n = 3). The stimulation paradigms were delivered using an external stimulus generator (STG4008‐1.6mA, MultiChannel Systems, Reutlingen, Germany).
In three animals, an additional suppression band experiment was performed to investigate the origin of the MB‐SWIFT fMRI contrast. The suppression band was placed either 1.8 to 2.0 cm rostrally to suppress the inflowing blood from the heart, or 1.8 to 2.0 cm caudally—as a control—from the center of FOV. The suppression bands were repeated after every 32 acquisitions with a rostrocaudal width of 7 mm using a 2 ms sinc pulse with a flip angle varying between 20° and 80° within saturation band due to surface coil B1 inhomogeneity. MB‐SWIFT parameters were as described above, except that there were 2694 spokes per volume, resulting in a time resolution of 3.034 s. In the suppression band experiment, an 80‐Hz stimulation frequency was used.
In one additional animal, the MB‐SWIFT performance was compared to spin echo (SE)‐EPI with the following parameters: TR = 1.5 s, 2 shots, resulting in 3 s temporal resolution; TE = 35 ms; FOV = 5.0 × 5.0 cm2; matrix size = 642; 1.5 mm slice thickness; and 15 slices. The stimulation paradigm for this set of experiments and for the comparative MB‐SWIFT dataset was otherwise the same as above, but with 90 s rest periods between the stimulation blocks, resulting in a total paradigm time of 6 min 54 s. In this experiment, a stimulation frequency of 40 Hz was used.
2.2. Data preprocessing and analysis
The MB‐SWIFT data were first reconstructed with SWIFT package 2018 (https://www.cmrr.umn.edu/swift/index.php) using correlation, gridding, and 3 iterations of the fast iterative shrinkage/thresholding algorithm.34 From each MB‐SWIFT fMRI dataset, the first 3 volumes were discarded as the signal was reaching a steady state. Subsequently, the data were transformed to NIfTI format using Aedes (http://aedes.uef.fi).
Next, motion‐correction and spatial smoothing ([1 1 1] voxel FWHM Gaussian kernel) were applied using SPM8 (www.fil.ion.ucl.ac.uk/spm) and MatLab (version 2017b, Mathworks Inc., Natick, MA). Temporal high‐pass filtering with a cutoff value of 300 s was applied. After preprocessing, the single‐subject analysis was computed in SPM using a general linear model consisting of a block design model convolved with a single gamma function (order 1, length 15 s) and the baseline without autoregression. Beta maps of both positive and negative contrasts were computed. Activation maps for the single subjects were computed, applying a statistical threshold of P < .05 family‐wise error corrected.
For the EPI dataset, the preprocessing steps were as described above, except that a slice‐timing correction also was included as the first step. Furthermore, regions of interest (ROIs) containing only motion signal and no response to the stimulation were drawn in the muscle close to the skin surface (tissue–air border) for the EPI and the comparative MB‐SWIFT data sets. This signal was regressed out from the data sets prior to the SPM analysis. The functional contrast‐to‐noise ratio was calculated by dividing the mean of the response amplitude for the three stimulation blocks (points between 96 s and 114 s, 204 s and 222 s, and 312 s and 330 s, respectively) by the SD of the baseline before the first stimulation to compare MB‐SWIFT and EPI.
The differences between the responses to the stimulation frequencies (beta values and number of voxels) were assessed with Student t test. False discovery rate (FDR) correction for multiple comparisons was conducted for the P values. A corrected P value, P FDR < .05, was considered statistically significant.
3. RESULTS
The blood gas analysis results during the scans were within the normal physiological range: (mean ± SD) pCO2 = 45.4 ± 5.6 mmHg, pO2 = 121.7 ± 13.2 mmHg, pH = 7.34 ± 0.03, and sO2 = 98.4 ± 0.7 %. MB‐SWIFT technique demonstrated a superior image quality of the rat’s spinal cord as compared to SE‐EPI (Figure 1), with much less artifacts and better SNR (e.g, single‐slice SNR 100 in MB‐SWIFT and 44 in SE‐EPI). It is evident that the presence of the stimulation electrode, bone–soft tissue interfaces, and respiratory motion caused distortions and artifacts in SE‐EPI images (Figure 1A), which are not observed in MB‐SWIFT images (Figure 1C). The activation map of the SE‐EPI showed only few activated voxels located in the inner part of the spinal cord. On the other hand, MB‐SWIFT revealed a clear activation inside the spinal cord even under the stimulation electrode. The time series obtained from matching ROIs under the L2 vertebral section displayed considerably larger baseline fluctuations with EPI as compared to MB‐SWIFT (Figure 1B,D), even though the motion signal had been regressed out from the data. The functional contrast‐to‐noise ratio for SE‐EPI was 0.8 and for MB‐SWIFT was 4.6.
FIGURE 1.

Comparison between SE‐EPI and MB‐SWIFT fMRI of the spinal cord during spinal cord stimulation. A) EPI image with the corresponding overlaid activation map (P FWE < .05); B) time series of the signal change in EPI from an ROI of L2 vertebral section, shown with blue dashed line in A. C) MB‐SWIFT fMRI image with overlaid activation map (P FWE < .05); D) corresponding time‐series from an ROI of L2 matching with that of EPI, shown with a blue dashed line in C. The stimulation frequency was 40 Hz in both MB‐SWIFT and EPI. Gray shading indicates the time of stimulation in B and D. Temporal high‐pass filtering with a cutoff of 300 s was applied for the time series. FWE, family‐wise error; L2, second lumbar vertebra; MB‐SWIFT, multi‐band sweep imaging with Fourier transformation; ROI, region of interest; SE, spin echo
When a rostral suppression band was applied, no activation or a minuscule negative or positive activation was observed in the spinal cord, whereas with the caudal suppression band a clear response to the stimulation could be detected (Figure 2).
FIGURE 2.

Suppression band experiments with MB‐SWIFT. A) Sagittal views of the spinal cord from 3 rats, with the activation maps overlaid and with the ROI under L2 highlighted in black. L1, L2, and L3 mark the corresponding vertebral sections in the image. The wire of the electrode is indicated with a white dashed line, with the active contact shown by a green box at the stimulation site. On the left are the results from the rostral suppression, and on the right are the results from the caudal suppression. B) Time series corresponding to rostral and caudal suppression from the ROI. The rostral suppression is expected to suppress the signal because it is likely arising from the inflowing blood to the stimulation site. With caudal suppression, the inflowing blood is not suppressed, and thus the activation pattern is expected to remain similar as without suppression. The 7 mm suppression band was placed 1.8 to 2.0 cm rostrally or caudally from the center of the FOV. The stimulation frequency was 80 Hz. The blue–light blue color scale depicts the negative responses, and the red–yellow scale shows the positive responses in A. The stimulation periods are indicated with a gray shading. Temporal high‐pass filtering with a cutoff of 300 s was applied for the time series
All of the animals showed clear responses to 40 Hz stimulation in the gray matter of the spinal cord as seen from the activation maps (Figure 3). The time series obtained from the ROI placed inside the spinal cord at the L2 level also clearly revealed the activation (Figure 3). There was a slow return to baseline of the fMRI signal poststimulation, with no sign of any undershoot being evident.
FIGURE 3.
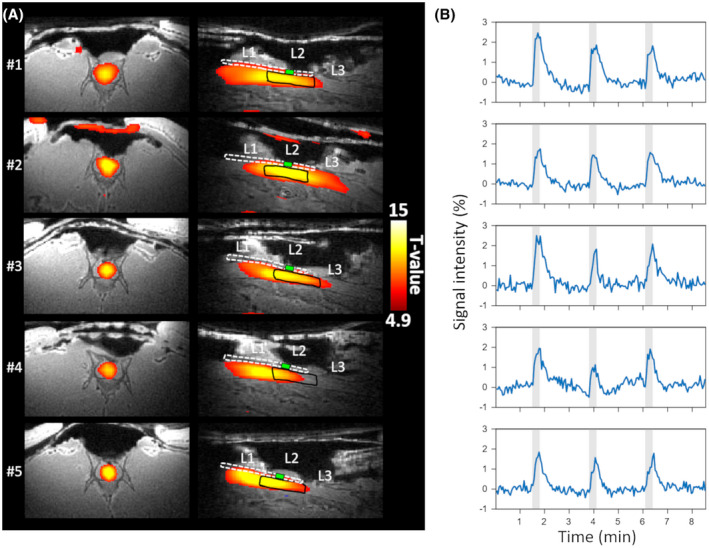
Individual responses to stimulation at the frequency of 40 Hz. A) The activation maps for each animal overlaid on the anatomical MB‐SWIFT image in axial (left) and sagittal (right) views; B) Time series for each animal from the L2 ROI. The ROIs are outlined with a black line on the sagittal view in A for each animal. L1, L2, and L3 mark the corresponding vertebral sections in the image. The wire of the electrode is indicated with a white dashed line, with the active contact shown by a green box at the stimulation site. Gray shading indicates time of stimulation. Temporal high pass filtering with a cutoff of 300 s was applied for the time series
The fMRI responses in the spinal cord were strongly affected by the frequency of the stimulation (Figure 4). The mean beta values calculated from the L2 ROI demonstrated that the stimulation with the frequency of 5 Hz led to the lowest responses overall, and significantly higher beta values occurred for frequencies between 20 to 320 Hz (P FDR < .05) (Figure 4A) as compared to 5 Hz. The strongest responses were observed with 80 Hz and 160 Hz frequencies of stimulation, and 160 Hz differed also from the 20 Hz stimulation frequency (P FDR < .05). The higher stimulation frequencies 320 Hz and 640 Hz led to smaller responses, but there were no significant differences between frequencies 40 to 640 Hz. The number of activated voxels inside the L2 ROI displayed similar results; the 5 Hz stimulation frequency led to less activated voxels within L2 than the stimulation at the 20 Hz to 320 Hz frequencies (Figure 4B). The highest frequency, 640 Hz, evoked the largest SD. The strongest signal changes occurred at 80 Hz and 160 Hz (Figure 4C‐I). The mean numbers of activated voxels within the whole visible spinal cord (L1, L2, and L3 partly) for each frequency were: 24.0 ± 16.6 voxels for 5 Hz, 69.6 ± 17.6 for 20 Hz, 81.8 ± 19.2 for 40 Hz, 89.2 ± 19.3 for 80 Hz, 87.8 ± 21.1 for 160 Hz, 71.7 ± 7.2 for 320 Hz, and 47.7 ± 31.0 for 640 Hz. Similarly, as with the activated voxels within L2 ROI, the number of activated voxels within the whole visible spinal cord was lower at 5 Hz as compared to the stimulation frequencies of 20 to 320 Hz (P FDR < .05). The frequency of stimulation at 640 Hz resulted in the largest SD also when considering the whole visible spinal cord.
FIGURE 4.

Dependence of fMRI signals detected with MB‐SWIFT on the stimulation frequency. A) Mean beta values obtained from the L2 ROI for the different stimulation frequencies; B) Mean number of activated voxels within the L2 ROI. The black line indicates the mean of all animals, and gray shading indicates the SD in (A) and (B). Colored dashed lines represent the individual animals. The mean time series from all animals are shown in their responses to 5 Hz (C), 20 Hz (D), 40 Hz (E), 80 Hz (F), 160 Hz (G), 320 Hz (H), and 640 Hz (I) stimulation. The blue line indicates the mean, with the shading as SD. Gray shading refers to the stimulation periods. For the 5 to 160 Hz frequencies n = 5, for 320 Hz and 640 Hz n = 3. *P FDR < .05 mean value is different from that of 5 Hz stimulation frequency; +P FDR < .05 mean value is different from that of 20 Hz stimulation frequency; Student t test FDR‐corrected. Temporal high pass filtering with a cutoff value of 300 s was applied in the time series. FDR, false discovery rate
4. DISCUSSION
In this study, we demonstrated the feasibility of an effective experimental setup for spinal cord fMRI during SCS in rats using MB‐SWIFT. This approach makes it possible to overcome the multiple obstacles associated with spinal cord imaging, as well as with implanted leads that induce substantial susceptibility artifacts, which are particularly severe at ultrahigh magnetic fields. This is the first time that high‐quality fMRI of the rat spinal cord has been performed at a high magnetic field 9.4 Tesla during simultaneous SCS. The results indicate that we can robustly monitor the functional responses to electrical stimulation of the spinal cord despite the presence of the implanted stimulation electrode.
A high magnetic field allows the high spatial resolution required for a small target such as the spinal cord (in humans, diameter ~1 cm, in rats ~4 mm). However, the magnetic field inhomogeneities and motion artifacts, which are proportional to B0, cause image distortions, especially in EPI. The large excitation and acquisition bandwidth and near‐zero acquisition delay of MB‐SWIFT explain why the sequence is insensitive to B0 inhomogeneities and B0 changes due to motion.32 In addition, the radial nature of MB‐SWIFT means that the sequence is more tolerant to the motion of the target as compared to EPI. These features make the sequence a valid alternative for spinal cord fMRI also at ultrahigh magnetic fields.
MB‐SWIFT has been previously shown to provide better‐quality fMRI data than EPI in the presence of deep brain stimulation electrodes.31 Our results reveal an even larger difference in image quality in the case of the spinal cord because the B0 field homogeneity after shimming remains generally worse in the spinal cord than in the brain.
The rat spinal cord arterial blood supply originates from the ventral spinal artery and two dorsal spinal arteries that extend along the entire cord.35 We conducted suppression band experiments to study the effect of inflow of blood on MB‐SWIFT fMRI contrast, and we observed a diminished response to the stimulation when the suppression band was placed rostrally. However, due to B1 inhomogeneity of the transmitter surface coil, the flip angle of the suppression pulses varied between 20° and 80°, and thus the suppression was likely incomplete despite the repeated suppression pulses applied. Overall, our observations are in line with the previous study of Lehto et al.,31 supporting the argument that the MB‐SWIFT fMRI contrast mainly originates from unsaturated spins attributable to blood flow from the volume outside the transmit RF coil. In the same work, the fMRI responses were also found to be flip angle‐dependent, pointing to T1‐related mechanisms, which was attributed at least partially to originate from in‐flow of nonsaturated blood outside of the area covered by the local transmitter coil.31 In addition to blood flow, the blood volume increases close to the activation site. However, because the T1 of blood is longer than T1 of spinal cord tissue, the increased blood volume likely leads to decreased signal intensity in a T1‐weighted acquisition, which is opposite to what was detected. Thus, the effect of blood volume increase is counteracting with the detected positive intensity change, which is likely arising mostly from the in‐flow of blood. Notably, in one case the suppression slab led to a small negative signal change, consistent with the presence of volume effects counteracting the dominant inflow effects.
The measured functional responses in this study depended on the stimulation frequencies. The typical frequencies used in clinics for pain treatment are low, generally 40 to 125 Hz.7 We observed a clear response to the 40 Hz stimulation frequency under the stimulation electrode. The responses were rather similar for frequencies in the range of 40 to 320 Hz, with 80 Hz and 160 Hz frequencies seemingly inducing slightly stronger activations, as can be seen from Figure 4. The low frequencies are used in pain treatment to trigger paresthesia that overlaps with the pain sensation, thus reducing the pain. We did not examine high frequencies (>1 kHz), which are used for paresthesia‐free pain treatment, although the highest frequency (i.e., 640 Hz) seemed to evoke lower responses than the 40 to 320 Hz frequencies. However, the large response variability and the small number of animals examined at this frequency (n = 3) make it difficult to draw any firm conclusions.
In this study, we demonstrated that MB‐SWIFT allows robust detection of fMRI responses in the spinal cord, even in the presence of electrodes. Because MB‐SWIFT is extremely suitable also for brain fMRI,31 it is conceivable that with proper multi‐coil RF design it will become possible to image in “one shot” the entire network relaying signals between the spinal cord and the brain. Furthermore, MB‐SWIFT fMRI is also well suited for simultaneous recording of evoked potentials. Indeed, a previous study from our group demonstrated that one order of magnitude smaller MRI‐related artifacts could be detected in the electrical recordings when using MB‐SWIFT instead of EPI.31 Combining fMRI and electrophysiological recording in the spinal cord would allow a more comprehensive understanding of the functions of the spinal cord as well as its response to various stimuli.
There are some limitations inherent in the MB‐SWIFT approach. Because the functional contrast of MB‐SWIFT is largely attributable to the movement of blood, that is, in‐flowing unsaturated blood increasingly replaces saturated blood under the coil during activation, this means that the response is dependent on coil geometry. MB‐SWIFT, as with any other 3D radial sequence without slab selection, requires that the whole volume seen by receiver coil is encoded and included in the FOV. Furthermore, because MB‐SWIFT has a close to 0 acquisition delay, the signal from materials with short T2s (from tens of microseconds), for example, those included in coil materials, are also received. However, by careful design of the holder and coil materials to be either free of hydrogen or to contain as little hydrogen as possible in the range of the receiver coil, this is not a significant issue.
5. CONCLUSION
This study demonstrated the feasibility of exploiting MB‐SWIFT fMRI of the rat spinal cord during SCS at a high magnetic field. The results open new avenues for SCS investigations in applications such as spinal cord injury, plasticity assessment, pain, epilepsy, or stroke.
ACKNOWLEDGMENT
We gratefully acknowledge our funders: National Institutes of Health (NIH) (P41 EB015894, S10 RR025031, U01 NS103569), the Academy of Finland 331955 (H.L.), and the Emil Aaltonen Foundation (L.J.L, Finland). We thank Dr. Ewen MacDonald for revising the language of the manuscript. In addition, we thank Maarit Pulkkinen for assistance in the surgical operations of the animals and Eppu Manninen, MSc, for technical assistance in the image reconstruction.
Laakso H, Lehto LJ, Paasonen J, et al. Spinal cord fMRI with MB‐SWIFT for assessing epidural spinal cord stimulation in rats. Magn Reson Med. 2021;86:2137–2145. 10.1002/mrm.28844
Funding information
Supported by the National Institutes of Health (NIH) grants NIH P41 EB015894, S10 RR025031, U01 NS103569; the Academy of Finland grant 331955 (H.L.), and the Emil Aaltonen Foundation, Finland (L.J.L).
Correction added after online publication 02, June 2021. The authors have made corrections to references 2, 3, 4, 6, 17, 23, and 26.
REFERENCES
- 1.Bonizzato M, Pidpruzhnykova G, DiGiovanna J, et al. Brain‐controlled modulation of spinal circuits improves recovery from spinal cord injury. Nat Commun. 2018;9:3015. [DOI] [PMC free article] [PubMed] [Google Scholar]
- 2.Wagner FB, Mignardot J‐B, Le Goff‐Mignardot CG, et al. Targeted neurotechnology restores walking in humans with spinal cord injury. Nature. 2018;563:65‐71. [DOI] [PubMed] [Google Scholar]
- 3.Kapural L. Spinal cord stimulation for intractable chronic pain. Curr Pain Headache Rep. 2014;18:406. [DOI] [PubMed] [Google Scholar]
- 4.Viswanath O, Urits I, Bouley E, Peck JM, Thompson W, Kaye AD. Evolving spinal cord stimulation technologies and clinical implications in chronic pain management. Curr Pain Headache Rep. 2019;23:39. [DOI] [PubMed] [Google Scholar]
- 5.Melzack R, Wall PD. Pain mechanisms: a new theory. Science. 1965;150:971‐979. [DOI] [PubMed] [Google Scholar]
- 6.Caylor J, Reddy R, Yin S, et al. Spinal cord stimulation in chronic pain: evidence and theory for mechanisms of action. Bioelectron Med. 2019;5:12. [DOI] [PMC free article] [PubMed] [Google Scholar]
- 7.Song JJ, Popescu A, Bell RL. Present and potential use of spinal cord stimulation to control chronic pain. Pain Physician. 2014;17:235‐246. [PubMed] [Google Scholar]
- 8.Zhang TC, Janik JJ, Grill WM. Mechanisms and models of spinal cord stimulation for the treatment of neuropathic pain. Brain Res. 2014;1569:19‐31. [DOI] [PubMed] [Google Scholar]
- 9.Gill ML, Grahn PJ, Calvert JS, et al. Neuromodulation of lumbosacral spinal networks enables independent stepping after complete paraplegia. Nat Med. 2018;24:1677‐1682. [DOI] [PubMed] [Google Scholar]
- 10.Thiriez C, Gurruchaga J‐M, Goujon C, Fénelon G, Palfi S. Spinal stimulation for movement disorders. Neurotherapeutics. 2014;11:543‐552. [DOI] [PMC free article] [PubMed] [Google Scholar]
- 11.Fuentes R, Petersson P, Siesser WB, Caron MG, Nicolelis MAL. Spinal cord stimulation restores locomotion in animal models of Parkinson’s disease. Science. 2009;323:1578‐1582. [DOI] [PMC free article] [PubMed] [Google Scholar]
- 12.Santana MB, Halje P, Simplício H, et al. Spinal cord stimulation alleviates motor deficits in a primate model of Parkinson disease. Neuron. 2014;84:716‐722. [DOI] [PMC free article] [PubMed] [Google Scholar]
- 13.de Andrade EM, Ghilardi MG, Cury RG, et al. Spinal cord stimulation for Parkinson’s disease: a systematic review. Neurosurg Rev. 2016;39:27‐35. [DOI] [PubMed] [Google Scholar]
- 14.Eippert F, Kong Y, Jenkinson M, Tracey I, Brooks JCW. Denoising spinal cord fMRI data: approaches to acquisition and analysis. Neuroimage. 2017;154:255‐266. [DOI] [PubMed] [Google Scholar]
- 15.Wheeler‐Kingshott CA, Stroman PW, Schwab JM, et al. The current state‐of‐the‐art of spinal cord imaging: applications. Neuroimage. 2014;84:1082‐1093. [DOI] [PMC free article] [PubMed] [Google Scholar]
- 16.Stroman PW, Wheeler‐Kingshott C, Bacon M, et al. The current state‐of‐the‐art of spinal cord imaging: methods. Neuroimage. 2014;84:1070‐1081. [DOI] [PMC free article] [PubMed] [Google Scholar]
- 17.Yoshizawa T, Nose T, Moore GJ, Sillerud LO. Functional magnetic resonance imaging of motor activation in the human cervical spinal cord. Neuroimage. 1996;4:174‐182. [DOI] [PubMed] [Google Scholar]
- 18.Pórszász R, Beckmann N, Bruttel K, Urban L, Rudin M. Signal changes in the spinal cord of the rat after injection of formalin into the hindpaw: characterization using functional magnetic resonance imaging. Proc Natl Acad Sci U S A. 1997;94:5034‐5039. [DOI] [PMC free article] [PubMed] [Google Scholar]
- 19.Figley CR, Stroman PW. Investigation of human cervical and upper thoracic spinal cord motion: implications for imaging spinal cord structure and function. Magn Reson Med. 2007;58:185‐189. [DOI] [PubMed] [Google Scholar]
- 20.Bosma RL, Stroman PW. Assessment of data acquisition parameters, and analysis techniques for noise reduction in spinal cord fMRI data. Magn Reson Imaging. 2014;32:473‐481. [DOI] [PubMed] [Google Scholar]
- 21.Fratini M, Moraschi M, Maraviglia B, Giove F. On the impact of physiological noise in spinal cord functional MRI. J Magn Reson Imaging. 2014;40:770‐777. [DOI] [PubMed] [Google Scholar]
- 22.Stroman PW, Krause V, Malisza KL, Frankenstein UN, Tomanek B. Extravascular proton‐density changes as a non‐BOLD component of contrast in fMRI of the human spinal cord. Magn Reson Med. 2002;48:122‐127. [DOI] [PubMed] [Google Scholar]
- 23.Jia Y, Shen Z, Lin G, Nie T, Zhang T, Wu R. Lumbar spinal cord activity and blood biochemical changes in individuals with diabetic peripheral neuropathy during electrical stimulation. Front Neurol. 2019;10:222. [DOI] [PMC free article] [PubMed] [Google Scholar]
- 24.Zhong XP, Chen YX, Li ZY, Shen ZW, Kong KM, Wu RH. Cervical spinal functional magnetic resonance imaging of the spinal cord injured patient during electrical stimulation. Eur Spine J. 2017;26:71‐77. [DOI] [PubMed] [Google Scholar]
- 25.Rempe T, Wolff S, Riedel C, et al. Spinal and supraspinal processing of thermal stimuli: an fMRI study. J Magn Reson Imaging. 2015;41:1046‐1055. [DOI] [PubMed] [Google Scholar]
- 26.Deogaonkar M, Sharma M, Oluigbo C, et al. Spinal cord stimulation (SCS) and functional magnetic resonance imaging (fMRI): modulation of cortical connectivity with therapeutic SCS. Neuromodulation. 2016;19:142‐153. [DOI] [PubMed] [Google Scholar]
- 27.Kiriakopoulos ET, Tasker RR, Nicosia S, Wood ML, Mikulis DJ. Functional magnetic resonance imaging: a potential tool for the evaluation of spinal cord stimulation: technical case report. Neurosurgery. 1997;41:501‐504. [DOI] [PubMed] [Google Scholar]
- 28.Stančák A, Kozák J, Vrba I, et al. Functional magnetic resonance imaging of cerebral activation during spinal cord stimulation in failed back surgery syndrome patients. Eur J Pain. 2008;12:137‐148. [DOI] [PubMed] [Google Scholar]
- 29.Pawela CP, Kramer JM, Hogan QH. Dorsal root ganglion stimulation attenuates the BOLD signal response to noxious sensory input in specific brain regions: insights into a possible mechanism for analgesia. Neuroimage. 2017;147:10‐18. [DOI] [PubMed] [Google Scholar]
- 30.Idiyatullin D, Corum CA, Garwood M. Multi‐band‐SWIFT. J Magn Reson. 2015;251:19‐25. [DOI] [PMC free article] [PubMed] [Google Scholar]
- 31.Lehto LJ, Idiyatullin D, Zhang J, et al. MB‐SWIFT functional MRI during deep brain stimulation in rats. Neuroimage. 2017;159:443‐448. [DOI] [PMC free article] [PubMed] [Google Scholar]
- 32.Paasonen J, Laakso H, Pirttimäki T, et al. Multi‐band SWIFT enables quiet and artefact‐free EEG‐fMRI and awake fMRI studies in rat. Neuroimage. 2020;206:116338. [DOI] [PMC free article] [PubMed] [Google Scholar]
- 33.Ogawa S, Lee TM, Kay AR, Tank DW. Brain magnetic resonance imaging with contrast dependent on blood oxygenation. Proc Natl Acad Sci U S A. 1990;87:9868‐9872. [DOI] [PMC free article] [PubMed] [Google Scholar]
- 34.Beck A, Teboulle M. Fast gradient‐based algorithms for constrained total variation image denoising and deblurring problems. IEEE Trans Image Process. 2009;18:2419‐2434. [DOI] [PubMed] [Google Scholar]
- 35.Scremin OU. Cerebral vascular system. In: Paxinos G, ed. The Rat Nervous System. 4th ed. London, England: Academic Press; 2015: 985‐1011. [Google Scholar]