

Abstract
Objectives
Palate morphology is constantly changing throughout an individual's lifespan, yet its asymmetry during growth is still little understood. In this research, we focus on the study of palate morphology by using 3D geometric morphometric approaches to observe changes at different stages of life, and to quantify the impact of directional and fluctuating asymmetry on different areas at different growth stages.
Materials and Methods
The sample consists of 183 individuals (1–72 years) from two identified human skeletal collections of 19th and early 20th Century Italian contexts. A 3D‐template of 41 (semi)landmarks was applied on digital palate models to observe morphological variation during growth.
Results
Asymmetrical components of the morphological structure appears multidirectional on the entire palate surface in individuals <2 years old and become oriented (opposite bilateral direction) between 2 and 6 years of age. Specifically, directional asymmetry differentially impacts palate morphology at different stages of growth. Both the anterior and posterior palate are affected by mild alterations in the first year of life, while between 2 and 6 years asymmetry is segregated in the anterior area, and moderate asymmetry affects the entire palatal surface up to 12 years of age. Our results show that stability of the masticatory system seems to be reached around 13–35 years first by females and then males. From 36 years on both sexes show similar asymmetry on the anterior area. Regarding fluctuating asymmetry, inter‐individual variability is mostly visible up to 12 years of age, after which only directional trends can be clearly observed at a group level.
Discussion
Morphological structure appears instable during the first year of life and acquires an opposite asymmetric bilateral direction between 2 and 6 years of age. This condition has been also documented in adults; when paired with vertical alteration, anterior/posterior asymmetry seems to characterize palate morphology, which is probably due to mechanical factors during the lifespan. Fluctuating asymmetry is predominant in the first period of life due to a plausible relationship with the strength of morphological instability of the masticatory system. Directional asymmetry, on the other hand, shows that the patterning of group‐level morphological change might be explained as a functional response to differential inputs (physiological forces, nutritive and non‐nutritive habits, para‐masticatory activity as well as the development of speech) in different growth stages. This research has implications with respect to medical and evolutionary fields. In medicine, palate morphology should be considered when planning orthodontic and surgical procedures as it could affect the outcome. As far as an evolutionary perspective is concerned the dominance of directional asymmetries in the masticatory system could provide information on dietary and cultural habits as well as pathological conditions in our ancestors.
Keywords: directional asymmetry, fluctuating asymmetry, ontogeny, palatal arch
Directional and fluctuating asymmetry of human palate.

1. INTRODUCTION
Bilateral symmetry refers to body symmetry assessed with reference to a craniocaudal axis (sagittal plane) that affects the majority (>99%) of modern animals, including humans (Finnerty, 2005; Finnerty et al., 2004; Klingenberg et al., 2002; Mardia et al., 2000). Deflections from symmetry have been widely explored through quantitative methods (e.g., Auffray et al., 1996; Auffray et al., 1999; Bookstein, 1996; Kent & Mardia, 2001; Klingenberg & McIntyre, 1998; Mardia et al., 2000; Smith et al., 1997) establishing that deviations from perfect bilateral symmetry can occur when the individual has been subjected to anomalous developmental conditions as well as environmental and genetic stress (Auffray et al., 1999; Klingenberg et al., 2001; Klingenberg et al., 2002; Klingenberg & McIntyre, 1998; Klingenberg & Zaklan, 2000; Møller & Swaddle, 1997; Palmer & Strobeck, 1986; Parsons, 1992; Vazzana et al., 2018).
The degree of asymmetry in anatomy may indicate a genetic (Boder, 1953; Cassidy et al., 1998; Lundstrӧm, 1961; Melnik, 1992; Moreira et al., 2008; Wolpert et al., 2006), congenital or acquired pathological condition (Bishara et al., 1994) as well as abnormal habits, such as finger sucking (Lundstrӧm, 1961; Reid & Price, 1984; Yamaguchi & Sueishi, 2003). Knowledge of difference between “normal asymmetry” (Functional) and “pathologic asymmetry” (Para‐functional) is important for diagnosis of medical conditions.
Functional activities of the skeletal muscular system, especially those of the masticatory apparatus and in particular movements of the tongue involved in swallowing (Anagnostara et al., 2001; Lear et al., 1965; Palmer et al., 2008; Pameijer et al., 1970), speaking (Lammert et al., 2011, 2013a, 2013b; Narayanan et al., 2004) and breathing (Bresolin et al., 1984; Cozza et al., 2007; Di Francesco et al., 2006; Emslie et al., 1952; Harari et al., 2010; Hartsook, 1946; Katz et al., 2004; Melink et al., 2010; Rubin, 1980; Valera et al., 2003; Vazquez‐Nava et al., 2006; Vig, 1998; Warren, 1990; Warren & Bishara, 2002) impact both upper and lower jaw morphology (Alghadir et al., 2015; Bansal et al., 2015; Ferrario et al., 1993; Hiiemae & Palmer, 2003; Hori et al., 2013; Klein, 1986; Oxilia et al., 2018; Palmer et al., 1997; Pirittiniemi, 1994) generating a best‐fit occlusion between jaws.
Para‐functional activity of the skeletal muscular system, instead, generates several anomalies which create an imbalance in the stomatognathic apparatus often producing occlusal interferences (Baldini, 2010; Carini et al., 2017; Cattoni et al., 2007; Cuccia & Caradonna, 2009; Gangloff et al., 2000; Hellsing et al., 1987; Milani et al., 2000; Nobili & Adversi, 1996; Perillo et al., 2011; Solow & Sonnesen, 1998; Valentino et al., 2002; Yoshino et al., 2003), temporomandibular (Bracco et al., 2004; Cuccia, 2011; Kritsineli & Shim, 1992; Lee et al., 1995; Olivo et al., 2006; Traversari et al., 2019) and musculoskeletal disorders (D'Attilio et al., 2005; Gadotti et al., 2005; Valentino & Melito, 1991).
However, to the evolutionary field, there is relatively little information on the relative impact of behavioral and cultural variables (such as dietary habits) on change in palate morphology during growth. Some scholars (Moreira et al., 2008; Schaefer et al., 2006) point out that palate asymmetry is equally distributed across age groups, even though it has been argued that fetuses and infants are more influenced by asymmetries than adults due to reasons that are currently unknown and independent from the appearance of dentition (Rossi et al., 2003). At present, distribution of variation in this anatomical district during growth are still far from being fully disentangled.
1.1. Deviations from bilateral symmetry.
Deviations from bilateral symmetry can be divided into three components: Directional asymmetry (DA), fluctuating asymmetry (FA), and antisymmetry (AS). DA refers to directionally consistent differences between the two sides of all individuals observed in a population and is generally associated with environmental factors and adaptive stress (Graham et al., 1994; Graham et al., 2010; Klingenberg et al., 2002). On the other hand, FA is defined as the distribution, at a group or population level, of the random individual deviations from the structure's symmetrical pattern (Klingenberg, 2015; Klingenberg & McIntyre, 1998; Mardia et al., 2000). FA is commonly interpreted as a measure of developmental instability displayed in human traits such as teeth, limb length and facial structure. Differences in diet and cultural behavior, as much as socioeconomic conditions, chromosomal anomalies, mutations, and reduced heterozygosity in a group can lead to higher rates of orofacial asymmetry during the development of the individual (Barden, 1980; Bogin, 1999; Hallgrímsson, 1988; Hershkovitz et al., 1993; Livshits et al., 1988; Lu et al., 2010; Noss et al., 1983; Özener, 2010; Sognnaes, 1978; Van Valen, 1962).
Finally, antisymmetry occurs when asymmetry shows no clear directionality across individuals and is generally associated with adaptive behaviors triggered by the interaction between genetic background and environmental conditions (Lu et al., 2010; Palmer, 1994; Van Valen, 1962). Since quantification of antisimmetry is still problematic and debated, there are no definitive methods available for multivariate shape data (Palmer et al., 2010; Palmer & Strobeck, 2003; Van Valen, 1962), and for this reason we have not included antisymmetry in the present analysis.
In this work, we investigate how asymmetry appear on the hard palate (the palatine processes of the maxilla, not including the horizontal plate of the palatines) at different stages of human growth and identify which regions of the palate are most affected by different kinds of functional and para‐functional alterations. More specifically, by using digital models of maxilla dental arches of two 19th and early 20th Century Italian populations (Florence and Bologna) we explore evidence of the ontogenetic development of directional and fluctuating asymmetry to understand whether palatal asymmetry significantly changes during growth. Understanding at least part of these alterations is critical to explain the adaptive processes of palate morphology during the entire lifespan of an individual.
2. MATERIALS
The sample consists of palatal arches of 183 individuals from two Italian identified human skeletal collections (Bologna and Florence) aged from 1 to 72 years. The individuals from the Bologna collection (n = 87), housed at the Museum of Anthropology of the University of Bologna, are from the Certosa cemetery located in the western suburbs of Bologna. The collection includes a total of 425 individuals of known sex, name and age at death (range 0–91 years), most of whom belonged to the less‐advantaged urban classes of late 19th and early 20th Century (Belcastro et al., 2017). The sample from the Florence collection (n = 96), hosted in the Natural History Museum (Anthropology and Ethnology section), University of Florence, belongs to unclaimed indigents from the Florence hospital and comprises lower‐class citizens of known sex, name and age at death (range 1–57 years), who lived in the town of Florence in the 19th century (industrialized only after 1890).
Paleopathological information of the Bologna individuals was sourced from archival data, which indicated that most died as a result of infectious disease (Belcastro et al., 2017). Based on health profiles, individuals from Florence collection breastfed children until 12–18 months of age and overall, adult experienced an unbalanced diet due to poor living conditions (Moggi‐Cecchi et al., 1994). Both these findings were consistent with pre‐ and post‐unification Italy in Bologna and pre‐industrialized Florence.
For the present study, male and female individuals from Bologna and Florence were separated into six groups (Table 1) based on direct observation of skeletal remains. Age groups were subdivided considering mixed dentition until permanent dentition based on the time of eruption/occlusion of the molars. The groups have been divided based on eruption of the dm2 (Group I; 1, 3–1.7 yo [years old]), permanent first molar (Group II; 2–6 yo), permanent second molar (Group III; 7–12 yo) and third molar (Groups IV; 13–18 yo) in occlusion (Groups V; 19–35 yo) and showing worn crown (Group VI; 36–72 yo). Individuals with damaged maxillae or presenting pathological conditions such as abscesses and extended alveolar bone absorption were excluded to avoid any spurious measurement of asymmetry.
TABLE 1.
Six groups based on the time of eruption/occlusion of dm2, M1, M2, and M3 observing our sample
| Bologna | Florence | |||||||
|---|---|---|---|---|---|---|---|---|
| M | F | Tot | M | F | ND | Tot | ||
| Group I (1.3–1.7 year old) | dm2 erupt. | 3 | 1 | 4 | 0 | 1 | 1 | |
| Group II (2–6 years old) | M1 erupt. | 7 | 4 | 11 | 1 | 2 | 3 | |
| Group III (7–12 years old) | M2 erupt. | 4 | 2 | 6 | 4 | 1 | 5 | |
| Group IV (13–18 years old) | M3 erupt. | 5 | 6 | 11 | 6 | 8 | 1 | 15 |
| Group V (19–35 years old) | M3 occ. | 13 | 13 | 26 | 29 | 27 | 56 | |
| Group VI (36–72 years old) | Permanent complete dentition. | 14 | 15 | 29 | 5 | 11 | 16 | |
Note: Group I: deciduous dentition (dm2 eruption); Group II: mixed dentition (M1 eruption); Group III: mixed dentition (M2 eruption); Group IV: permanent dentition (M3 eruption); Group V: permanent dentition (M3 in occlusion), Group VI: Permanent complete dentition.
3. METHODS
3.1. Data acquisition
A total of 87 palatal arches from the Bologna collection were scanned at the Department of Biological, Geological and Environmental Sciences–BiGeA University of Bologna using a structured light 3D scanner (Artec Space Spider, Artec 3D, Luxembourg) with a high 3D resolution (up to 0.5 mm) and accuracy (up to 0.05 mm).
The Florence sample underwent CT scanning using Scanora 3D Cone Beam CT (SOREDEX, Tuusula, Finland) at the Museo di Storia Naturale, Antropologia e Etnologia, Florence, Italy. A total of 96 skull were scanned at 90 kVp, 0.2 mm Cu filtration, 225 half projection over 360°, 14 mAs radiation dose for a total scan time of 35 s per sample. Primary reconstruction of the images was performed using ART (Algebraic Reconstruction Technique). A total of 459 slices per scan were performed, with a 0.300 mm thickness, a 550 × 550px image size and a 0.300 mm pixel size.
Avizo 9.2 (Thermo Fisher Scientific) was used to generate isosurfaces. The 3D models of the skulls were refined in Geomagic Design X (3D Systems Software) to optimize the triangles and remove holes and defects while preserving the original surfaces.
3.2. Geometric morphometrics
Palatal surfaces were investigated through 3D landmark‐based geometric morphometric (GM) methods (Gunz et al., 2005; Mitteroecker & Gunz, 2009).
A 3D‐template (Figure 1(a)) of 41 (semi)landmarks (five landmarks, 12 curve semilandmarks and 24 surface semilandmarks) was created on the palatal surface of a young adult individual (20 yo) from the Bologna collection using Viewbox 4 software (dHal Software) and subsequently applied it to the entire sample (defined as targets).
FIGURE 1.

(a) the template with landmarks (red), curve semilandmarks (blue) and surface semilandmarks (green) digitized on the palatal arch. The procedure for the creation of the template are the following: (b) fixed landmark, curve semilandmarks and 12 surface semilandmarks on the right hemi‐palate were positioned; (c), the digital model of the palatal arch was mirrored according to the midsagittal‐plane; (d) then, the template was applied to the mirrored digital model; (e) the 12 surface semilandmarks were mirrored on the left hemi‐palate according to the midsagittal‐plane; (f) the 12 surface semilandmarks on the left hemi‐palate were added to the original configuration (b) to complete the left side
The five landmarks were located between the two central incisors (named “Incisor,” number 1), on the lingual side of the last erupted molar (called “Ento‐left,” number 2 and “Ento‐right,” number 3), at the posterior end of the incisive foramen (called “Post‐foramen,” number 4), and, finally, at the junction of the median palatine and the transverse palatine sutures (called “Middle” number 5). Curves were digitized following the cervical lines on the right (curve right) and left (curve left) side of the palatal arch and curve semilandmarks were positioned 20% of the curve length with respect to one another. Finally, “Curve middle” was outlined by following the actual line of the median palatine suture. The 12 surface semilandmarks were positioned on the right hemi‐palate (Figure 1(b)) (Table 2). In order to obtain geometrically homologous surface semilandmarks in the right and left hemi‐palate (24 surface semilandmarks in total), the digital model was mirrored according to the midsagittal‐plane (passing through the incisal midline and the junction point of the transverse palatal suture) (Figure 1(c)) obtained as perpendicular to the occlusal reference plane following Oxilia et al. (2018).
TABLE 2.
Landmarks and semilandmarks (sml = semilandmark) of the palatal shape configuration
| Landmark no. | Name | Landmark no. | Name |
|---|---|---|---|
| 1 | Incisor | 34 | Surface sml left |
| 2 | Ento‐left | 35 | Surface sml left |
| 3 | Ento‐right | 36 | Surface sml left |
| 4 | Post‐foramen | 37 | Surface sml left |
| 5 | Middle | 38 | Curve sml middle |
| 6 | Curve sml left | 39 | Curve sml middle |
| 7 | Curve sml left | 40 | Curve sml middle |
| 8 | Curve sml left | 41 | Curve sml middle |
| 9 | Curve sml left | ||
| 10 | Curve sml right | ||
| 11 | Curve sml right | ||
| 12 | Curve sml right | ||
| 13 | Curve sml right | ||
| 14 | Surface sml right | ||
| 15 | Surface sml right | ||
| 16 | Surface sml right | ||
| 17 | Surface sml right | ||
| 18 | Surface sml right | ||
| 19 | Surface sml right | ||
| 20 | Surface sml right | ||
| 21 | Surface sml right | ||
| 22 | Surface sml right | ||
| 23 | Surface sml right | ||
| 24 | Surface sml right | ||
| 25 | Surface sml right | ||
| 26 | Surface sml left | ||
| 27 | Surface sml left | ||
| 28 | Surface sml left | ||
| 29 | Surface sml left | ||
| 30 | Surface sml left | ||
| 31 | Surface sml left | ||
| 32 | Surface sml left | ||
| 33 | Surface sml left |
Note: Compare with Figure 1.
The template configuration was applied to the mirrored model (Figure 1(d)), allowing the semilandmarks to slide on the curves (curve semilandmarks) and on the surface (surface semilandmarks) to minimize the thin‐plate spline (TPS) bending energy between the template and the target (i.e., the mirrored copy) (Slice, 2006). As a result, semilandmarks can be considered geometrically homologous (Gunz & Mitteroecker, 2013). The target configuration was mirrored back according to the above‐mentioned plane (Figure 1(e)), and the 12 surface semilandmarks on the left hemi‐palate were added to the original configuration to complete the template (Figure 1(f)). The final template configuration was applied to all 183 individuals.
3.3. Statistical analysis
3.3.1. Geometric morphometric analysis
To analyze the asymmetry in the specific case of object symmetry, for each individual we generated a copy of the original landmark configuration by reflecting it on the opposite side of the x‐axis (i.e., multiplying values in the x column by −1) and relabelling it to obtain landmark correspondence (Klingenberg, 2015; Schaefer et al., 2006). Cartesian coordinates were converted into Procrustes shape coordinates by means of generalized procrustes analysis (GPA) using the function “gpagen” of the package “geomorph” (Adams & Otarola‐Castillo, 2013) in R version 3.6.2 (R Core Team, 2019). GPA removes information about translation by superimposing the centroid of each landmark configuration (centering). The latter is rotated to reduce to a minimum the sum of squared Euclidian distances between homologous landmarks, while scaling the configurations to centroid size equal to one (Mitteroecker & Gunz, 2009). A second step in the analysis allows the semilandmarks to slide against recursive updates of the Procrustes consensus (Gunz, Mitteroecker, & Bookstein, 2005; Mitteroecker & Gunz, 2009; Slice, 2006; Sorrentino, Stephens, et al., 2020; Sorrentino, Belcastro, et al., 2020).
We first computed a Procrustes distance matrix (Dryden & Mardia, 1998; Rohlf & Slice, 1990) between all the configurations obtained above, calculated the multivariate dispersion of each group and tested if group variances were homogeneous using the function betadisper in the “vegan” package in R (Oksanen et al., 2019). We then used Permutational Multivariate Analysis of Variance (PERMANOVA through the “adonis” function in the package “vegan” (Anderson, 2001) to assess whether the distribution of Procrustes distances was significantly different between the two geographical groups (Florence and Bologna) in each age group. Because of the absence of significant differences, the sample was put together, and subsequent analyses were conducted on this pooled sample to explore variability in asymmetry across age groups.
We then plotted, for each age group, a mean shape configuration obtained as the average of both originals and reflected/relabelled copies (which is defined as perfectly symmetric; Klingenberg et al., 2002) against the mean asymmetric component of shape variation (defined as the differences between the original and mirrored configuration; Klingenberg et al., 2002), in order to explore how the asymmetry pattern changes across landmarks.
3.4. Directional and fluctuating asymmetry
Following established methods (Klingenberg, 2015; Schaefer et al., 2006) we computed the mean of all individual palatal shape configurations in each age group () and the mean of all the reflected and relabelled configurations (). We then calculated directional asymmetry for each age group (DA k) as the Procrustes distance between these two mean coordinate sets, that is, by first obtaining the squared difference between them () and then computing the squared root of the grand sum of the resulting coordinate set (DA = sqrt(sum(((mean(RR) − mean(O))^2))) ; Figure S1A). FA was calculated as the Procrustes distance of the difference between the original configuration and its reflected and relabelled copy of each individual (d i = O i − RR i) from their respective group DA (FA = sqrt(sum((([O‐RR] − DA)^2))) ; Figure S1B).
To explore DA and FA within and across age groups in our pooled sample, we measured within‐group variability and between‐group differences for both asymmetries through Procrustes ANOVA (alpha = 0.05) using the “procD.lm” function in the package “geomorph.” According to the literature (Klingenberg et al., 2002; Palmer & Strobeck, 2003), Procrustes ANOVA attributes deviations from the overall mean configuration to main components (i.e., individual variability, reflection or DA, and interaction between individual variability and reflection or FA) (Klingenberg et al., 2002; Palmer & Strobeck, 2003). Finally, to further investigate the differences between all groups, therefore in order to evaluate for which specific group pairs these differences show significant values, we performed a post‐hoc Tukey's HSD test.
We then shifted to a finer scale of analysis to observe change over time in each (semi)landmark. Regarding DA, we assessed the presence of potential correlations in the distribution of values between pairs of age groups across all landmarks through Spearman rank correlation coefficient. We also detected the presence of significant differences in the distribution of DA values across landmarks through a Kruskal‐Wallis test, and performed a Dunn's post‐hoc test in order to identify which specific pairs of (semi)landmark these differences would show significant values.
We used Kruskal‐Wallis test also to assess the presence of significant between‐group differences in the distribution of FA values at each landmark and used Bonferroni correction to control for problems related to multiple testing.
Finally, a Mann–Whitney test was used to investigate the presence of significant differences in DA and FA between males and females for age groups IV, V, and VI, while sexual dimorphism was not evaluated for groups I‐III (age < 13) because of the absence/uncertainty of sexual traits.
4. RESULTS
Betadisper shows homogeneity of group variances (p value>0.05), and PERMANOVA results show no significant differences between the two examined groups, that is, Florence and Bologna (Table S1). This allowed us to consider the entire sample as a unique population and explore variability only across age groups in subsequent analyses.
Considering the whole asymmetric components of the morphological structure it was observed that Group I (1.3–1.7 yo) shows an absence of asymmetric bilateral direction between pairs of semi landmarks (Figure S2). In fact, black points corresponding to the right and left side presents a random direction of asymmetry. Opposite direction of asymmetry (anteriorly and posteriorly) between right and left side seems to be more visible from Group II (2–6 yo) with an increasing of vertical alteration in the middle and alveolar areas of the palate (black points are not visible or covering gray points) (Figure S2).
4.1. Directional asymmetry
Morphological differences within groups are statistically significant for groups II (2–6 yo) to VI (36–72 yo) (Table 3).
TABLE 3.
Procrustes ANOVA (alpha = 0.05) of shape variation within groups
| df | SS | MS | Rsq | F | p value | ||
|---|---|---|---|---|---|---|---|
| Group I | Ind | 4 | 0.022270 | 0.0055676 | 0.70211 | 3.1935 | 0.004 |
| Group I | Reflections | 1 | 0.002475 | 0.0024755 | 0.07804 | 1.4199 | 0.258 |
| Group I | Ind X Reflections | 4 | 0.006974 | 0.0017434 | 0.21985 | ||
| Group II | Ind | 13 | 0.166690 | 0.0128223 | 0.82795 | 7.5942 | 0.002 |
| Group II | Reflections | 1 | 0.012689 | 0.0126890 | 0.06303 | 7.5152 | 0.002 |
| Group II | Ind X Reflections | 13 | 0.021950 | 0.0016884 | 0.10902 | ||
| Group III | Ind | 10 | 0.190676 | 0.0190676 | 0.88842 | 11.3899 | 0.002 |
| Group III | Reflections | 1 | 0.007207 | 0.0072066 | 0.03358 | 4.3048 | 0.002 |
| Group III | Ind X Reflections | 10 | 0.016741 | 0.0016741 | 0.07800 | ||
| Group IV | Ind | 25 | 0.43537 | 0.0174146 | 0.88387 | 10.1979 | 0.002 |
| Group IV | Reflections | 1 | 0.01451 | 0.0145093 | 0.02946 | 8.4965 | 0.002 |
| Group IV | Ind X Reflections | 25 | 0.04269 | 0.0017077 | 0.08667 | ||
| Group V | Ind | 81 | 1.33530 | 0.016485 | 0.85730 | 7.2596 | 0.002 |
| Group V | Reflections | 1 | 0.03834 | 0.038335 | 0.02461 | 16.8817 | 0.002 |
| Group V | Ind X Reflections | 81 | 0.18394 | 0.002271 | 0.11809 | ||
| Group VI | Ind | 44 | 0.90658 | 0.0206040 | 0.88354 | 9.5034 | 0.002 |
| Group VI | Reflections | 1 | 0.02410 | 0.0240969 | 0.02348 | 11.1145 | 0.002 |
| Group VI | Ind X Reflections | 44 | 0.09539 | 0.0021681 | 0.09297 |
Note: Reflections, directional asymmetry; IndXReflections, fluctuating asymmetry.
Abbreviations: df, degrees of Freedom; F, Fisher value; Ind, individual variability; MS, mean square; Rsq, r squared; SS, sums of squares.
There are also statistically significant differences between groups (p = 0.0158; Table 4), where Turkey's HSD post‐hoc test identifies different patterns between group V (19–35 yo) and II (Table 5). Spearman's rank correlation coefficients show that DA values are correlated (>0.80) between the following pairs of age groups: V – IV, VI‐II, VI‐IV, and VI‐V (Table 6). As shown in Figures 2(a) (see also Figure S3), the anterior area of the palate (i.e., semilandmarks 14, 15, 16, 26, 27, 28) presents the highest values of DA, mainly in groups II and VI. Moderate DA values involve the posterior palatal surface (i.e., landmarks 2, 3), especially in groups I (1,3–1,7 yo) and III (7–12 yo). As far as groups IV and V are concerned, lower levels of DA have been identified in the anterior portion of the palate.
TABLE 4.
Procrustes ANOVA (alpha = 0.05) of DA variation between groups
| df | SS | MS | F value | p value | |
|---|---|---|---|---|---|
| DA.group | 5 | 0.000105 | 0.000021 | 2.86 | 0.0158 |
| Residuals | 240 | 0.001762 | 0.000007344 |
Abbreviations: df, degree of Freedom; F, Fisher value; MS, mean square; SS, sum of square.
TABLE 5.
Directional asymmetry
| diff | lwr | upr | p adj | |
|---|---|---|---|---|
| gII‐gI | 0.001418518 | −0.0003009776 | 0.003138013 | 0.1710723 |
| gIII‐gI | 0.0006442728 | −0.0010752223 | 0.002363768 | 0.8903698 |
| gIV‐gI | −0.0002701058 | −0.0019896010 | 0.001449389 | 0.9976262 |
| gV‐gI | −0.000449493 | −0.0021689882 | 0.001270002 | 0.9751570 |
| gVI‐gI | −0.0002452147 | −0.0019647098 | 0.001474281 | 0.9985065 |
| gIII‐gII | −0.0007742447 | −0.0024937399 | 0.0009452505 | 0.7883765 |
| gIV‐gII | −0.001688623 | −0.0034081185 | 0.00003087185 | 0.0575082 |
| gV‐gII | −0.001868011 | −0.0035875057 | −0.0001485154 | 0.0244739 |
| gVI‐gII | −0.001663732 | −0.0033832274 | 0.00005576298 | 0.0642329 |
| gIV‐gIII | −0.0009143786 | −0.0026338738 | 0.0008051165 | 0.6467330 |
| gV‐gIII | −0.001093766 | −0.0028132611 | 0.0006257293 | 0.4501011 |
| gVI‐gIII | −0.0008894875 | −0.0026089827 | 0.0008300077 | 0.6734831 |
| gV‐gIV | −0.0001793873 | −0.0018988824 | 0.001540108 | 0.9996731 |
| gVI‐gIV | 0.00002489113 | −0.0016946040 | 0.001744386 | 1.0000000 |
| gVI‐gV | 0.0002042784 | −0.0015152168 | 0.001923774 | 0.9993833 |
Note: Results of the Tukey's HSD post‐hoc test performed to evaluate which group pairs show statistically significant differences in the distribution of DA values between groups. All the p values are Bonferroni corrected. Significant differences shown in bold.
Abbreviations: diff, difference in the observed means; g, group; lwr = lower end point of the interval; p adj = Bonferroni corrected p value; upr, upper end point of the interval.
TABLE 6.
Results of the spearman rank correlation coefficient performed on the distribution of DA values across landmarks between pairs of age groups
| Group I | Group II | Group III | Group IV | Group V | |
|---|---|---|---|---|---|
| Group II | 0.20 | ||||
| Group III | 0.71 | 0.60 | |||
| Group IV | 0.28 | 0.77 | 0.55 | ||
| Group V | 0.46 | 0.71 | 0.76 | 0.88 | |
| Group VI | 0.36 | 0.81 | 0.61 | 0.96 | 0.89 |
Note: Correlation coefficient comprised between −1 (strong negative correlation) and 1 (strong positive correlation), where 0 means lack of correlation.
FIGURE 2.

Variability of directional asymmetry in different age groups. (a) Line plot depicting the distribution of DA values across (semi)landmarks for each individual age group (corresponding colors are detailed in the legend on the right side of the panel); (b) boxplot showing the distribution of pairwise differences in DA values between age groups measured at each (semi)landmark. Dispersion of difference values was measured through inter‐quartile ranges (IQR), that is the difference between the first and third quartiles at each sampling point. Green refers to particularly dispersed patterns (IQR ≥ 0.0039) while blue indicates patterns well described by median values (IQR ≤ 0.0025); (c) stacked bar plot showing the relative weight of differences in DA values between subsequent groups of dentition (from deciduous to permanent) for each (semi)landmark value
More detailed results are highlighted in Figure 2(b), where boxes are colored based on the range of dispersion of each (semi)landmark. Anterior and posterior areas of the palatal arch show more apparent dispersion in the distribution of differences between groups (IQR > =0.0039) compared to the posterior area of the middle palatine suture and the area localized on the palatine process (blue boxes), where we measured lower interquartile dispersion (IQR ≤ 0.0025). Moreover, the area corresponding to the left and right sides of the palatal arch (semilandmarks 14–25 and 26–37, Figure 2(b),(c)) shows a symmetrical alteration during growth as demonstrated by the same bilateral variation, which appears prevalent on the alveolar arches during the transition from mixed to permanent dentition (semilandmarks 6–9 and 10–13, Figure 2(c)). All these results are confirmed by the Kruskal‐Wallis test which shows a significant difference in the distribution of DA values across landmarks (p value<0.0001). In particular Dunn's post‐hoc test (Table 7) indicates a significant difference between semilandmarks located in the left and right sides of the anterior and posterior area of the palatal arch (semilandmarks 14–16, 26–28, and 21, 33) and (semi)landmarks located in the middle palatine suture (semilandmarks 38–41 and landmarks 4–5), highlighting lesser values of asymmetry in the latter than it has been observed in the anterior and posterior area.
TABLE 7.
Directional asymmetry
| Comparison | Z | p. unadj | p. adj |
|---|---|---|---|
| 14–38 | 4.880435 | 1.058522e‐06 | 0.0008679876 |
| 15–38 | 4.515315 | 6.322269e‐06 | 0.0051842608 |
| 16–38 | 4.661363 | 3.141221e‐06 | 0.0025758013 |
| 21–38 | 4.288129 | 1.801841e‐05 | 0.0147750965 |
| 26–38 | 4.880435 | 1.058522e‐06 | 0.0008679876 |
| 27–38 | 4.515315 | 6.322269e‐06 | 0.0051842608 |
| 28–38 | 4.661363 | 3.141221e‐06 | 0.0025758013 |
| 33–38 | 4.288129 | 1.801841e‐05 | 0.0147750965 |
| 14–39 | 4.280016 | 1.868802e‐05 | 0.0153241743 |
| 16–39 | 4.060944 | 4.887475e‐05 | 0.0400772916 |
| 26–39 | 4.280016 | 1.868802e‐05 | 0.0153241743 |
| 28–39 | 4.060944 | 4.887475e‐05 | 0.0400772916 |
| 14–4 | 4.247561 | 2.161108e‐05 | 0.0177210829 |
| 16–4 | 4.028489 | 5.613657e‐05 | 0.0460319856 |
| 26–4 | 4.247561 | 2.161108e‐05 | 0.0177210829 |
| 28–4 | 4.028489 | 5.613657e‐05 | 0.0460319856 |
| 14–40 | 4.628908 | 3.675992e‐06 | 0.0030143132 |
| 15–40 | 4.263788 | 2.009901e‐05 | 0.0164811850 |
| 16–40 | 4.409836 | 1.034489e‐05 | 0.0084828115 |
| 21–40 | 4.036602 | 5.423085e‐05 | 0.0444692996 |
| 26–40 | 4.628908 | 3.675992e‐06 | 0.0030143132 |
| 27–40 | 4.263788 | 2.009901e‐05 | 0.0164811850 |
| 28–40 | 4.409836 | 1.034489e‐05 | 0.0084828115 |
| 33–40 | 4.036602 | 5.423085e‐05 | 0.0444692996 |
| 14–41 | 4.738444 | 2.153657e‐06 | 0.0017659985 |
| 15–41 | 4.373324 | 1.223689e‐05 | 0.0100342480 |
| 16–41 | 4.519372 | 6.202334e‐06 | 0.0050859139 |
| 21–41 | 4.146138 | 3.381295e‐05 | 0.0277266207 |
| 26–41 | 4.738444 | 2.153657e‐06 | 0.0017659985 |
| 27–41 | 4.373324 | 1.223689e‐05 | 0.0100342480 |
| 28–41 | 4.519372 | 6.202334e‐06 | 0.0050859139 |
| 33–41 | 4.146138 | 3.381295e‐05 | 0.0277266207 |
| 14–5 | 4.551827 | 5.318204e‐06 | 0.0043609275 |
| 15–5 | 4.186707 | 2.830305e‐05 | 0.0232085009 |
| 16–5 | 4.332755 | 1.472548e‐05 | 0.0120748963 |
| 26–5 | 4.551827 | 5.318204e‐06 | 0.0043609275 |
| 27–5 | 4.186707 | 2.830305e‐05 | 0.0232085009 |
| 28–5 | 4.332755 | 1.472548e‐05 | 0.0120748963 |
Note: Results of the Dunn's post‐hoc test performed to evaluate which specific pairs of (semi)landmark show statistically significant differences in the distribution of DA values across landmarks. Here reported just the pairs of (semi)landmark where the p value indicates a statistical significant difference. All the p values are Bonferroni corrected.
Abbreviations: Comparison, pairwise (semi)landmarks comparison; p. adj, Bonferroni corrected p value for each comparison; p. unadj, unadjusted p values for each comparison; Z, values for the Z test statistic for each comparison.
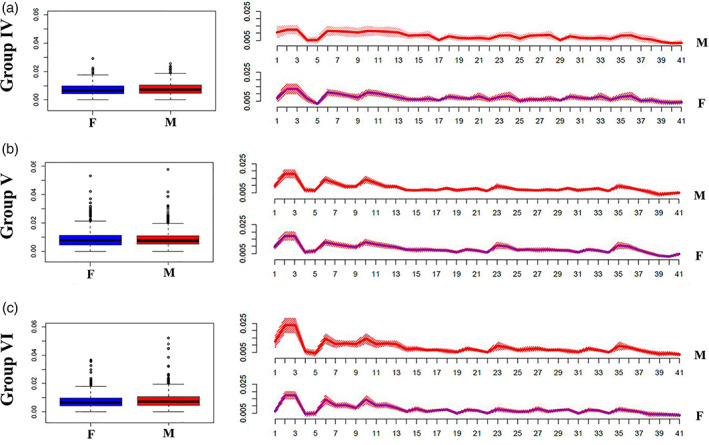
As shown in Figure 3, males and females (groups IV‐V‐VI) show similar distribution of DA values. This is also confirmed by the absence of significant differences in Mann–Whitney‐Wilcoxon test (p value >0.05).
FIGURE 3.

Differences in the distribution of DA values between males and females in different age groups. Left: Boxplots showing the overall distribution of DA values across (semi)landmarks for different age classes; right: Line plots showing differences in the distribution of DA values between males and females at each (semi)landmark. M = males, red colored boxes (left) and lines (right); F = females, blue colored boxes (left) and lines (right)
4.2. Fluctuating asymmetry
As far as within group differences are concerned (Table 3), the portion of variance explained by FA ranges from 7% to 9% for groups III‐IV‐VI, increasing to around 11% for group V and 10% for group II, with a higher percentage for group I at around 21%.
Moreover, Table 8 shows statistically significant differences between groups (p value <0.0001) especially concerning groups V‐I, VI‐I, V‐II, VI‐II, V‐III, V‐IV after Tukey's HSD post‐hoc test (Table 9). Kruskal‐Wallis test shows that significant differences in the distribution of FA values emerged only for landmark 2, 3 and 6, 10 corresponding to ento‐molars left/right and alveolar molar area respectively (Table S2). Peaks observed in correspondence of landmark 2 and 3 decrease their effect up to group III and gradually increases again until group VI, while peaks 6 and 10 (peaks localized on alveolar areas) only increase from group IV (Figure 4). Regarding inter‐individual variance the evidence of its dispersion of individuals around the mean was graphically confirmed within group I up to group III (Figure 4) decreasing then in the other groups. As shown in Figure 5, males and females (group IV‐V‐VI) show similar distribution of FA values. This is also confirmed by the absence of significant differences in Mann–Whitney‐Wilcoxon test (p value >0.05).
TABLE 8.
Procrustes ANOVA (alpha = 0.05) of FA variation between groups
| df | SS | MS | F value | p value | |
|---|---|---|---|---|---|
| FA.group | 5 | 0.00207 | 0.0004137 | 13.6 | 0.00000000000031 |
| Residuals | 7497 | 0.22810 | 0.0000304 |
Abbreviations: df, degrees of Freedom; F, Fisher value; MS, mean square; SS, sums of squares.
TABLE 9.
Fluctuating asymmetry
| diff | lwr | upr | p adj | |
|---|---|---|---|---|
| gII‐gI | 0.0001977353 | −0.001081561 | 0.001477032 | 0.9979107 |
| gIII‐gI | 0.0004704010 | −0.000854008 | 0.00179481 | 0.9139878 |
| gIV‐gI | 0.0006716972 | −0.0005273952 | 0.00187079 | 0.6007386 |
| gV‐gI | 0.0016449604 | 0.0005138338 | 0.002776087 | 0.0004909 |
| gVI‐gI | 0.0011973402 | 0.00003979695 | 0.002354883 | 0.0377149 |
| gIII‐gII | 0.0002726658 | −0.0007166915 | 0.001262023 | 0.9700381 |
| gIV‐gII | 0.0004739620 | −0.000340035 | 0.001287959 | 0.5586858 |
| gV‐gII | 0.0014472251 | 0.0007371436 | 0.002157307 | 0.0000001 |
| gVI‐gII | 0.0009996049 | 0.0002481564 | 0.001751053 | 0.0020882 |
| gIV‐gIII | 0.0002012962 | −0.0006819084 | 0.001084501 | 0.9871338 |
| gV‐gIII | 0.0011745593 | 0.0003860956 | 0.001963023 | 0.0003170 |
| gVI‐gIII | 0.0007269392 | −0.00009897496 | 0.001552853 | 0.1215326 |
| gV‐gIV | 0.0009732631 | 0.0004205984 | 0.001525928 | 0.0000079 |
| gVI‐gIV | 0.0005256430 | −0.00007925166 | 0.001130538 | 0.1310185 |
| gVI‐gV | −0.0004476201 | −0.0009031661 | 0.000007925781 | 0.0574075 |
Note: Results of the Tukey's HSD post‐hoc test performed to evaluate which group pairs show statistically significant differences in the distribution of FA values between groups. All the p values are Bonferroni corrected. Significant differences shown in bold.
Abbreviations: diff, difference in the observed means; g, group; lwr, lower end point of the interval; p adj, Bonferroni corrected p value; upr, upper end point of the interval.
FIGURE 4.

The distribution of fluctuating asymmetry in different age groups. Solid lines show mean FA values calculated at each (semi)landmark for each age group, while the shaded envelope represents a 95% confidence interval
FIGURE 5.
Differences in the distribution of FA values between males and females in different age groups. Left: Boxplots showing the overall distribution of FA values across (semi)landmarks for different age classes; right: Line plots showing differences in the distribution of FA values between males and females at each (semi)landmark. M = males, red colored boxes (left) and lines (right); F = females, blue colored boxes (left) and lines (right)
5. DISCUSSION
By observing morphological variation in the palate, we achieved an in‐depth understanding of asymmetry and where it manifests. Slight morphological variation (orange points of Figure S3) is visible between right and left sides at the posterior area of the palate. The results described in this study provide evidence of inter‐individual morphological differences during palate growth. In the main, asymmetry appears as a functional response to different inputs such as physiological forces, nutritive and non‐nutritive habits, para‐masticatory activity, and speech development. In this study we highlight this response during growth.
Whether this effect depends on particular features of the present sample or on sample size will need to be further tested in the future with larger samples.
Asymmetric components show a multidirectional movement which involved the entire morphological structure. In detail, in our sample the effects of asymmetry produce a multidirectional alteration of the palate morphology in the Group I (1.3–1.7 yo) and become oriented (opposite bilateral direction) anteriorly (left side) and posteriorly (right side) from Group II (2–6 years age). In order to define in which way asymmetry (directional and fluctuating) behave during life we provided a more detailed description below.
5.1. Directional asymmetry
Group I (1.3 and 1.7 yo) shows slight morphological variation on the palatal surface opposed to group II which shows higher values of alteration particularly in the incisal zone (Figure 2(a), and red points in Figure S3). Similar to group I, group III (7–12 yo) shows a moderate alteration (orange points in Figure S3) on the palatal surface mainly localized on the anterior and posterior area. Morphological changes seem to reach a plateau with M3s eruption (group IV) and its occlusion contact (group V). Eventually, a slight modification localized on the anterior area seems to characterize group VI (senior).
Individuals with incisor proclination, dental crowding, and a narrow and deep palate resulting in irreversible asymmetry, likely generated by insufficient naso‐respiratory function and hypertrophied adenoids (Bresolin et al., 1984; Cozza et al., 2007; Di Francesco et al., 2006; Emslie et al., 1952; Figus et al., 2017; Harari et al., 2010; Hartsook, 1946; Katz et al., 2004; Melink et al., 2010; Rubin, 1980; Valera et al., 2003; Vazquez‐Nava et al., 2006; Vig, 1998; Warren, 1990; Warren & Bishara, 2002) were excluded from the sample. These pathological conditions have a measurable impact on palate morphology before the age of 12 and after the age of 5 yo. Asymmetries identified in individuals belonging to class I and II were interpreted as produced by no‐pathological variables because the area of morphological variation combined with lower intensity of asymmetry does not seem to be linked to a para‐functional factor.
One of the most likely explanations for the observed alteration (Figure S3) identified on the palatal surface of group I could be linked to remnants of intrauterine development (Wolpert et al., 2006). As a matter of fact, fetal life consolidates multifactorial patterns of growth and leads to asymmetry (Moreira et al., 2008). Considering the absence of biomechanical stress typically produced by dental occlusion, we might attribute asymmetry of these individuals to the physiological development of primary teeth. The latter start to form in the uterus, more specifically at the end of the fifth week of gestation (Koussoulakou et al., 2009). By the time, the embryo is 10 weeks old, there are 10 buds on the upper and lower arches that will eventually become the primary (deciduous) dentition. These teeth will continue to form until they erupt in the mouth within the first and second years of life.
Lateral pressure of natural birthing (Katz et al., 2004) might be another factor. The pressure experienced during birth causes asymmetry in the anterior and posterior area of the palate (De Souza et al., 1976; Lissauer & Hansen, 2020).
The “sucking movements during breastfeeding” is another variable which generates unbalanced pressure of the tongue on each half of the palate. However, our results show symmetric alteration (Figure 2) on the anterior region of the palate (Figure S3). Morphological differences identified between infants (lowering and expanding of the palate structure) and adults are rather to be attributed to the passage of air through the nose during breastfeeding which exerts pressure on the palate (Walker, 2014).
Considering the intensity of anterior asymmetry identified in group II (Figure 2 and Figure S3), it might be ascribed to habit/skills usually acquired between 2 and 6 yo such as non‐nutritive sucking, development of speech and/or dietary habits. These variables, indeed, can produce an anterior asymmetrical or unbalanced over‐exertion generated by thumb (i.e., non‐nutritive sucking) or tongue pressure (i.e., languages, tongue thrust, dietary habits, breathing pattern).
Non‐nutritive sucking habits may result in the development of physiological imbalance during growth in addition to deviations from a normal swallowing pattern (Cozza et al., 2007; Katz et al., 2004; Melink et al., 2010; Vazquez‐Nava et al., 2006; Warren & Bishara, 2002) due to thumb‐sucking pressure (Yokota et al., 2007) and tongue anterior thrusting leading to longer‐term problems especially present in children (Melink et al., 2010; Vazquez‐Nava et al., 2006).
As far as development of speech is concerned, it is known that between 3 and 6 years of age, speech sounds and words are pronounced clearly (Berk, 2013; Bloom & Lahey, 1978). Tongue strength and its influence on palate morphology increases rapidly from 3 to 6.5 years of age, after which it decreases and has less of an impact for the remainder of the life span (Potter et al., 2019). As our sample include native Italian individuals, Italian language might be considered as another plausible source of the observed variation, since articulatory mechanisms for the production of voiced stopped consonants (/t/ and /d/), produce a higher anterior pressure of oral air with an anterior contact between tongue and palate (Moen et al., 2001). Eventually, the maximum tongue strength (45%–60% of power) during swallowing, dependent on bolus size and viscosity (Youmans et al., 2009), generates a distributed pressure on the palatal surface which in our case appears identified by orange circles on the palatal surface (Figure S3). In light of these considerations, the anterior alteration shared by group II until group VI might be ascribed to these variables (Figure 2 and Figure S3).
The anterior and posterior variation of the maxilla bone identified in group III (7–12 yo) might be influenced by dental turnover. As far as this variable is concerned, dental eruption and/or premature loss of primary dentition produce a slight morphological adjustment (Profit et al., 1986) (Figure 2 and Figure S3).
The signal of M3 eruption and occlusion seems to be detected in group IV and V respectively, where the force thrust of this tooth slightly produce an anterior alteration (Gavazzi et al., 2014; Niedzielska, 2005) (see Figure S3). It is interesting to observe how M3 eruption (group IV) and its occlusion (group V) does not alter the masticatory system as a whole to such an extent as to produce high asymmetry on the anterior area, as previously described by Niedzielska (2005) and Gavazzi et al. (2014).
Finally, asymmetry was identified on the anterior area of the palate for individuals in group VI. This could be ascribable to the plasticity of the facial skeleton which changes during adult age (more than 50 yo) as suggested by bone resorption and bone growth surrounding the canine fossa (Schuh et al., 2019) as well as shortening and narrowing/flattening of the face in senility (Hellman, 1927).
As far as differences between males and females are concerned, group IV exhibits the major number of alterations (around 13–18 yo): females show morphological asymmetry especially on both sides of the anterior area of palatal arch (semilandmarks 14–18 and 26–30); a change not acquired in males until later in life (group V and VI). As suggested by Bastir et al. (2006), this result is probably lead by shape maturation of female facial and mandibular structures (around 15–16 yo). In fact, sexual dimorphism in the face as well as bidirectional developmental influences between the lateral cranial floor and the face happens until about 11–12 years and is related to the slightly prolonged growth and development of males compared with females (Bhatia & Leighton, 1993; Enlow & Hans, 1996; Rosas & Bastir, 2002).
5.2. Fluctuating asymmetry
FA shows differences between groups but seems to fade out up to group IV, where morphological instability of palatal arch reduces (group V and VI) (Figure 4). Indeed, premolar (semilandmarks 8 and 12), molar (Landmarks 2 and 3) and palatine mid‐sagittal suture (landmarks 38, 39 and 40) show high variability around mean values of FA during the first year of life (Figure 4) probably due to the ductility of maxillary bone. Our results confirm that during growth, asymmetry of the posterior palatal area of infants reduced up to group III where only anterior area (landmarks 9 and 13) shows a high degree of asymmetry. This signal might be ascribed to the disto‐mesial closing of palatal suture which starts posteriorly in young age and ends in the anterior area during older ages (Melsen, 1975; Melsen & Melsen, 1982; Persson & Thilander, 1977). Therefore, morphological variability decreases during growth, when it is hidden by mechanical stress (probably linked to physiological process and/or paramasticatory habits) identified by directional asymmetry.
As far as differences between males and females are concerned, group IV (13–18 yo) and group VI (36–72 yo) males seem to have a higher dispersion around the mean than females, which could be interpreted as evidence of a greater morphological ductility of the palatal arch. This is quite evident especially for landmarks 2–3 (Figure 5) of group VI.
Results of this study underline the dominance of FA in the earlier stages of life and the role of DA as mechanical stress accumulated during growth.
6. CONCLUSION
Given the evidence of mechanical alteration on morphology of the palate, we suggest that the multidirectional asymmetry (lateral, anterior, posterior, and vertical asymmetry, see Figure S2) in the masticatory system is the product of a complex chain of responses.
Our results highlight over the lifespan that the effects of FA diminish and DA becomes more noticeable. The stability of alveolar bone and palatal morphology during life seems to change because of non‐nutritive sucking, development of languages and food consistency, all of which concur to bone modification depending on age stages. Physiological processes (e.g., breastfeeding sucking, dental turnover, M3 eruption/occlusion), on the other hand, have a slight but measurable influence on morphology.
This work resonates with research aimed at understanding possible relationship between age and language acquisition based on tongue pressure and palate morphology. It provides new perspectives from a medical and evolutionary point of view. In a medical perspective, it could be considered as a useful guide for planning orthodontic and surgical procedures, especially in light of the need in maintaining stability of asymmetric corrections. Predicting the possible changes throughout the lifespan, can be useful for applying the appropriate device for each age (e.g., removable retainer, fixed orthodontic appliances). The results should also be considered when applying less‐invasive approaches such as myofunctional cure or speech therapist to be matched to the most affective phase and age. In evolutionary perspective a reduction of biomechanical loadings and forces involving our masticatory system during food ingestion, chewing and non‐masticatory dental activities could be considered one of many variables leading to asymmetry. Continuing biomechanical pressure on our masticatory system triggers variation and asymmetry in development, growth, and remodeling activity in the bony structures. It is likely that each recent and/or ancient human group shows a specific pattern of asymmetry that could be useful to obtain information on cultural habits, physiological processes, as well as language development along time.
Future studies should consider the amount of asymmetry in the masticatory system of modern humans to distinguish physiological (integral part of individuals development) and pathological conditions (interference with the normal dental function and esthetic appearance) as well as understanding any non‐facial effects associated with changes to the palate such as cranial base, expansion of neurocranium and/or suture closure timing (Libby et al. 2017, Bastir et al. 2004) by using a comprehensive “template” able to detect any morphological dependence among cranial bones.
Moreover, investigating the effects of occlusion on the upper and lower jaws in addition to cranial asymmetries in non‐human primates, will be useful to acquire a broader perspective on how individual asymmetry changes during growth in different species. This will augment the new knowledge on the interaction between these processes and the development of different socio/environmental contexts and will provide considerable insight on yet to be understood evolutionary processes.
CONFLICT OF INTEREST
The authors declare no competing interests.
AUTHOR CONTRIBUTIONS
Gregorio Oxilia, Sergio Martini, Jessica C. Menghi Sartorio, Eugenio Bortolini, Stefano Benazzi conception and design; Stefano Benazzi funded the project; Gregorio Oxilia, Melchiore Giganti, Tommaso Mori, Giulia Zampirolo, Jacopo Moggi Cecchi acquisition of data. Gregorio Oxilia, Giulia Zampirolo, Jessica C. Menghi Sartorio reconstructed the digital model; Jessica C. Menghi Sartorio, Eugenio Bortolini and Gregorio Oxilia performed statistical analysis; Gregorio Oxilia, Jessica C. Menghi Sartorio, Eugenio Bortolini, Andrea Papini, Marco Boggioni, Sergio Martini, Filippo Marciani, Stefano Benazzi analyzed the data; Gregorio Oxilia, Jessica C. Menghi Sartorio, Eugenio Bortolini, Andrea Papini, Marco Boggioni, Sergio Martini, Filippo Marciani, Stefano Benazzi discussed the results; Gregorio Oxilia, Jessica C. Menghi Sartorio, Eugenio Bortolini and Stefano Benazzi wrote the manuscript Gregorio Oxilia, Jessica C. Menghi Sartorio, Eugenio Bortolini, Simona Arrighi, Carla Figus, Giulia Marciani, Sara Silvestrini, Maria Elena Pedrosi, Alessandro Riga, Ottmar Kullmer, Rachel Sarig, Luca Fiorenza, Rita Sorrentino, Maria Giovanna Belcastro, Jacopo Moggi Cecchi, Stefano Benazzi edited the manuscript. All authors read, revised and approved the final version of the manuscript. Maria Giovanna Belcastro and Jacopo Moggi Cecchi are scientific directors of the collections of Bologna and Florence respectively.
Supporting information
Data S1. Supporting Information.
ACKNOWLEDGMENTS
This study received funding from the European Research Council (ERC) under the European Union's Horizon 2020 research and innovation program (grant agreement No 724046 – SUCCESS, http://www.erc-success.eu). The Natural History Museum (Anthropology and Ethnology section), Università degli Studi di Firenze (Dr. Monica Zavattaro) is acknowledged for granting access to the collections.
Oxilia G, Menghi Sartorio JC, Bortolini E, et al. Exploring directional and fluctuating asymmetry in the human palate during growth. Am J Phys Anthropol. 2021;175:847–864. 10.1002/ajpa.24293
Gregorio Oxilia, Jessica C. Menghi Sartorio, and Eugenio Bortolini contributed equally to this study.
Funding information H2020 European Research Council, Grant/Award Number: Grant agreement No 724046
DATA AVAILABILITY STATEMENT
The data that support the findings of this study are openly available in AMSActa ‐ Institutional Research Repository at DOI 10.6092/unibo/amsacta/6629, reference number 6629.
REFERENCES
- Adams, D., & Otarola‐Castillo, E. (2013). Geomorph: An R package for the collection and analysis of geometric morphometric shape data. Methods in Ecology and Evolution, 4, 393–399. 10.1111/2041-210X.12035 [DOI] [Google Scholar]
- Alghadir, A. H., Zafar, H., & Iqbal, Z. A. (2015). Effect of tongue position on postural stability during quiet standing in healthy young males. Somatosensory & Motor Research, 32(3), 183–186. [DOI] [PubMed] [Google Scholar]
- Anagnostara, A., Stoeckli, S., Weber, O. M., & Kollias, S. S. (2001). Evaluation of the anatomical and functional properties of deglutition with various kinetic high‐speed MRI sequences. Journal of Magnetic Resonance Imaging, 14(2), 194–199. [DOI] [PubMed] [Google Scholar]
- Anderson, M. J. (2001). A new method for non‐parametric multivariate analysis of variance. Austral Ecology, 26, 32–46. [Google Scholar]
- Auffray, J. C., Alibert, P., Renaud, S., Orth, A., & Bonhomme, F. (1996). Fluctuating asymmetry in Mus musculus subspecific hybridization. In Marcus L. F., Corti M., Loy A., Naylor G. J. P., & Slice D. E. (Eds.), Advances in Morphometrics. NATO ASI Series (Series A: Life Sciences) (Vol. 284). Springer. [Google Scholar]
- Auffray, J. C., Debat, V., & Alibert, P. (1999). Shape asymmetry and developmental stability. In Growth and form: Spatio‐temporal pattern formation in biology (pp. 309–324). Wiley. [Google Scholar]
- Baldini, A. (2010). Clinical and instrumental treatment of a patient with dysfunction of the stomatognathic system: A case report. Annali di Stomatologia, 1(2), 2–5. [PMC free article] [PubMed] [Google Scholar]
- Bansal, A. K., Sharma, M., Kumar, P., Nehra, K., & Kumar, S. (2015). Long face syndrome: A literature review. Journal of Dental Health, Oral Disorders & Therapy, 2(6), 210–213. 10.15406/jdhodt.2015.02.0007 [DOI] [Google Scholar]
- Barden, H. S. (1980). Fluctuating dental asymmetry: A measure of developmental instability in down syndrome. American Journal of Physical Anthropology, 52(2), 169–173. [DOI] [PubMed] [Google Scholar]
- Bastir, M., & Rosas, A. (2004). Facial heights: evolutionary relevance of postnatal ontogeny for facial orientation and skull morphology in humans and chimpanzees. Journal of Human Evolution, 47(5), 359–381. 10.1016/j.jhevol.2004.08.009 [DOI] [PubMed] [Google Scholar]
- Bastir, M., Rosas, A., & O'Higgins, P. (2006). Craniofacial levels and the morphological maturation of the human skull. Journal of Anatomy, 209, 637–654. [DOI] [PMC free article] [PubMed] [Google Scholar]
- Belcastro, M. G., Bonfiglioli, B., Pedrosi, M. E., Zuppello, M., Tanganelli, V., & Mariotti, V. (2017). The history and composition of the identified human skeletal collection of the Certosa cemetery (Bologna, Italy, 19th‐20th century). International Journal of Osteoarchaeology, 27(5, 912–925. [Google Scholar]
- Berk, L. E. (2013). Child Development (9th ed.). Pearson Education. [Google Scholar]
- Bhatia, S. N., & Leighton, B. C. (1993). A manual of facial growth. A computer analysis of longitudinal cephalometric growth data. Oxford University Press. [Google Scholar]
- Bishara, S. E., Burkey, P. S., & Kharouf, J. G. (1994). Dental and facial asymmetries: A review. Angle Orthodontist, 64(2), 89–98. [DOI] [PubMed] [Google Scholar]
- Bloom, L., & Lahey, M. (1978). Language development and language disorders. John Wiley & Sons. [Google Scholar]
- Boder, E. (1953). A common form of facial asymmetry in the newborn infant; its etiology and orthodontic significance. American Journal of Orthodontics and Dentofacial Orthopedics, 39(12), 895–910. [Google Scholar]
- Bogin, B. (1999). Evolutionary perspective on human growth. Annual Review of Anthropology, 28(1), 109–153. [DOI] [PubMed] [Google Scholar]
- Bookstein, F. L. (1996). Combining the tools of geometric morphometrics. In Advances in morphometrics (pp. 131–151). Springer. [Google Scholar]
- Bracco, P., Deregibus, A., & Piscetta, R. (2004). Effects of different jaw relations on postural stability in human subjects. Neuroscience Letters, 356(3), 228–230. [DOI] [PubMed] [Google Scholar]
- Bresolin, D., Shapiro, G. G., Shapiro, P. A., Dassel, S. W., Furukawa, C. T., Pierson, W. E., Chapko, M., & Bierman, C. W. (1984). Facial characteristics of children who breathe through the mouth. Pediatrics, 73, 622–625. [PubMed] [Google Scholar]
- Carini, F., Mazzola, M., Fici, C., Palmeri, S., Messina, M., Damiani, P., & Tomasello, G. (2017). Posture and posturology, anatomical and physiological profiles: Overview and current state of art. Acta Bio‐medica: Atenei Parmensis, 88(1), 11–16. [DOI] [PMC free article] [PubMed] [Google Scholar]
- Cassidy, K. M., Harris, E. F., Tolley, E. A., & Keim, R. G. (1998). Genetic influence on dental arch form in orthodontic patients. Angle Orthodontist, 68(5), 445–454. [DOI] [PubMed] [Google Scholar]
- Cattoni, D. M., Fernandes, F. D., Di Francesco, R. C., & Latorre, R. (2007). Characteristics of the stomatognathic system of mouth breathing children: Anthroposcopic approach. Revista de Atualizacao Cientifica, 19(4), 347–351. 10.1590/s0104-56872007000400004 [DOI] [PubMed] [Google Scholar]
- Cozza, P., Baccetti, T., Franchi, L., Mucedero, M., & Polimeni, A. (2007). Transverse features of subjects with sucking habits and facial hyperdivergency in the mixed dentition. American Journal of Orthodontics and Dentofacial Orthopedics, 132, 226–229. [DOI] [PubMed] [Google Scholar]
- Cuccia, A. M. (2011). Interrelationships between dental occlusion and plantar arch. Journal of Bodywork and Movement Therapies, 15(2), 242–250. 10.1016/j.jbmt.2010.10.007 [DOI] [PubMed] [Google Scholar]
- Cuccia, A. M., & Caradonna, C. (2009). The relationship between the stomatognathic system and body posture. Clinics, 64(1), 61–66. 10.1590/S1807-59322009000100011 [DOI] [PMC free article] [PubMed] [Google Scholar]
- D'Attilio, M., Caputi, S., Epifania, E., Festa, F., & Tecco, S. (2005). Evaluation of cervical posture of children in skeletal class I, II, and III. The Journal of Craniomandibular & Sleep Practice, 23(3), 219–228. 10.1179/crn.2005.031 [DOI] [PubMed] [Google Scholar]
- De Souza, S. W., Ross, J., & Milner, R. D. (1976). Alterations in head shape of newborn infants after caesarean section or vaginal delivery. Archives of Disease in Childhood, 51(8), 624–627. [DOI] [PMC free article] [PubMed] [Google Scholar]
- Di Francesco, R. C., Bregola, E. G. P., Pereira, L. S., & Lima, R. S. (2006). Nasal obstruction and the orthodontic diagnostic. Revista Dental Press de Ortodontia e Ortopedia Facial, 11(1), 107–113. [Google Scholar]
- Dryden, I. L., & Mardia, K. V. (1998). Statistical shape analysis (vol.4). Wiley. [Google Scholar]
- Emslie, R. D., Massler, M., & Zwemer, J. D. (1952). Mouth breathing: I. etiology and effects (a review). Journal of the American Dental Association, 44, 506–521. [DOI] [PubMed] [Google Scholar]
- Enlow, D. H., & Hans, M. G. (1996). Essentials of facial growth. W.B. Saunders Company. [Google Scholar]
- Ferrario, V. F., Sforza, C., Miani, A., Jr., & Serrao, G. (1993). Dental arch asymmetry in young healthy human subjects evaluated by Euclidean distance matrix analysis. Archives of Oral Biology, 38, 189–194. [DOI] [PubMed] [Google Scholar]
- Figus, C., Traversari, M., Scalise, L. M., Oxilia, G., Vazzana, A., Buti, L., Sorrentino, R., Gruppioni, G., & Benazzi, S. (2017). The study of commingled non‐adult human remains: Insights from the 16th–18th centuries community of Roccapelago (Italy). Journal of Archaeological Science, 14, 382–391. 10.1016/j.jasrep.2017.06.023 [DOI] [Google Scholar]
- Finnerty, J. R. (2005). Did internal transport, rather than directed locomotion, favor the evolution of bilateral symmetry in animals? BioEssays, 27, 1174–1180. 10.1002/bies.20299 [DOI] [PubMed] [Google Scholar]
- Finnerty, J. R., Pang, K., Burton, P., Paulson, D., & Martindale, M. Q. (2004). Origins of bilateral symmetry: Hox and Dpp expression in a sea Anemon. American Association for the Advancement of Science, 304(5675), 1335–1337. [DOI] [PubMed] [Google Scholar]
- Gadotti, I. C., Bérzin, F., & Biasotto‐Gonzalez, D. (2005). Preliminary rapport on head posture and muscle activity in subjects with class I and II. Journal of Oral Rehabilitation, 32(11), 794–799. 10.1111/j.1365-2842.2005.01508.x [DOI] [PubMed] [Google Scholar]
- Gangloff, P., Louis, J.‐P., & Perrin, P. P. (2000). Dental occlusion modifies gaze and posture stabilization in human subjects. Neuroscience Letters, 293(3), 203–206. 10.1016/S0304-3940(00)01528-7 [DOI] [PubMed] [Google Scholar]
- Gavazzi, M., De Angelis, D., Blasi, S., Pesce, P., & Lanteri, V. (2014). Third molars and dental crowding: Different opinions of orthodontists and oral surgeons among Italian practitioners. Progress in Orthodontics, 15(1), 60. [DOI] [PMC free article] [PubMed] [Google Scholar]
- Graham, J. H., Freeman, D. C., & Emlen, J. M. (1994). Antisymmetry, directional asymmetry, and dynamic morphogenesis. In Developmental instability: Its origins and evolutionary implications (pp. 123–139). Springer. [Google Scholar]
- Graham, J. H., Raz, S., Hel‐Or, H., & Nevo, E. (2010). Fluctuating asymmetry: Methods, theory, and applications. Symmetry, 2(2), 466–540. [Google Scholar]
- Gunz, P., & Mitteroecker, P. (2013). Semilandmarks: A method for quantifying curves and surfaces. Hystrix, the Italian journal of Mammalogy., 24(1), 103–109. [Google Scholar]
- Gunz, P., Mitteroecker, P., & Boekstein, F. L. (2005). Semilandmarks in three dimensions. In Slice D. E. (Ed.), Modern morphometrics in physical anthropology (pp. 73–98). Springer, Science & Business Media. [Google Scholar]
- Hallgrímsson, B. (1988). Fluctuating asymmetry in the mammalian skeleton. In Evolutionary biology (pp. 187–251). Springer. [Google Scholar]
- Harari, D., Redlich, M., Miri, S., Hamud, T., & Gross, M. (2010). The effect of mouth breathing versus nasal breathing on dentofacial and craniofacial development in orthodontic patients. Laryngoscope, 120, 2089–2093. [DOI] [PubMed] [Google Scholar]
- Hartsook, J. T. (1946). Mouth breathing as a primary etiologic factor in the production of malocclusion. Journal of Dentistry for Children, 13, 91–94. [PubMed] [Google Scholar]
- Hellman, M. (1927). Changes in the human face brought about by development. International Journal of Orthodontics, 13, 475. [Google Scholar]
- Hellsing, E., McWilliam, J., Reigo, T., & Spangfort, E. (1987). The relationship between craniofacial morphology, head posture and spinal curvature in 8, 11 and 15‐year‐old children. European Journal of Orthodontics, 9(1), 254–264. 10.1093/ejo/9.1.254 [DOI] [PubMed] [Google Scholar]
- Hershkovitz, I., Livshits, G., Moskona, D., Arensburg, B., & Kobyliansky, E. (1993). Variables affecting dental fluctuating asymmetry in human isolates. American Journal of Physical Anthropology, 91(3), 349–365. [DOI] [PubMed] [Google Scholar]
- Hiiemae, K. M., & Palmer, J. B. (2003). Tongue movements in feeding and speech. Critical Reviews in Oral Biology & Medicine, 14(6), 413–429. 10.1177/154411130301400604 [DOI] [PubMed] [Google Scholar]
- Hori, K., Taniguchi, H., Hayashi, H., Magara, J., Minagi, Y., Li, Q., & Inoue, M. (2013). Role of tongue pressure production in oropharyngeal swallow biomechanics. Physiological Reports, 1(6), e00167. [DOI] [PMC free article] [PubMed] [Google Scholar]
- Katz, C. R. T., Rosenblatt, A., & Gondim, P. P. C. (2004). Nonnutritive sucking habits in Brazilian children: Effects on deciduous dentition and relationship with facial morphology. American Journal of Orthodontics and Dentofacial Orthopedics, 126, 53–57. [DOI] [PubMed] [Google Scholar]
- Kent, J. T., & Mardia, K. V. (2001). Shape, Procrustes tangent projections and bilateral symmetry. Biometrika, 88(2), 469–485. [Google Scholar]
- Klein, J. C. (1986). Nasal respiratory function and craniofacial growth. Archives of Otolaryngology – Head & Neck Surgery, 112(8), 843–849. 10.1001/archotol.1986.03780080043009 [DOI] [PubMed] [Google Scholar]
- Klingenberg, C. P. (2015). Analyzing fluctuating asymmetry with geometric morphometrics: Concepts, methods, and applications. Symmetry, 7(2), 843–934. [Google Scholar]
- Klingenberg, C. P., Badyaev, A. V., Sowry, S. M., & Beckwith, N. J. (2001). Inferring developmental modularity from morphological integration: Analysis of individual variation and asymmetry in bumblebee wings. The American Naturalist, 157(1), 11–23. [DOI] [PubMed] [Google Scholar]
- Klingenberg, C. P., Barluenga, M., & Meyer, A. (2002). Shape analysis of symmetric structures: Quantifying variation among individuals and asymmetry. Evolution, 56, 1909–1920. [DOI] [PubMed] [Google Scholar]
- Klingenberg, C. P., & McIntyre, G. S. (1998). Geometric Morphometrics of developmental instability: Analyzing patterns of fluctuating asymmetry with Procrustes methods. Evolution, 52, 1363–1375. 10.1111/j.1558-5646.1998.tb02018.x [DOI] [PubMed] [Google Scholar]
- Klingenberg, C. P., & Zaklan, S. D. (2000). Morphological integration between developmental compartments in the drosophila wing. Evolution, 54(4), 1273–1285. [DOI] [PubMed] [Google Scholar]
- Koussoulakou, D. S., Margaritis, L. H., & Koussoulakos, S. L. (2009). A curriculum vitae of teeth: Evolution, generation, regeneration. International Journal of Biological Sciences, 5(3), 226–243. [DOI] [PMC free article] [PubMed] [Google Scholar]
- Kritsineli, M., & Shim, Y. S. (1992). Malocclusion, body posture, and temporomandibular disorder in children with primary and mixed dentition. The Journal of Clinical Pediatric Dentistry, 16(2), 86–93. [PubMed] [Google Scholar]
- Lammert, A., Proctor, M., & Narayanan, S. (2011). Morphological variation in the adult vocal tract: A study using rtMRI. In Ostry D., Baum S. R., Ménard L., & Gracco V. L. (Eds.), Proceedings of the international seminar on speech production (pp. 409–410). UQAM. [Google Scholar]
- Lammert, A., Proctor, M., & Narayanan, S. (2013a). Interspeaker variability in hard palate morphology and vowel production. Journal of Speech, Language, and Hearing Research, 56(6), 1924–1933. [DOI] [PubMed] [Google Scholar]
- Lammert, A., Proctor, M., & Narayanan, S. (2013b). Morphological variation in the adult hard palate and posterior pharyngeal wall. Journal of Speech, Language, and Hearing Research, 56(2), 521–530. [DOI] [PMC free article] [PubMed] [Google Scholar]
- Lear, C. S. C., Flanagan, J. B., Jr., & Moorrees, C. F. A. (1965). The frequency of deglutition in man. Archives of Oral Biology, 10(1), 83–99. [DOI] [PubMed] [Google Scholar]
- Lee, W. Y., Okeson, J. P., & Lindroth, J. (1995). The relationship between forward head posture and temporomandibular disorders. Journal of Orofacial Pain, 9, 161–167. [PubMed] [Google Scholar]
- Libby, J., Marghoub, A., Johnson, D., Khonsari, R. H., Fagan, M. J., & Moazen, M. (2017). Modelling human skull growth: a validated computational model. Journal of the Royal Society Interface, 14, 20170202. [DOI] [PMC free article] [PubMed] [Google Scholar]
- Lissauer, T., & Hansen, A. (2020). Physical examination of the newborn. In Martin R. J., Fanaroff A. A., & Walsh M. C. (Eds.), Neonatal‐perinatal medicine: Diseases of the fetus and infant (11th ed.). Elsevier. Chap. 28. [Google Scholar]
- Livshits, G., Davidi, L., Kobyliansky, E., Ben‐Amitai, D., Levi, Y., Merlob, P., & Reynolds, J. F. (1988). Decreased developmental stability as assessed by fluctuating asymmetry of morphometric traits in preterm infants. American Journal of Medical Genetics, 29(4), 793–805. [DOI] [PubMed] [Google Scholar]
- Lu, D. W., Shi, B., Chen, H. Q., He, X., Liao, L. S., & Zheng, Q. (2010). A comparative study of fluctuating asymmetry in Chinese families with nonsyndromic cleft palate. The Cleft Palate‐Craniofacial Journal, 47(2), 182–188. [DOI] [PubMed] [Google Scholar]
- Lundstrӧm, A. (1961). Some asymmetries of the dental arches, jaws, and skull and their etiological significance. American Journal of Orthodontics and Dentofacial Orthopedics, 47(2), 81–106. [Google Scholar]
- Mardia, K. V., Bookstein, F. L., & Moreton, I. J. (2000). Statistical assessment of bilateral symmetry of shapes. Biometrika, 87(2), 285–300. [Google Scholar]
- Melink, S., Vagner, M. V., Hocevar‐Boltezar, I., & Ovsenik, M. (2010). Posteriorcrossbite in the deciduous dentition period, its relationwith sucking habits, irregular orofacial functions, and otolaryngological findings. American Journal of Orthodontics and Dentofacial Orthopedics, 138, 32–40. [DOI] [PubMed] [Google Scholar]
- Melnik, A. K. (1992). A cephalometric study of mandibular asymmetry in a longitudinally followed sample of growing children. American Journal of Orthodontics and Dentofacial Orthopedics, 101(4), 355–366. [DOI] [PubMed] [Google Scholar]
- Melsen, B. (1975). Palatal growth studied on human autopsy material. A histological micro‐radiographical study. American Journal of Orthodontics and Dentofacial Orthopedics, 68, 42–54. [DOI] [PubMed] [Google Scholar]
- Melsen, B., & Melsen, F. (1982). The postnatal development of the palatomaxillary region on human autopsy material. American Journal of Orthodontics and Dentofacial Orthopedics, 82, 329–342. [DOI] [PubMed] [Google Scholar]
- Milani, R. S., De Periere, D. D., Lapeyre, L., & Pourreyron, L. (2000). Relationship between dental occlusion and posture. Journal of Craniomandibular & Sleep Practice, 18, 127–134. [DOI] [PubMed] [Google Scholar]
- Mitteroecker, P., & Gunz, P. (2009). Advances in geometric morphometrics. Journal of Evolutionary Biology, 36(2), 235–247. [Google Scholar]
- Moen, I., Simonsena, H.G., Husebyb, M., Grue, J. (2001), The relationship between intraoral air pressure and tongue/palate contact during the articulation of Norwegian /t/ and /d/ In Seventh European Conference on Speech Communication and Technology , 265‐268.
- Moggi‐Cecchi, J., Pacciani, E., & Pinto‐Cisternas, J. (1994). Enamel hypoplasia and age at weaning in 19th‐century Florence, Italy. American Journal of Physical Anthropology, 93, 299–306. 10.1002/ajpa.1330930303 [DOI] [PubMed] [Google Scholar]
- Møller, A. P., & Swaddle, J. P. (1997). Asymmetry, developmental stability and evolution. Oxford University Press. [Google Scholar]
- Moreira, R. S., Sgrott, E. A., Stuker, H., Alonso, L. G., & Smith, R. L. (2008). Palatal asymmetry during development: An anatomical study. Clinical Anatomy, 21(5), 398–404. [DOI] [PubMed] [Google Scholar]
- Narayanan, S., Nayak, K., Lee, S., Sethy, A., & Byrd, D. (2004). An approach to real‐time magnetic resonance imaging for speech production. Journal of the Acoustical Society of America, 115(4), 1771–1776. [DOI] [PubMed] [Google Scholar]
- Niedzielska, I. (2005). Third molar influence on dental arch crowding. European Journal of Orthodontics, 27, 518–523. [DOI] [PubMed] [Google Scholar]
- Nobili, A., & Adversi, R. (1996). Relationship between posture and occlusion: A clinical and experimental investigation. The Journal of Craniomandibular & Sleep Practice, 14(4), 274–285. 10.1080/08869634.1996.11745978 [DOI] [PubMed] [Google Scholar]
- Noss, J. F., Scott, G. R., Yap Potter, R. H., & Dahlberg, A. (1983). Fluctuating asymmetry in molar dimensions and discrete morphological traits in Pima Indians. American Journal of Physical Anthropology, 61, 437–445. [DOI] [PubMed] [Google Scholar]
- Oksanen, J., Blanchet, F. G., Friendly, M., Kindt, R., Legendre, P., McGlinn, D., Minchin, P. R., O'Hara, R. B., Simpson, G. L., Solymos, P., Henry, M., Stevens, H., Szoecs, E., & Wagner, H. (2019). Vegan: Community ecology package. https://CRAN.R-project.org/package=vegan
- Olivo, S. A., Bravo, J., Magee, D. J., Thie, N. M., Major, P. W., & Flores‐Mir, C. (2006). The association between head and cervical posture and temporomandibular disorders: A systematic review. Journal of Orofacial Pain, 20(1), 9–23. [PubMed] [Google Scholar]
- Oxilia, G., Bortolini, E., Martini, S., Papini, A., Boggioni, M., Buti, L., Figus, C., Sorrentino, R., Townsend, G., Kaidonis, J., Fiorenza, L., Cristiani, E., Kullmer, O., Moggi‐Cecchi, J., & Benazzi, S. (2018). The physiological linkage between molar inclination and dental macrowear pattern. American Journal of Physical Anthropology, 166, 941–951. [DOI] [PMC free article] [PubMed] [Google Scholar]
- Özener, B. (2010). Fluctuating and directional asymmetry in young human males: Effect of heavy working condition and socioeconomic status. American Journal of Physical Anthropology, 143(1), 112–120. [DOI] [PubMed] [Google Scholar]
- Palmer, A. R. (1994). Fluctuating asymmetry analyses: A primer. In Developmental instability: Its origins and evolutionary implications (pp. 335–364). Springer. [Google Scholar]
- Palmer, A. R., & Strobeck, C. (1986). Fluctuating asymmetry: Measurement, analysis, patterns. Annual Review of Ecology and Systematics, 17(1), 391–421. [Google Scholar]
- Palmer, A. R., & Strobeck, C. (2003). Fluctuating asymmetry analyses revisited. In Polak M. (Ed.), Developmental instability: Causes and consequences. Oxford University Press. [Google Scholar]
- Palmer, J. B., Hiiemae, K. M., & Lui, J. (1997). Tongue‐jaw linkages in human feeding. Archives of Oral Biology, 42, 429–441. [DOI] [PubMed] [Google Scholar]
- Palmer, M., Linde, M., & Morales‐Nin, B. (2010). Disentangling fluctuating asymmetry from otolith shape. Marine Ecology Progress Series, 399, 261–272. [Google Scholar]
- Palmer, P. M., Jaffe, D. M., McCulloch, T. M., Finnegan, E. M., Van Daele, D. J., & Luschei, E. S. (2008). Quantitative contributions of the muscles of the tongue, floor‐of‐mouth, jaw, and velum to tongue‐to‐palate pressure generation. Journal of Speech, Language and Hearing Research, 51, 828–835. [DOI] [PubMed] [Google Scholar]
- Pameijer, J. H. N., Brion, M., Glickman, I., & Roeber, F. W. (1970). Intraoral occlusal telemetry. Part V. effect of occlusal adjustment upon tooth contacts during chewing and swallowing. Journal of Prosthetic Dentistry, 24(5), 492–497. [DOI] [PubMed] [Google Scholar]
- Parsons, P. A. (1992). Fluctuating asymmetry: A biological monitor of environmental and genomic stress. Heredity, 68(4), 361–364. [DOI] [PubMed] [Google Scholar]
- Perillo, L., Femminella, B., Farronato, D., Baccetti, T., Contardo, L., & Perinetti, G. (2011). Do malocclusion and Helkimo index ≥ 5 correlate with body posture? Journal of Oral Rehabilitation, 38(4), 242–252. [DOI] [PubMed] [Google Scholar]
- Persson, M., & Thilander, B. (1977). Palatal suture closure in man from 15 to 35 years of age. American Journal of Orthodontics and Dentofacial Orthopedics, 72, 42–52. [DOI] [PubMed] [Google Scholar]
- Pirittiniemi, P. M. (1994). Associations of mandibular and facial asymmetries—A review. American Journal of Orthodontics and Dentofacial Orthopedics, 106(2), 191–200. [DOI] [PubMed] [Google Scholar]
- Potter, N. L., Nievergelt, Y., & VanDam, M. (2019). Tongue strength in children with and without speech sound disorders. American Journal of Speech‐Language Pathology, 28(2), 612–622. 10.1044/2018_AJSLP-18-0023 [DOI] [PMC free article] [PubMed] [Google Scholar]
- Profit, W. R., FlEld, H. W., Ackerman, J. L., Thomas, P. M., & Tulloch, J. F. C. (1986). Contemporary orthodontics, the CV. Mosby co. St. Louis (Ed.) (pp. 272–286). Hlm. [Google Scholar]
- R Core Team (2019). R: A language and environment for statistical computing. R foundation for statistical computing, Vienna, Austria. https://www.R-project.org/.
- Reid, D. C., & Price, A. H. K. (1984). Digital deformities and dental malocclusion due to finger sucking. Journal of Plastic, Reconstructive & Aesthetic Surgery, 37(4), 445–452. [DOI] [PubMed] [Google Scholar]
- Rohlf, F. J., & Slice, D. (1990). Extensions of the Procrustes method for the optimal superimposition of landmarks. Systematic Biology, 39(1), 40–59. [Google Scholar]
- Rosas, A., & Bastir, M. (2002). Thin‐plate spline analysis of allometry and sexual dimorphism in the human craniofacial complex. American Journal of Physical Anthropology, 117, 236–245. [DOI] [PubMed] [Google Scholar]
- Rossi, M., Ribeiro, E., & Smith, R. (2003). Craniofacial asymmetry in development: An anatomical study. Angle Orthodontist, 73, 381–385. [DOI] [PubMed] [Google Scholar]
- Rubin, R. M. (1980). Mode of respiration and facial growth. American Journal of Orthodontics and Dentofacial Orthopedics, 78, 504–510. [DOI] [PubMed] [Google Scholar]
- Schaefer, K., Lauc, T., Mitteroecker, P., Gunz, P., & Bookstein, F. L. (2006). Dental arch asymmetry in an isolated Adriatic community. American Journal of Physical Anthropology, 129(1), 132–142. [DOI] [PubMed] [Google Scholar]
- Schuh, A., Kupczik, K., Gunz, P., Hublin, J.‐J., & Freidline, S. E. (2019). Ontogeny of the human maxilla: A study of intra‐population variability combining surface bone histology and geometric morphometrics. Journal of Anatomy, 235(2), 233–245. [DOI] [PMC free article] [PubMed] [Google Scholar]
- Slice, D. E. (2006). Modern morphometrics in physical anthropology. Springer Science & Business Media (Ed.). [Google Scholar]
- Smith, D. R., Crespi, B. J., & Bookstein, F. L. (1997). Fluctuating asymmetry in the honey bee, Apis mellifera: Effects of ploidy and hybridization. Journal of Evolutionary Biology, 10, 551–574. 10.1046/j.1420-9101.1997.10040551.x [DOI] [Google Scholar]
- Sognnaes, R. F. (1978). Forensic science and oral biology. In Shaw J. H., Sweeney E. A., Cappuccino C. C., & Meller S. M. (Eds.), Textbook of oral biology (pp. 1123–1158). WB Saunders. [Google Scholar]
- Solow, B., & Sonnesen, L. (1998). Head posture and malocclusions. European Journal of Orthodontics, 20(6), 685–693. 10.1093/ejo/20.6.685 [DOI] [PubMed] [Google Scholar]
- Sorrentino, R., Belcastro, M. G., Figus, C., Stephens, N. B., Turley, K., Harcourt‐Smith, W., Ryan, T. M., & Benazzi, S. (2020). Exploring sexual dimorphism of modern human talus through geometric morphometric methods. PLoS One, 15(2), e0229255. [DOI] [PMC free article] [PubMed] [Google Scholar]
- Sorrentino, R., Stephens, N. B., Carlson, K. J., Figus, C., Fiorenza, L., Frost, S., Harcourt‐Smith, W., Parr, W., Saers, J., Turley, K., Wroe, S., Belcastro, M. G., Ryan, T. M., & Benazzi, S. (2020). The influence of mobility strategy on the modern human talus. American Journal of Physical Anthropology, 171(3), 456–469. [DOI] [PubMed] [Google Scholar]
- Traversari, M., Serrangeli, M. C., Catalano, G., Petrella, E., Piciucchi, S., Feletti, F., Oxilia, G., Cristiani, E., Vazzana, A., Sorrentino, R., De Fanti, S., Luiselli, D., Calcagnile, L., Saragoni, L., Feeney, R. N. M., Gruppioni, G., Cilli, E., & Benazzi, S. (2019). Multianalytic study of a probable case of fibrous dysplasia (FD) from Certosa monumental cemetery (Bologna, Italy). International Journal of Paleopathology, 25, 1–8. [DOI] [PubMed] [Google Scholar]
- Valentino, B., & Melito, F. (1991). Functional relationships between the muscles of mastication and the muscles of the leg. Surgical and Radiologic Anatomy, 13, 33–37. [DOI] [PubMed] [Google Scholar]
- Valentino, B., Valentino, T., & Melito, F. (2002). Correlation between interdental occlusal plane and plantar arches. An EMG study. The Pain Clinic, 14(3), 259–262. 10.1163/156856902320761487 [DOI] [PubMed] [Google Scholar]
- Valera, F. C., Travitzki, L. V., Mattar, S. E., Matsumoto, M. A. N., Elias, A. M., & Anselmo‐Lima, W. T. (2003). Muscular, functional and orthodontic changes in preschool children with enlarged adenoids and tonsils. International Journal of Pediatric Otorhinolaryngology, 67, 761–770. [DOI] [PubMed] [Google Scholar]
- Van Valen, L. (1962). A study of fluctuating asymmetry. International Journal of Organic Evolution, XVI(2,16), 125–142. [Google Scholar]
- Vazquez‐Nava, F., Quezada‐Castillo, J. A., Oviedo‐Trevino, S., Saldivar‐González, A. H., Sánchez‐Nuncio, H. R., Beltrán‐Guzmán, F. J., Vázquez‐Rodríguez, E. M., & Vázquez Rodríguez, C. F. (2006). Association between allergic rhinitis, bottle feeding, nonnutritive sucking habits, and malocclusion in the primary dentition. Archives of Disease in Childhood, 91, 836–840. [DOI] [PMC free article] [PubMed] [Google Scholar]
- Vazzana, A., Scalise, L. M., Traversari, M., Figus, C., Apicella, S. A., Buti, L., Oxilia, G., Sorrentino, R., Pellegrini, S., Matteucci, C., Calcagnile, L., Savigni, R., Feeney, R. N. M., Gruppioni, G., & Benazzi, S. (2018). A multianalytic investigation of weapon‐related injuries in a late antiquity necropolis, Mutina, Italy. Journal of Archaeological Science: Reports, 17, 550–559. 10.1016/j.jasrep.2017.12.009 [DOI] [Google Scholar]
- Vig, K. W. (1998). Nasal obstruction and facial growth: The strength of evidence for clinical assumptions. American Journal of Orthodontics and Dentofacial Orthopedics, 113, 603–611. [DOI] [PubMed] [Google Scholar]
- Walker, M. (2014). Breastfeeding management for the clinician using the evidence (3rd ed.). Jones & Bartlett. [Google Scholar]
- Warren, D. W. (1990). Effect of airway obstruction upon facial growth. Otolaryngologic Clinics of North America, 23(4), 699–712. [PubMed] [Google Scholar]
- Warren, J. J., & Bishara, S. E. (2002). Duration of nutritive and nonnutritive sucking behaviors and their effects on the dental arches in the primary dentition. American Journal of Orthodontics and Dentofacial Orthopedics, 121, 347–356. [DOI] [PubMed] [Google Scholar]
- Wolpert, L., Smith, J., Jessel, T., Lawrence, P., Robertson, E., & Meyerowitz, E. (2006). Principles of development (3rd ed., p. 576). Oxford University Press. [Google Scholar]
- Yamaguchi, H., & Sueishi, K. (2003). Malocclusion associated with abnormal posture. The Bulletin of Tokyo Dental College, 44(2), 43–54. [DOI] [PubMed] [Google Scholar]
- Yokota, R., Mishiro, M., Abe, T., Miyake, A., Shiina, N., Sueishi, K., & Yamaguchi, H. (2007). Pressure on anterior region of palate during thumb‐sucking. The Bulletin of Tokyo Dental College, 48(2), 57–66. [DOI] [PubMed] [Google Scholar]
- Yoshino, G., Higashi, K., & Nakamura, T. (2003). Changes in weight distribution at the feet due to occlusal supporting zone loss during clenching. Journal of Craniomandibular & Sleep Practice, 21, 271–278. [DOI] [PubMed] [Google Scholar]
- Youmans, S. R., Youmans, G. L., & Stierwalt, J. A. (2009). Differences in tongue strength across age and gender: Is there a diminished strength reserve? Dysphagia, 24(1), 57–65. [DOI] [PubMed] [Google Scholar]
Associated Data
This section collects any data citations, data availability statements, or supplementary materials included in this article.
Supplementary Materials
Data S1. Supporting Information.
Data Availability Statement
The data that support the findings of this study are openly available in AMSActa ‐ Institutional Research Repository at DOI 10.6092/unibo/amsacta/6629, reference number 6629.