

Abstract
Introduction
Integrating additional factors into the International Federation of Gynecology and Obstetrics (FIGO) staging system is needed for accurate patient classification and survival prediction. In this study, we tested machine learning as a novel tool for incorporating additional prognostic parameters into the conventional FIGO staging system for stratifying patients with epithelial ovarian carcinomas and evaluating their survival.
Material and methods
Cancer‐specific survival data for epithelial ovarian carcinomas were extracted from the Surveillance, Epidemiology, and End Results (SEER) program. Two datasets were constructed based upon the year of diagnosis. Dataset 1 (39 514 cases) was limited to primary tumor (T), regional lymph nodes (N) and distant metastasis (M). Dataset 2 (25 291 cases) included additional parameters of age at diagnosis (A) and histologic type and grade (H). The Ensemble Algorithm for Clustering Cancer Data (EACCD) was applied to generate prognostic groups with depiction in dendrograms. C‐indices provided dendrogram cutoffs and comparisons of prediction accuracy.
Results
Dataset 1 was stratified into nine epithelial ovarian carcinoma prognostic groups, contrasting with 10 groups from FIGO methodology. The EACCD grouping had a slightly higher accuracy in survival prediction than FIGO staging (C‐index = 0.7391 vs 0.7371, increase in C‐index = 0.0020, 95% confidence interval [CI] 0.0012–0.0027, p = 1.8 × 10⁻⁷). Nevertheless, there remained a strong inter‐system association between EACCD and FIGO (rank correlation = 0.9480, p = 6.1 × 10⁻¹⁵). Analysis of Dataset 2 demonstrated that A and H could be smoothly integrated with the T, N and M criteria. Survival data were stratified into nine prognostic groups with an even higher prediction accuracy (C‐index = 0.7605) than when using only T, N and M.
Conclusions
EACCD was successfully applied to integrate A and H with T, N and M for stratification and survival prediction of epithelial ovarian carcinoma patients. Additional factors could be advantageously incorporated to test the prognostic impact of emerging diagnostic or therapeutic advances.
Keywords: C‐index, dendrogram, machine learning, ovarian carcinoma, staging, survival
Abbreviations
- A
age at diagnosis
- AJCC
American Joint Committee on Cancer
- EACCD
Ensemble Algorithm for Clustering Cancer Data
- EOC
epithelial ovarian carcinomas
- FIGO
International Federation of Gynecology and Obstetrics
- H
histologic type and grade
- M
distant metastasis
- N
regional lymph nodes
- SEER
Surveillance Epidemiology, and End Results program
- T
primary tumor
Key message.
Integrating additional factors into the FIGO staging of ovarian cancer is needed for accurate patient classification and survival prediction. We introduced a novel machine learning approach to accomplish this and demonstrated the process by integrating age and histologic type and grade.
1. INTRODUCTION
Epithelial ovarian carcinomas (EOC) are clinically defined by anatomic locations, growth patterns and histologic or cytologic characteristics.1, 2, 3 Their pathogenesis reflects complex interactions of hereditary, environmental, iatrogenic, physiological and anatomical factors as well as genetic mutations or epigenetics.4, 5, 6, 7, 8, 9, 10 Molecular, genetic or proteomic analyses have begun to define molecular signatures in relation to classical morphologic and clinical features.5, 6, 8, 11, 12, 13 As increased numbers of EOC are subjected to more sophisticated analyses, tissue or circulating biomarkers may be expected to personalize clinical delineation, treatment planning and prognostication.5, 10, 11, 12, 13, 14 At present, prognosis of EOC relies heavily upon analyses of primary tumor (T), regional lymph node (N) and distant metastasis (M) systems in addition to microscopic features.15, 16 Three limitations are well recognized: (1) absence of an age parameter which may reflect a changing endocrine background relevant to the pathobiology of many EOC;1, 7, 17 (2) failure to include histologic grade which aligns with both age‐incidence patterns and outcomes of the numerically predominant serous types of EOC;11, 17, 18, 19 and (3) inability to generalize the prognostic impact of advances in molecular genetics or proteomics relevant to EOC.10, 13, 14, 20
In principle, a more accurate prognostic system for EOC should be able to integrate new biological findings into the protocol of International Federation of Gynaecology and Obstetrics (FIGO) while maintaining both well‐defined patient stratification and high accuracy of survival prediction. The objective of this study is to test a multifactorial expansion of the FIGO staging system for EOC using machine learning. This is based upon our prior experience with the application of machine learning to this type of optimization problem21, 22, 23, 24, 25 and involves the addition of age at diagnosis, and histopathologic subtype as parameters. A previously used version of Ensemble Algorithm for Clustering Cancer Data (EACCD)24 was applied.
2. MATERIAL AND METHODS
2.1. Data source and cause‐specific death classification
Disease‐specific survival data with a primary diagnosis of invasive ovarian cancer during 2000‐ 2012 were obtained from 18 databases of the Surveillance, Epidemiology, and End Results Program (SEER) of the National Cancer Institute.26 This restriction on year of diagnosis ensured a minimum 5‐year follow‐up, since current release of SEER includes case reports up to the end of CY 2017. SEER cause‐specific death classification variable27 was used to capture all deaths related to ovarian cancer. Survival time was measured in months.
2.2. Defining factors
This study investigated five factors: T, N, M, age (A) and histologic type and grade (H). Due to a SEER change in cancer staging from “Extent of Disease” before 2004 to a “Collaborative Stage” scheme after 2004, minor alterations in the SEER definitions for T, N and M levels were adjusted. For EOC diagnosed in 2000–2003, T, N and M were based on the 3rd Edition of the American Joint Committee on Cancer (AJCC) TNM.28 For EOC diagnosed between 2004 and 2012, the T, N and M variables were defined according to the Derived AJCC‐6 T, N, M variables.28 To match the definitions of levels defined in the latest FIGO system,16 this study used eight levels for T (T1a, T1b, T1c, T2a, T2b, T3a, T3b, and T3c), two levels for N (N0 and N1) and two levels for M (M0 and M1). We did not use sublevels for M1 as their classification requires information that is not available in the SEER database. Table S1 lists the definition of levels of T, N and M. Factor A (Table S1) was divided into two levels: A0 (<65) and A1 (≥65), based on the median age of EOC diagnoses.29, 30
Histologic types of ovarian cancer specified in the SEER Program Coding are designated by the WHO International Classification of Diseases for Oncology, 3rd edition31, and the relevant morphologic criteria for diagnosis have been amply described.1, 3, 18, 32, 33 Microscopic patterns of EOC recognized in SEER include serous cystadenocarcinoma (ICD‐O‐3, code 8441), papillary serous cystadenocarcinoma (code 8460) and serous surface papillary carcinoma (code 8461). While these serous EOC are recognized as a distinct histotype,1, 9, 11 they were subdivided by grade18, 31 on the basis of many earlier reports indicating a significant survival impact.1, 3, 17, 18, 19 We accordingly distinguished five histologic EOC types for analyses: Hls, Hhs, Hm, Hcc and He. Definitions are provided in Table S1.
The diagnostic grades transcribed in SEER are in accordance with AJCC and FIGO guidelines:34 G1, well differentiated; G2, moderately differentiated; G3, poorly differentiated; G4, undifferentiated. For the present study, we tested each grade individually or in collapsed sets of low grade (G1) and high grade (G2, G3, G4). This “two‐tiered” division followed expert recommendations for diagnostic practice.3, 7, 18
2.3. Data management
Two datasets were analyzed. Dataset 1 contained 39 514 cases which had been staged for extent of tumor as defined above using T, N and M criteria. (The staging of ovarian cancer recorded in SEER is in accordance with standards developed by FIGO or equivalent standards of AJCC.34, 35) Dataset 2 was derived from Dataset 1 by treating age (A) and histologic type and grade (H) as additional factors. Dataset 2 contained 25 291 cases.
We first made sure that a primary diagnosis of invasive ovarian cancer was made during 2000‐2012. We then excluded cases with a missing or unknown value for any of the following variables: survival time, SEER cause‐specific death classification variable,27 T, N and M. Further selection of cases was made in terms of combinations of factors. A combination of prognostic factors is a subset of the data that corresponds to one level of each selected factor. A combination describes certain characteristics of its patients. For example, T1, N0, M0 produce a combination (denoted by T1N0M0) which represents a subset of patients whose primary tumor is T1, regional lymph nodes N0, and distant metastasis M0. As in T1N0 M0, we use the notations of levels of factors to denote combinations in this report.
Because of the statistical techniques employed, we required that each combination contain a sufficient number of patients to optimize robustness of the statistical techniques. We retained only those combinations in T, N and M that had a minimum of 25 cases. The resulting Dataset 1 contained 29 combinations of T, N and M (39 514 cases; Table 1). (The median follow‐up time of patients in Dataset 1 is 116 months.) We excluded from Dataset 1, any patient with missing or unknown levels on A or H. We then formed combinations in terms of T, N, M, A and H and kept only combinations each containing at least 25 patients. The final dataset is Dataset 2, which contained 25 291 cases (Table 1) in 106 combinations of T, N, M, A and H. (The median follow‐up time of patients in Dataset 2 was 117 months.) The details of data processing are shown in Figure 1.
TABLE 1.
Clinical and demographic characteristics of Dataset 1 (n = 39 514) and Dataset 2 (n = 25 291)
| Dataset 1 | Dataset 2 | |||
|---|---|---|---|---|
| n | % | n | % | |
| Primary tumor | ||||
| T1a | 9248 | 23.4 | 5825 | 23.0 |
| T1b | 770 | 1.9 | 447 | 1.8 |
| T1c | 5682 | 14.4 | 3742 | 14.8 |
| T2a | 1684 | 4.3 | 947 | 3.7 |
| T2b | 2478 | 6.3 | 1422 | 5.6 |
| T3a | 1412 | 3.6 | 755 | 3.0 |
| T3b | 2331 | 5.9 | 1397 | 5.5 |
| T3c | 15 909 | 40.3 | 10 756 | 42.5 |
| Regional Lymph Nodes | ||||
| N0 | 31 737 | 80.3 | 20 487 | 81.0 |
| N1 | 7777 | 19.7 | 4804 | 19.0 |
| Distant Metastasis | ||||
| M0 | 34 701 | 87.8 | 22 927 | 90.7 |
| M1 | 4813 | 12.2 | 2364 | 9.3 |
| Age | ||||
| A0 | 16 972 | 67.1 | ||
| A1 | 8319 | 32.9 | ||
| Histologic Type and Grade | ||||
| Hcc | 2535 | 10.0 | ||
| He | 5457 | 21.6 | ||
| Hhs | 14 031 | 55.5 | ||
| Hls | 603 | 2.4 | ||
| Hm | 2665 | 10.5 | ||
FIGURE 1.
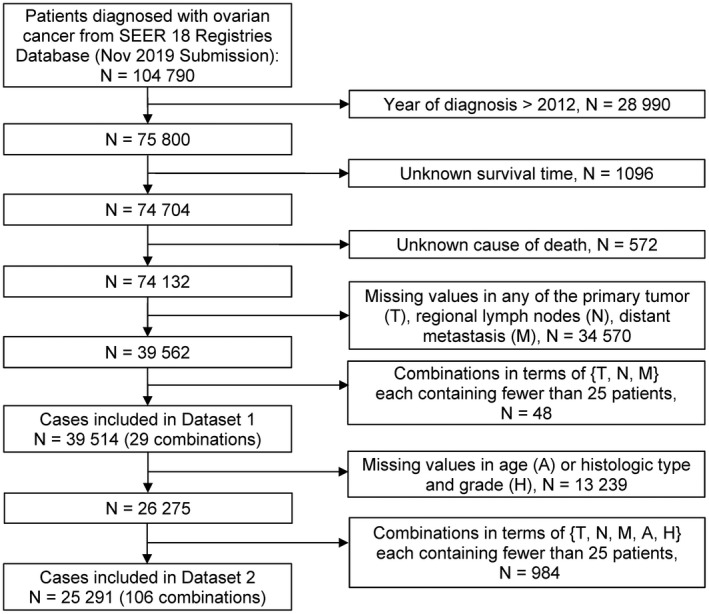
Flow diagram for selecting patients with ovarian cancer. SEER, Surveillance, Epidemiology, and End Results program; T, primary tumor; N, regional lymph nodes; M, distant metastasis; A, age at diagnosis; H, histologic type and grade
2.4. Ensemble algorithm for clustering cancer data (EACCD)
The EACCD is a machine‐learning algorithm designed to partition survival data.21, 22, 23, 24, 25, 36, 37, 38, 39, 40, 41, 42 It consists of three main steps: (1) defining initial dissimilarities between survival functions of any two combinations; (2) obtaining learned dissimilarities using initial dissimilarities and an ensemble learning process; and (3) applying hierarchical clustering analysis to cluster combinations by the learned dissimilarities and a linkage method. The output of the EACCD is a tree‐structured dendrogram, which represents the relation among survival of patients in different combinations. There are several approaches for each step. With the minimax linkage replacing the complete linkage,41 the version of EACCD described in the article by Yang et al24 was used in this paper.
2.5. Prognostic systems
The dendrogram, obtained from the EACCD, can be cut horizontally to generate individual prognostic groups that serve the same role as staging groups in the FIGO. We cut the dendrogram according to the C‐index,43 which estimates the probability that a subject who died at an earlier time had a shorter predicted survival time than did a subject who died at a later time. A model with a high C‐index is preferred, since such a model is expected to have a high accuracy in survival prediction. Moreover, a model with a high C‐index can be complex and inconvenient to use. Examples include models containing many groups that may not be handled efficiently in practice or having overlapping survival curves that may make it difficult to explain. To resolve the tradeoff between model simplicity and prediction accuracy, we chose the number of groups (n*) such that (1) n* was as small as possible, (2) its corresponding C‐index was as large as possible and (3) the resultant survival curves were well separated without overlapping.
Often an appropriate number n* can be found by examining the C‐index curve (the C‐index vs the number of prognostic groups). The C‐index curve, in general, has a “knee” point. The curve increases on the left side of the knee point and levels off on the right side of the knee point. The number n* can be chosen around the knee point, which balances both simplicity and accuracy of the system.
Survival curves using the Kaplan‐Meier estimates44 were plotted to evaluate visually survival differences among the prognostic groups. The final prognostic system includes the dendrogram, group assignment, C‐index and survival curves for the prognostic groups.
2.6. Ethical approval
No ethical approval was required for this study, since the data used are publicly available and de‐identified.
3. RESULTS
3.1. EACCD prognostic system for T, N, M
Applying the EACCD to Dataset 1 yielded the dendrogram in Figure 2A. The C‐index curve is shown in Figure 2B and was used to find n*. The knee point of the curve corresponds to nine groups and a C‐index value of 0.7391. Cutting the dendrogram into nine groups (in rectangles) is shown in Figure 2C and the survival curves of these nine groups are plotted in Figure 2D. The survival curves are completely separated and do not overlap. Therefore, n* = 9, based on T, N and M. For convenience, the definition for all nine groups is restated in the 4th column of Table S2.
FIGURE 2.

Ensemble Algorithm for Clustering Cancer Data (EACCD) prognostic groups on the basis of Dataset 1 involving T, N and M. (A) Dendrogram from running EACCD. Given beneath each combination is the 5‐year cancer‐specific survival rate in percentage. (B) C‐index curve based on the dendrogram in panel (A). (C) Cutting the dendrogram in panel (A) according to n* = 9 suggested in panel (B) creates nine prognostic groups, shown in rectangles. Listed on the bottom of the dendrogram are group numbers. (D) Ovarian cancer‐specific survival of nine prognostic groups in panel (C). The 5‐year cancer specific survival rates are listed on the right
The dendrogram in Figure 2C, the groups in Table S2 (4th column) and the survival curves in Figure 2D define a single prognostic system for ovarian carcinomas that incorporates T, N and M. This system contains nine groups: groups 1‐9, whose risk increases as the group number increases.
For comparison, the FIGO staging system divides Dataset 1 into 10 stages (Figure 3 and the 5th column of Table S2). Calculation shows that the staging system has a C‐index of 0.7371, which is close to but slightly lower than the C‐index 0.7391 from the above EACCD prognostic system (increase in C‐index = 0.0020, 95% confidence interval [CI] 0.0012–0.0027, p = 1.8 × 10⁻⁷).45 Therefore, with the involvement of T, N and M alone, FIGO and EACCD have a similar accuracy in survival prediction.
FIGURE 3.

Cancer‐specific survival of FIGO stages defined in the 5th column in Table S2. The 5‐year cancer‐specific survival rates for the 10 stages are listed on the right Tables
3.2. EACCD prognostic system for T, N, M, A, H
Before building the prognostic system for T, N, M, A and H on the basis of Dataset 2, we assessed the performance in survival prediction of the models for the following three sets of factors: {T, N, M, A}, {T, N, M, H} and {T, N, M, A, H}, as compared with the model based on {T, N, M}. Figure 4A plots C‐index curves, based on Dataset 2, for all these four scenarios. Since the curves on {T, N, M, A} and {T, N, M, H} are higher than the curve on {T, N, M} (for more than two groups), adding A or H to {T, N, M} increases the C‐index and thus improves the prediction accuracy. The curve of {T, N, M, A, H} is the highest among all four curves, implying that adding both A and H to {T, N, M} leads to the biggest improvement on the prediction accuracy of {T, N, M}.
FIGURE 4.

Ensemble Algorithm for Clustering Cancer Data (EACCD) prognostic groups on the basis of Dataset 2 involving T, N, M, A and H. (A) C‐index curves for {T, N, M}, {T, N, M, A}, {T, N, M, H} and {T, N, M, A, H}. (B) Dendrogram and its cutting (shown in rectangles) according to n* = 9 suggested by the C‐index curve for {T, N, M, A, H} in panel (A). Given beneath each combination is the 5‐year cancer‐specific survival rate in percentage. Listed on the bottom are the group numbers. (C) Ovarian cancer‐specific survival of nine prognostic groups in panel (B). The 5‐year cancer‐specific survival rates are listed on the right
Exploring around the knee point of the red curve on {T, N, M, A, H} in Figure 4A reveals n* = 9. Figure 4B shows the dendrogram and its cutting (shown in rectangles) according to n* = 9 groups. A detailed definition for all nine groups is listed in Table S3. Figure 4C shows the survival curves for the nine prognostic groups. The dendrogram in Figure 4B, the groups in Table S3 and the survival curves of the groups in Figure 4C define an EACCD prognostic system for T, N, M, A and H.
4. DISCUSSION
As stated in the TNM classification,46 “There are many bases or axes of tumor classification, for example, the anatomical site, and the clinical and pathological extent of disease,..., the age of the patient, and the histological type and grade of the tumor. All of these have an influence on the outcome of the disease. Classification by anatomical extent of disease is the one with which the TNM system primarily deals.” This paper describes an effort to refine the FIGO system by integration of additional prognostic factors as exemplified by age at diagnosis and histopathologic subtype. The EACCD approach, as introduced in this paper, takes into account both prediction and stratification and is analogous to the FIGO scheme in generating stages.
Creating systems to stage cancer patients can be regarded as one type of unsupervised learning. Except for EACCD, however, the literature does not show any other machine‐learning algorithm that has been applied to create the staging systems for ovarian cancer. Moreover, statistics‐based nomograms47, 48 have the potential to address the issue of staging. The drawback is that nomograms are good for survival prediction but are not as effective at patient stratification, in the sense that the resulting stages or groups tend to have a lower C‐index than the original Cox model.
The EACCD prognostic system using {T, N, M} based on Dataset 1 can be compared with the FIGO staging system in terms of both stratification and prediction. We indicated earlier that the two systems had a similar accuracy in survival prediction (C‐index 0.7391 for EACCD, C‐index 0.7371 for FIGO). Below we compare the two systems by examining how they stratify patients in Dataset 1.
In fact, there is a strong inter‐system association between FIGO staging and EACCD grouping. Table 2 presents the distribution of patients of each of 10 FIGO stages over the nine groups of the EACCD system on {T, N, M}. The upper right and lower left corners of the table are filled with 0. In general, the higher the stage group the patient has been assigned to by the FIGO system, the higher the risk group the patient is assigned to by the EACCD, and vice versa. In fact, the assignment to ordered stages and the assignment to ordered prognostic groups have a large Spearman's rank correlation coefficient of 0.9480 with a p value of 6.1 × 10⁻¹⁵. In summary, in predicting survival, the EACCD prognostic system and FIGO staging system using {T, N, M} have a comparable performance. In stratifying patients, the two systems were strongly positively associated. Therefore, the EACCD prognostic system presents an insightful validation of the FIGO staging system.
TABLE 2.
Contingency table between Ensemble Algorithm for Clustering Cancer Data (EACCD) grouping and International Federation of Gynecology and Obstetrics (FIGO) staging on the basis of T, N, M
| FIGO\EACCD | 1 | 2 | 3 | 4 | 5 | 6 | 7 | 8 | 9 | Total |
|---|---|---|---|---|---|---|---|---|---|---|
| IA | 8886 | 0 | 0 | 0 | 0 | 0 | 0 | 0 | 0 | 8886 |
| IB | 708 | 0 | 0 | 0 | 0 | 0 | 0 | 0 | 0 | 708 |
| IC | 0 | 5185 | 0 | 0 | 0 | 0 | 0 | 0 | 0 | 5185 |
| IIA | 0 | 0 | 1290 | 0 | 0 | 0 | 0 | 0 | 0 | 1290 |
| IIB | 0 | 0 | 1931 | 0 | 0 | 0 | 0 | 0 | 0 | 1931 |
| IIIA1 | 0 | 62 | 570 | 244 | 312 | 0 | 0 | 0 | 0 | 1188 |
| IIIA2 | 0 | 0 | 0 | 1034 | 146 | 0 | 0 | 0 | 0 | 1180 |
| IIIB | 0 | 0 | 0 | 0 | 1917 | 0 | 0 | 0 | 0 | 1917 |
| IIIC | 0 | 0 | 0 | 0 | 0 | 4237 | 8179 | 0 | 0 | 12 416 |
| IV | 0 | 0 | 0 | 0 | 0 | 0 | 0 | 2265 | 2548 | 4813 |
| Total | 9594 | 5247 | 3791 | 1278 | 2375 | 4237 | 8179 | 2265 | 2548 | 39 514 |
We can divide prognostic groups from the EACCD prognostic system into the low‐risk category (group 1–4) and high‐risk category (group 5–9) to inspect the effect of each individual factor's levels. Figure 5 summarizes the distribution of patients associated with a given discriminant factor level for the low‐risk and high‐risk categories. The 1st panel of Figure 5 shows that T1a/b/c and T2a/b are (almost) exclusively distributed in low‐risk categories. The distribution of patients with T3a/b in the low‐ and high‐risk categories is about the same. Patients with T3c are almost exclusively distributed in the high‐risk category. Therefore, the risk varies in the order T1a/b/c ≈ T2a/b < T3a/b < T3c. The 2nd, 3rd and 4th panels show approximately that patients with N0 or M0 or A0 status tend to fall into groups with more favorable survival, whereas those with N1 or M1 or A1 fall into groups with worse survival. Pathologic grade of EOC is conventionally based upon growth pattern, cytology or nuclear features. The EACCD approach permitted the impact of each histopathologic parameter to be isolated and individually evaluated, as shown in the 5th panel. It is seen that a vast majority of patients with Hm, He, Hls and Hcc are distributed in the low‐risk category, whereas a vast majority of patients with Hhs are distributed in the high‐risk category. Therefore, Hm, He, Hls and Hcc are more favorable than Hhs in terms of survival. This finding is in accordance with the current clinicopathologic paradigm of ovarian cancer classification.3, 6 In particular, it supports previous findings in Seidman et al,3 Grimley et al17 and Malpica et al.18 showing that, in general, low‐grade serous carcinoma has better outcome than high‐grade serous carcinoma. In summary, patients with any of the following levels tend to be considered low‐risk: T1a, T1b, T1c, T2a, T2b, Hm, He, Hls and Hcc, and those with any of the following levels tend to be considered high risk: T3c, N1, M1 and Hhs. Patients with any of the following levels fall into the boundary between the two categories: T3a, T3b, N0, M0, A0 and A1. Though these observations are known in the literature, it is the first time that these factor levels have been integrated together and spelled out explicitly in ordered risk categories of the prognostic system TNMAH created in this paper.
FIGURE 5.

Distributions of patients over risk categories. In each panel, one factor is concerned, and for each level of the factor, the distribution of patients in low‐ and high‐risk groups is presented in two ways: plot on the left and tabulation on the right
Cancer‐specific survival data were used in this study. Although the SEER cause‐specific death classification is determined by taking into account other elements (eg tumor sequence, site of the original cancer diagnosis, and comorbidities), death certificate errors can be problematic when estimating cause‐specific survival. Another limitation is that the EACCD requires a relatively large amount of data. This requirement ensures the robust estimates of survivals and robust estimates of the Gehan test statistic‐based effect sizes that were used in this study.24 In addition, about half of patients were removed in this study due to TX/NX/MX, which resulted in a huge reduction of the available data. A potentially better way to deal with TX/NX/MX might be by using all the data to generate prognostic systems that involve TX, NX and MX. This report includes combinations with at least 25 cases. This may exclude some “rare” but interesting combinations. Improved estimates of survival can be achieved with a larger cutoff. The impact of this requirement on the size of combinations will be minimized as more data become available. Finally, due to the current restriction of SEER data, we created our EACCD systems in light of levels of T, N, M that adapt to the previous versions of the AJCC system. The definitions of these levels have been slightly changed in the new FIGO system. As a result, we could not use the sublevels of M1, since the relevant information is not available in the SEER database.
5. CONCLUSION
We demonstrated that the EACCD prognostic system on T, N and M using the SEER ovarian carcinoma data, classifies patients in the way strongly positively correlated with the FIGO staging system and has a prediction accuracy in survival similar to FIGO. This provides a vigorous validation of the FIGO staging system. Using SEER, we created one computational prognostic system based on T, N, M, A and H, which expanded (with additional factors) and improved (with increased prediction accuracy) the FIGO staging system of ovarian cancers. Factors of age and histology were selected due to their established roles in the determination of EOC outcome.3, 4, 7, 29, 30 Studies29, 49, 50 have shown disparities by race in characteristics and outcomes among ovarian cancer patients. Therefore, it would be advantageous to integrate the factor race into any staging system by EACCD. With sufficient case data, other variables/factors, such as gene signatures, proteome or treatment effects, could be readily integrated by the EACCD to generate prognostic systems for refinements in patient stratification and patient outcome prediction that are needed for patient care, such as monitoring of large‐scale therapeutic trials.
CONFLICT OF INTEREST
None. The contents, views or opinions expressed in this publication or presentation are those of the authors and do not necessarily reflect official policy or position of Uniformed Services University of the Health Sciences, the Department of Defense (DoD) or Departments of the Army, Navy or Air Force. Mention of trade names, commercial products or organizations does not imply endorsement by the U.S. Government.
Supporting information
Table S1‐S3
Funding information
This work was partially supported by grants “Using Dendrograms to Create Prognostic Systems for Cancer” and “Creating Prognostic Systems for Cancer” sponsored by John P. Murtha Cancer Center Research Program and grant “Four Diamonds Fund from Penn State University” sponsored by Penn State University.
REFERENCES
- 1.Scully RE, Young RH, Clement PB. Tumors of the ovary, maldeveloped gonads, fallopian tube, and broad ligament. In: Rosai J, Sobin LH, eds. Atlas of Tumor Pathology, 3rd edn. Washington, DC: Armed Forces Institute of Pathology; 1998: 512. [Google Scholar]
- 2.Mitchell DG, Javitt MC, Glanc P, et al. ACR appropriateness criteria staging and follow‐up of ovarian cancer. J Am Coll Radiol. 2013;10:822‐827. [DOI] [PubMed] [Google Scholar]
- 3.Seidman JD, Vang R, Ronnett BM, Yemelyanova A, Cosin JA. Distribution and case‐fatality ratios by cell‐type for ovarian carcinomas: a 22‐year series of 562 patients with uniform current histological classification. Gynecol Oncol. 2015;136:336‐340. [DOI] [PubMed] [Google Scholar]
- 4.Gates MA, Rosner BA, Hecht JL, Tworoger SS. Risk factors for epithelial ovarian cancer by histologic subtype. Am J Epidemiol. 2009;171:45‐53. [DOI] [PMC free article] [PubMed] [Google Scholar]
- 5.Espinosa I, Catasus L, Canet B, D'angelo E, Muñoz J, Prat J. Gene expression analysis identifies two groups of ovarian high‐grade serous carcinomas with different prognosis. Mod Pathol. 2011;24:846‐854. [DOI] [PubMed] [Google Scholar]
- 6.Kurman RJ, Shih IM. Molecular pathogenesis and extraovarian origin of epithelial ovarian cancer––shifting the paradigm. Hum Pathol. 2011;42:918‐931. [DOI] [PMC free article] [PubMed] [Google Scholar]
- 7.Pearce CL, Templeman C, Rossing MA, et al. Association between endometriosis and risk of histological subtypes of ovarian cancer: a pooled analysis of case–control studies. Lancet Oncol. 2012;13:385‐394. [DOI] [PMC free article] [PubMed] [Google Scholar]
- 8.Verhaak RG, Tamayo P, Yang JY, et al. Prognostically relevant gene signatures of high‐grade serous ovarian carcinoma. J Clin Invest. 2013;123:517‐525. [DOI] [PMC free article] [PubMed] [Google Scholar]
- 9.Karnezis AN, Cho KR, Gilks CB, Pearce CL, Huntsman DG. The disparate origins of ovarian cancers: pathogenesis and prevention strategies. Nat Rev Cancer. 2017;17:65. [DOI] [PubMed] [Google Scholar]
- 10.Chan KK, Siu MK, Jiang YX, et al. Differential expression of estrogen receptor subtypes and variants in ovarian cancer: effects on cell invasion, proliferation and prognosis. BMC Cancer. 2017;17:606. [DOI] [PMC free article] [PubMed] [Google Scholar]
- 11.Bonome T, Lee JY, Park DC, et al. Expression profiling of serous low malignant potential, low‐grade, and high‐grade tumors of the ovary. Cancer Res. 2005;65:10602‐10612. [DOI] [PubMed] [Google Scholar]
- 12.Darcy KM, Brady WE, McBroom JW, et al. Associations between p53 overexpression and multiple measures of clinical outcome in high‐risk, early stage or suboptimally‐resected, advanced stage epithelial ovarian cancers: a Gynecologic Oncology Group study. Gynecol Oncol. 2008;111:487‐495. [DOI] [PMC free article] [PubMed] [Google Scholar]
- 13.Zhang H, Liu T, Zhang Z, et al. Integrated proteogenomic characterization of human high‐grade serous ovarian cancer. Cell. 2016;166:755‐765. [DOI] [PMC free article] [PubMed] [Google Scholar]
- 14.Halvorsen AR, Kristensen G, Embleton A, et al. Evaluation of prognostic and predictive significance of circulating MicroRNAs in ovarian cancer patients. Dis Markers. 2017;2017:3098542. [DOI] [PMC free article] [PubMed] [Google Scholar]
- 15.Prat J. FIGO Committee on Gynecologic Oncology. Staging classification for cancer of the ovary, fallopian tube, and peritoneum. Int J Gynecol Obstet. 2014;124:1‐5. [DOI] [PubMed] [Google Scholar]
- 16.Amin MB, Edge S, Greene F, et al. AJCC Cancer Staging Manual, 8th edn. Springer International Publishing; 2017. https://www.springer.com/gp/book/9783319406176. Accessed November 24, 2020. [Google Scholar]
- 17.Grimley PM, Matsuno RK, Rosenberg PS, Henson DE, Schwartz AM, Anderson WF. Qualitative age interactions between low‐grade and high‐grade serous ovarian carcinomas. Cancer Epidemiol Biomark Prev. 2009;18:2256‐2261. [DOI] [PubMed] [Google Scholar]
- 18.Malpica A. Grading of ovarian cancer: a histotype‐specific approach. Int J Gynecol Pathol. 2008;27:175‐181. [DOI] [PubMed] [Google Scholar]
- 19.Schmeler KM, Gershenson DM. Low‐grade serous ovarian cancer: a unique disease. Curr Oncol Rep. 2008;10:519‐523. [DOI] [PubMed] [Google Scholar]
- 20.Cancer Genome Atlas Research Network . Integrated genomic analyses of ovarian carcinoma. Nature. 2011;474:609. [DOI] [PMC free article] [PubMed] [Google Scholar]
- 21.Chen D, Xing K, Henson D, Sheng L, Schwartz AM, Cheng X. Developing prognostic systems of cancer patients by ensemble clustering. J Biomed Biotechnol. 2009;2009:632786. [DOI] [PMC free article] [PubMed] [Google Scholar]
- 22.Hueman MT, Wang H, Yang CQ, et al. Creating prognostic systems for cancer patients: a demonstration using breast cancer. Cancer Med. 2018;7:3611‐3621. [DOI] [PMC free article] [PubMed] [Google Scholar]
- 23.Wang H, Hueman M, Pan Q, et al. Creating Prognostic Systems by the Mann‐Whitney Parameter. In 2018 IEEE/ACM International Conference on Connected Health: Applications, Systems and Engineering Technologies (CHASE) 26 September 2018:33‐39. https://ieeexplore.ieee.org/abstract/document/8648686. Accessed November 24, 2020.
- 24.Yang C, Gardiner L, Wang H, Hueman M, Chen D. Creating prognostic systems for well differentiated thyroid cancer using machine learning. Front Endocrinol. 2019;10:288. [DOI] [PMC free article] [PubMed] [Google Scholar]
- 25.Hueman M, Wang H, Henson D, Chen D. Expanding the TNM for cancers of the colon and rectum using machine learning: a demonstration. ESMO Open. 2019;4:e000518. [DOI] [PMC free article] [PubMed] [Google Scholar]
- 26.Surveillance, Epidemiology, and End Results (SEER) Program (www.seer.cancer.gov) Research Data (2000‐2017) , National Cancer Institute, DCCPS, Surveillance Research Program, released April 2020, based on the November 2019. submission. Available from: https://seer.cancer.gov/ (cited 24 November 2020).
- 27.SEER Cause‐specific Death Classification . Available online at: https://seer.cancer.gov/causespecific (accessed 24 November 2020).
- 28.SEER Research Data Record Description . Available online at. https://seer.cancer.gov/data‐software/documentation/seerstat/nov2019/TextData.FileDescription.pdf (accessed 24 November 2020).
- 29.Torre LA, Trabert B, DeSantis CE, et al. Ovarian cancer statistics, 2018. CA Cancer J Clin. 2018;68:284‐296. [DOI] [PMC free article] [PubMed] [Google Scholar]
- 30.Tingulstad S, Skjeldestad FE, Halvorsen TB, Hagen B. Survival and prognostic factors in patients with ovarian cancer. Obstet Gynecol. 2003;101:885‐891. [DOI] [PubMed] [Google Scholar]
- 31.Fritz A, Percy C, Jack A, et al. International Classification of Diseases for Oncology, (ICD‐O), 3rd edn. Geneva: World Health Organization; 2013. https://apps.who.int/iris/bitstream/handle/10665/96612/9789241548496_eng.pdf. Accessed 24 November, 2020. [Google Scholar]
- 32.Shimizu Y, Kamoi S, Amada S, Akiyama F, Silverberg SG. Toward the development of a universal grading system for ovarian epithelial carcinoma: testing of a proposed system in a series of 461 patients with uniform treatment and follow‐up. Cancer. 1998;82:893‐901. [DOI] [PubMed] [Google Scholar]
- 33.Köbel M, Kalloger SE, Baker PM, et al. Diagnosis of ovarian carcinoma cell type is highly reproducible: a transcanadian study. Am J Surg Pathol. 2010;34:984‐993. [DOI] [PubMed] [Google Scholar]
- 34.Edge SB, Byrd DR, Compton CC, Fritz AG, Greene FL, Trotti A. AJCC Cancer Staging Manual, 7th edn. New York: Springer‐Verlag; 2010. https://cancerstaging.org/references‐tools/deskreferences/Documents/AJCC%207th%20Ed%20Cancer%20Staging%20Manual.pdf. Accessed 24 November, 2020. [Google Scholar]
- 35.Saida T, Tanaka YO, Matsumoto K, Satoh T, Yoshikawa H, Minami M. Revised FIGO staging system for cancer of the ovary, fallopian tube, and peritoneum: important implications for radiologists. Japan J Radiol. 2016;34:117‐124. [DOI] [PubMed] [Google Scholar]
- 36.Wu D, Yang C, Wong S, Meyerle J, Zhang B, Chen D. An examination of TNM staging of melanoma by a machine learning algorithm. In 2012 International Conference on Computerized Healthcare (ICCH) 17 December 2012; pp. 120‐126. https://ieeexplore.ieee.org/abstract/document/6724482. Accessed 24 November, 2020.
- 37.Qi R, Wu D, Sheng L, et al. On an ensemble algorithm for clustering cancer patient data. BMC Syst Biol. 2017:S9. 10.1186/1752-0509-7-S4-S9 [DOI] [PMC free article] [PubMed] [Google Scholar]
- 38.Chen D, Hueman MT, Henson DE, Schwartz AM. An algorithm for expanding the TNM staging system. Future Oncol. 2016;12:1015‐1024. [DOI] [PubMed] [Google Scholar]
- 39.Chen D, Wang H, Sheng L, et al. An algorithm for creating prognostic systems for cancer. J Med Syst. 2016;40:160. [DOI] [PubMed] [Google Scholar]
- 40.Wang H, Chen D, Hueman MT, Sheng L, Henson DE. Clustering big cancer data by effect sizes. In 2017 IEEE/ACM International Conference on Connected Health: Applications, Systems and Engineering Technologies (CHASE). 17 July 2017; pp. 58‐63. https://ieeexplore.ieee.org/abstract/document/8010615. Accessed 24 Novembere, 2020.
- 41.Wang H. Development of Prognostic Systems for Cancer Patients. The George Washington University; 2020. Doctoral dissertation. https://search.proquest.com/openview/3addd97db64a77ddab4b1ceca94b44ec/1?pq‐origsite=gscholar&cbl=18750&diss=y
- 42.Praiss AM, Huang Y, Clair CM, et al. Using machine learning to create prognostic systems for endometrial cancer. Gynecol Oncol. 2020;159:744‐750. [DOI] [PubMed] [Google Scholar]
- 43.Harrell FE, Lee KL, Mark DB. Multivariable prognostic models: issues in developing models, evaluating assumptions and adequacy, and measuring and reducing errors. Stat Med. 1996;15:361‐387. [DOI] [PubMed] [Google Scholar]
- 44.Kaplan EL, Meier P. Nonparametric estimation from incomplete observations. J Am Stat Assoc. 1958;53:457‐481. [Google Scholar]
- 45.Kang L, Chen W, Petrick NA, Gallas BD. Comparing two correlated C indices with right‐censored survival outcome: a one‐shot nonparametric approach. Stat Med. 2015;34:685‐703. [DOI] [PMC free article] [PubMed] [Google Scholar]
- 46.Sobin LH, Gospodarowicz MK, Wittekind C, eds. TNM Classification of Malignant Tumours. 7th edn. Hoboken, NJ: Wiley‐Blackwell; 2009. http://www.inen.sld.pe/portal/documentos/pdf/educacion/13072015_TNM%20Classification.pdf [Google Scholar]
- 47.Barlin JN, Yu C, Hill EK, et al. Nomogram for predicting 5‐year disease‐specific mortality after primary surgery for epithelial ovarian cancer. Gynecol Oncol. 2012;125:25‐30. [DOI] [PubMed] [Google Scholar]
- 48.Xu XL, Cheng H, Tang MS, et al. A novel nomogram based on LODDS to predict the prognosis of epithelial ovarian cancer. Oncotarget. 2017;8:8120‐8130. [DOI] [PMC free article] [PubMed] [Google Scholar]
- 49.Zeng C, Wen W, Morgans AK, Pao W, Shu XO, Zheng W. Disparities by race, age, and sex in the improvement of survival for major cancers: results from the National Cancer Institute Surveillance, Epidemiology, and End Results (SEER) Program in the United States, 1990 to 2010. JAMA Oncol. 2015;1:88‐96. [DOI] [PMC free article] [PubMed] [Google Scholar]
- 50.Bristow RE, Powell MA, Al‐Hammadi N, et al. Disparities in ovarian cancer care quality and survival according to race and socioeconomic status. J Natl Cancer Inst. 2013;105:823‐832. [DOI] [PMC free article] [PubMed] [Google Scholar]
Associated Data
This section collects any data citations, data availability statements, or supplementary materials included in this article.
Supplementary Materials
Table S1‐S3