

Abstract
FK506‐binding proteins (FKBPs) are promising targets for a variety of disorders and infectious diseases. High FKBP occupancy is thought to be necessary for ligands to effectively compete with the endogenous intracellular functions of FKBPs. Here, we report the development of NanoBRET assays for the most prominent cytosolic FKBPs, FKBP12, 12.6, 51 and 52. These assays allowed rapid profiling of FKBP ligands for target engagement and selectivity in living cells. These assays confirmed the selectivity of SAFit‐type ligands for FKBP51 over FKBP52 but revealed a substantial offset for the intracellular activity of these ligands compared to bicyclic ligands or natural products. Our results stress the importance to control for intracellular FKBP occupancy and provide the assays to guide further FKBP ligand optimization.
Keywords: Immunophilin, luminescence, NanoBRET, receptor occupancy, target engagement
Intracellular inhibition insights: NanoBRET assays were developed to measure target engagement of cytosolic FK506‐binding proteins, confirming selectivities and revealing permeation issues of FKBP ligands.

FK506‐binding proteins (FKBPs) are key intracellular co‐receptors for the natural products FK506 and Rapamycin[1] as well as for recently discovered molecular glues.[2] Moreover, several members of the FKBP family have been suggested to play key roles in diseases such as pulmonary arterial hypertension, hereditary haemorrhagic telangiectasia, wound healing, depression, obesity, chronic pain, as well as bacterial and parasitic infections.[3] Most of the pharmacologically relevant human FKBPs like FKBP12, 12.6, 51 and 52 are localized in the cytosol, where they participate in regulatory protein‐protein interaction exemplified by the FKBP12/12.6‐ryanodine receptor[4] FKBP12‐ALK[5] or FKBP51/52‐Hsp90‐steroid receptor complexes.[6] Several high‐affinity FKBP ligands have been developed.[7] However, little is known to what extent these ligands occupy FKBPs or on the degree of occupancy needed to evoke biological effects. A recent study on irreversible ligands for FKBP35 of Plasmodium falciparum showed that intracellular activities of FKBP ligands may be substantially weaker than biochemical affinities and do not necessarily correlate with the latter.[8] Here, we report competitive NanoBRET assays[9] for human FKBP12, FKBP12.6, FKBP51 and FKBP52 for rapid profiling of target engagement of FKBP ligands in living cells.
Our work started with the identification of cell‐permeable fluorescent tracers suitable as NanoBRET acceptors. While this work was in progress, a NanoBRET assay for FKBP12 and FKBP35 from Plasmodium falciparum was published,[8] which used a Rapamycin‐derived tracer. Since we had observed solubility issues at higher tracer concentrations with a Rapamycin‐derived fluorescence tracer,[10] (and unpublished results) we here opted for a bicyclic [4.3.1] sulfonamide scaffold, for which preliminary cell permeability data were available. Further benefits of the chosen bicyclic [4.3.1] sulfonamides[11, 12] as starting scaffold are the lack of immunosuppressive properties, their pan‐selectivity within the FKBP family, which is desirable for broadly applicable tracers, and the presence of three well‐defined exit vectors to allow for the introduction of fluorophores. Specifically, the alkynes 1 a‐c were chosen as starting points and conjugated to an azide‐containing BODIPY590, via copper‐catalysed cycloaddition (Figure 1).
Figure 1.

Synthesis of the tracers 2 a–c by conjugation of the NanoBRETTM 590‐azide‐C3 fluorophore to three different bicyclic [4.3.1] sulfonamide ligands (Reagents and conditions: CuSO4, Na‐ascorbate, DMSO/tert‐BuOH/H2O, 37 °C, 24 h).
The resulting fluorescent conjugates 2 a–c were tested in a fluorescence polarization assay[10] and bound to purified FKBPs with moderate (FKBP51/52) to high affinity (FKBP12/12.6, Figure S1). Tracer 2 a bound substantially weaker to FKBPs, especially towards FKBP51 and FKBP52 with K D values of 228±39 nM and 669±99 nM, respectively, compared to the known TAMRA‐containing tracer 16 g, which has affinities towards FKBPs between 0.57 nM and 13.8 nM.[12] The affinities of 2 b and 2 c however were in line with affinities of the closest known analogues.[12]
To explore the intracellular interaction of the tracers with the most prominent FKBPs, we generated a set of mammalian expression constructs harbouring FKBP12, FKBP12.6, FKBP51[13] or FKBP52[14] N‐ or C‐terminally fused to a Nano‐luciferase. All constructs were active and produced luminescence signals after transient transfection (Figure S2). However, the luminescence signals were more robust for the C‐terminal fusion constructs, which were thus pursued for further NanoBRET experiments. When transiently transfected in HEK293T cells, all C‐terminal constructs generated dose‐dependent BRET signals after titration with the tracers 2 a–c (Figures S3–6 and Table S1). After optimizing for cell density, transfection levels and incubation time, tracer 2 a or 2 b were found to provide the best results for FKBP12 and 12.6, while tracer 2 c was more suitable for FKBP51 and FKBP52. Pilot experiments showed that the identified construct tracer combinations were sensitive to the prototypical FKBP ligands FK506 and Rapamycin and suitable to quantify intracellular binding in a competitive NanoBRET setup (Figure 2).
Figure 2.
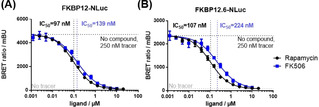
Competitive NanoBRET assay for Rapamycin and FK506 with HEK293T cells transiently expressing FKBP12‐NLuc (A) or FKBP12.6‐NLuc (B). Experiments were performed in three independent cellular assays for all samples.
The experiments with transiently expressed NanoBRET constructs showed substantial batch‐to‐batch variation. Therefore, we generated HEK293T cell lines stably expressing FKBP12/12.6/51 or 52 C‐terminally fused to Nano‐luciferase. The best selected cell lines displayed a robust, dose‐dependent increase in BRET ratios upon incubation with their preferred tracers (Figure 3). Half‐maximal stimulation (EC50) was observed at concentrations in agreement with the biochemical affinities of the tracers, except for FKBP52‐NLuc, which consistently engaged tracer 2 c with exceptionally high potency. The signal‐to‐noise ratio was excellent for FBKP12, 12.6 and 52 and acceptable for FKBP51.
Figure 3.

Tracer titrations for stable FKBP‐NLuc cell lines. HEK293T cells stably expressing the indicated FKBPs‐NLuc constructs were treated with tracers 2 b or 2 c at serially diluted concentrations for 2 h at 37 °C. BRET measurements were performed by detecting emission light intensity at 450 nm and 660 nm. Mean BRET ratios and standard deviations were calculated from three independent cellular assays. EC50 values were determined by a four‐parameter fit. K D values represent the affinity of the tracer to the indicated purified FKBP determined by fluorescence polarization.
With robust NanoBRET assays for the major cytosolic FKBPs in hand, we set out to profile representative FKBP ligands for intracellular FKBP occupancy. Matrix titrations with one of the most potent FKBP ligand 3 (Figure 6, named FK[4.3.1]‐16h in Pomplun et al.)[12, 15] clearly showed that this ligand bound competitively inside cells to FKBP12, 12.6, 51 and 52 (Figure 4, structures of the compounds used are shown in Figure 6).
Figure 6.

Structures of FKBP‐ligands tested in this work. In brackets: ligand names as stated in the original publications.[12, 17, 19]
Figure 4.

Intracellular FKBP‐NLuc engagement of compound 3 (FK[4.3.1]‐16h) determined by competitive NanoBRET assays. HEK293T cells stably expressing the indicated FKBP‐NLuc constructs were treated with increasing concentrations of 3 (FK[4.3.1]‐16h) in the presence of varying concentrations of the NanoBRET tracer (2 b in (A) & (B), 2 c in (C) & (D)), as shown in the upper panels. Each curve was fitted to determine an IC50, which was plotted in the lower panels in dependence of the tracer concentration to determine the K i,app by Cheng‐Prusoff analysis.[16]
The matrix titrations also defined plausible tracer concentrations suitable for further competition experiments. With these conditions in hand, we profiled representative FKBP ligands, including the FKBP51‐selective ligands SAFit1 and SAFit2[17] as well as the natural products FK506 and Rapamycin (Figure 5A and Figure S7). Generally, the IC50 values for FKBP51 were higher, likely due to the higher tracer concentration, which was necessary due to the lower assay window. Comparison of the target engagement of Rapamycin towards the luciferase‐labelled FKBP12 with previously published results[8] showed that in spite of the different assay conditions (e. g., tracer affinity and concentration) the obtained IC50 values (20 nM[8] and 8.5 nM, this work) were remarkably similar. In light of the results by Atack et al., we conclude that the Rapamycin‐based tracer as well as our bicyclic [4.3.1] sulfonamide‐based tracers are useful.
Figure 5.

Profiling of representative FKBP ligands by competitive NanoBRET assays. (A) HEK293T cells stably over‐expressing FKBP12‐NLuc were treated with various FKBP ligands in the presence of 20 nM of tracer 2 b. (B) HEK293T cells stably over‐expressing FKBP51‐NLuc were treated with various FKBP ligands in the presence of 200 nM of tracer 2 c. Data points represent means±standard deviation from three independent cellular assays per concentration. Tables: Summary of the results obtained for different FKBPs. (a) compound numbers and K D values were taken from Ponplum et al.,[12] (b) compound numbers and K D values were taken from Voll et al.,[19] (c) K D values were taken from Gaali et al.,[17] (d) K D values were taken from Kozany et al.,[10] (e) K D values were determined by fluorescence polarisation assay.[12]
From a comparative analysis of the data, several conclusions can be extracted. First, the natural products FK506 and Rapamycin, as well as the non‐immunosuppressive smaller bicycles 3 (FK[4.3.1]‐16h) and 4 (Figure 6; named FK[4.3.1]‐16j in Pomplun et al.), are highly effective at occupying FKBPs inside cells. Second, 4 (FK[4.3.1]‐16j) is always more potent than 3 (FK[4.3.1]‐16h), possibly reflecting the higher affinity of the former. Third, SAFit1 and SAFit2 are highly selective for FKBP51 over FKBP52 (a key unique property of SAFit‐type ligands) and moderately selective over FKBP12. Fourth, SAFit2 retains potency for FKBP12.6 and is equipotent to Rapamycin and 4 (FK[4.3.1]‐16j) for FKBP51, in line with the biochemical affinity profile. Finally, SAFit1 was substantially less potent than the closely related SAFit2, which may reflect reduced cellular permeability or active efflux of the former. Indeed, the cell permeability (A→B) of SAFit1 was 10 times lower in a standard Caco2 assay (Eurofins) compared to SAFit2. We previously observed poor cell permeability and strong efflux ratio (B−A/A−B>10) for SAFit1 in Caco2 assay (not shown). To test if P‐gp‐mediated active efflux contributed to the reduced BRET activity of SAFit1 assay we performed a NanoBRET experiment in the presence or absence of the P‐gp inhibitor Elacridar (Figure S9). However, Elacridar did not affect the NanoBRET activities of 3 (FK[4.3.1]‐16h), SAFit1, SAFit2 or FK506 (the latter had been described as a P‐gp substrate[18]), suggesting that our NanoBRET assay is not affected by P‐gp. Taken together, these results suggest that 3 (FK[4.3.1]‐16h) and 4 (FK[4.3.1]‐16j) (and SAFit2 for FKBP51) are valid non‐immunosuppressive tools to probe the role of FKBPs inside living cells.
To further explore the scope of the established NanoBRET assays, we applied them to a recently discovered class of macrocyclic SAFit analogues (Figure 6) that are highly selective for FKBP51 over FKBP12.[19] This experiment confirmed the intracellular potencies of SAFit1 and SAFit2 for FKBP12 and FKBP51 (Figure 5B and Figure S8). Importantly, the macrocyclic SAFit analogues all occupied intracellular FKBP51, with potencies reflecting their relative biochemical affinities, whereas none of them were active for FKBP12. This is consistent with preliminary findings from NanoBRET assays using transiently expressed FKBP‐NLuc constructs.[19]
Taken together, we developed a set of NanoBRET assays for the most prominent human FKBPs. High‐quality tracers that have high target affinity, high cell permeability and low non‐specific binding were key to obtain high signal‐to‐noise ratios. Stable cell lines proved critical to reduce inter‐assay variability. With these assays, we profiled some of the most widely used FKBP ligands reported in the literature. We demonstrated the high intracellular activity of the natural products FK506 and Rapamycin as well as of ligands with the bicyclic [4.3.1] scaffold. We also confirmed the biochemical selectivity of SAFit‐like ligands inside cells. However, compared to the natural products or [4.3.1] bicycles, compounds of the SAFit class, especially SAFit1, had reduced intracellular potency, pointing to the need to regularly control for intracellular activity. The here developed assays will be important for the profiling of FKBP ligands and a valuable tool to guide drug discovery directed at FKBPs.
Experimental Section
Competitive NanoBRET assay
The NanoBRET assays described here are based on previously published work[9] and modified as described below.
The fluorescent ligands 2 b or 2 c were dissolved in Opti‐MEM I Reduced Serum Media at the eightfold concentration required for the final sample. For the target engagement matrix different final tracer concentrations were chosen. HEK293T cells expressing the FKBP‐NanoLuc fusion protein were detached from the culture dish and resuspended in Opti‐MEM I Reduced Serum Media. The cell number was adjusted to 4.6×10⁵ cells/mL using transiently transfected cells or to 1.81×10⁶ cells/mL using the stable FKBP‐NanoLuc cell line. A cell‐tracer mixture was prepared mixing one part of the tracer stock solution with three parts of the cell suspension (e. g. 500 μL tracer stock solution +1500 μL cell suspension). Test ligands were dissolved in DMSO at thousand fold the concentration required for the final sample. This ligand stock was used to prepare a 1 : 2 serial dilution in DMSO. Each dilution was then diluted with Opti‐MEM I Reduced Serum Media to generate a ligand dilution series with double the concentration required for the final sample. To a white non‐binding 384‐well assay plate (No.: 3574; Corning Life Sciences B.V., Schiphol‐Rijk, Netherlands) 20 μL of cell‐tracer mixture and 20 μL of test compound solution were added and the plate was incubated at 37 °C for two hours. Afterwards, the plate was equilibrated at room temperature for 15 minutes. For BRET detection the Intracellular NanoGlo® Substrate/Inhibitor kit (No.:N2160; Promega) was used diluting the NanoBRETTM NanoGlo® Substrate 1: 664 and the extracellular NanoLuc® inhibitor 1 : 2000 in Opti‐MEM I Reduced Serum Media. 20 μL of the detection solution was added per well and the plate was incubated for three minutes at room temperature. The donor emission was measured at 450 nM and the acceptor emission at 660 nM using a ClarioStar plate reader (BMG Labtech, Ortenberg, Germany) or a Tecan Spark (Cailsheim, Germany). The BRET ratio was calculated as shown in the supplementary information. K i,app and K D,app values were determined with the following formula.
Conflict of interest
The authors declare no conflict of interest.
Supporting information
As a service to our authors and readers, this journal provides supporting information supplied by the authors. Such materials are peer reviewed and may be re‐organized for online delivery, but are not copy‐edited or typeset. Technical support issues arising from supporting information (other than missing files) should be addressed to the authors.
Supplementary
Acknowledgements
This work was supported by the BMBF grants iMIP (16GW0211K) and 51TaValP (16GW0290K), the DFG grant (HA‐5655‐5/1) and the LOEWE cluster TRABITA. Open access funding enabled and organized by Projekt DEAL.
M. T. Gnatzy, T. M. Geiger, A. Kuehn, N. Gutfreund, M. Walz, J. M. Kolos, F. Hausch, ChemBioChem 2021, 22, 2257.
References
- 1.
- 1a.Sinars C. R., Cheung-Flynn J., Rimerman R. A., Scammell J. G., Smith D. F., Clardy J., Proc. Natl. Acad. Sci. USA. 2003, 100, 868–873; [DOI] [PMC free article] [PubMed] [Google Scholar]
- 1b.Kozany C., März A., Kress C., Hausch F., ChemBioChem 2009, 10, 1402–1410. [DOI] [PubMed] [Google Scholar]
- 2.
- 2a.Deshaies R. J., Nature 2020, 580, 329–338; [DOI] [PubMed] [Google Scholar]
- 2b.Guo Z., Hong S. Y., Wang J., Rehan S., Liu W., Peng H., Das M., Li W., Bhat S., Peiffer B., Nat. Chem. 2019, 11, 254–263; [DOI] [PMC free article] [PubMed] [Google Scholar]
- 2c.Guo Z., Cheng Z., Wang J., Liu W., Peng H., Wang Y., Rao A. S., Li R., Ying X., Korangath P., Angew. Chem. 2019, 131, 17318–17322; [Google Scholar]
- 2d.Shigdel U. K., Lee S.-J., Sowa M. E., Bowman B. R., Robison K., Zhou M., Pua K. H., Stiles D. T., Blodgett J. A. V., Udwary D. W., Proc. Natl. Acad. Sci. USA 2020, 117, 17195–17203; [DOI] [PMC free article] [PubMed] [Google Scholar]
- 2e.Flaxman H. A., Chang C.-F., Wu H.-Y., Nakamoto C. H., Woo C. M., J. Am. Chem. Soc. 2019, 141, 11759–11764; [DOI] [PubMed] [Google Scholar]
- 2f.Zhang Z., Shokat K. M., Angew. Chem. 2019, 131, 16460–16465. [Google Scholar]
- 3.Kolos J. M., Voll A. M., Bauder M., Hausch F., Front. Pharmacol. 2018, 9, 1425. [DOI] [PMC free article] [PubMed] [Google Scholar]
- 4.
- 4a.Yan Z., Bai X., Yan C., Wu J., Li Z., Xie T., Peng W., Yin C., Li X., Scheres S. H. W., Nature 2015, 517, 50–55; [DOI] [PMC free article] [PubMed] [Google Scholar]
- 4b.Des Georges A., Clarke O. B., Zalk R., Yuan Q., Condon K. J., Grassucci R. A., Hendrickson W. A., Marks A. R., Frank J., Cell 2016, 167, 145–157. e17. [DOI] [PMC free article] [PubMed] [Google Scholar]
- 5.Chaikuad A., Alfano I., Kerr G., Sanvitale C. E., Boergermann J. H., Triffitt J. T., von Delft F., Knapp S., Knaus P., Bullock A. N., J. Biol. Chem. 2012, 287, 36990–36998. [DOI] [PMC free article] [PubMed] [Google Scholar]
- 6.Hähle A., Merz S., Meyners C., Hausch F., Biomolecules 2019, 9, 35. [DOI] [PMC free article] [PubMed] [Google Scholar]
- 7.
- 7a.Feng X., Pomplun S., Hausch F., Curr. Mol. Pharmacol. 2016, 9, 27–36; [DOI] [PubMed] [Google Scholar]
- 7b.Dunyak B. M., Gestwicki J. E., J. Med. Chem. 2016, 59, 9622–9644; [DOI] [PMC free article] [PubMed] [Google Scholar]
- 7c.Gaali S., Gopalakrishnan R., Wang Y., Kozany C., Hausch F., Curr. Med. Chem. 2011, 18, 5355–5379. [DOI] [PubMed] [Google Scholar]
- 8.Atack T. C., Raymond D. D., Blomquist C. A., Pasaje C. F., McCarren P. R., Moroco J., Befekadu H. B., Robinson F. P., Pal D., Esherick L. Y., ACS Med. Chem. Lett. 2020, 11, 2131–2138. [DOI] [PMC free article] [PubMed] [Google Scholar]
- 9.Robers M. B., Vasta J. D., Corona C. R., Ohana R. F., Hurst R., Jhala M. A., Comess K. M., Wood K. V., Systems Chemical Biology, Springer, 2019. [Google Scholar]
- 10.Kozany C., März A., Kress C., Hausch F., ChemBioChem 2009, 10, 1402–1410. [DOI] [PubMed] [Google Scholar]
- 11.
- 11a.Pomplun S., Wang Y., Kirschner A., Kozany C., Bracher A., Hausch F., Angew. Chem. Int. Ed. 2015, 54, 345–348; [DOI] [PubMed] [Google Scholar]; Angew. Chem. 2015, 127, 352–348; [Google Scholar]
- 11b.Wang Y., Kirschner A., Fabian A.-K., Gopalakrishnan R., Kress C., Hoogeland B., Koch U., Kozany C., Bracher A., Hausch F., J. Med. Chem. 2013, 56, 3922–3935. [DOI] [PubMed] [Google Scholar]
- 12.Pomplun S., Sippel C., Hähle A., Tay D., Shima K., Klages A., Ünal C. M., Rieß B., Toh H. T., Hansen G., J. Med. Chem. 2018, 61, 3660–3673. [DOI] [PubMed] [Google Scholar]
- 13.Bracher A., Kozany C., Thost A.-K., Hausch F., Acta Crystallogr. Sect. D 2011, 67, 549–559. [DOI] [PubMed] [Google Scholar]
- 14.Bracher A., Kozany C., Hähle A., Wild P., Zacharias M., Hausch F., J. Mol. Biol. 2013, 425, 4134–4144. [DOI] [PubMed] [Google Scholar]
- 15.Jagtap P. K. A., Asami S., Sippel C., Kaila V. R. I., Hausch F., Sattler M., Angew. Chem. 2019, 131, 9529–9533. [Google Scholar]
- 16.Cheng Y., Prusoff W., Biochem. Pharmacol. 1973, 22, 3099–3108. [DOI] [PubMed] [Google Scholar]
- 17.Gaali S., Kirschner A., Cuboni S., Hartmann J., Kozany C., Balsevich G., Namendorf C., Fernandez-Vizarra P., Sippel C., Zannas A. S., Nat. Chem. Biol. 2015, 11, 33–37. [DOI] [PubMed] [Google Scholar]
- 18.Saeki T., Ueda K., Tanigawara Y., Hori R., Komano T., J. Biol. Chem. 1993, 268, 6077–6080. [PubMed] [Google Scholar]
- 19.Voll A. M., Meyners C., Taubert M. C., Bajaj T., Heymann T., Merz S., Charalampidou A., Kolos J., Purder P. L., Geiger T. M., Angew. Chem. Int. Ed. 2021, 10.1002/anie.202017352. [DOI] [PMC free article] [PubMed] [Google Scholar]
Associated Data
This section collects any data citations, data availability statements, or supplementary materials included in this article.
Supplementary Materials
As a service to our authors and readers, this journal provides supporting information supplied by the authors. Such materials are peer reviewed and may be re‐organized for online delivery, but are not copy‐edited or typeset. Technical support issues arising from supporting information (other than missing files) should be addressed to the authors.
Supplementary