Abstract
To determine the differences in intestinal flora between Uygur and Han patients with ulcerative colitis (UC).
Microbial diversity and structural composition of fecal bacteria from patients with UC and their matched healthy spouses or first-degree relatives were analyzed using high-throughput sequencing technology.
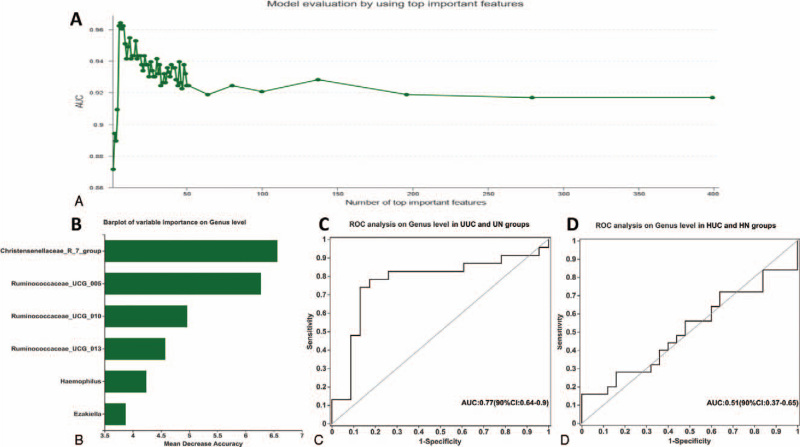
The fecal microbial diversity and abundance index of Uygur patients with UC (UUC) were significantly lower compared with the Uygur normal control group, while there was no significant difference between the Han UC patients (HUC) and the Han normal control group (HN). Compared with their respective control groups, Uygur UC patients and Han UC patients had a different main composition of human intestinal flora (P < .05). The abundance of Burkholderia, Caballeronia, Paraburkholderia in the UUC group were higher compared with the HUC group, while Faecalibacterium, Bifidobacterium, and Blautia in the HUC group were higher than those in the UUC group (P < .05). Veillonella in the UUC group was higher than that in the Uygur normal control group group, while Subdoligranulum and Ruminococcaceae_UCG-002 were significantly lower (P < .05). Prevotella_9 in the HUC group was significantly higher than that in HN group, while Blautia, Anaerostipes, and [Eubacterium]_hallii_group were significantly lower. Moreover, the top 6 species in order of importance were Christensenellaceae_R_7_group, Ruminococcae_ucg_005, Ruminococcae_ucg_010, Ruminococcae_ucg_013, Haemophilus, and Ezakiella.
The difference in intestinal microflora structure may be one of the reasons for the clinical heterogeneity between Uygur and Han patients with UC. Christensenellaceae_R_7_group, Ruminococcae_ucg_005, Ruminococcae_ucg_010, Ruminococcae_ucg_013, Haemophilus, and Ezakiella could be used as potential biomarkers for predicting UC.
Keywords: dysbacteriosis, ethnic group, gut microflora, microbial diversity, ulcerative colitis
1. Introduction
Ulcerative colitis (UC) is a chronic non-specific inflammatory bowel disease and a common gastrointestinal disease in China. The incidence has gradually increased over recent years.[1,2] However, its pathogenesis has not been fully elucidated. It is generally believed that the pathogenesis of UC is related to genetic factors, immune disorders of the intestinal mucosa, as well as changes in the intestinal microecological environment, and other factors. Over recent years, an increasing number of studies have shown that the gut microbiota in the colon and their metabolites are important factors implicated in the pathogenesis of UC.[2] The change of intestinal flora and the chronic inflammatory response caused by intestinal mucosal immune dysfunction may cause UC.[3,4] However, the specific pattern of intestinal flora imbalance involved in the occurrence of UC is still unclear. Previous studies have found that the gut microbiota is dysregulated in Inflammatory Bowel Disease (IBD), which leads to the modification of the bacterial metabolic activity.[5] Vigsnaes et al[6] have also found a decrease in the number of lactic acid-producing bacteria in UC patients’ gut.
Epidemiological studies have shown that UC incidence varies by region and ethnicity. The highest annual incidence of UC has been observed in Europe (24.3 per 100,000 person-years) followed by Asia and the Middle East (6.3 per 100,000 person-years). The highest incidence has been observed in Jewish people (3–5 times higher than that of non-Jewish people).[7,8] Previously, we compared the clinical characteristics of the Uyghur and Han populations with UC who reside in the Xinjiang of China, finding a higher endoscopic detection rate of UC, a younger age of onset, and increased prevalence of chronic persistent and acute outbreak types, more extraintestinal manifestations, more severe manifestations of the disease as well as higher complication rates that in Uyghur patients.[9] Moreover, we also found that the positive rate of anti-neutrophil cytoplasmic antibody in Uygur patients with UC was significantly higher compared with Han UC patients (P = .026), and that anti-neutrophil cytoplasmic antibody positivity was associated with an increased frequency of HLA-DRB1∗13 in Uyghur UC patients. However, the HLA-DRB1∗08 gene frequency was lower in the UC patients than in the control group (P = .012, Odds Ratio 0.12, 95% Confidenceinterval (CI) 0.02–0.91). In Han patients with UC, there was no significant difference in HLA-DRB1 frequency between UC patients and healthy controls.[10,11] In addition, we have also confirmed that the fucosyltransferase 2 (FUT2) variant rs281377 was significantly associated with UC in the Han population as compared with the controls (P = .011) while rs281377 was not associated with UC in the Uyghur population (P = .06).[12]
Xinjiang is a multi-ethnic gathering place, where each ethnic group has different genetic characteristics, living, and eating habits. Xinjiang Uyghur populations like high-fat diets; meat and dairy products account for a larger proportion of the diet structure. The etiology of UC is multifactorial. It is well known that differences in dietary structure and genetic background may cause differences in the intestinal flora. Therefore, the change of intestinal flora may be one of the reasons for the clinical heterogeneity of UC in Uyghur and Han patients in China.
In this study, 16S rRNA sequencing was used to study the difference of intestinal microflora between Uyghur and Han patients with UC and their relatives. These data may further the understanding of the fecal microbial diversity in UC patients.
2. Materials and methods
2.1. Participants
Uyghur and Han patients (aged ≥18 years) who were initially diagnosed with UC in the Gastroenterology Department of People's Hospital of Xinjiang Uyghur Autonomous Region from January 2019 to December 2019 were recruited in this study. Besides, matched healthy relatives from the same living environment were included as a control group: the age-matched spouse who lived together for >1 year or healthy siblings with similar age, the same sex, with no autoimmune disease or genetic disease. Inclusion criteria for all participants were: no use of antibiotics or probiotics for the last 3 months before sampling; no special discomfort in physical condition compared with usual times; women should not take samples during menstrual period. Stool samples were collected from all participants on the same day. The diagnostic criteria for UC were based on a combination of clinical presentations, endoscopic features, and pathologic findings according to the Lennard-Jones criteria[13] (infectious and malignant etiologies were excluded).
The study protocol was approved by the Institutional Ethics Committee of People's Hospital of Xinjiang Uyghur Autonomous Region. Each participant provided written informed consent and received no financial compensation or gifts.
2.2. 16S rRNA sequencing
Fecal samples were collected from all participants. Upon collection, fecal samples were immediately snap-frozen in liquid nitrogen and then kept at −80 °C. DNA was extracted from stool samples (200 mg) using the E.Z.N.A. soil DNA Kit (Omega Bio-tek, Norcross, GA) following the manufacturer's instructions. DNA concentration and purity were determined with NanoDrop 2000 UV-vis spectrophotometer (Thermo Scientific, Wilmington, NC). The V3-V4 hypervariable regions of the bacteria 16S rRNA gene were amplified with primer pairs 338F (5′-ACTCCTACGGGAGGCAGCAG-3′) and 806R (5′-GGACTACHVGGGTWTCTAAT-3′) by an ABI GeneAmp 9700 PCR thermocycler (ABI, CA). Purified amplicons were pooled in equimolar concentration, and further paired-end sequencing was performed using a PE300 platform/NovaSeq PE250 platform (Illumina, San Diego, CA).
2.3. Statistical analyses
Statistical analyses were performed with SPSS 21.0 (SPSS, Inc., Chicago, IL). Results are expressed as mean ± standard deviation. In order to improve symmetry, the non-parametric variables were mathematically transformed. The unpaired t test was used to analyze the differences between continuous variables between the study groups. The Mann–Whitney U test was used to examine the differences in bacterial composition between the groups. The Bray-Curtis dissimilarities among the gut microbiota communities were calculated based on taxonomic data, and the resultant distances were visualized by principal coordinate analysis. Statistical differences between groups were tested using ANOSIM analysis. P < .05 was considered as statistically significant. In the heatmap analysis, the Bray–Curtis distance algorithm was used for distance hierarchical clustering, and the complete linkage method was used for species hierarchical clustering. In order to evaluate the description ability of the random forest model (randomForest package), the receiving operational curve (ROC) was constructed (plotROC package) and the area under the curve (AUC) was calculated.
3. Results
3.1. Clinical characteristics of study participants
Forty-eight initial UC patients and 48 healthy relatives matched for age and living environment included. Among them, the Han UC group (HUC) included 25 patients, the Han normal control group (HN) 25 participants, the Uyghur UC group (UUC) 23 patients, and the Uyghur normal (UN) control group 23 participants. The mean age of UUC, UN, HUC, and HN were 44.20 ± 9.43, 43.84 ± 9.91, 42.26 ± 10.42, and 43.04 ± 10.04 years, respectively; there were no significant differences in age and sex between groups. In order to avoid the impact of disease activity on the intestinal flora, only mild and intermediate UC patients were selected. The demographics and characteristics of UC patients and their healthy relatives are shown in Table 1.
Table 1.
Characteristics of UC patients and a normal control group.
| Characteristic | UUC (n = 23) | UN (n = 23) | HUC (n = 25) | HN (n = 25) | |
| Sex | Male | 11 (47.83%) | 10 (43.48%) | 14 (56.00%) | 12 (48.00%) |
| Female | 12 (52.17%) | 13 (56.52%) | 11 (44.00%) | 13 (52.00%) | |
| Age | (Mean ± SD) | 44.20 ± 9.43 | 43.84 ± 9.91 | 42.26 ± 10.42 | 43.04 ± 10.04 |
| (Minimum) | 20 | 22 | 20 | 24 | |
| (Maximum) | 57 | 59 | 60 | 59 | |
| Disease severity | (Mild) | 6 | 10 | ||
| (Intermediate) | 17 | 15 |
3.2. Differences in microbial diversity
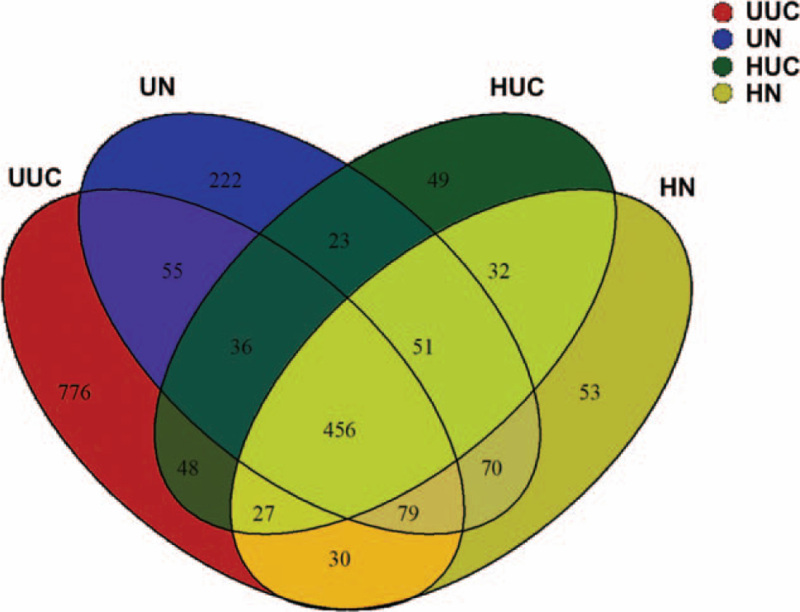
To profile the differences in intestinal microflora structure between Han and Uygur UC patients, Illumina miseq sequencing of bacterial 16SrRNA gene V3 region was performed for 96 faeces samples collected from the 4 groups. The estimated sample coverage was about 99%, and the correlation between duplicate samples was >99.5%, which indicated that the accuracy and reproducibility of sequencing was reliable. A total of 5,359,155 effective sequence reads were obtained from the 96 fecal samples. Ribosomal Database Project classifier Bayesian algorithm was used to carry out taxonomic analysis on 97% similar level of Operational Taxonomic Unit (OTU) representative sequences. There were 456 OTUs shared by the 4 groups, 566 OTUs were shared between the HUC and HN groups, 626 were shared between the UUC and Uygur normal control group (UN) groups, 567 were shared between the HUC and UUC groups, 656 were shared between the HN and UN groups (Fig. 1).
Figure 1.
Venn diagram of OTU in the 4 groups. Different colors represent different groups. The number of overlapping part represents the number of OTUs shared by different groups, while the number of non-overlapping parts represents the number of OTUs unique to the corresponding group.
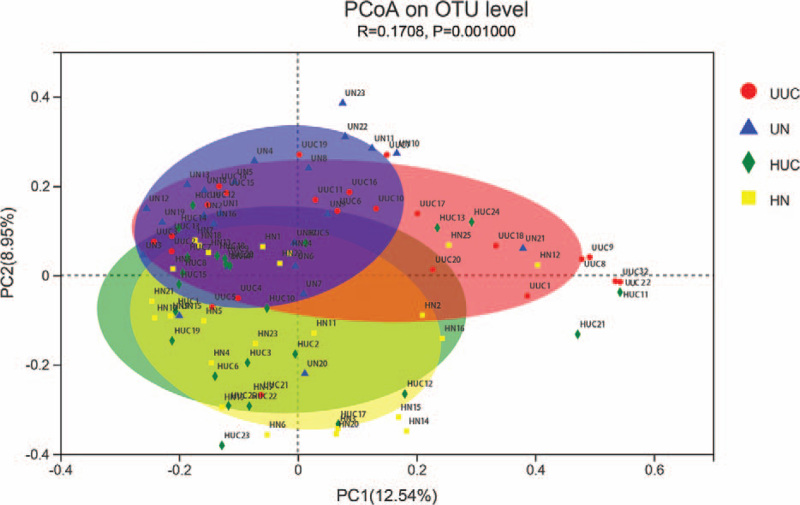
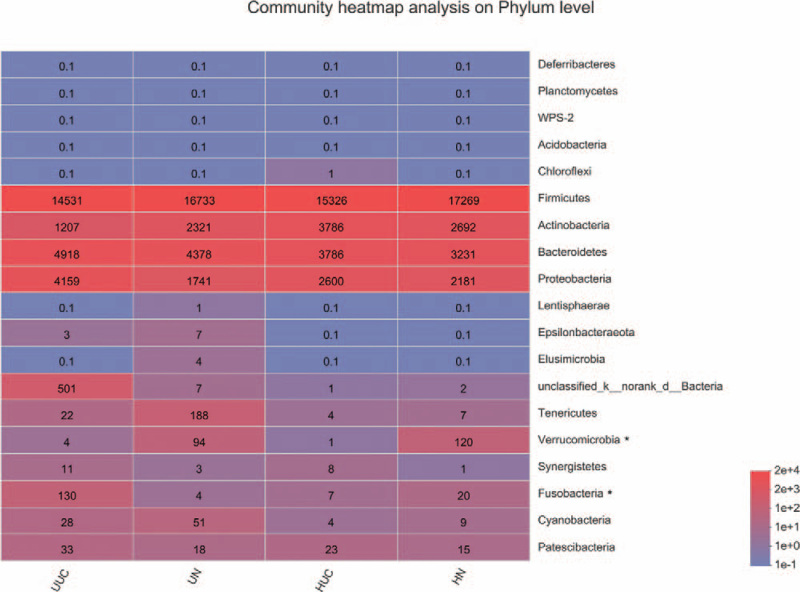
The principal coordinate analysis of sequencing data showed that fecal microbial structure in 4 groups was significantly separated. The main principle component (PC) scores were PC1 = 12.54%, PC2 = 8.95%, and PC3 = 5.99% (Fig. 2). Heatmap profile indicated marked differences in microbial community structures among groups (Fig. 3). The abundance of Fusobacteria was increased in the UUC group, while Verrucomicrobia was lower in UUC and HUC groups.
Figure 2.
Principal coordinate analysis plots in fecal microbiota. Bray_curtis PCoA plot based on OTU abundance. Each point represents the microbiome of a sample, with Uyghur UC group (red triangle), Uyghur normal control group (blue triangle), Han UC group (green triangle), and Han normal control group (HN) (yellow circle). PCoA = principal coordinate analysis, UC = ulcerative colitis.
Figure 3.
Heatmap analyses of abundant phylum in each group. The abscissa is the group name, and the ordinate is the species name. The color gradient shows the abundance changes of different species in each group of samples. The right side of the figure is the value represented by the color gradient. The taxa of interest are marked with the asterisk.
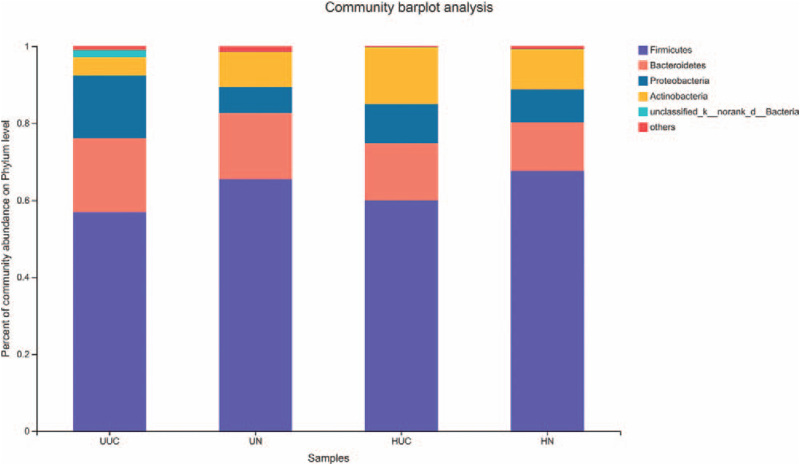
The relative abundances of OTUs in the 4 groups at the phylum level are shown for those with an abundance of at least 0.01% (Fig. 4). Firmicutes, Bacteroidetes, Proteobacteria, and Actinobacteria were the most abundant phyla in the 4 groups. Proteobacteria and Bacteroidetes were increased, and Firmicutes and Actinobacteria decreased in the UUC group compared with the UN group. Compared with the HN group, Proteobacteria, Bacteroidetes, and Actinobacteria were increased, and Firmicutes were decreased in the HUC group. Moreover, more Proteobacteria and Bacteroidetes, and less Firmicutes and Actinobacteria were found in the UUC group compared with the HUC group.
Figure 4.
Analysis of microbial community composition among 4 groups at phylum level. The ordinate is the proportion of the sample species. The columns with different colors represent different species, and the length of the columns represents the proportion of the species.
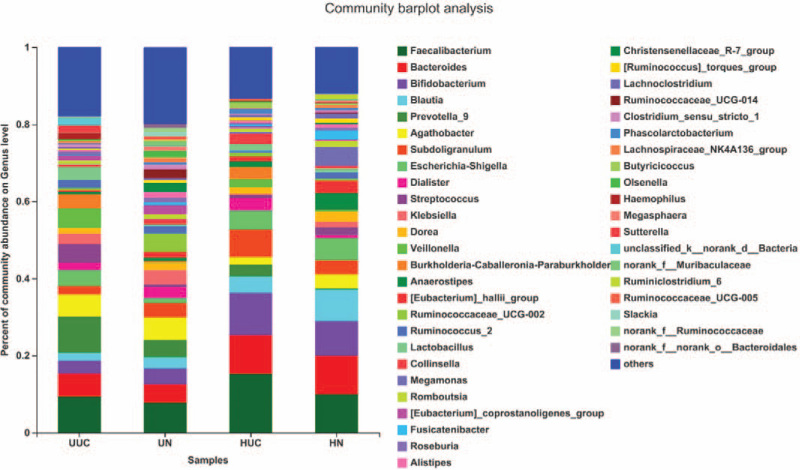
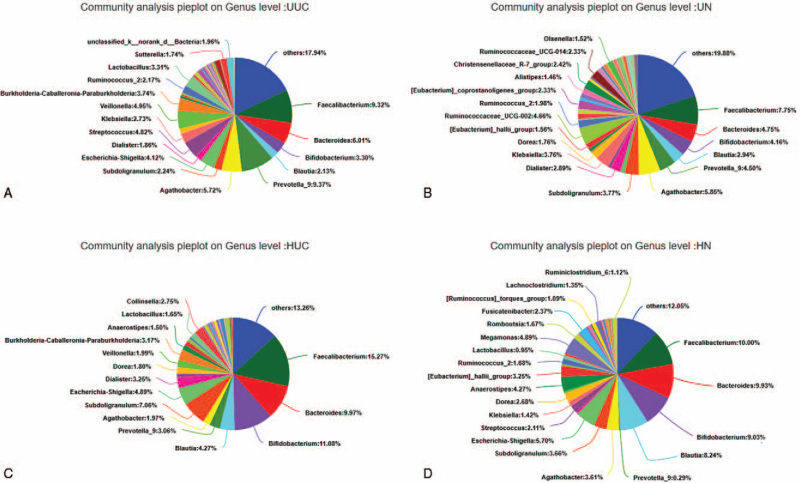
We further assessed the relative abundance and frequency of OTUs at the genus level (Fig. 5). The community analysis pieplot further showed the proportion of microbial genera with high abundance level (Fig. 6). Compared with the control group, Faecalibacterium, Bacteroides, Prevotella_9, and Burkholderia were all increased in the HUC and UUC group; Agathobacter, Blautia, Klebsiella, Dorea were decreased in the HUC and UUC group. However, compared with the control group, Bifidobacterium, Subdoligranulum, Dialister increased in the HUC group but decreased in the UUC group. Escherichia-Shigella and Streptococcus increased in the UUC group, but decreased in the HUC group.
Figure 5.
Analysis of microbial community composition among 4 groups at genus level. The ordinate is the proportion of the species in the sample. The columns with different colors represent different species, and the length of the columns represents the proportion of the species.
Figure 6.
Microbial community composition of each group at genus level. Different colors represent different species, and the pie area represents the percentage of the species.
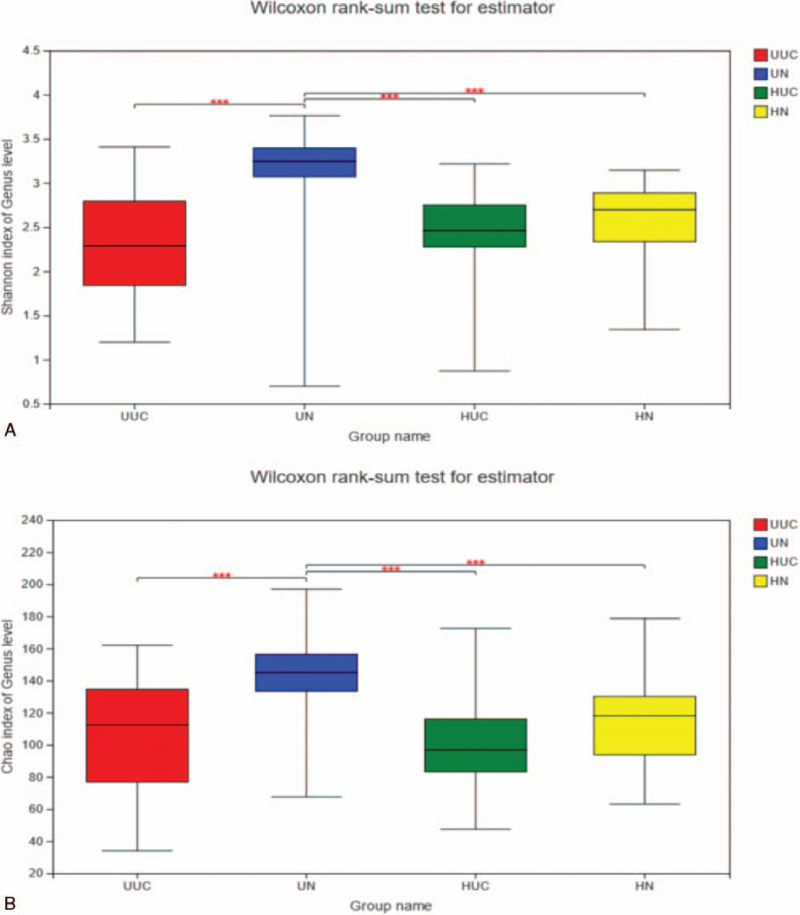
Alpha diversity analysis using the Shannon index (Fig. 7A) and the Chao index are shown in Fig. 7B. The microbial community diversity and richness indicated by Shannon and Chao estimators showed significant changes among the UUC and UN, UN and HN, HUC, and UN (Table 2). However, there was no significant difference in microbial diversity and richness index between Han UC patients and their relatives (P > .05).
Figure 7.
(A) Wilcoxon rank-sum test for Shannon index. Using Shannon index to estimate the α-diversity of each group at the genus level. ∗P < .05, ∗∗P < .01, ∗∗∗P < .001. (B) Wilcoxon rank-sum test for Chao index. Using Chao index to estimate the α-diversity of each group at the genus level. ∗P < .05, ∗∗P < .01, ∗∗∗P < .001.
Table 2.
Sequencing data with richness and diversity estimation of bacteria taxa in HUC, HN, UUC, and UN groups.
| Estimators | HUC (n = 25) | HN (n = 25) | UUC (n = 23) | UN (n = 23) |
| Shannon | 2.42 ± 0.51 | 2.60 ± 0.41 | 2.35 ± 0.62 | 3.1519 ± 0.61 |
| Chao | 100.42 ± 29.13 | 115.09 ± 29.69 | 103.59 ± 36.26 | 144.21 ± 27.09 |
| Coverage | 0.99 | 0.99 | 0.99 | 0.99 |
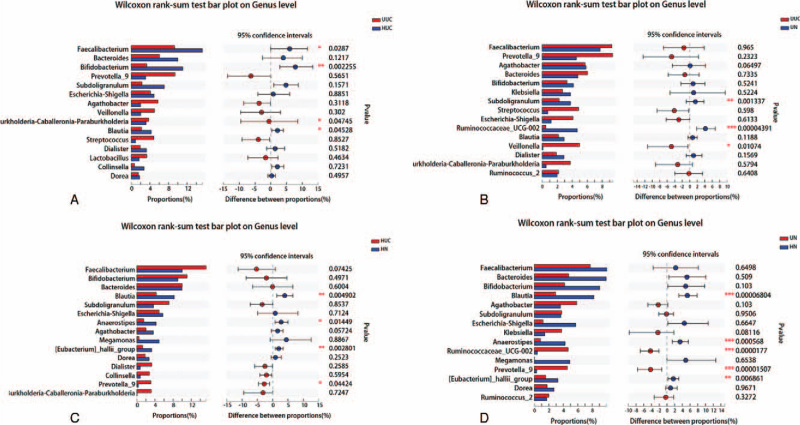
Through species difference analysis, the microbial groups with a significant difference at the genus level were displayed from the perspective of species richness of each group. The results showed that the abundance of Burkholderia-Caballeronia-Paraburkholderia in the UUC group was significantly higher than that in the HUC group, while Faecalibacterium, Bifidobacterium, and Blautia in the HUC group were significantly higher than those in the UUC group (Fig. 8A) (P < .05). At the same time, we also noticed that the abundance of Veillonella was significantly higher, and Subdoligranulum and Ruminococcaceae_UCG-002 were significantly lower in the UUC group compared with the UN group (Fig. 8B) (P < .05). The abundance of Prevotella_9 in the HUC group was significantly higher than that in HN group, while Blautia, Anaerostipes, and [Eubacterium]_hallii_group were significantly lower (Fig. 8C) (P < .05). Moreover, the abundances of Ruminococcaceae_UCG-002 and Prevotella_9 were significantly higher in the UN group than in the HN group, while Blautia, Anaerostipes, and [Eubacterium]_hallii_group were significantly lower compared with the HN group (Fig. 8D) (P < .05).
Figure 8.
The top 15 species with the highest richness at genus level among different groups. X axis represents different groups, different color boxes represent different groups, and Y axis represents average relative abundance of a species in different groups. (∗∗P < .01, ∗P < .05, Mann–Whitney U test).
In order to screen out the most important species category (biomarker) that can distinguish between UC disease status and healthy controls, a diagnosis model was constructed based on species at the genus level. The AUC-RF algorithm was used to determine an optimal random forest model that maximizes the ROC curve's AUC value. In the UUC and UN verification cohort, when the AUC value was the highest, the number of species ranked by importance was selected as 6 (Fig. 9A). The top 6 species in importance were Christensenellaceae_R_7_group, Ruminococcaceae_UCG_005, Ruminococcaceae_UCG_010, Ruminococcaceae_UCG_013, Haemophilus, and Ezakiella (Fig. 9B). The distinguishing ability of the model is verified by the independent group composed of UUC and UN. The AUC was 0.77 (95% CI: 0.64–0.90, Fig. 9C). In the HUC and HN verification cohort, the number of selected species ranked by importance was 17. The AUC was 0.51 (95% CI: 0.37–0.65, Fig. 9D). Our results revealed that the classifier based on intestinal microbiome could not distinguish HUC from HN, but could accurately distinguish UUC and UN.
Figure 9.
Based on species at genus level, the diagnostic models were constructed to distinguish UC patients from healthy controls. (A) The AUC value of the random forest model constructed in the UUC and UN validation cohorts; (B) the top 6 species that can distinguish UUC from UN; (C) ROC analysis on gene level in UUC and UN groups; (D) ROC analysis on gene level in HUC and HN groups. AUC = area under the curve, HN = Han normal control group, HUC = Han patients with UC, ROC = receiving operational curve, UC = ulcerative colitis, UN = Uygur normal control group, UUC = Uygur patients with UC.
4. Discussion
UC is a chronic, idiopathic, and recurrent inflammation involving the gastrointestinal tract.[14] Over recent years, UC's incidence rate in Asian countries such as China, India, and Korea has been increasing.[15–17] UC's pathogenesis has been associated with hereditary, environmental, microbiological, and abnormal immune system functional factors.[18,19] Intestinal microbiota seems to be an essential factor in the development of UC.[20,21] However, it is also known that the intestinal microbial environment is related to many factors such as diet and living habits. In our previous studies, we found significant differences in clinical characteristics between Uygur and Han UC patients. The differences between these clinical characteristics were mainly related to the differences in the genetic background but also eating habits. Uygur people prefer meat and a high-fat diet. Therefore, there may be differences in intestinal flora between them, which may provide direction for our research on the influence of intestinal flora on the performance of UC disease.
In the present study, spouses or siblings who lived together with patients for >1 year were selected as a control group so as to exclude the influence of diet and living environment on the intestinal flora. We found differences in microbial community structure among the 4 groups. Heat map analysis showed that Verrucomicrobia abundance was lower in the UUC and HUC groups at the phylum level.[22]Verrucomicrobia has been reported to be associated with the mucus barrier on the surface of the intestinal mucosa, which contributes to the degradation of the intestinal mucus and can effectively use the mucus as a source of carbon and nitrogen. In this study, a decreased abundance of Verrucomicrobia was observed in both Uygur and Han UC patients, which may be related to the damage of the colonic mucosal barrier and the disorder of mucus secretion on the surface of the intestinal mucosa in UC patients. The decreased abundance of Verrucomicrobia may further lead to increase of mucus in the feces of UC patients. In comparison, Fusobacteria abundance was higher in the UUC group. Fusobacteria, which is a gram-negative anaerobe, is considered to be a pathogenic strain. Fusobacteria isolated from patients with inflammatory bowel disease has enhanced aggressive and pro-inflammatory properties.[23] Some pathogenic or conditional pathogens of these bacteria may disrupt the intestinal environment's balance and integrity and promote the occurrence and development of inflammation. It is well known that Fusobacterium nucleatum belonging to the Fusobacteria is related to recurrence and exacerbation of UC. However, F nucleatum was not found in this study, which may be related to the initial onset of UC patients included in this study. In addition, F nucleatum is mostly enriched in colonic mucosa tissue in IBD, and the expression level in stool samples may be very low. Among the species with the highest expression abundance at the phylum level, compared with the normal control group, Uyghur and Han UC patients showed an increase in Proteobacteria and Bacteroidetes and a decrease in Firmicutes, which was consistent with the results of Duranti et al.[24,25] However, in the UUC group, Actinobacteria was lower than that in the UN group, while Actinobacteria in the HUC group was higher than that in the HN group. Actinobacteria belongs to gram-positive strictly anaerobic bacteria, most of which are probiotics, including Bifidobacterium, Bifidobacterium longum, and Bifidobacterium breve.[26] Studies have shown that Bifidobacterium and others can ferment dietary fiber to produce short-chain fatty acids, inhibit the proliferation of pathogenic bacteria, reduce inflammation, reduce intestinal permeability, and reduce endotoxins entering the bloodstream.[27,28] In this study, more serious disease manifestations observed in Uyghur UC patients may be related to the higher abundance of pathogenic bacteria in the intestines and the lower proportion of probiotics.
Chao index and Shannon index analysis indicated that the diversity and richness of microbial communities in the UUC group were significantly lower than those in the UN. Although HUC is lower than HN, the difference is not significant, which suggests that the decrease of intestinal fecal microbial diversity in Uyghur UC patients may be more significant.
Studies have shown that unaffected healthy first-degree relatives of children with UC may have fecal microbial disorders related to changes in intestinal metabolism. This may mean a susceptible microbial state of subclinical inflammation.[29] In addition, Chen et al[30] found no significant difference in microbial alpha diversity between UC patients and cohabiting healthy partners, and the fecal microbial community was relatively similar between patients and their partners. Turnbaugh et al[31,32] also proposed that family members may share intestinal microbial populations. However, these studies have not conducted studies on populations of different genetic backgrounds, lacking ethnic and racial diversity. In our research results, the microbial diversity of Han UC patients and their healthy relatives seems to be similar to the above research. There was no significant difference in microbial diversity between HUC and HN, but the decrease of intestinal microbial diversity in Uygur UC patients was more significant. At the same time, we also noticed that the UN's microbial diversity was significantly higher than that of HN. We believe that different dietary habits may lead to differences in microbial diversity. Still, in this study, we consider that intestinal microflora changes in UC patients may be more significant in groups with higher microbial diversity. Strikingly, it has been confirmed that the genetic risk variants associated with IBD affect healthy individuals’ intestinal microbiota. FUT2 gene mutations have been shown to be associated with genes that directly affect the intestinal bacterial structure of IBD.[33] In addition, our previous study indicated that there are differences in FUT2 variant rs281377 between Han UC patients and Uygur UC patients compared with the control group. This may also be related to the different performances of these 2 populations in UC intestinal flora.
Through species difference analysis, we further examined the bacteria with a significant difference among the groups. Compared with the control group of healthy relatives, the UUC and HUC groups showed an increase of pathogenic strains such as Veillonella and a decrease of beneficial bacteria, such as Blautia and Prevotella_9.[34]Burkholderia-caballeronia-paraburkholderia abundance in the UUC group was significantly higher than that in the HUC group, and Faecalibacterium, Bifidobacterium, and Blautia in the HUC group were significantly higher than those in the UUC group. Faecalibacterium and Blautia are common Short-Chain Fatty Acids (SCFA) producing bacteria and typical intestinal inherent probiotics found in recent years.[35,36] SCFA producing bacteria can induce Treg differentiation, protect the intestinal mucosal barrier, and maintain normal intestinal function.[37,38]Bifidobacterium is one of the most common probiotics in the intestine, which can inhibit the production of LPS, thus reducing the intestinal permeability and having a positive role in maintaining the intestinal mucosal barrier function. Therefore, we believed that different genetic backgrounds and dietary habits, which led to a significant reduction of intestinal probiotics in Uygur UC patients, are closely related to Uygur UC patients’ clinical manifestations. More attention to the supplement of probiotics among Uyghurs and people with the similar genetic background may be of great significance in the treatment of UC.
We found that 6 microbial genera had accurate discriminative ability between UC disease status and their healthy relatives through the prediction and analysis of the random forest model. This suggested that these species may be used as predictors for UC patients with more severe symptoms or genetic background similar to Uyghurs to distinguish them from healthy people. However, we did not find important species that could distinguish Han UC patients from their healthy relatives. This again suggested that the changes of intestinal microflora in Uygur patients with UC may be more typical. The Christensenellaceae taxa, which rank the highest in importance, have been reported to produce butyric acid in previous studies. It has anti-inflammatory properties and can down-regulate pro-inflammatory cytokines to improve colonic mucosal barrier function.[39] The metabolic level of butyric acid in the intestine may be related to the heterogeneity of clinical manifestations in UC patients. At the same time, butyric acid is an important substrate for SCFA production. Butyric acid is not only the main energy source of colonic epithelial cells but can also inhibit the expression of pro-inflammatory cytokine mRNA in mucus. In Uyghur UC patients, we also observed the reduction of SCFA-producing bacteria Faecalibacterium and Blautia. Regulating SCFA production in the intestine may be more effective for the treatment of Uyghur UC patients.
In summary, our current research is based on the previous study on the differences in clinical manifestations between Uyghur UC patients and Han UC patients in Northwest China. In this study, we further discussed the differences of intestinal flora between the 2 groups. A family-based study was conducted between patients and their relatives. UC patients with different genetic backgrounds and dietary habits led to intestinal microbial changes compared with their living relatives. Different regimens may be required for intestinal microecological treatment of patients with different genetic risks of UC.
This study has a few limitations. First, we did not set a healthy control group outside the family to further understand the changes of intestinal microorganisms of UC patients and their relatives. In addition, due to inconsistencies in patient compliance, we did not obtain complete dietary habits data of patients and their relatives. Further longitudinal prospective studies are needed in the future. Although changes in bacteria may simply reflect the course of the disease or be the cause of the disease, we still expect to find different bacteria that can be used as biomarkers for ulcerative colitis by studying UC in different populations.
Author contributions
All authors read and approved the final manuscript.
Conceptualization: Huan Liu.
Data curation: Huan Liu.
Formal analysis: Huan Liu, Feng Gao.
Investigation: Jiajie Lu.
Methodology: Huan Liu, Weidong Liu.
Software: Yan Feng.
Supervision: Xiaoling Huang.
Writing – original draft: Huan Liu.
Writing – review & editing: Huan Liu, Feng Gao.
Footnotes
Abbreviations: AUC = area under the curve, CI = Confidenceinterval, FUT2 = fucosyltransferase 2, HN = Han normal control group, HUC = Han patients with UC, IBD = Inflammatory Bowel Disease, OTU = Operational Taxonomic Unit, PC = principle component, ROC = receiving operational curve, SCFA = Short-Chain Fatty Acids, UC = ulcerative colitis, UN = Uygur normal control group, UUC = Uygur patients with UC.
How to cite this article: Liu H, Liu W, Huang X, Feng Y, Lu J, Gao F. Intestinal flora differences between patients with ulcerative colitis of different ethnic groups in China. Medicine. 2021;100:32(e26932).
This study was supported by the National Natural Science Foundation of China (Award Number 81760101). The funders had no role in study design, data collection and analysis, decision to publish, or preparation of the manuscript.
All authors declare that they have no competing interests.
Data Availability Statement: The datasets generated during and/or analyzed during the current study are available from the corresponding author on reasonable request.
Patient consent: The study has obtained informed consent for all individual participants that appear in this manuscript.
Ethics Approval: The research adhered to the principles of the Declaration of Helsinki and Title 45, U.S. Code of Federal Regulations, Part 46, Protection of Human Subjects. The present study was approved by the Ethics Committee of Xinjiang District Hospital (No. 2017006).
The authors have no conflicts of interest to disclose.
The datasets generated during and/or analyzed during the current study are available from the corresponding author on reasonable request.
HN = Han normal control group, HUC = Han patients with UC, UC = ulcerative colitis, UN = Uygur normal control group, UUC = Uygur patients with UC.
HN = Han normal control group, HUC = Han patients with UC, UN = Uygur normal control group, UUC = Uygur patients with UC.
References
- [1].Ordás I, Eckmann L, Talamini M, Baumgart DC, Sandborn WJ. Ulcerative colitis. Lancet 2012;380:1606–19. [DOI] [PubMed] [Google Scholar]
- [2].Le Gall G, Noor SO, Ridgway K, et al. Metabolomics of fecal extracts detects altered metabolic activity of gut microbiota in ulcerative colitis and irritable bowel syndrome. J Proteome Res 2011;10:4208–18. [DOI] [PubMed] [Google Scholar]
- [3].Allegretti JR, Hamilton MJ. Restoring the gut microbiome for the treatment of inflammatory bowel diseases. World J Gastroenterol 2014;20:3468–74. [DOI] [PMC free article] [PubMed] [Google Scholar]
- [4].Lin Z, Zu XP, Xie HS, et al. Research progress in mechanism of intestinal microorganisms in human diseases. Yao Xue Xue Bao 2016;51:843–52. [PubMed] [Google Scholar]
- [5].Arpaia N, Campbell C, Fan X, et al. Metabolites produced by commensal bacteria promote peripheral regulatory T-cell generation. Nature 2013;504:451–5. [DOI] [PMC free article] [PubMed] [Google Scholar]
- [6].Vigsnaes LK, van den Abbeele P, Sulek K, et al. Microbiotas from UC patients display altered metabolism and reduced ability of LAB to colonize mucus. Sci Rep 2013;3:1110. [DOI] [PMC free article] [PubMed] [Google Scholar]
- [7].Bengtson MB, Aamodt G, Vatn MH, Harris JR. Concordance for IBD among twins compared to ordinary siblings--a Norwegian population-based study. J Crohns Colitis 2010;4:312–8. [DOI] [PubMed] [Google Scholar]
- [8].Prideaux L, Kamm MA, De Cruz PP, Chan FK, Ng SC. Inflammatory bowel disease in Asia: a systematic review. J Gastroenterol Hepatol 2012;27:1266–80. [DOI] [PubMed] [Google Scholar]
- [9].Gao F, Liu X, Ding N, Li Y, Jiang X. Comparisons of clinical characteristics in patients with ulcerative colitis between Uygur and Han nationality in Xinjiang. Chin J Digest Endosc 2007;24:423–6. [Google Scholar]
- [10].Gao F, Aheman A, Lu JJ, Abuduhadeer M, Li YX, Kuerbanjiang A. Association of HLA-DRB1 alleles and anti-neutrophil cytoplasmic antibodies in Han and Uyghur patients with ulcerative colitis in China. J Dig Dis 2014;15:299–305. [DOI] [PubMed] [Google Scholar]
- [11].Aheman A, Gao F, Kuerbanjiang A, Li YX, Abuduhadeer M. Difference in DRB1∗ gene polymorphisms between Han and Uyghur ulcerative colitis patients in China. World J Gastroenterol 2013;19:2709–13. [DOI] [PMC free article] [PubMed] [Google Scholar]
- [12].Aheman A, Luo HS, Gao F. Association of fucosyltransferase 2 gene variants with ulcerative colitis in Han and Uyghur patients in China. World J Gastroenterol 2012;18:4758–64. [DOI] [PMC free article] [PubMed] [Google Scholar]
- [13].Lennard-Jones JE. Classification of inflammatory bowel disease. Scand J Gastroenterol Suppl 1989;170:02–6. discussion 16-19. [DOI] [PubMed] [Google Scholar]
- [14].Becker C, Neurath MF, Wirtz S. The intestinal microbiota in inflammatory bowel disease. ILAR J 2015;56:192–204. [DOI] [PubMed] [Google Scholar]
- [15].Ananthakrishnan AN. Epidemiology and risk factors for IBD. Nat Rev Gastroenterol Hepatol 2015;12:205–17. [DOI] [PubMed] [Google Scholar]
- [16].Wong SH, Ng SC. What can we learn from inflammatory bowel disease in developing countries? Curr Gastroenterol Rep 2013;15:313. [DOI] [PubMed] [Google Scholar]
- [17].Hou JK, Abraham B, El-Serag H. Dietary intake and risk of developing inflammatory bowel disease: a systematic review of the literature. Am J Gastroenterol 2011;106:563–73. [DOI] [PubMed] [Google Scholar]
- [18].Colombel JF, Watson AJ, Neurath MF. The 10 remaining mysteries of inflammatory bowel disease. Gut 2008;57:429–33. [DOI] [PubMed] [Google Scholar]
- [19].Hanauer SB. Inflammatory bowel disease: epidemiology, pathogenesis, and therapeutic opportunities. Inflamm Bowel Dis 2006;12: suppl: S3–9. [DOI] [PubMed] [Google Scholar]
- [20].Kostic AD, Xavier RJ, Gevers D. The microbiome in inflammatory bowel disease: current status and the future ahead. Gastroenterology 2014;146:1489–99. [DOI] [PMC free article] [PubMed] [Google Scholar]
- [21].Machiels K, Joossens M, Sabino J, et al. A decrease of the butyrate-producing species Roseburia hominis and Faecalibacterium prausnitzii defines dysbiosis in patients with ulcerative colitis. Gut 2014;63:1275–83. [DOI] [PubMed] [Google Scholar]
- [22].van Passel MW, Kant R, Zoetendal EG, et al. The genome of Akkermansia muciniphila, a dedicated intestinal mucin degrader, and its use in exploring intestinal metagenomes. PLoS One 2011;6:e16876. [DOI] [PMC free article] [PubMed] [Google Scholar]
- [23].Ohkusa T, Okayasu I, Ogihara T, et al. Induction of experimental ulcerative colitis by Fusobacterium varium isolated from colonic mucosa of patients with ulcerative colitis. Gut 2003;52:79–83. [DOI] [PMC free article] [PubMed] [Google Scholar]
- [24].Duranti S, Gaiani F, Mancabelli L, et al. Elucidating the gut microbiome of ulcerative colitis: bifidobacteria as novel microbial biomarkers. FEMS Microbiol Ecol 2016;92:fiw191. [DOI] [PubMed] [Google Scholar]
- [25].Ahmed I, Roy BC, Khan SA, Septer S, Umar S. Microbiome, metabolome and inflammatory bowel disease. Microorganisms 2016;4:20.doi: 10.3390/microorganisms4020020. PMID: 27681914; PMCID: PMC5029486. [DOI] [PMC free article] [PubMed] [Google Scholar]
- [26].Shkoporov AN, Khokhlova EV, Kulagina EV, Smeianov VV, Kafarskaia LI, Efimov BA. Application of several molecular techniques to study numerically predominant Bifidobacterium spp. and Bacteroidales order strains in the feces of healthy children. Biosci Biotechnol Biochem 2008;72:742–8. [DOI] [PubMed] [Google Scholar]
- [27].Fung TC, Olson CA, Hsiao EY. Interactions between the microbiota, immune and nervous systems in health and disease. Nat Neurosci 2017;20:145–55. [DOI] [PMC free article] [PubMed] [Google Scholar]
- [28].Zhao L, Zhang F, Ding X, et al. Gut bacteria selectively promoted by dietary fibers alleviate type 2 diabetes. Science 2018;359:1151–6. [DOI] [PubMed] [Google Scholar]
- [29].Jacobs JP, Goudarzi M, Singh N, et al. A disease-associated microbial and metabolomics state in relatives of pediatric inflammatory bowel disease patients. Cell Mol Gastroenterol Hepatol 2016;2:750–66. [DOI] [PMC free article] [PubMed] [Google Scholar]
- [30].Chen GL, Zhang Y, Wang WY, et al. Partners of patients with ulcerative colitis exhibit a biologically relevant dysbiosis in fecal microbial metacommunities. World J Gastroenterol 2017;23:4624–31. [DOI] [PMC free article] [PubMed] [Google Scholar]
- [31].Turnbaugh PJ, Hamady M, Yatsunenko T, et al. A core gut microbiome in obese and lean twins. Nature 2009;457:480–4. [DOI] [PMC free article] [PubMed] [Google Scholar]
- [32].Franzosa EA, Sirota-Madi A, Avila-Pacheco J, et al. Gut microbiome structure and metabolic activity in inflammatory bowel disease. Nat Microbiol 2019;4:293–305. [DOI] [PMC free article] [PubMed] [Google Scholar]
- [33].Imhann F, Vich Vila A, Bonder MJ, et al. Interplay of host genetics and gut microbiota underlying the onset and clinical presentation of inflammatory bowel disease. Gut 2018;67:108–19. [DOI] [PMC free article] [PubMed] [Google Scholar]
- [34].Monk JM, Lepp D, Zhang CP, et al. Diets enriched with cranberry beans alter the microbiota and mitigate colitis severity and associated inflammation. J Nutr Biochem 2016;28:129–39. [DOI] [PubMed] [Google Scholar]
- [35].Wan Y, Wang F, Yuan J, et al. Effects of dietary fat on gut microbiota and faecal metabolites, and their relationship with cardiometabolic risk factors: a 6-month randomised controlled-feeding trial. Gut 2019;68:1417–29. [DOI] [PubMed] [Google Scholar]
- [36].Benítez-Páez A, Gómez Del Pugar EM, López-Almela I, Moya-Pérez Á, Codoñer-Franch P, Sanz Y. Depletion of Blautia species in the microbiota of obese children relates to intestinal inflammation and metabolic phenotype worsening. mSystems 2020;5:e00857–19. [DOI] [PMC free article] [PubMed] [Google Scholar]
- [37].Duncan SH, Russell WR, Quartieri A, et al. Wheat bran promotes enrichment within the human colonic microbiota of butyrate-producing bacteria that release ferulic acid. Environ Microbiol 2016;18:2214–25. [DOI] [PMC free article] [PubMed] [Google Scholar]
- [38].Canani RB, Costanzo MD, Leone L, Pedata M, Meli R, Calignano A. Potential beneficial effects of butyrate in intestinal and extraintestinal diseases. World J Gastroenterol 2011;17:1519–28. [DOI] [PMC free article] [PubMed] [Google Scholar]
- [39].Sun M, Du B, Shi Y, Lu Y, Zhou Y, Liu B. Combined signature of the fecal microbiome and plasma metabolome in patients with ulcerative colitis. Med Sci Monit 2019;25:3303–15. [DOI] [PMC free article] [PubMed] [Google Scholar]


