Abstract
Colorectal cancer is currently the third most common cancer around the world. In this study, we chose a bioinformatics analysis method based on network analysis to dig out the pathological mechanism and key prognostic targets of rectal adenocarcinoma (READ).
In this study, we downloaded the clinical information data and transcriptome data from the Cancer Genome Atlas database. Differentially expressed genes analysis was used to identify the differential expressed genes in READ. Community discovery algorithm analysis and Correlation analysis between gene modules and clinical data were performed to mine the key modules related to tumor proliferation, metastasis, and invasion. Genetic significance (GS) analysis and PageRank algorithm analysis were applied for find key genes in the key module. Finally, the importance of these genes was confirmed by survival analysis.
Transcriptome datasets of 165 cancer tissue samples and 9 paracancerous tissue samples were selected. Gene coexpression networks were constructed, multilevel algorithm was used to divide the gene coexpression network into 11 modules. From GO enrichment analysis, module 11 significantly associated with clinical characteristic N, T, and event, mainly involved in 2 types of biological processes which were highly related to tumor metastasis, invasion, and tumor microenvironment regulation: cell development and differentiation; the development of vascular and nervous systems. Based on the results of survival analysis, 7 key genes were found negatively correlated to the survival rate of READ, such as MMP14, SDC2, LAMC1, ELN, ACTA2, ZNF532, and CYBRD1.
Our study found that these key genes were predicted playing an important role in tumor invasion and metastasis, and being associated with the prognosis of READ. This may provide some new potential therapeutic targets and thoughts for the prognosis of READ.
Keywords: community discovery algorithm, gene coexpression network, pagerank search algorithm, rectal adenocarcinoma
1. Introduction
Colorectal cancer (CRC) is currently the third most common cancer around world. According to statistics, only in 2017, there were >130,000 new CRC patients in the United States, and >50,000 of them died of it.[1] Although radiotherapy and chemotherapy combined with TME surgery have become the standard treatment for locally advanced rectal cancer and significantly improve the local control rate of locally advanced rectal cancer, the risk of distant metastasis and the overall prognostic survival rate have not been significantly improved, and the recurrence of rectal cancer is still the leading cause of death to rectal cancer patients.[2] Treatment of advanced CRC and recognition of biomarkers for CRC have become an academic hot-spot in cancer research. Oh et al[3] found out that BRCA1 mutations were closely related to the incidence of colorectal cancer. Abdul Aziz et al[1] performed Illumina DASL method to analyze 78 patients with Duckes B and C, and discovered 19 significantly differentially expressed genes (DEGs), such as NOTCH2, ITPRIP, FRMD, etc, which were closely related to the prognostic survival of colorectal cancer. Song and Fu[4] found out that the expression of SSTR2, CXCR5, and SSTR3 were highly associated with the overall survival (OS) rate of patients (GSE126095). Current researches on CRC are mainly focused on 2 aspects: screen the prognostic markers of CRC through differentially expressed gene analysis methods such as SAM and t test combined with survival analysis at the transcriptome level; collect existing literature reports of CRC, and perform meta-analysis to the key genes related to CRC pathogenicity, aiming to provide new guidelines for the prevention of CRC diseases.
Biomolecules worked together synergistically or antagonistically as a complex network. Network modeling was a key tool to simulate the interaction of biomolecules. Tang et al[5] performed Weighted Gene Co-Expression Network Analysis (WGCNA) to analyze GEO datasets (GSE1561) and found out that 4 key genes (FBXO5, etc) were highly related to the prognosis of breast cancer. Huo et al[6] performed WGCNA to analyze GEO datasets (GSE72708) and detected 6 genes (PBK, etc) highly associated with the occurrence of endometrial cancer. Li et al[7] performed a bioinformatics method combining WGCNA, ssGSEA, and SVM-RFE algorithms to analyze the clinical data of breast cancer samples and identified APOD, CXCL14, IL33, LIFR as biological nodes of the prognosis. We can tell that gene coexpression network analysis represented by WGCNA is widely used to combine phenotypic data with omics data to mine key genes or key gene modules.
The occurrence and development of tumor is very intricate. There are usually huge differences between postoperative survival trend in CRC cancer patients for all kinds of reasons, such as different subtypes, different molecular types, or different stages. In this study, a new gene coexpression network analysis was performed to analyze the pathological mechanism of rectal adenocarcinoma (READ). We used gene coexpression networks as background, combining with community discovery algorithm and PageRank algorithm to mine key genes closely related to prognosis survival in READ. Firstly, datasets downloaded from the Cancer Genome Atlas database (TCGA),[8] removed samples with missed or unmatched information from both clinical dataset and transcriptome dataset, and used hierarchical clustering algorithm to remove the outliers. Then, FC-t algorithm was performed to identify significantly DEGs between cancer tissues and paracancer tissues.[9] Furthermore, we computed Pearson correlation coefficients between genes, and built a gene coexpression network. Later, 5 community discovery algorithms including multilevel,[10] leading eigenvector,[11] label propagation,[12] infomap,[13] edge betweenness,[14] and random walk[15] were performed to divide this network into modules, and the results of the multilevel algorithm with the highest modularity among all 5 algorithms were chosen for subsequent research. Gene modules were combined with clinical characteristics including stage, event, sex, age, M, N, and T to detect key modules which associated with these clinical characteristics more. Then, we performed GO enrichment analysis to figure out biological functions of these key modules. Based on the results of correlation analysis and GO enrichment analysis, it was found that module 11 was closely related to tumor infiltration and metastasis. Gene significance (GS) algorithm[16] was performed to detect characteristic genes in module 11. Furthermore, we queried the Search Tool for the Retrieval of Interacting Genes (STRING) database[17] to construct protein–protein interaction network (PPI network) of genes in module 11, and PageRank algorithm was used to mine HUB genes in this network. At last, we dig out key genes affecting prognostic survival.
2. Materials and methods
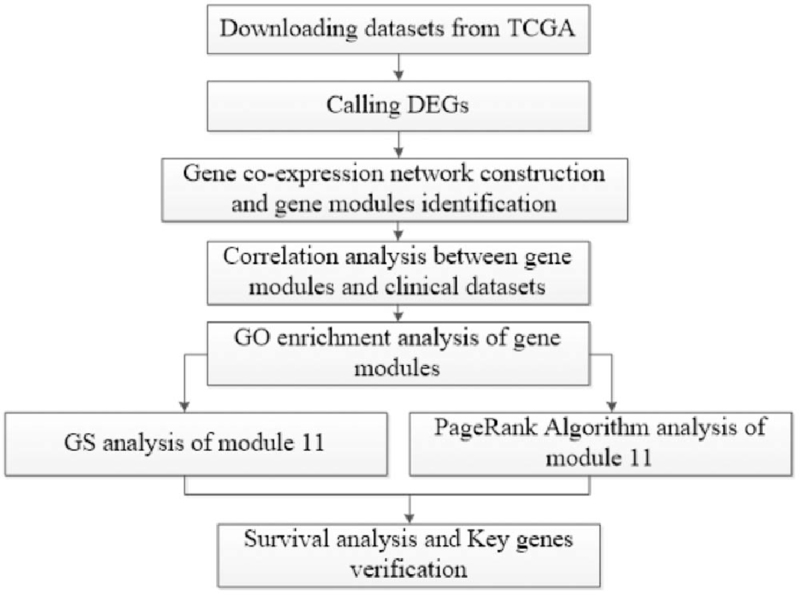
In our study, Fig. 1 was the analysis flow-chart of this research to facilitate readers to better understand this manuscript.
Figure 1.
Flow-chart of datasets analysis in this paper.
2.1. Data preprocessing and sample evaluation
The original READ dataset of this study which including clinical information data, cancer tissues transcriptome data, and paracancerous tissues transcriptome data were derived from TCGA database (https://portal.gdc.cancer.gov/projects/).[8] A 171 samples clinical information dataset including characteristic M (metastasis), N (node), T (tumor), stage, event, sex, and age was selected. T refers to the condition of the primary tumor. N refers to the involvement of regional lymph nodes. M refers to distant transfers.[18] We also selected a 165 samples cancer tissues transcriptome dataset and a 9 samples paracancerous tissues transcriptome dataset including FPKM value of 60,483 genes (Table S1, Supplemental Digital Content). First, samples with missing clinical data were removed, and only samples which exist in both clinical dataset and cancer tissue transcriptome dataset were kept. Finally, the hierarchical clustering analysis was performed to remove the outliers from cancer tissue gene expression dataset. The hierarchical clustering were conducted using R function clust() in the cluster package.[19] This study based on public sources data, which contains its ethnic approval. Thus, we do not need any further ethnic approval.
2.2. Analysis of differential expressed genes
t-Test is a commonly used method for DEGs verification. Guo et al[20] performed t-test and fold change method to analyze the GEO datasets (GSE10474) and found that PTK2, SRC, and CAV2 may be potential markers for diagnosis and treatment of ALI. Wang et al[21] applied t-test method to mine the DEGs in GEO datasets (GSE 29721) and found that genes (EGR1, FOS, and ETS2 etc) might play important roles in the pathogenesis of HCC and may be used as therapeutic targets for HCC management. In this study, FC-t algorithm was used to identify DEGs in READ. Fold change thresholds was set at Fold change >1.2 or Fold change <0.8, and P value was set at <.05.
2.3. Construction of gene coexpression network
A Gene coexpression network was currently a generally accepted research method for transcriptomics research. In this study, Pearson correlation coefficients were used to construct a relationship matrix among DEGs in cancer tissues. In this study, the threshold was set at |Pearson correlation coefficient| > 0.7, and P value ≤ .01. A gene coexpression network was constructed based on selected interactions.
2.4. Community discovery algorithm analysis
In this study, 5 community discovery algorithms including multilevel,[10] leading eigenvector,[11] label progration,[12] infomap,[13] edge betweenness,[14] and random walk[15] were used to divided the gene coexpression network of DEGs into modules. Methods of multilevel, leading eigenvector, label progration, infomap, edge betweeness, and random walk were conducted R functions multilevel.community(), leading.eigenvector.community(), label.propagation.community(), infomap.community(), cluster_edge_betweenness(), random_walk() in igraph package.
2.5. Correlation analysis between gene modules and clinical data
Multilevel algorithm divided modules with the highest modularity were selected for following correlation analysis between gene modules and clinical data.
Module eigengenes (MEs) were defined as the genes in the first principal component of gene modules by using PCA algorithm. Pearson correlation coefficient was performed to calculate the correlation between the MEs and the clinical characteristics, including stage, event, sex, age, M, N, T, to construct a correlation coefficient matrix. Among them, PCA algorithm was conducted using R function prcomp().[22]
2.6. Genetic significance analysis
Genetic significance (GS) is the correlation between clinical characteristics and the expression of cancer tissues samples of a single gene. Module membership (MM) is the correlation between the expression of cancer tissues samples of a single gene and MEs.
To explore the characteristic genes in module 11 highly connected with tumor invasion and metastasis, the GS of each gene and characteristic event, stage, N, and T was calculated in module 11. The characteristic genes were selected by combining MM and GS thresholds (MM value > 0.8 and [|GS value| > 0.15]).
2.7. Pagerank algorithm analysis
The HUB gene refers to a gene with high connectivity in a network. From the perspective of graph theory, its disappearance will cause a devastating collapse of the entire network. In biology, a HUB gene connects multiple signal pathways and plays an important regulatory role in biological processes.
To mine the HUB genes in module 11, PageRank algorithm[23] was performed. First, genes in module 11 were imported into STRING database (http://string-db.org),[17] regulatory relationships were selected between genes with confidence score >0.400 and a gene regulatory network was built. Further, Gene regulation network was imported into Cytoscape software[24] to obtain sub-networks, the biggest sub-network was selected for subsequent analysis. Finally, PageRank algorithm was performed to score genes in the network to select HUB genes.
2.8. Survival analysis and key gene verification
Survival analysis was an important analysis method to assess the survival indicators for tumor patients after surgery. In this study, the online analysis tool oncolnc (http://www.oncolnc.org/)[8] was used for the survival analysis of HUB genes and characteristic genes. Lower percentile was set at 50, upper percentile was set at 50.
ROC curve and AUC were used to detect the ability of key genes to distinguish tumors from normal tissues.
3. Results
3.1. Sample quality control analysis
First of all, samples with missing data were removed from the clinical samples. Then we obtained 154 cancer tissues samples and 9 paracancerous tissues samples all with complete clinical information.
Then, we removed zero-expressed genes from both cancer and paracancerous tissues transcriptome datasets, and kept 6623 genes.
The final step, an outlier sample TCGA-DY-A1DF was found by hierarchical clustering of the cancer tissues transcriptome datasets, as shown in Fig. 2. After removing it, a 153 samples transcriptome dataset was finally obtained (Table S1, Supplemental Digital Content).
Figure 2.
Hierarchical clustering analysis of cancer tissues transcriptome dataset.
3.2. Identification of differentially expressed genes
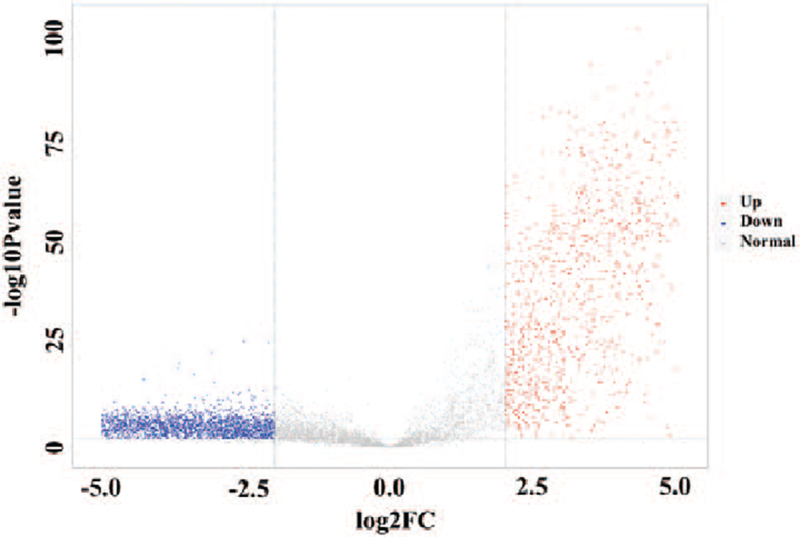
To identify genes which change significantly between cancer tissues and paracancerous tissues, we performed FC-t algorithm to the transcriptome datasets of cancer and paracancerous tissues and got 4865 DEGs which met appropriate filtering thresholds (Fold change > 1.2 || Fold change < 0.83, P value < .01) (Fig. 3) (Table S2, Supplemental Digital Content).
Figure 3.
DEGs between cancer tissues and paracancerous tissues. DEGs = differential expressed genes.
3.3. Construction of gene coexpression network
Pearson correlation coefficient was a powerful feature to judge the strength of the synergistic or antagonistic relationship between genes.
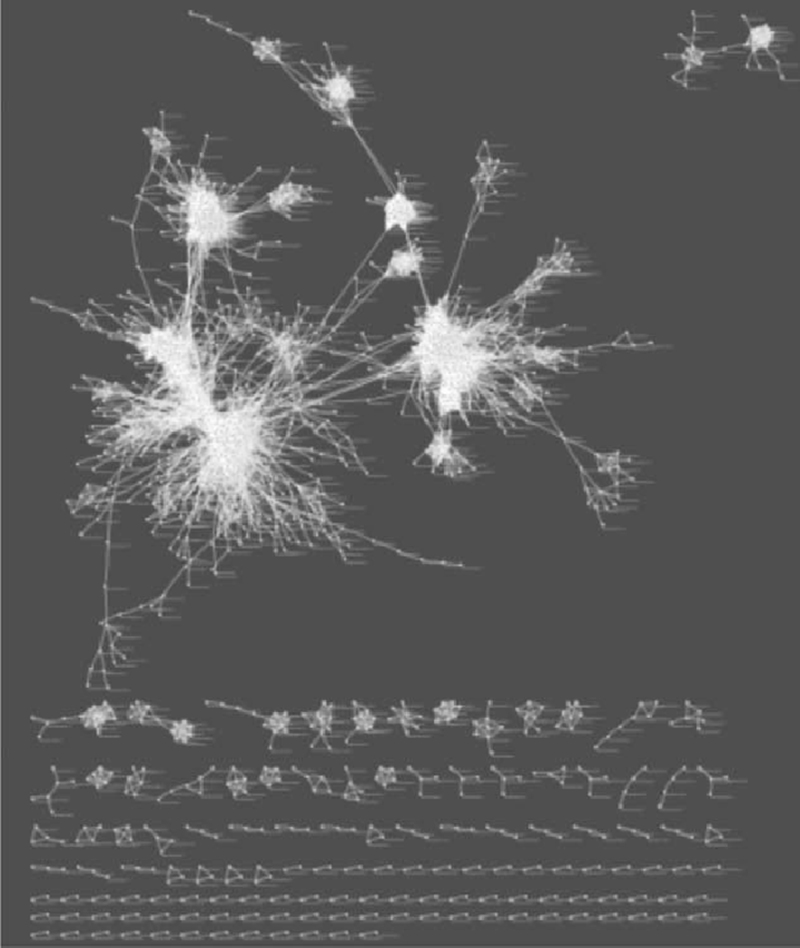
In this study, the FPKM values of DEGs in cancer tissue transcriptome data were used as background data. There were 23,568,225 interactions among DEGs. We calculated correlation coefficients and filtered interactions failed to meet the chosen appropriate threshold (|Pearson correlation coefficient| > 0.7, P value < .01), 2017 genes and 27,096 interactions were kept (Fig. 4) (Table S3, Supplemental Digital Content). Finally, we defined the largest network with 1566 gens as the gene coexpression network.
Figure 4.
Gene coexpression Network of DEGs in cancer tissue transcriptome dataset. DEGs = differential expressed genes.
3.4. Community discovery algorithm analysis of gene coexpression network
Modularity is a commonly used method for measuring the strength of the network community structure.[25] For the purpose of getting more accurate and objective network partition results, we used modularity as an evaluation indicator, and chose 5 community discovery algorithms including multilevel, leading eigenvector, label propagation, infomap, edge betweenness, and random walk (37 steps) to divide the gene coexpression network into modules (Table 1).
Table 1.
Community discovery algorithm evaluation results.
| Methods | Modularity | Number of modules |
| Multilevel | 0.7931583 | 30 |
| Eigenvector | 0.7755908 | 25 |
| Label propagation | 0.7777419 | 51 |
| Infomap | 0.06998093 | 614 |
| Edge betweenness | 0.7814576 | 38 |
| Random walk (37 steps) | 0.7821056 | 34 |
We chose the mutilevel algorithm partition results with the highest modularity for subsequent analysis. After removing modules with <25 genes, a total of 11 modules were selected. Density is an evaluation standard used to measure the density of interconnected edges between nodes in a network.[26] The density of these 11 modules was shown in Table 2. The density of module 16 was the lowest one, 0.04366225. It was noticed that the density of these modules was greater than the gene coexpression network (0.02114583). This proved that the mutilevel algorithm partition results were reliable.
Table 2.
Network partition assessment results.
| Module | Network density |
| Module 2 | 0.094261294 |
| Module 5 | 0.115512773 |
| Module 6 | 0.304375804 |
| Module 8 | 0.283870968 |
| Module 10 | 0.385598142 |
| Module 11 | 0.320684693 |
| Module 12 | 0.236585366 |
| Module 13 | 0.314878532 |
| Module 14 | 1.344632768 |
| Module 15 | 0.402649431 |
| Module 16 | 0.04366225 |
3.5. Correlation analysis between gene modules and clinical data
In this study, we constructed a correlation matrix between MEs and clinical characteristics including stage, event, sex, age, M, N, T, and built a module-clinical characteristics correlation heatmap (Fig. 5) (Table S4, Supplemental Digital Content).
Figure 5.
Correlation heatmap of gene modules and clinical characteristics.
The results showed: characteristic event was highly associated with module 11; characteristic stage was related to modules 11 and 8; characteristic age was highly associated with modules 16, 10, 2, and 13; characteristic M was highly combined with 16 and 2; characteristic N was highly correlated with module 11 and 12; characteristic T was highly related to module 11.
3.6. GO enrichment analysis of gene modules
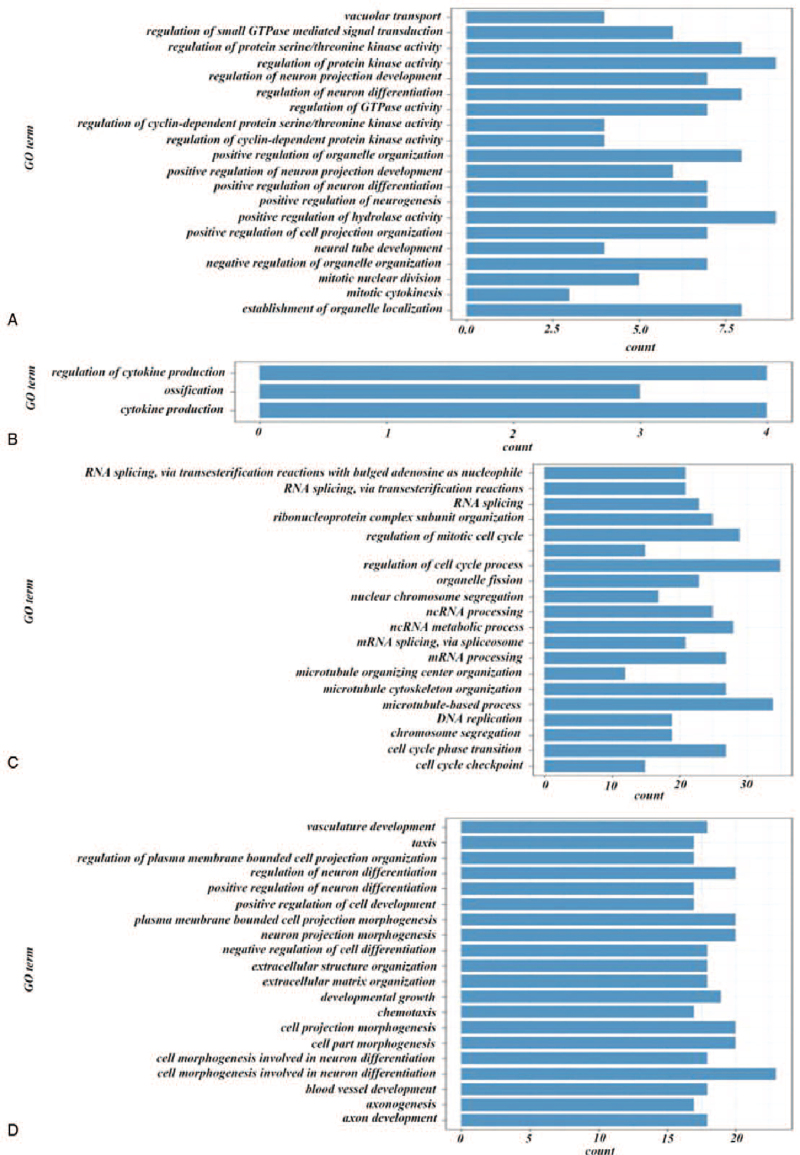
Based on above analysis, it could be observed that module 2, 10, 11, and 16 were significantly related to clinical characteristics. We had like to check out the biological functions of these 4 modules. GO enrichment analysis was performed to each one of them, as shown in Fig. 5.
Module 2 highly associated with characteristic age (r = 0.16810) and M (r = 0.14654) was identified included in cell growth or tissue differentiation, and body's self-regulation (Fig. 6A). Module 10 highly related to characteristic age (r = 0.24057) was identified related to the production of cytokines (Fig. 6B). Module 16 highly associated with characteristic age (r = 0.22778) and M (r = 0.16357) was identified correlated with cell proliferation and division (Fig. 6C).
Figure 6.
GO enrichment analysis of key modules. A, GO enrichment analysis of module 2. B, GO enrichment analysis of module 10. C, GO enrichment analysis of module 16. D, GO enrichment analysis of module 11.
Module 11 was shown highly associated with more clinical characteristics, including event (r = 0.17727), stage (r = 0.19694), N (r = 0.20755), and T (r = 0.28338). GO enrichment analysis showed that genes in module 11 were mainly involved in 2 types of biological processes: cell development and differentiation, the blood vessels and the nervous system development. These 2 types of biological processes usually worked together to regulate tumor microenvironment (Fig. 6D)[27,28] (Table S5, Supplemental Digital Content).
3.7. Gene significance analysis of module 11
Since we found that module 11 was highly associated with characteristic event, stage, N and T. Genes in module 11 were mainly involved in tumor microenvironment regulation. To study key genes in the development of READ, we performed a follow-up analysis to this module.
To assess the relationship between genes with high module attribution and external clinical features in module 11, we chose MM and GS as the evaluation indicators, and filtered results with appropriate thresholds (MM value > 0.8 and [GS value > 0.15 | GS value < –0.15]) to obtain clinical characteristic genes. Five genes found associated with characteristic event the most were SYNC, DNAJB5, DPYSL3, C14orf132, and FBLN5. Five genes associated with characteristic stage the most were FBLN5, SYT11, CYBRD1, CYS1, and LTBP1. Five genes associated with characteristic N the most were SYT11, CYBRD1, ZNF532, GGT5, and DPYSL3. And 5 genes including DPYSL3, DNAJB5, ACTA2, SYT11, and FXYD6 were found highly related to characteristic T (Table S6, Supplemental Digital Content).
3.8. HUB genes of module 11 mining by pagerank algorithm
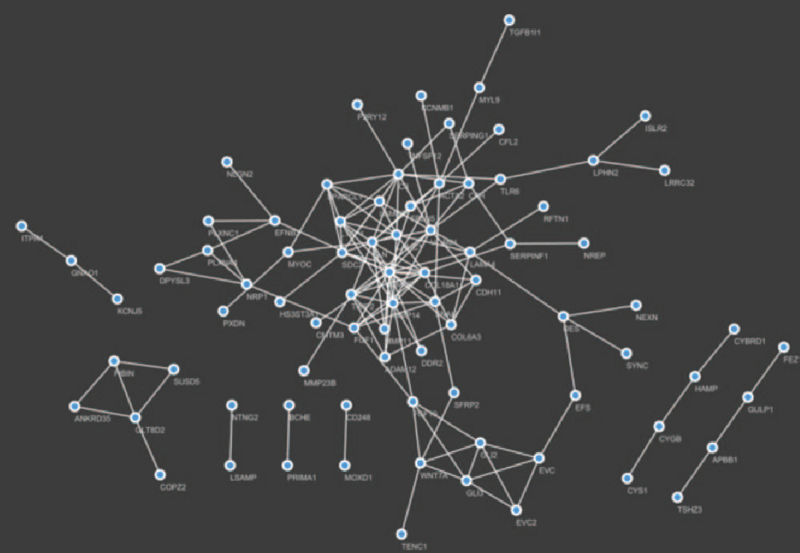
First of all, we chose a suitable threshold to construct a PPI network of module 11 by accessing STRING database. And a PPI network composed of a 60 genes subnet and 7 subnets with <6 genes was constructed (Fig. 7). Then, we performed PageRank algorithm to dig out the biggest subnet, and detected 10 HUB genes, including MMP2, C3, MMP14, ELN, VCAM1, ACTA2, COL18A1, TIMP2, SDC2, and LAMC1, ranking by PageRank scores from high to low (Table S7, Supplemental Digital Content).
Figure 7.
PPI Network of module 11. PPI = protein–protein interaction.
3.9. Survival analysis and verification of key genes
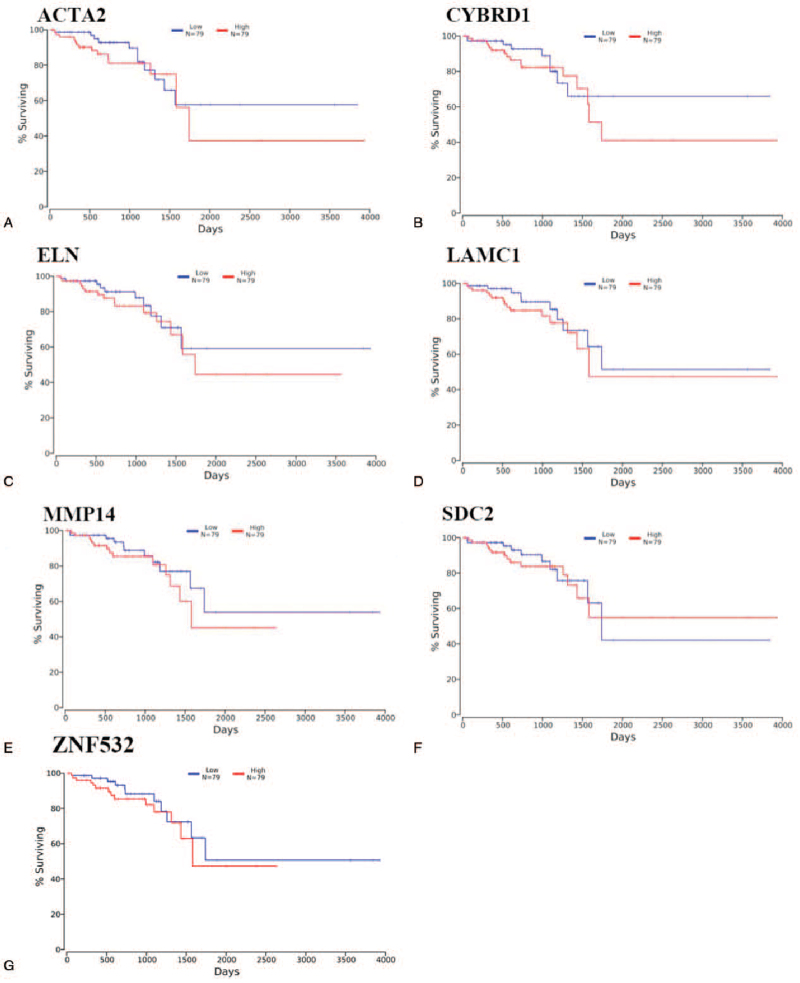
We performed survival analysis to HUB genes and characteristic genes associated with OS rate of tumor patients. It was found that MMP14 (up-regulated, P value = 4.5610–26), SDC2 (down-regulated, P value = 1.9810–5), LAMC1 (up-regulated, P value = 2.0210–52), ELN (up-regulated, P value = 1.1910–17), ACTA2 (up-regulated, P value = 2.5710–26), ZNF532 (up-regulated, P value = 2.5710–8), and CYBRD1 (up-regulated, P value = 1.3410–22) were highly related to survival time of READ patients.
The expression levels of these key genes were negatively related to OS (Fig. 8).
Figure 8.
Survival analysis of key genes. A, the survival analysis result of ACTA2; B, the survival analysis result of CYBRD1; C, the survival analysis result of ELN gene; D, the survival analysis result of LAMC1; E, the survival analysis result of MMP14; F, the survival analysis result of SDC2; G, the survival analysis result of ZNF532.
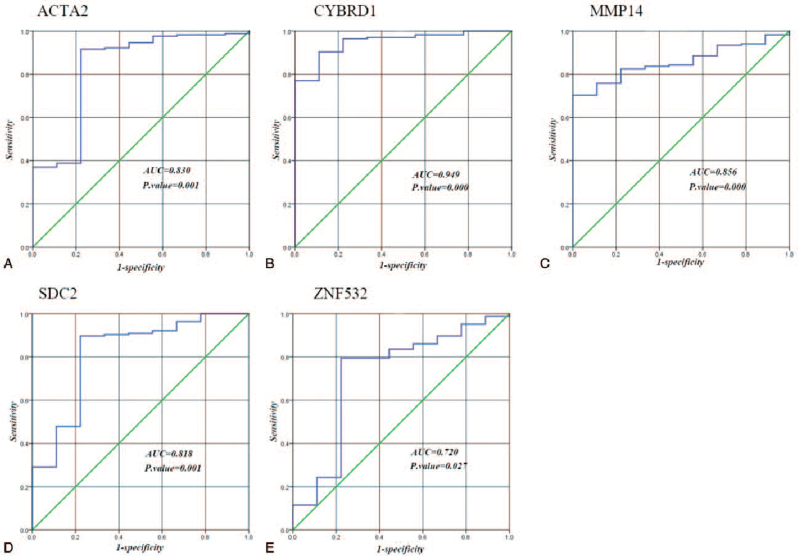
Based on the FPKM value of key genes, we used ROC curve and AUC to classify paracancer tissues and cancer tissues of READ. The result showed that 5 key genes (ACTA2, CYBRD1, MMP14, SDC2, ZNF532) were highly diagnostically efficient to distinguish tumors from normal tissues (P-value < .05) (Fig. 9).
Figure 9.
ROC curve of key genes. A, The ROC curve of ACTA2; B, the ROC curve of CYBRD1; C, the ROC curve of MMP14; D, the ROC curve of SDC2; E, the ROC curve of ZNF532.
4. Discussion
READ, as a subtype of CRC, has always been a hot-spot in cancer research. Hogan et al[29] performed KM estimation, log-rank analysis, and regression proportional multiple risk model for 527 colon and rectal cancer samples, and found that positive lymph node infiltration was associated with the prognosis of colon and rectal cancer. Chao et al[30] found out that DSG3 was a key prognostic factor and predictor of CCRT response by performing data mining and immunohistochemistry methods to patients with rectal cancer.[30] In this study, we built a new bioinformatics analysis pipeline to analyze key genes closely related to prognosis and major biological processes during development of READ.
A gene coexpression network of 4865 DEGs was divided into 16 main modules by using the multilevel algorithm. These modules were correlation analyzed with 7 clinical characteristics: event, stage, sex, M, N, T, and age. Module 11 was found highly associated with characteristic event, stage, N, and T. GO enrichment analysis showed that module 11 were mainly involved in 2 types of biological processes: cell development and differentiation; the development of vascular and nervous systems. The change of these 2 biological processes in tumor microenvironment has been proved closely related to tumor metastasis and invasion.[25] By using GS algorithm and PageRank algorithm, we found that 7 genes including MMP14, SDC2, LAMC1, ELN, ACTA2, ZNF532, and CYBRD1 were negatively correlated with the OS of READ.
MMP14 mainly involved in angiogenesis and cancer invasion is a member of the matrix metalloproteinases family, and plays an important role in the development of tumors.[31,32] Nguyen et al[32] found that the activation of MMP14 effectively promoted the growth and metastasis of liver tumors. Gramolelli et al[31] found that the expression of MMP14 promoted the migration and invasion of nasopharyngeal carcinoma cells in vitro, regulated the expression of EMT-related genes, and was highly positively correlated with lymph node metastasis in advanced stages of cancer. SDC2 was mainly involved in cell migration, proliferation as a signaling molecule in cell-to-cell interactions, and played a key role in the early detection of colorectal cancer.[33] Oh et al[33] found that SDC2 methylation was highly associated with the degree of colorectal cancer lesions. Barták et al[34] found that the combination of SFRP1, SFRP2, SDC2, and PRIMA1 could be used for the early diagnosis of colorectal adenocarcinoma. LAMC1, a member of laminin, is an essential component of the cellular network which transmits signals critical to cell behavior between bridging cells and cells,[35] and mainly involved in cell growth, migration, and differentiation. The expression of LAMC1 is closely related to tumor migration and invasion. Yang et al[36] found that the expression of LAMC1 promoted the invasion and migration of HCC tumors. Westerman et al[35] inhibited the metastasis and invasion of prostate cancer by inhibiting the expression of LAMC1. ELN is a member of elastin genes. Guemann et al[37] found that the isolation of ELN gene would case the occurrence of aortic aneurysms. ACTA2 is a type of actin that is involved in various biological processes, such as muscle contraction, cell division, and intercellular signal transduction, etc. Jeon et al[38] found that abnormal expression of ACTA2 promoted invasion and metastasis of breast cancer cells. Gao et al[39] found that 7 genes, including ACTA2, STK32A, and TERT, etc, were closely related to the development of lung cancer. ZNF532, a member of the zinc finger protein family, mainly regulates gene expression by binding to DNA, RNA and itself, or other zinc finger proteins. Alekseyenko et al[40] found that ZNF532-NUT fusion protein was associated with the occurrence of NUT midline cancer (NMC). CYBRD1 was mainly involved in the absorption and metabolism of iron. Velázquez-Fernández et al[41] found that CYBRD1 gene was down-regulated in adenocarcinoma.
WGCNA is a widely used software tool that is used to establish relationships between phenotypic traits and gene expression data.[42] Wu et al[43] obtained 1900 DEGs by analyzing the TCGA datasets of READ. Then, WGCNA method was performed to analyze gene modules of DEGs. Gene modules containing COL1A1 and MZB1 were selected for PPI network analysis and GO enrichment analysis, and found that 2 gene modules were mainly involved in biological processes related to intercellular signal transduction, such as positive regulation of MAPK cascade, cytokine-mediated signaling pathway, postsynaptic membrane potential, sodium ion transmembrane transport etc, and COL1A1 was as a key gene in the PPI network. Finally, COL1A1 and MZB1 affect the prognostic survival of READ by KM analysis. Zhang et al[44] used WGCNA analysis to analyze all genome-wide expression profile of GEO datasets (GSE68468) of CRC. And then, gene modules related to tumor histology characteristics were analyzed. It was found out that the gene modules mainly participated in ribosome-related biological processes such as mitochondrial large ribosomal subunit, structural constituent of ribosome, poly(A) RNA binding and collagen binding, and protein ubiquitination, etc. Finally, 10 HUB genes (CA2, MS4A12, etc) were identified in the weighted gene coexpression network and GUCA2A is proven to play an important role in CRC by KM analysis and ROC curve. However, in Wu et al research by WGCNA, the number of genes used to construct gene expression network is small, and the influence of gene modules on clinical phenotype is not considered, and other HUB genes in the 2 gene modules are not deeply explored; in Zhang et al's study, only the weights of the edges in the weighted gene coexpression network were used as the evaluation standard of HUB genes, and the topological characteristics of each gene in the gene coexpression network were not fully utilized, and the study did not consider genes and Protein-level links between genes. Compared with WGCNA, this method has 3 improvements in our study: compared with WGCNA algorithm based on network clustering to identify gene modules, this method takes into account the influence of modularity on gene modules recognition; compared with the WGCNA that only uses the GS algorithm to identify key genes, this method not only uses the GS method to identify key genes, but also uses the PageRank algorithm to identify key genes at the protein level; used survival analysis and ROC curve to verify that key genes play an important role in READ. It is worth noticed that the GO enrichment results of module 11 were more similar with the results of Wu et al, such as regulation of trans-synaptic signaling, regulation of ion transmembrane transport, etc; the GO enrichment results of Zhang et al were similar with the results of module 13 such as ribonucleoprotein complex biogenesis, Ribosome biogenesis, rRNA metabolic process, etc. In addition to the above results, it was found that biological processes such as cell proliferation and differentiation and angiogenesis affect tumor invasion and migration in this study.
In summary, by performing gene coexpression network analysis, MMP14, SDC2, ACTA2, ZNF532, and CYBRD1 was predicted playing an important role in tumor invasion and metastasis, and being associated with the prognosis of READ. These genes have been more or less reported to be related to invasion and metastasis of tumor and as the key biomarkers for detection or prognostic diagnosis. Our finding may provide some new ideas for prognostic diagnosis of READ.
Author contributions
Data curation: XingCheng Yi, Hanyu Zheng, Luoying Wang, Cong Fu, Xiaoyun Su.
Investigation: Yulai Zhou, Tong Xu.
Writing – original draft: Cong Fu, Xiaoyun Su.
Writing – review & editing: Cong Fu, Xiaoyun Su.
Supplementary Material
Supplementary Material
Supplementary Material
Supplementary Material
Supplementary Material
Supplementary Material
Supplementary Material
Footnotes
Abbreviations: CRC = colorectal cancer, DEG = differential expressed gene, GS = genetic significance, ME = module eigengenes, MM = module membership, OS = overall survival, READ = rectal adenocarcinoma, STRING = search tool for the retrieval of interacting genes, TCGA = the Cancer Genome Atlas database, WGCNA = weighted gene coexpression network analysis.
How to cite this article: Yi X, Zhou Y, Zheng H, Wang L, Xu T, Fu C, Su X. Prognostic targets recognition of rectal adenocarcinoma based on transcriptomics. Medicine. 2021;100:32(e25909).
YZ and HZ contributed equally to this article.
Supported by National Natural Science Foundation of China (No. 31401080).
The authors declare that we don’t have any financial or associative interest that represents a conflict of interest correlated with the work submitted.
The authors have no conflicts of interest to disclose.
The datasets generated during and/or analyzed during the current study are available from the corresponding author on reasonable request.
Supplemental digital content is available for this article.
References
- [1].Abdul Aziz NA, Mokhtar NM, Harun R, et al. A 19-Gene expression signature as a predictor of survival in colorectal cancer. BMC Med Genomics 2016;9:58. [DOI] [PMC free article] [PubMed] [Google Scholar]
- [2].Miller KD, Nogueira L, Mariotto AB, et al. Cancer treatment and survivorship statistics, 2019. CA Cancer J Clin 2019;69:363–85. [DOI] [PubMed] [Google Scholar]
- [3].Oh M, McBride A, Yun S, et al. BRCA1 and BRCA2 gene mutations and colorectal cancer risk: Systematic review and meta-analysis. J Natl Cancer Inst 2018;110:1178–89. [DOI] [PubMed] [Google Scholar]
- [4].Song W, Fu T. Circular RNA-associated competing endogenous RNA network and prognostic nomogram for patients with colorectal cancer. Front Oncol 2019;9:1181. [DOI] [PMC free article] [PubMed] [Google Scholar]
- [5].Tang J, Kong D, Cui Q, et al. Prognostic genes of breast cancer identified by gene co-expression network analysis. Front Oncol 2018;8:374. [DOI] [PMC free article] [PubMed] [Google Scholar]
- [6].Huo X, Sun H, Liu Q, et al. Clinical and expression significance of AKT1 by co-expression network analysis in endometrial cancer. Front Oncol 2019;9:1147. [DOI] [PMC free article] [PubMed] [Google Scholar]
- [7].Li J, Liu C, Chen Y, et al. Tumor characterization in breast cancer identifies immune-relevant gene signatures associated with prognosis. Front Genet 2019;10:1119. [DOI] [PMC free article] [PubMed] [Google Scholar]
- [8].Anaya J. OncoLnc: linking TCGA survival data to mRNAs, miRNAs, and lncRNAs. PeerJ Comp Sci 2016;2:e67. [Google Scholar]
- [9].Boareto M, Caticha N. t-test at the probe level: an alternative method to identify statistically significant genes for microarray data. Microarrays (Basel) 2014;3:340–51. [DOI] [PMC free article] [PubMed] [Google Scholar]
- [10].Blondel VD, Guillaume J-L, Lambiotte R, et al. Fast unfolding of communities in large networks. J Stat Mech 2008;2008: [Google Scholar]
- [11].Newman ME. Finding community structure in networks using the eigenvectors of matrices. Phys Rev E Stat Nonlin Soft Matter Phys 2006;74:036104. [DOI] [PubMed] [Google Scholar]
- [12].Raghavan UN, Albert R, Kumara S. Near linear time algorithm to detect community structures in large-scale networks. Phys Rev E Stat Nonlin Soft Matter Phys 2007;76:036106. [DOI] [PubMed] [Google Scholar]
- [13].Rosvall M, Axelsson D, Bergstrom CT. The map equation. Eur Phy J Spec Top 2009;178:13–23. [Google Scholar]
- [14].Newman ME, Girvan M. Finding and evaluating community structure in networks. Phys Rev E Stat Nonlin Soft Matter Phys 2004;69:026113. [DOI] [PubMed] [Google Scholar]
- [15].Rosvall M, Bergstrom CT. Maps of random walks on complex networks reveal community structure. Proc Natl Acad Sci U S A 2008;105:1118–23. [DOI] [PMC free article] [PubMed] [Google Scholar]
- [16].Wang-Xiao X, Yu Q, Gong-Hua L, et al. Identification of four hub genes associated with adrenocortical carcinoma progression by WGCNA. PeerJ 2019;7:e6555. [DOI] [PMC free article] [PubMed] [Google Scholar]
- [17].Szklarczyk D, Franceschini A, Kuhn M, et al. The STRING database in 2011: functional interaction networks of proteins, globally integrated and scored. Nucleic Acids Res 2011;39:D561–8. [DOI] [PMC free article] [PubMed] [Google Scholar]
- [18].Peparini N, Beyond T. N and M: the impact of tumor deposits on the staging and treatment of colorectal and gastric carcinoma. Surg Oncol 2018;27:129–37. [DOI] [PubMed] [Google Scholar]
- [19].Campbell MK, Piaggio G, Elbourne DR, et al. for the C.G., Group C. Consort 2010 statement: extension to cluster randomised trials. BMJ 2012;345:e5661. [DOI] [PubMed] [Google Scholar]
- [20].Guo Z, Zhao C, Wang Z. Gene expression profiles analysis identifies key genes for acute lung injury in patients with sepsis. Diagn Pathol 2014;9:176. [DOI] [PMC free article] [PubMed] [Google Scholar] [Retracted]
- [21].Wang Y, Jiang T, Li Z, et al. Analysis of differentially co-expressed genes based on microarray data of hepatocellular carcinoma. Neoplasma 2017;64:216–21. [DOI] [PubMed] [Google Scholar]
- [22].Nishikawa R, Goto Y, Kojima S, et al. Tumor-suppressive microRNA-29s inhibit cancer cell migration and invasion via targeting LAMC1 in prostate cancer. Int J Oncol 2014;45:401. [DOI] [PubMed] [Google Scholar]
- [23].Brin S, Page L. Reprint of: The anatomy of a large-scale hypertextual web search engine. Comp Netw (Amsterdam Netherlands: 1999) 2012;56:3825–33. [Google Scholar]
- [24].Shannon P, Markiel A, Ozier O, et al. Cytoscape: a software environment for integrated models of biomolecular interaction networks. Genome Res 2003;13:2498–504. [DOI] [PMC free article] [PubMed] [Google Scholar]
- [25].Vacca R. Structure in personal networks: constructing and comparing typologies. Netw Sci (Camb Univ Press) 2020;8:142–67. [DOI] [PMC free article] [PubMed] [Google Scholar]
- [26].Potts BB. Network Analysis: A handbook/social network analysis: methods and applications (book). Acta Sociol 1994;37:419–23. (Taylor & Francis Ltd). [Google Scholar]
- [27].Quail DF, Joyce JA. Microenvironmental regulation of tumor progression and metastasis. Nat Med 2013;19:1423–37. [DOI] [PMC free article] [PubMed] [Google Scholar]
- [28].Wu T, Dai Y. Tumor microenvironment and therapeutic response. Cancer Lett 2017;387:61–8. [DOI] [PubMed] [Google Scholar]
- [29].Hogan J, Chang KH, Duff G, et al. Lymphovascular invasion: a comprehensive appraisal in colon and rectal adenocarcinoma. Dis Colon Rectum 2015;58:547–55. [DOI] [PubMed] [Google Scholar]
- [30].Chao TB, Li CF, Lin CY, et al. Prognostic significance of DSG3 in rectal adenocarcinoma treated with preoperative chemoradiotherapy. Future Oncol 2016;12:1457–67. [DOI] [PubMed] [Google Scholar]
- [31].Gramolelli S, Cheng J, Martinez-Corral I, et al. PROX1 is a transcriptional regulator of MMP14. Sci Rep 2018;8:9531. [DOI] [PMC free article] [PubMed] [Google Scholar]
- [32].Nguyen AT, Chia J, Ros M, et al. Organelle specific O-glycosylation drives MMP14 activation, tumor growth, and metastasis. Cancer Cell 2017;32:639.e6–53.e6. [DOI] [PubMed] [Google Scholar]
- [33].Oh TJ, Oh HI, Seo YY, et al. Feasibility of quantifying SDC2 methylation in stool DNA for early detection of colorectal cancer. Clin Epigenet 2017;9:126. [DOI] [PMC free article] [PubMed] [Google Scholar]
- [34].Barták BK, Kalmár A, Péterfia B, et al. Colorectal adenoma and cancer detection based on altered methylation pattern of SFRP1, SFRP2, SDC2, and PRIMA1 in plasma samples. Epigenetics 2017;12:751–63. [DOI] [PMC free article] [PubMed] [Google Scholar]
- [35].Westerman K, Sebastiani P, Jacques P, et al. DNA methylation modules associate with incident cardiovascular disease and cumulative risk factor exposure. Clin Epigenetics 2019;11:142. [DOI] [PMC free article] [PubMed] [Google Scholar]
- [36].Yang Z-P, Ma H-S, Wang S-S, et al. LAMC1 mRNA promotes malignancy of hepatocellular carcinoma cells by competing for MicroRNA-124 binding with CD151: lamC1 regulates CD151 by ceRNA in HCC. IUBMB Life 2017;69:595–605. [DOI] [PubMed] [Google Scholar]
- [37].Guemann AS, Andrieux J, Petit F, et al. ELN gene triplication responsible for familial supravalvular aortic aneurysm. Cardiol Young 2015;25:712–7. [DOI] [PubMed] [Google Scholar]
- [38].Jeon M, You D, Bae SY, et al. Dimerization of EGFR and HER2 induces breast cancer cell motility through STAT1-dependent ACTA2 induction. Oncotarget 2016;8:50570–81. [DOI] [PMC free article] [PubMed] [Google Scholar]
- [39].Gao X, Zhang Y, Breitling LP, et al. Tobacco smoking and methylation of genes related to lung cancer development. Oncotarget 2016. [DOI] [PMC free article] [PubMed] [Google Scholar]
- [40].Alekseyenko AA, Walsh EM, Zee BM, et al. Ectopic protein interactions within BRD4-chromatin complexes drive oncogenic megadomain formation in NUT midline carcinoma. Proc Natl Acad Sci U S A 2017;114:E4184–92. [DOI] [PMC free article] [PubMed] [Google Scholar]
- [41].Velázquez-Fernández D, Laurell C, Geli J, et al. Expression profiling of adrenocortical neoplasms suggests a molecular signature of malignancy. Surgery 2005;138:1087–94. [DOI] [PubMed] [Google Scholar]
- [42].Toubiana D, Puzis R, Sadka A, et al. A genetic algorithm to optimize weighted gene co-expression network analysis. J Comput Biol 2019;26:1349–66. [DOI] [PubMed] [Google Scholar]
- [43].Wu W, Yang Z, Long F, et al. COL1A1 and MZB1 as the hub genes influenced the proliferation, invasion, migration and apoptosis of rectum adenocarcinoma cells by weighted correlation network analysis. Bioorg Chem 2020;95:103457. [DOI] [PubMed] [Google Scholar]
- [44].Zhang H, Du Y, Wang Z, et al. Integrated analysis of oncogenic networks in colorectal cancer identifies GUCA2A as a molecular marker. Biochem Res Int 2019;2019:6469420. [DOI] [PMC free article] [PubMed] [Google Scholar]
Associated Data
This section collects any data citations, data availability statements, or supplementary materials included in this article.


