

Abstract
Background
Colorectal cancer (CRC) is one of the most malignant tumors with high incidence, yet its molecular mechanism is not fully understood, hindering the development of targeted therapy. Metabolic abnormalities are a hallmark of cancer. Targeting dysregulated metabolic features has become an important direction for modern anticancer therapy. In this study, we aimed to identify a new metabolic enzyme that promotes proliferation of CRC and to examine the related molecular mechanisms.
Methods
We performed RNA sequencing and tissue microarray analyses of human CRC samples to identify new genes involved in CRC. Squalene epoxidase (SQLE) was identified to be highly upregulated in CRC patients. The regulatory function of SQLE in CRC progression and the therapeutic effect of SQLE inhibitors were determined by measuring CRC cell viability, colony and organoid formation, intracellular cholesterol concentration and xenograft tumor growth. The molecular mechanism of SQLE function was explored by combining transcriptome and untargeted metabolomics analysis. Western blotting and real‐time PCR were used to assess MAPK signaling activation by SQLE.
Results
SQLE‐related control of cholesterol biosynthesis was highly upregulated in CRC patients and associated with poor prognosis. SQLE promoted CRC growth in vitro and in vivo. Inhibition of SQLE reduced the levels of calcitriol (active form of vitamin D3) and CYP24A1, followed by an increase in intracellular Ca2+ concentration. Subsequently, MAPK signaling was suppressed, resulting in the inhibition of CRC cell growth. Consistently, terbinafine, an SQLE inhibitor, suppressed CRC cell proliferation and organoid and xenograft tumor growth.
Conclusions
Our findings demonstrate that SQLE promotes CRC through the accumulation of calcitriol and stimulation of CYP24A1‐mediated MAPK signaling, highlighting SQLE as a potential therapeutic target for CRC treatment.
Keywords: calcitriol, cell proliferation, cholesterol biosynthesis, colorectal cancer, CYP24A1, MAPK signaling, squalene epoxidase, terbinafine
SQLE increases the levels of calcitriol and CYP24A1. Then MAPK signaling is induced to accelerate CRC tumor growth.

Abbreviations
- ALT
alanine aminotransferase
- AST
aspartate transaminase
- CACNG4
channel auxiliary subunit gamma 4
- CMS
consensus molecular subtype
- CRC
colorectal cancer
- CYP24A1
cytochrome P450 family 24 subfamily A member 1
- FASN
fatty acid synthase
- FBS
fetal bovine serum
- HISC
Human Intestinal Stem Cell
- HMGCR
3 hydroxy 3 methylglutaryl‐CoA reductase
- IHC
immunohistochemistry
- KEGG
Kyoto Encyclopedia of Genes and Genomes
- MAPK
mitogen‐activated protein kinase
- MARCH6
membrane‐associated ring‐CH‐type finger 6
- mTOR
mammalian target of rapamycin
- NCEH1
neutral cholesterol ester hydrolase 1
- PMSF
phenylmethylsulfonyl fluoride
- PVDF
polyvinylidene difluoride
- RNA‐seq
RNA sequencing
- SDS‐PAGE
sodium dodecyl sulphate‐polyacrylamide gel electrophoresis
- SEM
standard error of the mean
- shRNA
short hairpin RNA
- siRNA
small interfering RNA
- SLC1A5
solute carrier family 1 member 5
- SQLE
squalene monooxygenase
- SREBP2
sterol regulatory element binding transcription factor 2
- TMA
tissue microarray
1. BACKGROUND
Colorectal cancer (CRC) is one of the most common cancers, with incidence and mortality rates ranking third in the world [1, 2]. The primary form of CRC treatment is surgical resection, accompanied by adjuvant therapy, such as radiotherapy, chemotherapy and immunotherapy [3, 4]. Currently, biomarkers, such as extended mutations of RAS and BRAF, are used to guide the prognostication and treatment of CRC patients according to genomic and transcriptome sequencing [5]. There are 4 gene expression consensus molecular subtypes (CMSs) in CRC: CMS1 (strong immune activation with microsatellite instability), CMS2 (canonical with epithelial chromosomal instability), CMS3 (metabolic dysregulation), and CMS4 (stromal invasion) [6]. CMS3 CRC is enriched for multiple types of metabolic reprogramming and is associated with KRAS‐activating mutations [6]. Accordingly, targeting metabolic processes that force cancer cells to revert to normal proliferation is considered possible for CRC treatment [7, 8]
Metabolic dysregulation represents one of the major characteristics of CRC in the clinic, and such dysregulation ranges from dysregulation of glucose metabolism and amino acid metabolism to dysregulation of lipid metabolism [9, 10, 11, 12, 13] To meet the needs for aberrantly activated growth, cancer cells alter their original metabolic patterns [14] Upregulated aerobic glycolysis in cancer cells produces sufficient ATP and excess intermediates for the synthesis of proteins and other biomolecules. Cancer cells also directly internalize glutamine by inducing the expression of glutamine transporters, such as solute carrier family 1 member 5 (SLC1A5), to synthesize proteins, stimulate glucose uptake, and activate the mammalian target of rapamycin (mTOR) pathway [15] In addition, most cancer cells accelerate the biosynthesis of lipids, such as fatty acids, by upregulating the expression of fatty acid synthase (FASN) [16] Cholesterol is another essential lipid that can form membranes, store energy, and synthesize bioactive hormones for cancer cells [17, 18]. It has been reported that excessive cholesterol uptake correlates with an increased risk of CRC [19, 20]. High cholesterol levels not only promote cancer cell proliferation and survival by disrupting the cell cycle and inhibiting apoptosis but also initiate cancer cell metastasis by suppressing the immune response and releasing interferons [21, 22].
Cholesterol biosynthesis is a classic mevalonate pathway, producing sterols and isoprenoids from acetyl‐CoA, NADPH and ATP [23] As the primary rate‐limiting enzyme, 3‐hydroxy‐3‐methylglutaryl‐CoA reductase (HMGCR) is the target of statins used for cancer treatment [24]. The secondary rate‐limiting enzyme squalene monooxygenase (SQLE) converts squalene produced by squalene synthase to 2,3‐epoxysqualene. SQLE expression depends on the response of sterol regulatory element binding transcription factor 2 (SREBP2) to low cholesterol levels [25] while SQLE is degraded by membrane‐associated ring‐CH‐type finger 6 (MARCH6) via the ubiquitin‐proteasome system in response to high cholesterol levels [26] SQLE plays an important role in liver [27] and breast cancers [28] Therefore, targeting SQLE with its inhibitor terbinafine represents a promising strategy for cancer prevention and treatment. However, the potential functions and mechanisms of SQLE in CRC remain unclear. In this study, we aimed to investigate the pathological function and molecular mechanism of SQLE in CRC development and to assess the therapeutic effect of SQLE inhibitors in CRC treatment.
2. METHODS AND MATERIALS
2.1. Cells and cell culture
The human embryonic kidney cell line 293T, CRC cell lines DLD1, HCT116, LS174T, RKO, SW480, SW620 cells were cultured in Dulbecco's Modified Eagle Medium (DMEM) (Cat#11995065; Invitrogen, Carlsbad, CA, USA supplemented with 10% fetal bovine serum (FBS; Cat#10091148; Gibco, Carlsbad, CA, USA) and 1% penicilin/streptomycin (Cat#15140122; Gibco, Carlsbad, CA, USA). HT29, HCT15, LoVo, Caco2 cells were cultured in RPMI‐1640 medium (Cat#11875093; Gibco, Carlsbad, CA, USA) supplemented with 10% FBS and 1% penicilin/streptomycin. NCM460 cells were cultured in RPMI‐1640 medium supplemented with 10% FBS, 20 ng/mL human epidermal growth factor (hEGF) (Cat#E4269; Sigma, St. Louis, MO, USA) and 1% penicilin/streptomycin. These cells were all incubated at 37°C with 5% CO2. All Cells were obtained from Shanghai Life Academy of Sciences cell library (Shanghai, China).
2.2. Human samples and tissue microarrays (TMAs)
The 281human CRC tissues and 212 adjacent normal tissues (175 paired CRC samples) were collected from Yangpu Hospital, Tongji University (Shanghai, China) between January, 2015 and December 2018 with patient consent. All samples were obtained from surgical resection of CRC patients (stage I‐IV) and reviewed by experienced pathologists at the Yangpu Hospital. Specimens were fixed by formalin, embedded in paraffin and used to construct a TMA. The use of all tissue samples in this study was approved by the Ethics Committee at the Yangpu Hospital, Tongji University.
2.3. Immunohistochemistry (IHC)
Tissue slides with paraffin sections were deparaffinized by xylene and ethanol. Endogenous peroxidase activity was blocked with 3% H2O2 for 15 min at room temperature. For antigen retrieval, slides were heated in citrate buffer for 20 min. Nonspecific binding was blocked with 10% fetal bovine serum in PBS for 15 min at 37°C. The slides were incubated with SQLE (1:200 dilution; Cat#12544‐1‐AP; Proteintech, Rosemont, IL, USA), Ki67 (1:5000 dilution; Cat#ab15580; Abcam, Cambrige, CB2, UK) at 4°C overnight. The slides were incubated with biotin‐conjugated secondary antibody using general SP kit (Cat#SP‐9000; ZSGB‐BIO, Beijing, China) and stained with the DAB substrate (Cat#SP‐9000; ZSGB‐BIO, Beijing, China). The immunoreactivity of tested samples was scored for multiplying staining intensity (0‐3) and positive cell proportion (0‐4).
2.4. Plasmids and stable cell line construction
Full‐length SQLE was cloned into pCDH‐PURO vector (Cat#46970; Addgene, Watertown, MA, USA). SQLE short hairpin RNA (shRNA) was constructed into pLKO.1‐PURO vector (Cat#8453; Addgene, Watertown, MA, USA), with the shRNA target sequences as follows, shSQLE: 5′‐GGTGTTGTGTTACAGTTAT‐3′ for; scramble control: 5′‐CCTAAGGTTAAGTCGCCCTCG‐3′.
HEK293T cells were co‐transfected with viral vectors (pCDH and PLKO.1) and packaging plasmids (psPAX2/pMD2.G; Cat#12259/12260; Addgene, Watertown, MA, USA) by using Lipofectamine 3000 (Cat#L3000015; Invitrogen, Carlsbad, CA, USA). At 48 h after transfection, cell medium was filtered through 0.45 μm filter (Cat#PN4614; PALL, Show Low, AZ, USA). Cells were infected with viral medium for 48 h, and then selected with puromycin (Gibco; Cat#A1113803; Carlsbad, CA, USA) to construct stable cell lines.
2.5. RNA interference
Human CYP24A1 and CACNG4 small interfering RNAs (siRNAs) were obtained from Genepharm (Shanghai, China). siRNA oligonucleotides were transfected by Lipofectamine RNAiMAX (Cat#13778150; Invitrogen, Carlsbad, CA, USA) following the manufacturer's instructions. siRNA target sequences used in this research are listed below, siCACNG4‐1: 5′‐GGATCTACAGCCGCAAGAATT‐3′; siCACNG4‐2: 5′‐TCGTCTACATTTCCAGCAATT‐3′; siCYP24A1‐1: 5′‐GCTGCAGATTCTCTGGAAATT‐3′; siCYP24A1‐2: 5′‐GCAACAGTTCTGGGTGAATTT‐3′.
2.6. RNA extraction and real‐time PCR analysis
Total RNA was extracted by using Trizol reagent (Cat#15596026; Invitrogen, Carlsbad, CA, USA). Reverse transcription was performed by RT master mix (Cat#RR036B; Takara, Mountain View, CA, USA) and real‐time PCR was carried out by SYBR Green (Cat#RR091A; Takara, Mountain View, CA, USA) according to manufacturer's instructions. The 2−ΔΔCt method was used for data analysis. The primers for real‐time PCR are listed in Supplementary Table S1.
2.7. Western blotting
Cells were washed by PBS and added with RIPA buffer (Cat#P0013B; Beyotime, Shanghai, China), phenylmethylsulfonyl fluoride (PMSF; ST506, Beyotime, Shanghai, China), and phosphotase inhibitors cocktail (Cat#P1050; Beyotime, Shanghai, China). Total proteins were separated by sodium dodecyl sulphate‐polyacrylamide gel electrophoresis (SDS‐PAGE), and then transferred onto polyvinylidene difluoride (PVDF) membranes (Cat# IPVH00010; Millipore, Billerica, MA, USA). Membranes were overnight incubated with primary antibodies against SQLE (1:1000 dilution; Cat#12544‐1‐AP; Proteintech, Rosemont, IL, USA), NCEH1 (neutral cholesterol ester hydrolase 1; 1:500 dilution; Cat#A17741; Abclonal, Wuhan, Hubei, China), LIPA (lipase A; 1:500 dilution; Cat#12956‐1‐AP; Proteintech, Rosemont, IL, USA), CYP24A1 (cytochrome P450 family 24 subfamily A member 1; 1:500 dilution; Cat#21582‐1‐AP; Proteintech, Rosemont, IL, USA), ATP2B1 (ATPase plasma membrane Ca2+ transporting 1; 1:1000 dilution; Cat#A18688; Abclonal, Wuhan, Hubei, China), STAG2 (stromal antigen 2; 1:1000 dilution; Cat#19837‐1‐AP; Proteintech, Rosemont, IL, USA), CACNG4 (1:1000 dilution; Cat#A14118; Abclonal, Wuhan, Hubei, China), ERK1/2 (1:1000 dilution; Cat#9102; Cell Signaling Technolgy), P‐ERK1/2 (1:1000 dilution; Cat#9101; Cell Signaling Technolgy, Danvers, Massachusetts, USA), Tubulin (1:5000 dilution; Cat#E7; DSHB, lowa city, IA, USA) and β‐actin (1:5000 dilution; Cat#AC026; Abclonal, Wuhan, Hubei, China) after being blocked at 4°C. Proteins were visualized using ECL system following incubation with the secondary antibodies against Goat anti‐Rabbit IgG (H+L) Cross‐Adsorbed Secondary Antibody, HRP (Cat#G21234; Invitrogen, Carlsbad, CA, USA) and Goat anti‐Mouse IgG (H+L) Cross‐Adsorbed Secondary Antibody, HRP (Cat# G21040; Invitrogen, Carlsbad, CA, USA).
2.8. CCK8 (Cell Counting Kit‐8) measurement
Cells (5×10³ cells/well) were seeded in 96‐well plates, and cell viability was measured by using Enhanced Cell Counting Kit‐8 (Cat#C0043; Beyotime, Shanghai, China) for 3 days according to the manufacturer's instruction. Three independent experiments were performed.
2.9. Colony formation assay
Cells (200 cells/well) were seeded in 6‐well plates in triplicate and cultured for 10 days. Cell colonies were fixed with 4% paraformaldehyde for 10‐15 min followed by being stained with Crystal Violet Staining Solution (Cat#C0121; Beyotime, Shanghai, China).
2.10. Cell cycle
Cells (5×10⁴ cells) were washed by PBS and fixed by 70% cold ethanol overnight at 4°C. Then cells were stained with propidium iodide (Cat#C1052; Beyotime, Shanghai, China) and examined by flow cytometry (Cytoflex; Beckman Coulter, Bera, CA, USA) at 488 nm. The data were analyzed by CytExpert software (Beckman Coulter, Bera, CA, USA).
2.11. Cholesterol measurement
Cholesterol were extracted from cells by methanol and chloroform (vol/vol, 1:2) and measured by Amplex Red cholesterol assay kit (Cat#A12216; Invitrogen, Carlsbad, CA, USA) according to manufacturer's instructions.
2.12. Intracellular Ca2+ concentration measurement
Cells (5×10⁴ cells/well) were washed three times by PBS and then incubated with Fluo‐4 fluorescent probe (Cat#S1060; Beyotime, Shanghai, China) away from light at 37°C for 1 h. The signals were collected by operetta high content cytometry (Perkin Eimer, Fremont, CA, USA) at 488 nm.
2.13. Xenograft tumor formation and treatment
Six‐week‐old male nude mice (BALB/cA‐nu/nu) were obtained from Shanghai Experimental Animal Center (Shanghai, China). These mice were maintained in pathogen‐free environment. Stable cell lines (1×10⁶‐5×10⁶ cells in 0.1 mL PBS) were subcutaneously injected into the left flank of nude mice. Tumor size was measured by digital caliper every 3‐5 days after cell injection for one week. Tumor volume was calculated according to the formula: V (mm3) = 0.5 × length × width2. The mice were sacrificed by cervical dislocation before the volume of tumors reached 1000 mm3. Then the tumors were harvested and weighted.
For terbinafine (Cat#HY17395A; MedChemExpress, Shanghai, China) treatment, HT29 and RKO cells (4×10⁶ cells in 0.1 mL PBS) were subcutaneously injected into the left flank of nude mice. Once tumor volumes reached 30 mm3, these mice were divided into control group (PBS containing 5% DMSO) and terbinafine group (50 mg/kg, oral). All animals were used in accordance with the guidelines of the Institution Animal Care and Use Committee of the Institute of Biochemistry and Cell Biology.
2.14. Serum alanine aminotransferase (ALT), aspartate transaminase (AST) and cholesterol test
The serum ALT, AST, cholesterol levels were detected by Automatic Chemistry Analyzer (VITROS 4600; Ortho Clinical Diagnostics, Raritan, NJ, USA) according to manufacturer's instructions.
2.15. Organoid culture and treatment
Normal and tumor organoids were isolated from CRC patients from Yangpu Hospital, Tongji University. Matrigel‐embedded organoids were digested by TrypLE (Cat#12605‐010; Gibco, Carlsbad, CA, USA) and incubated at 37°C for 5 min. Advanced DMEM/F‐12 (Cat#12634‐010; Gibco, Carlsbad, CA, USA) was added and centrifuged at 1000 rpm for 5 min. The pellet was suspended in matrigel and seeded in 24‐well plates. After 2‐3 days, these organoids were incubated with Human Intestinal Stem Cell (HISC) medium (Cat#06010; Stemcell technologies, Vancouver, BC, Canada) in the presence of terbinafine (10, 25, 50 μmol/L). The medium was replaced every 2 days. After 10 days, images of these organoids were captured and analyzed by automatic live cell monitor (BioTek, Winusky, VT, USA. The viability of organoids was measured by using Enhanced Cell Counting Kit‐8 (Cat#C0043; Beyotime, Shanghai, China).
2.16. RNA sequencing (RNA‐seq) and Kyoto Encyclopedia of Genes and Genomes (KEGG) analysis
Differential expression analysis of two groups (two biological replicates per condition) in RNA‐seq was performed using the DESeq2 R package (1.16.1). DESeq2 provide statistical routines for determining differential expression in digital gene expression data using a model based on the negative binomial distribution. The resulting P values were adjusted using the Benjamini and Hochberg's approach for controlling the false discovery rate. Genes with an adjusted P value < 0.05 found by DESeq2 were assigned as differentially expressed.
KEGG is a database resource for understanding high‐level functions and utilities of the biological system, such as the cell, the organism and the ecosystem, from molecular‐level information, especially large‐scale molecular datasets generated by genome sequencing and other high‐through put experimental technologies (http://www.genome.jp/kegg/). We used clusterProfiler R package to test the statistical enrichment of differential expression genes in KEGG pathways.
Gene Set Enrichment Analysis (GSEA) is a computational approach to determine if a pre‐defined Gene Set can show a significant consistent difference between two biological states. The genes were ranked according to the degree of differential expression in the two samples, and then the predefined Gene Set were tested to see if they were enriched at the top or bottom of the list.
2.17. Statistical analysis
The statistical analyses were performed using Graphpad prism software (Graphpad, San Diego, CA, USA). Data are expressed as mean ± standard error of the mean (SEM). An unpaired Student's t test was applied for two groups’ comparison. Multiple group comparisons were analyzed by multiple t tests‐one per row. The correlation between SQLE and CYP24A1 was performed using Pearson chi‐squared test. Overall survival curve was assessed with Kaplan‐Meier and long‐rank test. P < 0.05 was considered statistically significant.
3. RESULTS
3.1. Identification of SQLE as a highly upregulated gene in CRC
To identify genes involved in CRC, we performed RNA‐seq analysis of 8 paired samples of CRC and adjacent normal tissues. The results showed that 6249 genes were upregulated, while 6002 genes were downregulated in CRC tissues (Figure 1A). The number of differentially expressed genes involved in metabolic pathways ranked first (Figure 1B). The top 13 genes upregulated in tumors according to the P value are listed in Figure 1C and Supplementary Table S2, among which SQLE ranked first (9.89‐fold). Considering the important role of SQLE in the generation of cholesterol, we also examined other related genes in the steroid biosynthesis pathway. In addition to SQLE, the remaining genes related to the steroid biosynthesis pathway, such as squalene synthase (FDFT1), cytochrome P450 family 51 subfamily A member 1 (CYP51A1), methylsterol monooxygenase 1 (MSMO1), hydroxysteroid 17‐beta dehydrogenase 7 (HSD17B7), 7‐dehydrocholesterol reductase (DHCR7) and 24‐dehydrocholesterol reductase (DHCR24), were also found to be upregulated (Figure 1D–E and Supplementary Table S3). Subsequent real‐time PCR confirmed the increased expression of SQLE in CRC tissues compared with that in adjacent normal tissues (Figure 1F). Consistent with these observations, SQLE was also upregulated in CRC cell lines, including Caco2, HCT116, HCT15, HT29, LoVo, RKO, SW480, and SW620, compared with its expression in the normal colorectal cell line NCM460 (Figure 1G). Therefore, these results indicate that SQLE is a highly upregulated gene in CRC.
FIGURE 1.

Upregulation of SQLE in CRC patients and CRC cell lines. A. The volcano plots of RNA‐seq analysis between adjacent normal (N1) and CRC tumor tissues (T1), genes in steroid biosynthesis pathway were marked. 6249 genes were up‐regulated, while 6002 genes were down‐regulated. B. The KEGG enrichment pathways between adjacent normal and CRC tumor tissues ranked in gene numbers.
C. The heat map of genes in metabolic pathways. Fragments per kilobase million (FPKM) > 1, log2(fold change) > 2. The red arrow marked SQLE. D. The schematic diagram of steroid biosynthesis pathway, up‐regulated genes marked in red. Terbinafine and NB‐598 are inhibitors of SQLE. E. The differential expressed genes in steroid biosynthesis pathway. T1: CRC tumor tissues; N1: adjacent normal tissues. F. SQLE expression in 8 paired CRC samples by real‐time PCR analysis, housekeeping gene TUBB was used as control. G. SQLE mRNA expression level in normal colorectal cells and CRC cell lines. Normal Colorectal cells (NCM460) was used as control, housekeeping gene ACTB was used loading control. ***, P < 0.001; ns, no significance
3.2. SQLE upregulation was associated with poor CRC prognosis
To further investigate the relationship between SQLE and CRC, we collected more samples from CRC patients. In an additional 13 CRC samples paired with adjacent tissues, the protein levels of SQLE were found to be markedly increased in CRC tissues (Figures 2A and 2B and Supplementary Figure S1). We next collected clinical samples, including 281 CRC tissues and 212 adjacent normal tissues, for TMA analysis. The IHC score of SQLE was significantly higher in CRC tissues than in adjacent normal tissues (Figure 2C). Moreover, the expression of SQLE was higher in stage I/II/III tumor than in stage IV (Figure 2D), indicating a pathological association of SQLE with the initiation but not metastasis of CRC. However, SQLE expression did not differ by sex (Figure 2E). IHC staining of adjacent normal tissues and CRC tissues (SQLElow/SQLEhigh) is shown in Figure 2F. In all these samples, 175 adjacent normal tissues and CRC tissues were paired. SQLE was upregulated in 85.14% of paired CRC samples (Figure 2G). Moreover, CRC patients with higher SQLE expression had shorter overall survival (Figure 2H). These results indicate that SQLE is upregulated in CRC and associated with poor prognosis.
FIGURE 2.

SQLE upregulation was associated with poor CRC prognosis. A. SQLE protein level (two bands, marked in red stars) in 13 paired CRC samples by Western blotting analysis. T: CRC tumor tissues; N: Adjacent normal tissues. B. SQLE/Tubulin ratio in A. C. IHC score of SQLE in adjacent normal (n = 212) and CRC tumor tissues (n = 281) from TMA. Mean ± SD; ***, P < 0.001. D. SQLE expression in different TNM grades from TMA. Mean ± SD; *, P < 0.05. E. SQLE expression in different gender from TMA. Mean ± SD; ns, no significance. F. SQLE expression in adjacent normal and CRC tumor tissues (SQLElow and SQLEhigh) in CRC tumor tissues by IHC analysis. Score 0‐7 assigned to the low expression level, while score 8‐12 assigned to the high expression level. The enlarged images were shown below. Scale bars, 10 μm. G. The distribution proportion of T > N, T = N, T < N in 175 paired CRC samples. T: the IHC score of SQLE in CRC tumor tissues. N: the IHC score of SQLE in adjacent normal tissues. H. Kaplan‐Meier survival analysis of overall survival in 218 CRC patients with SQLE low expression and 63 CRC patients with SQLE high expression
3.3. SQLE promoted CRC cell proliferation in vitro
To explore the importance of SQLE in CRC, we constructed HT29 and RKO stable cell lines with SQLE knockdown in these cells via shRNA interference and confirmed the knockdown efficiency by real‐time PCR and Western blotting (Figures 3A and 3B and Supplementary Figure S2A‐B). Knockdown of SQLE (SQLE KD) in HT29 cells markedly inhibited cell viability and colony formation (Figure 3C–E). Knockdown of SQLE in RKO cells also slightly inhibited cell viability and significantly suppressed colony formation (Figure 3F–H). To further investigate the effect of SQLE on cancer cell growth, we constructed SQLE‐overexpressing (SQLE OE) HT29 and SQLE‐overexpressing RKO stable cell lines by using a lentivirus vector and examined the expression of SQLE by real‐time PCR and Western blotting (Figures 3I and 3J and Supplementary Figure S2C‐D). Overexpression of SQLE in HT29 and RKO cells promoted cell proliferation and colony formation (Figure 3K–P). In addition, knockdown of SQLE in HT29 cells induced G0/G1 phase arrest from 74.2% to 84.9% with a concomitant decrease in G2/M phase from 17.1% to 5.9% (Figures 3Q and 3R). Overexpression of SQLE in HT29 cells induced decreases in G0/G1 phase and S phase with a concomitant increase in G2/M phase (Figures 3S and 3T). Note that knockdown of SQLE decreased the expression of STAG2, which is required for the cohesion of sister chromatids during mitosis [29], explaining the decline in G2/M phase (Figure 3U). Taken together, these data suggest that SQLE stimulates CRC cell proliferation by accelerating the cell cycle.
FIGURE 3.

SQLE accelerated the proliferation of CRC cells in vitro. A‐B. SQLE protein levels in HT29 (A) or RKO (B) cells after knockdown of SQLE (SQLE KD) were accessed by Western blotting analysis. shcontrol was served as control. C. Cell viabilities of HT29 cells after knockdown of SQLE (SQLE KD) were accessed by CCK8 assay. shcontrol was served as control. D‐E. Colony formation of HT29 cells after knockdown of SQLE (SQLE KD). shcontrol was served as control. F. Cell viabilities of RKO cells after knockdown of SQLE (SQLE KD) were accessed by CCK8 assay. shcontrol was served as control. G‐H. Colony formation of RKO cells after knockdown of SQLE (SQLE KD). shcontrol was served as control. I‐J. SQLE protein levels in HT29 (I) or RKO (J) cells after overexpression of SQLE (SQLE OE) were accessed by Western blotting analysis. Vector was served as control. K. Cell viabilities of HT29 cells after overexpression of SQLE (SQLE OE) were accessed by CCK8 assay. Vector was served as control. L‐M. Colony formation of HT29 cells after overexpression of SQLE (SQLE OE). Vector was served as control. N. Cell viabilities of RKO cells after overexpression of SQLE (SQLE OE) were accessed by CCK8 assay. Vector was served as control. O‐P. Colony formation of RKO cells after overexpression of SQLE (SQLE OE). Vector was served as control. Q‐R. Cell cycle analysis (G0/G1, S, G2/M phase) of HT29 cells after knockdown of SQLE (SQLE KD). shcontrol was served as control. S‐T. Cell cycle analysis (G0/G1, S, G2/M phase) of HT29 cells after overexpression of SQLE (SQLE OE). Vector was served as control. U. SQLE, NCEH1, LIPA, CYP24A1 and STAG2 protein level in shcontrol and SQLE KD HT29 cells by Western blotting analysis. β‐actin was used as loading control.
Mean ± SEM. *, P < 0.05; **, P < 0.01; ***, P < 0.001; ns, no significance
3.4. SQLE promoted tumor growth of CRC cells
To investigate the function of SQLE in tumor growth in vivo, shcontrol HT29 or SQLE KD HT29 cells were injected into the left flank of nude mice. Tumor formation was monitored after one week, and tumor sizes were measured every 3‐5 days. Thirty‐five days after implantation, the average volume and weight of tumors in mice injected with shcontrol HT29 cells reached 843.20 mm3 and 0.46 g, respectively, while the average volume and weight of tumors of mice injected with SQLE knockdown were reduced by 71.06% and 62.94%, respectively (Figure 4A–C). In contrast, overexpression of SQLE significantly increased the volume and weight of xenograft tumors by 128.13% and 64.15%, respectively (Figure 4D–F). Consistent with these observations, the number of Ki67‐positive cells in tumors derived from SQLE KD HT29 cells was markedly lower than that in the control group injected with shcontrol HT29 cells, while this number was significantly increased in tumors overexpressing SQLE (Figure 4G–I). Together, these results showed that SQLE promotes CRC tumor growth.
FIGURE 4.

SQLE promoted CRC tumor formation in vivo. A. Tumor growth curve of shcontrol and SQLE KD HT29 cells in nude mice after injection. B‐C. Images (B) and weights (C) of the tumors harvested from nude mice in A were shown. Scale bars, 5 mm. D. Tumor growth curve of vector and SQLE OE HT29 cells in nude mice after injection. E‐F. Images (E) and weights (F) of the tumors harvested from nude mice in D were shown. Scale bars, 5 mm. G‐I. IHC analysis of Ki67 expression in shcontrol, SQLE KD HT29, vector, and SQLE OE HT29 cells‐derived xenograft tumors. The enlarged images were shown below, scale bars, 10 μm. Mean ± SEM. *, P < 0.05; **, P < 0.01; ***, P < 0.001. KD, knockdown; OE, over expression
3.5. Deficiency of SQLE reduced the levels of CYP24A1 and calcitriol
To further explore the molecular mechanism by which SQLE promotes CRC cell proliferation, we analyzed the differential gene expression between shcontrol and SQLE KD HT29 cells by employing RNA‐seq. RNA‐seq analysis showed that 1516 genes were upregulated, while 1376 genes were downregulated in SQLE KD HT29 cells (Figure 5A). Interestingly, knockdown of SQLE modified the vitamin D3 synthesis pathway (Figure 5B), which is involved in the steroid biosynthesis pathway, by reducing the expression of cytochrome P450 family 24 subfamily A member 1 (CYP24A1) (Figure 5C and Figure 3U). Notably, knockdown of SQLE reduced the level of cholesterol (Figure 5D) with significantly increased expression of genes, including LIPA and neutral cholesterol ester hydrolase 1 (NCEH1) (Figure 5C). LIPA is a lysosomal acid lipase that catalyzes cholesterol esters and triglycerides and promotes cholesterol clearance [30]. NCEH1 plays a critical role in the hydrolysis of cholesterol esters in human and murine macrophages [31, 32, 33]. Consistently, the protein levels of LIPA and NCEH1 were also increased in SQLE KD HT29 cells (Figure 3U).
FIGURE 5.
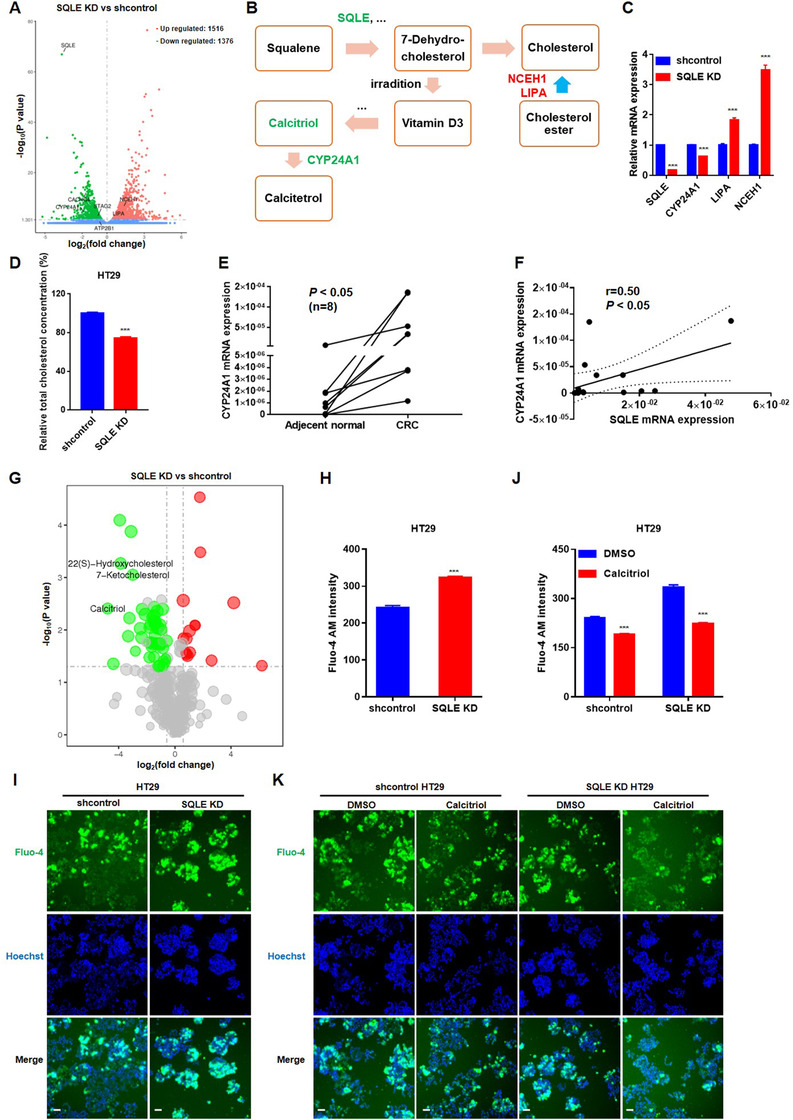
Knockdown of SQLE reduced the levels of CYP24A1 and calcitriol. A. The volcano plots of RNA‐seq analysis between shcontrol and SQLE KD HT29 cells. 1516 genes were up‐regulated, while 1376 genes were down‐regulated. SQLE, CYP24A1, CACNG4, STAG2, ATP2B1, NCEH1, LIPA were marked. B. The schematic diagram of Vitamin D3 synthesis. Down‐regulated genes are marked in green; up‐regulated genes are marked in red. C. The relative mRNA expressions of SQLE, CYP24A1, LIPA and NCEH1 in shcontrol and SQLE KD HT29 cells. D. Intracellular cholesterol level of shcontrol and SQLE KD HT29 cells by cholesterol measurement. E. CYP24A1 expression in 8 paired CRC samples by real‐time PCR analysis. F. The correlation between SQLE and CYP24A1 in 8 paired CRC samples by linear regression analysis. G. The volcano plots of untargeted metabolomics analysis between shcontrol and SQLE KD HT29 cells, 22(S)‐Hydroxycholesterol, 7‐Ketocholesterol and calcitriol were marked. H‐I. Intracellular Ca2+ concentration of shcontrol and SQLE KD HT29 cells. J‐K. Intracellular Ca2+ concentration of shcontrol and SQLE KD HT29 cells with calcitriol treatment (0.5 μmol/L). DMSO was used as control. Fluo‐4 probe and Hoechst represented calcium signal and nucleus, respectively. Scale bars, 50 μm. Mean ± SEM. ***, P < 0.001; ns, no significance. KD, knockdown
Vitamin D3 is produced from 7‐dehydrocholesterol upon irradiation [34]. The mitochondrial inner membrane cytochrome P‐450 enzyme CYP24A1 degrades calcitriol (1α,25‐dihydroxyvitamin D3) to calcitetrol (1α,24,25‐trihydroxyvitamin D3) via hydroxylation of the side chain [35]. Calcitriol supplementation also induced the expression of CYP24A1 in colorectal cells [36, 37]. Previous studies have found a high copy number of CYP24A1 in human CRC [38, 39, 40] and showed that CYP24A1 overexpression led to elevated aggressiveness and proliferation potential of colorectal tumors in mice [41]. In our preliminary RNA‐seq analysis of 8 paired CRC samples, CYP24A1 also showed upregulation in CRC tumor tissues. This was then confirmed by real‐time PCR (Figure 5E). More importantly, linear regression analysis showed that SQLE had a positive correlation with CYP24A1 (Figure 5F).
Next, we performed untargeted metabolomics analysis to probe the alteration of different metabolites upon knockdown of SQLE. As shown in Figure 5G, 47 metabolites were downregulated, while 15 metabolites were upregulated after knockdown of SQLE. The concentrations of cholesterol derivatives, such as 22(S)‐hydroxycholesterol and 7‐ketocholesterol, were lower in SQLE KD HT29 cells than in shcontrol cells, indicating reduced cholesterol levels (Figure 5D). Interestingly, calcitriol exhibited a significant decline (0.036‐fold change) in SQLE KD HT29 cells compared with shcontrol cells (Figure 5G, Supplementary Table S4), which led to a decrease in CYP24A1 expression. To confirm the decrease in calcitriol levels in SQLE KD HT29 cells, we detected the concentration of cellular calcium. By using the Fluo‐4 fluorescence probe, we discovered that the cellular calcium concentration increased dramatically in SQLE KD HT29 cells with low levels of calcitriol (Figures 5H and 5I). Then, supplementation with calcitriol reduced the concentration of cellular calcium in SQLE KD HT29 cells to the level in shcontrol HT29 cells (Figures 5J and 5K). Taken together, these results revealed that knockdown of SQLE reduced the levels of cholesterol and calcitriol followed by downregulation of CYP24A1 expression.
3.6. Calcitriol and CYP24A1 restored the growth of SQLE KD HT29 cells through MAPK signaling
To assess the roles of cholesterol and calcitriol in the promotion of CRC cell proliferation by SQLE, we added cholesterol and calcitriol to SQLE KD HT29 cells. A high concentration of cholesterol partially rescued the proliferation of SQLE KD HT29 cells (Supplementary Figure S3), while a low concentration of calcitriol completely rescued proliferation (Figures 6A and 6B). These findings suggest that calcitriol is a more essential metabolite than cholesterol. Calcitriol has antitumor activities only if CYP24A1 levels are normal; however, HT29 cells are calcitriol‐resistant [42, 43]. Thus, our results also suggest that knockdown of SQLE resensitizes HT29 cells towards calcitriol. Similarly, overexpression of CYP24A1 also rescued the proliferation and colony formation of SQLE KD HT29 cells (Figure 6C–E). In contrast, knockdown of CYP24A1 further inhibited the proliferation of SQLE KD HT29 cells (Figure 6F, Supplementary Figure S4A and B.
FIGURE 6.
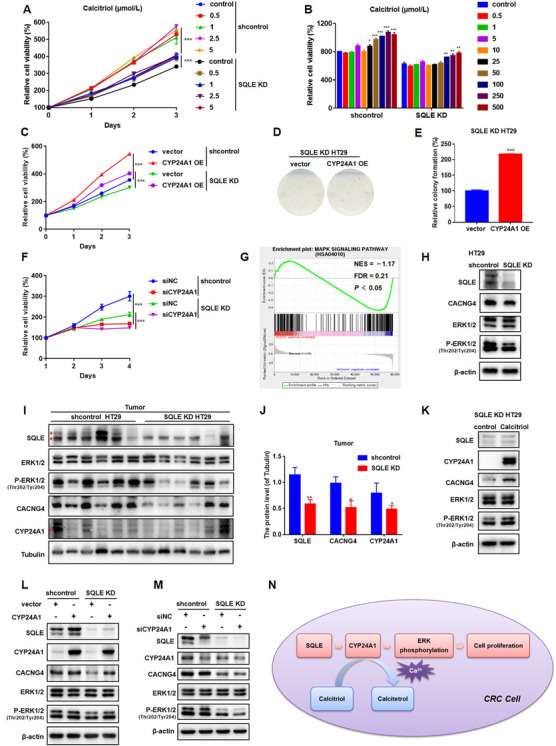
Calcitriol and CYP24A1 restored the growth of SQLE KD HT29 cells through MAPK signaling. A. Cell viabilities of shcontrol and SQLE KD HT29 cells treated with calcitriol at 0.5, 1, 2.5, 5 μmol/L. DMSO was used as control. B. Cell viabilities of shcontrol and SQLE KD HT29 cells treated with calcitriol at 0.5, 1, 5, 10, 25, 50, 100, 250, 500 nmol/L for 96 h. DMSO was used as control. C. CYP24A1 was over‐expressed in shcontrol and SQLE KD HT29 cells. Cell viabilities of these cells were measured by CCK8. D‐E. CYP24A1 was over‐expressed in SQLE KD HT29 cells. Colony formation of these cells was measured. F. CYP24A1 was knocked down in shcontrol and SQLE KD HT29 cells. Cell viabilities of these cells were measured by CCK8. NC: negative control. G. GSEA set of MAPK signaling pathway by knockdown of SQLE in HT29 cells. H. The protein expression levels of SQLE, CACNG4, ERK1/2 and phosphorylation of ERK1/2 in shcontrol and SQLE KD HT29 cells were accessed by Western blotting. β‐actin was used as a loading control. I‐J. The protein expression levels of SQLE, CACNG4, CYP24A1, ERK1/2 and phosphorylation of ERK1/2 in shcontrol and SQLE KD HT29 xenograft tumors were accessed by Western blotting. Tubulin was used as a loading control. K. The protein expression levels of SQLE, CACNG4, CYP24A1, ERK1/2 and phosphorylation of ERK1/2 in SQLE KD HT29 cells treated with calcitriol (0.5 μmol/L) were accessed by Western blotting. DMSO was used as control. L‐M. The protein expression levels of SQLE, CACNG4, CYP24A1, ERK1/2 and phosphorylation of ERK1/2 in the cells used in C and F were accessed by Western blotting. N. Schematic diagram showing molecular mechanism of SQLE promoting CRC proliferation. SQLE increases the levels of calcitriol and CYP24A1.Then MAPK signaling is induced to accelerate CRC tumor growth.
Mean ± SEM. *, P < 0.05; **, P < 0.01; ***, P < 0.001. KD, knockdown
SQLE is known to promote mitogen‐activated protein kinase (MAPK) signaling in lung [44, 45] and breast cancers [44, 45]. In the RNA‐seq analysis, we also found that the MAPK signaling pathway was downregulated (Figure 6G). Extracellular signal‐regulated kinase (ERK) signaling is well established as playing an important role in the regulation of cell growth and CRC [46, 47, 48]. The Ras‐Raf‐MEK‐ERK cascade can not only be activated by growth factors but also respond to intracellular calcium levels [49]. Here, we found that calcium voltage gated channel auxiliary subunit gamma 4 (CACNG4), which plays an important role in cell proliferation through the calcium‐dependent mitogenic signaling pathway [50], was downregulated in SQLE KD HT29 cells (Figure 6H, Supplementary Figure S5A). TCGA analysis showed that the elevated expression of CACNG4 was correlated with poor survival of CRC patients (Supplementary Figure S5B). Furthermore, overexpression of CACNG4 rescued the proliferation of SQLE KD HT29 cells (Supplementary Figure S6A‐D). Conversely, knockdown of CACNG4 further inhibited the proliferation of SQLE KD HT29 cells (Supplementary Figures S4B, S4C S6E, and S6F).
To confirm the regulation of MAPK signaling by SQLE, we detected the phosphorylation of ERK. Knockdown of SQLE reduced the phosphorylation of ERK in both HT29 cells and xenograft tumors (Figures 6H and 6I). In xenograft tumors, the expression of CACNG4 and CYP24A1 decreased in the context of SQLE deficiency (Figures 6I and 6J, Supplementary Figure S7). Additionally, supplementation with calcitriol and overexpression of CYP24A1 restored the phosphorylation of ERK in SQLE KD HT29 cells (Figures 6K and 6L). CYP24A1 deficiency further suppressed ERK phosphorylation in SQLE KD HT29 cells (Figure 6M). However, CACNG4 did not restore the phosphorylation of ERK after knockdown of SQLE (data not shown). Together, these data demonstrate that SQLE activates calcitriol/CYP24A1‐mediated MAPK signaling to promote CRC cell growth (Figure 6N).
3.7. Terbinafine and NB‐598 inhibited proliferation of CRC cells
Finally, we evaluated the potential antitumor effect of terbinafine, an SQLE inhibitor that is widely used to treat fungal infections in the clinic. A total of 10 CRC cell lines (HT29, RKO, SW620, LoVo, Caco2, HCT116, HCT15, SW480, DLD1, and LS174T) were treated with terbinafine at concentrations of 10, 25, and 50 μmol/L. Among these CRC cell lines, terbinafine (50 μmol/L) markedly suppressed the viability of HT29, RKO, SW620, LoVo, and Caco2 cells (Figure 7A). Terbinafine (50 μmol/L) also significantly reduced colony formation of all 10 CRC cell lines (Figures 7B and 7C). Moreover, terbinafine induced G0/G1 phase arrest (from 64.8% to 79.1%) with concomitant decreases in S phase (from 10.5% to 6.4%) and G2/M phase (from 24.7% to 14.5%) in contrast to the DMSO group in HT29 cells (Figures 7D and 7E). The concentration of total cholesterol in HT29 and RKO cells decreased with terbinafine treatment (Figure 7F).
FIGURE 7.

Terbinafine inhibited CRC cell proliferation by decreasing cholesterol biosynthesis and retarding the cell cycle. A. Cell viabilities of CRC cell lines treated with terbinafine at 10, 25, 50 μmol/L were accessed by CCK8 assay. DMSO was used as control. B‐C. Colony formation of CRC cell lines treated with terbinafine at 50 μmol/L. DMSO was used as control. D‐E. Cell cycle analysis (G0/G1, S, G2/M phase) of HT29 cells treated with terbinafine at 10, 25, 50 μmol/L. DMSO was used as control. F. Intracellular cholesterol levels of HT29 or RKO cells treated with terbinafine at 10, 25, 50 μmol/L were accessed by cholesterol measurement. DMSO was used as control.Mean ± SEM. *, P < 0.05; ***, P < 0.001
Subsequently, we assessed the therapeutic effect of NB‐598, another inhibitor that is highly specific for mammalian SQLE [51]. Similarly, NB‐598 suppressed the proliferation of all 10 CRC cell lines (Supplementary Figure S8). Moreover, NB‐598 inhibited the proliferation and disrupted the cell cycle of SQLE KD HT29 cells (Supplementary Figure S9). Together, these results indicate that pharmacological targeting of SQLE with inhibitors, such as terbinafine and NB‐598, can indeed suppress CRC cell proliferation.
3.8. Terbinafine suppressed the growth of CRC organoids and xenograft tumors
To further evaluate the antitumor efficacy of terbinafine, we applied models of patient‐derived tumor organoids and xenograft tumors. Organoids have notable advantages, such as capturing anatomical and even functional hallmarks of real organs and remaining genetically and phenotypically stable, and are used as in vitro 3‐dimentional models for researching physiological human cancers and developing cancer treatments [52, 53, 54]. Terbinafine markedly reduced organoid numbers and inhibited cell viability at a concentration of 50 μmol/L (Figure 8A–C). Additionally, terbinafine inhibited the size of HT29 and RKO‐derived xenograft tumors up to 57.70% and 38.80%, respectively (Figure 8D–G), with no apparent adverse effects on liver functions (Supplementary Figure S10). The weights of HT29 and RKO xenograft tumors were reduced by 42.70% and 43.73%, respectively, upon terbinafine treatment (Figure 8H). In addition, terbinafine lowered the level of serum cholesterol and the number of Ki67‐positive cells in mice bearing HT29‐ or RKO‐derived xenograft tumors (Figure 8I–K). Collectively, these data suggest that pharmacological inhibition of SQLE is a promising approach for CRC treatment.
FIGURE 8.

Terbinafine suppressed the growth of CRC organoids and xenograft tumors. A‐B. Representative images of 2 human CRC organoids treated with terbinafine at 10, 25, 50 μmol/L (A). The number of organoids is summarized in B. DMSO was used as control. Scale bars, 50 μm. C. Cell viabilities of 2 human tumor organoids treated with terbinafine at 10, 25, 50 μmol/L were accessed by CCK8 measurement. DMSO was used as control. D. Tumor growth curve of HT29 cells treated with terbinafine (oral, 50 mg/kg) in nude mice. E. Images of the xenograft tumors harvested from nude mice in D. Scale bars, 5 mm. F. Tumor growth curve of RKO cells treated with terbinafine (oral, 50 mg/kg) in nude mice. G. Images of the xenograft tumors harvested from nude mice in F. Scale bars, 5 mm. H. Weights of the xenograft tumors in E and G. I. Concentrations of serum cholesterol in nude mice which were bearing HT29 or RKO cells‐derived xenograft tumors and treated with terbinafine (oral, 50 mg/kg). J‐K. IHC analysis of Ki67 in HT29 and RKO cells‐derived xenograft tumors and treated with terbinafine (oral, 50 mg/kg). The enlarged images were shown below. Scale bars, 10 μm.
Mean ± SEM. *, P < 0.05; **, P < 0.01; ***, P < 0.001
4. DISCUSSION
Aberrant metabolism, including metabolic enzyme mutations and abnormal metabolic gene expression, is a hallmark of CRC [55] The enzymes involved in metabolic processes are under active investigation as promising therapeutic targets for CRC treatment through dietary and pharmacological interventions. In this study, we found that SQLE, the secondary rate‐limiting enzyme of cholesterol biosynthesis, was upregulated in tumor tissues of CRC patients. Additionally, the patients with high levels of SQLE had shorter survival. Then, we investigated the functions and molecular mechanisms of SQLE in CRC. We found that SQLE promoted CRC cell proliferation in vitro and in vivo; inhibition of SQLE decreased the levels of cholesterol and calcitriol/CYP24A1, and thereby restrained MAPK signaling. Finally, the SQLE inhibitors terbinafine and SQLE could suppress CRC growth.
Recent studies have identified cholesterol as a novel signaling molecule in tumorigenesis [56]. Targeting cholesterol biosynthesis and cholesterol esterification has been proposed as a promising therapy for cancer treatment [57]. Since HMGCR and SQLE are two rate‐limiting enzymes of cholesterol biosynthesis, they attract much attention as potential targets [58]. SQLE has been found to be upregulated significantly in numerous tumors, such as breast, prostate and liver cancer, with its upregulation being positively correlated with poor prognosis [59, 60, 61]. Our current work revealed that SQLE was upregulated in CRC and that such upregulation was associated with shorter survival of CRC patients. During the preparation of this manuscript, an independent research group reported that the reduction in SQLE caused by cholesterol accumulation accelerated CRC progression and metastasis. That work showed that SQLE was upregulated in CRC patients but decreased during the progression of CRC. In stage IV CRC, in which tumors spread from the colon/rectum, patients with low SQLE expression had shorter survival than those with high SQLE expression [62]. Consistent with their study, we also found that the expression levels of SQLE were much higher in patients with stage I/II/III disease than in those with stage IV disease, indicating a functional role of SQLE in the early stage of CRC. SQLE depletion was found to activate the β‐catenin pathway and disrupt the P53 tumor‐suppressor pathway in epithelial‐mesenchymal transition [62]. Our work showed that SQLE was required to promote CRC cell proliferation through calcitriol/CYP24A1‐mediated MAPK signaling. Together, these results establish a tumor‐promoting effect of SQLE in CRC and indicate that SQLE most likely acts through multiple mechanisms.
In this study, we discovered a functional correlation between SQLE and calcitriol/CYP24A1. Our data showed that SQLE deficiency reduced the level of intracellular cholesterol and simultaneously lowered the level of calcitriol/CYP24A1 in HT29 cells. The metabolite calcitriol was more essential than cholesterol in the promotion of CRC proliferation by SQLE. CYP24A1 was upregulated by SQLE to promote the proliferation of HT29 cells. SQLE is known to promote ERK signaling in other types of cancers [44, 45]. Our research further showed that SQLE activated CYP24A1‐mediated ERK signaling in CRC. CACNG4 was also upregulated by SQLE to promote the proliferation of HT29 cells, which may respond to changing levels of calcitriol and cellular calcium. Nevertheless, CACNG4 was not involved in the activation of ERK signaling by SQLE.
Notably, terbinafine, a small molecular inhibitor targeting SQLE, effectively suppressed CRC proliferation. As a drug used to treat superficial mycosis, terbinafine is now being considered a cancer treatment. Indeed, combined treatment with terbinafine and nocodazole induced cell cycle arrest and apoptosis in tumor cells [63]. Additionally, terbinafine inhibited angiogenesis by suppressing endothelial cell proliferation and migration [64, 65]. In our research, terbinafine suppressed the growth of patient‐derived organoids and inhibited the proliferation of CRC cells in vitro and in vivo. Further verification of terbinafine efficacy is needed by conducting experiments with more human tumor organoids. NB‐598 is a specific inhibitor of human SQLE, and our study showed a much stronger inhibitory effect on CRC proliferation than terbinafine. Nevertheless, NB‐598 is a preclinical drug without much safety and pharmacological data. The pharmacological action and clinical trials of both terbinafine and NB‐598 in CRC warrant further study.
Nevertheless, there are a few limitations to our work. The mechanism through which SQLE influences the expression of CYP24A1 needs to be investigated. Further studies, such as establishing orthotopic tumor model and transgenic mice remain to be carried out to confirm the function of SQLE in CRC.
5. CONCLUSIONS
In conclusion, this study dissected the functions of SQLE in CRC and revealed its effects on the promotion of cell proliferation in CRC through calcitriol/CYP24A1‐mediated MAPK signaling. SQLE inhibitor terbinafine could be a promising therapy for CRC.
DECLARATIONS
ETHICS APPROVAL AND CONSENT TO PARTICIPATE
This work was approved by the Ethics Committee at the Yangpu Hospital, Tongji University (Shanghai, China). Written informed consent was obtained from all patients. All animal experiments were performed in accordance with the guidelines of the Institution Animal Care and Use Committee of the Institute of Biochemistry and Cell Biology (Shanghai, China).
CONSENT FOR PUBLICATION
Not applicable.
AVAILABILITY OF DATA AND MATERIALS
The RNA‐seq data have been submitted to Sequence Read Archive (SRA). BioProject ID: PRJNA737171, http://www.ncbi.nlm.nih.gov/bioproject/737171; BioProject ID: PRJNA737203, http://www.ncbi.nlm.nih.gov/bioproject/737203. The untargeted metabolomics data have been submitted to MetaboLights (http://www.ebi.ac.uk/metabolights/MTBLS2937). The data that support the findings of this study are available from the corresponding authors upon reasonable request.
COMPETING INTERESTS
The authors declare that they have no competing interests.
AUTHORS' CONTRIBUTIONS
L.H. designed research concept, conducted experiments, analyzed data, and wrote the manuscript. H.L. offered samples of CRC patients. C.P. offered human CRC organoids. Y.H. and J.P. offered technical support. Z.Z. discussed and edited the manuscript. Y.Z. and M.L. supervised the study and edited the manuscript. All authors read and approved the final manuscript.
Supporting information
Supporting Information
figureS1
figureS2
figureS3
figureS4
figureS5
figureS6
figureS7
figureS8
figureS9
figureS10
ACKNOWLEDGEMENTS
We are deeply grateful to molecular biology technology platform, cell analysis technology platform, chemical biology technology platform and animal experiment technology platform in CAS Center for Excellence in Molecular Cell Science. We thank clinical research and translational medicine center of Yangpu Hospital for offering CRC samples and making TMA. This work was funded by the National Natural Science Foundation of China (31630047, 81874201, and 81725014), the Natural Science Foundation of Shanghai (20ZR1452300), Shanghai Municipal Health Bureau (201840359), and The National Key Research and Development Program of China (2020YFA0509000 and 2017YFA0503600).
He L, Li H, Pan C, Hua Y, Peng J, Zhou Z, et al. Squalene epoxidase promotes colorectal cancer cell proliferation through accumulating calcitriol and activating CYP24A1‐mediated MAPK signaling. Cancer Commun. 2021;41:726–746. 10.1002/cac2.12187
Contributor Information
Luwei He, Email: medichembio1992@163.com.
Yun Zhao, Email: yunzhao@sibcb.ac.cn.
Moubin Lin, Email: lmbin@hotmail.com.
REFERENCES
- 1.Siegel RL, Miller KD, Jemal A. Cancer statistics, 2019. CA Cancer J Clin. 2019;69(1):7–34. [DOI] [PubMed] [Google Scholar]
- 2.Siegel RL, Miller KD, Jemal A. Cancer statistics, 2020. CA Cancer J Clin. 2020;70(1):7–30. [DOI] [PubMed] [Google Scholar]
- 3.Carvalho C, Glynne‐Jones R. Challenges behind proving efficacy of adjuvant chemotherapy after preoperative chemoradiation for rectal cancer. Lancet Oncol. 2017;18(6):e354–e63. [DOI] [PubMed] [Google Scholar]
- 4.Ricciardiello L, Ahnen DJ, Lynch PM. Chemoprevention of hereditary colon cancers: time for new strategies. Nat Rev Gastroenterol Hepatol. 2016;13(6):352–61. [DOI] [PubMed] [Google Scholar]
- 5.Sveen A, Kopetz S, Lothe RA. Biomarker‐guided therapy for colorectal cancer: strength in complexity. Nat Rev Clin Oncol. 2020;17(1):11–32. [DOI] [PMC free article] [PubMed] [Google Scholar]
- 6.Guinney J, Dienstmann R, Wang X, de Reynies A, Schlicker A, Soneson C, et al. The consensus molecular subtypes of colorectal cancer. Nat Med. 2015;21(11):1350–6. [DOI] [PMC free article] [PubMed] [Google Scholar]
- 7.Linnekamp JF, Hooff SRV, Prasetyanti PR, Kandimalla R, Buikhuisen JY, Fessler E, et al. Consensus molecular subtypes of colorectal cancer are recapitulated in in vitro and in vivo models. Cell Death Differ. 2018;25(3):616–33. [DOI] [PMC free article] [PubMed] [Google Scholar]
- 8.Fontana E, Eason K, Cervantes A, Salazar R, Sadanandam A. Context matters—consensus molecular subtypes of colorectal cancer as biomarkers for clinical trials. Ann Oncol. 2019;30(4):520‐7. [DOI] [PMC free article] [PubMed] [Google Scholar]
- 9.Counihan JL, Grossman EA, Nomura DK. Cancer Metabolism: Current Understanding and Therapies. Chem Rev. 2018;118(14):6893–923. [DOI] [PubMed] [Google Scholar]
- 10.Pavlova NN, Thompson CB. The Emerging Hallmarks of Cancer Metabolism. Cell Metab. 2016;23(1):27–47. [DOI] [PMC free article] [PubMed] [Google Scholar]
- 11.Vander Heiden MG, DeBerardinis RJ. Understanding the Intersections between Metabolism and Cancer Biology. Cell. 2017;168(4):657–69. [DOI] [PMC free article] [PubMed] [Google Scholar]
- 12.Deberardinis RJ, Chandel NS. Fundamentals of cancer metabolism. Sci Adv. 2016;2(5):e1600200. [DOI] [PMC free article] [PubMed] [Google Scholar]
- 13.Jiang H, Zhu L, Xu D, Lu Z. A newly discovered role of metabolic enzyme PCK1 as a protein kinase to promote cancer lipogenesis. Cancer Commun (Lond). 2020;40(9):389–94. [DOI] [PMC free article] [PubMed] [Google Scholar]
- 14.DeBerardinis RJ, Mancuso A, Daikhin E, Nissim I, Yudkoff M, Wehrli S, et al. Beyond aerobic glycolysis: transformed cells can engage in glutamine metabolism that exceeds the requirement for protein and nucleotide synthesis. Proc Natl Acad Sci U S A. 2007;104(49):19345–50. [DOI] [PMC free article] [PubMed] [Google Scholar]
- 15.Chen R, Zou Y, Mao D, Sun D, Gao G, Shi J, et al. The general amino acid control pathway regulates mTOR and autophagy during serum/glutamine starvation. J Cell Biol. 2014;206(2):173–82. [DOI] [PMC free article] [PubMed] [Google Scholar]
- 16.Menendez JA, Lupu R. Fatty acid synthase and the lipogenic phenotype in cancer pathogenesis. Nat Rev Cancer. 2007;7(10):763–77. [DOI] [PubMed] [Google Scholar]
- 17.Xiao J, Luo J, Hu A, Xiao T, Li M, Kong Z, et al. Cholesterol transport through the peroxisome‐ER membrane contacts tethered by PI(4,5)P(2) and extended synaptotagmins. Sci China Life Sci. 2019;62(9):1117–35. [DOI] [PubMed] [Google Scholar]
- 18.Chen L, Chen XW, Huang X, Song BL, Wang Y, Wang Y. Regulation of glucose and lipid metabolism in health and disease. Sci China Life Sci. 2019;62(11):1420–58. [DOI] [PubMed] [Google Scholar]
- 19.Hu J, La Vecchia C, de Groh M, Negri E, Morrison H, Mery L, et al. Dietary cholesterol intake and cancer. Ann Oncol. 2012;23(2):491–500. [DOI] [PubMed] [Google Scholar]
- 20.Cruse P, Lewin M, Clark CG. Dietary‐Cholesterol Is Co‐Carcinogenic for Human‐Colon Cancer. Lancet. 1979;1(8119):752‐5. [DOI] [PubMed] [Google Scholar]
- 21.Snaebjornsson MT, Janaki‐Raman S, Schulze A. Greasing the Wheels of the Cancer Machine: The Role of Lipid Metabolism in Cancer. Cell Metab. 2020;31(1):62–76. [DOI] [PubMed] [Google Scholar]
- 22.Yang W, Bai YB, Xiong Y, Zhang J, Chen SK, Zheng XJ, et al. Potentiating the antitumour response of CD8(+) T cells by modulating cholesterol metabolism. Nature. 2016;531(7596):651–55. [DOI] [PMC free article] [PubMed] [Google Scholar]
- 23.Goldstein JL, Brown MS. Regulation of the mevalonate pathway. Nature. 1990;343(6257):425–30. [DOI] [PubMed] [Google Scholar]
- 24.Mullen PJ, Yu R, Longo J, Archer MC, Penn LZ. The interplay between cell signalling and the mevalonate pathway in cancer. Nat Rev Cancer. 2016;16(11):718–31. [DOI] [PubMed] [Google Scholar]
- 25.Nagai M, Sakakibara J, Nakamura Y, Gejyo F, Ono T. SREBP‐2 and NF‐Y are involved in the transcriptional regulation of squalene epoxidase. Biochem Biophys Res Commun. 2002;295(1):74–80. [DOI] [PubMed] [Google Scholar]
- 26.Zelcer N, Sharpe LJ, Loregger A, Kristiana I, Cook ECL, Phan L, et al. The E3 Ubiquitin Ligase MARCH6 Degrades Squalene Monooxygenase and Affects 3‐Hydroxy‐3‐Methyl‐Glutaryl Coenzyme A Reductase and the Cholesterol Synthesis Pathway. Mol Cell Biol. 2014;34(7):1262–70. [DOI] [PMC free article] [PubMed] [Google Scholar]
- 27.Liu D, Wong CC, Fu L, Chen H, Zhao L, Li C, et al. Squalene epoxidase drives NAFLD‐induced hepatocellular carcinoma and is a pharmaceutical target. Sci Transl Med. 2018;10(437):eaap9840. [DOI] [PubMed] [Google Scholar]
- 28.Qin Y, Hou Y, Liu S, Zhu P, Wan X, Zhao M, et al. A Novel Long Non‐Coding RNA lnc030 Maintains Breast Cancer Stem Cell Stemness by Stabilizing SQLE mRNA and Increasing Cholesterol Synthesis. Adv Sci (Weinh). 2021;8(2):2002232. [DOI] [PMC free article] [PubMed] [Google Scholar]
- 29.Kleyman M, Kabeche L, Compton DA. STAG2 promotes error correction in mitosis by regulating kinetochore‐microtubule attachments. J Cell Sci. 2014;127(Pt 19):4225–33. [DOI] [PMC free article] [PubMed] [Google Scholar]
- 30.Sieber MH, Thummel CS. Coordination of triacylglycerol and cholesterol homeostasis by DHR96 and the Drosophila LipA homolog magro. Cell Metab. 2012;15(1):122–7. [DOI] [PMC free article] [PubMed] [Google Scholar]
- 31.Okazaki H, Igarashi M, Nishi M, Sekiya M, Tajima M, Takase S, et al. Identification of neutral cholesterol ester hydrolase, a key enzyme removing cholesterol from macrophages. J Biol Chem. 2008;283(48):33357–64. [DOI] [PMC free article] [PubMed] [Google Scholar]
- 32.Igarashi M, Osuga J‐i, Uozaki H, Sekiya M, Nagashima S, Takahashi M, et al. The Critical Role of Neutral Cholesterol Ester Hydrolase 1 in Cholesterol Removal From Human Macrophages. Circ Res. 2010;107(11):1387–95. [DOI] [PubMed] [Google Scholar]
- 33.Sakai K, Igarashi M, Yamamuro D, Ohshiro T, Nagashima S, Takahashi M, et al. Critical role of neutral cholesteryl ester hydrolase 1 in cholesteryl ester hydrolysis in murine macrophages. J Lipid Res. 2014;55(10):2033‐40. [DOI] [PMC free article] [PubMed] [Google Scholar]
- 34.Christakos S, Dhawan P, Verstuyf A, Verlinden L, Carmeliet G. Vitamin D: Metabolism, Molecular Mechanism of Action, and Pleiotropic Effects. Physiol Rev. 2016;96(1):365–408. [DOI] [PMC free article] [PubMed] [Google Scholar]
- 35.Jones G, Prosser DE, Kaufmann M. 25‐Hydroxyvitamin D‐24‐hydroxylase (CYP24A1): its important role in the degradation of vitamin D. Arch Biochem Biophys. 2012;523(1):9–18. [DOI] [PubMed] [Google Scholar]
- 36.Lechner D, Kállay E, Cross HS. 1α,25‐Dihydroxyvitamin D3 downregulates CYP27B1 and induces CYP24A1 in colon cells. Mol Cell Endocrinol. 2007;263(1):55–64. [DOI] [PubMed] [Google Scholar]
- 37.Di Rosa M, Malaguarnera M, Zanghi A, Passaniti A, Malaguarnera L. Vitamin D3 insufficiency and colorectal cancer. Crit Rev Oncol Hematol. 2013;88(3):594–612. [DOI] [PubMed] [Google Scholar]
- 38.Hobaus J, Hummel DM, Thiem U, Fetahu IS, Aggarwal A, Mullauer L, et al. Increased copy‐number and not DNA hypomethylation causes overexpression of the candidate proto‐oncogene CYP24A1 in colorectal cancer. Int J Cancer. 2013;133(6):1380–8. [DOI] [PMC free article] [PubMed] [Google Scholar]
- 39.Horvath HC, Lakatos P, Kosa JP, Bacsi K, Borka K, Bises G, et al. The candidate oncogene CYP24A1: A potential biomarker for colorectal tumorigenesis. J Histochem Cytochem. 2010;58(3):277–85. [DOI] [PMC free article] [PubMed] [Google Scholar]
- 40.Anderson MG, Nakane M, Ruan X, Kroeger PE, Wu‐Wong JR. Expression of VDR and CYP24A1 mRNA in human tumors. Cancer Chemother Pharmacol. 2006;57(2):234‐40. [DOI] [PubMed] [Google Scholar]
- 41.Hobaus J, Tennakoon S, Heffeter P, Groeschel C, Aggarwal A, Hummel DM, et al. Impact of CYP24A1 overexpression on growth of colorectal tumour xenografts in mice fed with vitamin D and soy. Int J Cancer. 2016;138(2):440–50. [DOI] [PMC free article] [PubMed] [Google Scholar]
- 42.Feldman D, Krishnan AV, Swami S, Giovannucci E, Feldman BJ. The role of vitamin D in reducing cancer risk and progression. Nat Rev Cancer. 2014;14(5):342–57. [DOI] [PubMed] [Google Scholar]
- 43.Bhatia V, Falzon M. Restoration of the anti‐proliferative and anti‐migratory effects of 1,25‐dihydroxyvitamin D by silibinin in vitamin D‐resistant colon cancer cells. Cancer Lett. 2015;362(2):199–207. [DOI] [PMC free article] [PubMed] [Google Scholar]
- 44.Ge H, Zhao Y, Shi X, Tan Z, Chi X, He M, et al. Squalene epoxidase promotes the proliferation and metastasis of lung squamous cell carcinoma cells though extracellular signal‐regulated kinase signaling. Thorac Cancer. 2019;10(3):428–36. [DOI] [PMC free article] [PubMed] [Google Scholar]
- 45.Polycarpou‐Schwarz M, Gross M, Mestdagh P, Schott J, Grund SE, Hildenbrand C, et al. The cancer‐associated microprotein CASIMO1 controls cell proliferation and interacts with squalene epoxidase modulating lipid droplet formation. Oncogene. 2018;37(34):4750–68. [DOI] [PubMed] [Google Scholar]
- 46.Fang JY, Richardson BC. The MAPK signalling pathways and colorectal cancer. Lancet Oncol. 2005;6(5):322–7. [DOI] [PubMed] [Google Scholar]
- 47.Roberts PJ, Der CJ. Targeting the Raf‐MEK‐ERK mitogen‐activated protein kinase cascade for the treatment of cancer. Oncogene. 2007;26(22):3291–310. [DOI] [PubMed] [Google Scholar]
- 48.Boutros T, Chevet E, Metrakos P. Mitogen‐activated protein (MAP) kinase/MAP kinase phosphatase regulation: roles in cell growth, death, and cancer. Pharmacol Rev. 2008;60(3):261–310. [DOI] [PubMed] [Google Scholar]
- 49.Cullen PJ, Lockyer PJ. Integration of calcium and Ras signalling. Nat Rev Mol Cell Biol. 2002;3(5):339–48. [DOI] [PubMed] [Google Scholar]
- 50.Monteith GR, Davis FM, Roberts‐Thomson SJ. Calcium channels and pumps in cancer: changes and consequences. J Biol Chem. 2012;287(38):31666–73. [DOI] [PMC free article] [PubMed] [Google Scholar]
- 51.Padyana AK, Gross S, Jin L, Cianchetta G, Narayanaswamy R, Wang F, et al. Structure and inhibition mechanism of the catalytic domain of human squalene epoxidase. Nat Commun. 2019;10(1). [DOI] [PMC free article] [PubMed] [Google Scholar]
- 52.Rossi G, Manfrin A, Lutolf MP. Progress and potential in organoid research. Nat Rev Genet. 2018;19(11):671–87. [DOI] [PubMed] [Google Scholar]
- 53.Drost J, Clevers H. Organoids in cancer research. Nat Rev Cancer. 2018;18(7):407–18. [DOI] [PubMed] [Google Scholar]
- 54.Clevers H. Modeling Development and Disease with Organoids. Cell. 2016;165(7):1586–97. [DOI] [PubMed] [Google Scholar]
- 55.Hirschey MD, DeBerardinis RJ, Diehl AME, Drew JE, Frezza C, Green MF, et al. Dysregulated metabolism contributes to oncogenesis. Semin Cancer Biol. 2015;35 Suppl:S129–s50. [DOI] [PMC free article] [PubMed] [Google Scholar]
- 56.Xu H, Zhou S, Tang Q, Xia H, Bi F. Cholesterol metabolism: New functions and therapeutic approaches in cancer. Biochim Biophys Acta Rev Cancer. 2020;1874(1):188394. [DOI] [PubMed] [Google Scholar]
- 57.Huang B, Song B‐l, Xu C. Cholesterol metabolism in cancer: mechanisms and therapeutic opportunities. Nature Metabolism. 2020;2(2):132‐41. [DOI] [PubMed] [Google Scholar]
- 58.Feltrin S, Ravera F, Traversone N, Ferrando L, Bedognetti D, Ballestrero A, et al. Sterol synthesis pathway inhibition as a target for cancer treatment. Cancer Lett. 2020;493:19–30. [DOI] [PubMed] [Google Scholar]
- 59.Cirmena G, Franceschelli P, Isnaldi E, Ferrando L, De Mariano M, Ballestrero A, et al. Squalene epoxidase as a promising metabolic target in cancer treatment. Cancer Lett. 2018;425:13–20. [DOI] [PubMed] [Google Scholar]
- 60.Brown DN, Caffa I, Cirmena G, Piras D, Garuti A, Gallo M, et al. Squalene epoxidase is a bona fide oncogene by amplification with clinical relevance in breast cancer. Sci Rep. 2016;6:19435. [DOI] [PMC free article] [PubMed] [Google Scholar]
- 61.Stopsack KH, Gerke TA, Sinnott JA, Penney KL, Tyekucheva S, Sesso HD, et al. Cholesterol Metabolism and Prostate Cancer Lethality. Cancer Res. 2016;76(16):4785–90. [DOI] [PMC free article] [PubMed] [Google Scholar]
- 62.Jun SY, Brown AJ, Chua NK, Yoon JY, Lee JJ, Yang JO, et al. Reduction of squalene epoxidase by cholesterol accumulation accelerates colorectal cancer progression and metastasis. Gastroenterology. 2021;160:1194–1207.e28. [DOI] [PubMed] [Google Scholar]
- 63.Lee W‐S, Chen R‐J, Wang Y‐J, Tseng H, Jeng J‐H, Lin S‐Y, et al. In vitro andin vivo studies of the anticancer action of terbinafine in human cancer cell lines: G0/G1p53‐associated cell cycle arrest. Int J Cancer. 2003;106(1):125–37. [DOI] [PubMed] [Google Scholar]
- 64.Ho PY, Liang YC, Ho YS, Chen CT, Lee WS. Inhibition of human vascular endothelial cells proliferation by terbinafine. Int J Cancer. 2004;111(1):51–9. [DOI] [PubMed] [Google Scholar]
- 65.Ho PY, Zhong WB, Ho YS, Lee WS. Terbinafine inhibits endothelial cell migration through suppression of the Rho‐mediated pathway. Mol Cancer Ther. 2006;5(12):3130–8. [DOI] [PubMed] [Google Scholar]
Associated Data
This section collects any data citations, data availability statements, or supplementary materials included in this article.
Supplementary Materials
Supporting Information
figureS1
figureS2
figureS3
figureS4
figureS5
figureS6
figureS7
figureS8
figureS9
figureS10
Data Availability Statement
The RNA‐seq data have been submitted to Sequence Read Archive (SRA). BioProject ID: PRJNA737171, http://www.ncbi.nlm.nih.gov/bioproject/737171; BioProject ID: PRJNA737203, http://www.ncbi.nlm.nih.gov/bioproject/737203. The untargeted metabolomics data have been submitted to MetaboLights (http://www.ebi.ac.uk/metabolights/MTBLS2937). The data that support the findings of this study are available from the corresponding authors upon reasonable request.