

Abstract
Attributing outcomes to your own actions or to external causes is essential for appropriately learning which actions lead to reward and which actions do not. Our previous work showed that this type of credit assignment is best explained by a Bayesian reinforcement learning model which posits that beliefs about the causal structure of the environment modulate reward prediction errors (RPEs) during action value updating. In this study, we investigated the brain networks underlying reinforcement learning that are influenced by causal beliefs using functional magnetic resonance imaging while human participants (n = 31; 13 males, 18 females) completed a behavioral task that manipulated beliefs about causal structure. We found evidence that RPEs modulated by causal beliefs are represented in dorsal striatum, while standard (unmodulated) RPEs are represented in ventral striatum. Further analyses revealed that beliefs about causal structure are represented in anterior insula and inferior frontal gyrus. Finally, structural equation modeling revealed effective connectivity from anterior insula to dorsal striatum. Together, these results are consistent with a possible neural architecture in which causal beliefs in anterior insula are integrated with prediction error signals in dorsal striatum to update action values.
SIGNIFICANCE STATEMENT Learning which actions lead to reward—a process known as reinforcement learning—is essential for survival. Inferring the causes of observed outcomes—a process known as causal inference—is crucial for appropriately assigning credit to one's own actions and restricting learning to effective action–outcome contingencies. Previous studies have linked reinforcement learning to the striatum, and causal inference to prefrontal regions, yet how these neural processes interact to guide adaptive behavior remains poorly understood. Here, we found evidence that causal beliefs represented in the prefrontal cortex modulate action value updating in posterior striatum, separately from the unmodulated action value update in ventral striatum posited by standard reinforcement learning models.
Keywords: agency, causal inference, fMRI, insula, reinforcement learning, striatum
Introduction
We live in an uncertain environment where making flexible predictions about the occurrence of positive and negative events is necessary for maximizing rewards and minimizing punishments. Predictions are most accurate, and feedback most useful, when our own actions are responsible for the outcomes we receive. Thus, drawing inferences about the causes of outcomes is a critical component of credit assignment for learning.
We recently demonstrated that causal inferences can lead to asymmetric learning from positive and negative outcomes (Dorfman et al., 2019). Specifically, participants downweighted outcomes when they could be attributed to the intervention of a hidden agent. If the participants knew that the agent's interventions tended to produce negative outcomes, then participants learned less from negative relative to positive outcomes. Conversely, if they knew that the interventions of the agent tended to produce positive outcomes, then participants learned less from positive relative to negative outcomes. These results demonstrate that people modulate the extent to which they learn depending on their beliefs about latent causes, and that these beliefs can be experimentally manipulated to produce learning biases.
The learning asymmetries reported in the study by Dorfman et al. (2019) could be explained by a Bayesian model that assigns credit based on probabilistic inference over latent causes. Mechanistically, the model hypothesizes that reward prediction errors (RPEs) are weighted by the probability that the outcome was generated by the participant's choice (rather than the hidden agent intervention). The research reported here sought to test this mechanistic hypothesis using functional MRI.
Prior work in rodents, primates, and humans has shown that RPEs, which represent the difference between expected and received rewards, are encoded by dopaminergic neurons in the midbrain (Schultz et al., 1997), and prediction error information is projected to the striatum and frontal cortex (for review, see Niv, 2009). In human neuroimaging, RPE signals are found in regions of the striatum, prefrontal cortex (PFC), and orbitofrontal cortex (McClure et al., 2003; O'Doherty et al., 2003). Several lines of evidence suggest that striatal RPEs in particular may be sensitive to causal inference. For example, the caudate (dorsomedial striatum) and nucleus accumbens [ventral striatum (VS)] are sensitive to rewards that are chosen rather than passively received (Zink et al., 2004), and both the ventral and dorsal striatum (DS) are preferentially recruited during anticipation of a controllable outcome (compared with an uncontrollable outcome; Leotti and Delgado, 2011; Stolz et al., 2020). Previous work has also shown diminished activation in the putamen (dorsolateral striatum) for trials where people believed they caused a loss (Späti et al., 2015).
To more directly investigate the interplay between causal inference and error-driven updating in the striatum, we measured brain activity in humans while they performed the task developed by Dorfman et al. (2019). We used a combination of model-based univariate analyses and structural equation modeling to map the information-processing architecture posited by the Bayesian model.
Materials and Methods
Participants and data inclusion.
Participants were recruited from the University of California, Riverside, study pool system (SONA Systems). A total of 38 right-handed adults consented to the study, but 7 of these individuals were not included because of unavoidable technical issues that resulted in missing and corrupted data, leaving 31 total participants for the current analyses (age range, 18–24 years; mean age, 19.4 years; 13 males, 18 females). Individual runs were evaluated for excessive head movement (>4 mm) over the duration of the run, but no runs were excluded for movement.
Experimental design and statistical analysis.
The task was presented using PsychoPy software version 1.85.2 (Peirce, 2007) and was displayed on a screen visible through a mirror attached to the head coil. Behavioral responses were collected with an MRI-compatible button box, and all participants used the index and middle finger of their right (dominant) hand to make responses. Before entering the scanner, participants received verbal instructions and completed a practice version of the task.
Participants completed a reinforcement learning task in which they encountered multiple learning environments. This task was modified from our previous behavioral task for use in the scanner (Fig. 1; Dorfman et al., 2019). Participants were instructed to imagine that they were mining for gold in the Wild West. On each trial, participants had to choose between one of two different colored mines using the button box. After making a decision (choice period, 2.5 s), a fixation interstimulus interval (ISI; jittered between 1.5 and 2.5 s) was displayed. Participants then viewed feedback of either a reward (gold) or loss (rocks) for 1.5 s. One mine in a pair had a higher probability of producing a reward. Participants were instructed that each reward yielded a small amount of bonus money, and each loss resulted in a subtraction of bonus money. In actuality, all participants received a $5 bonus at the end of the experiment.
Figure 1.
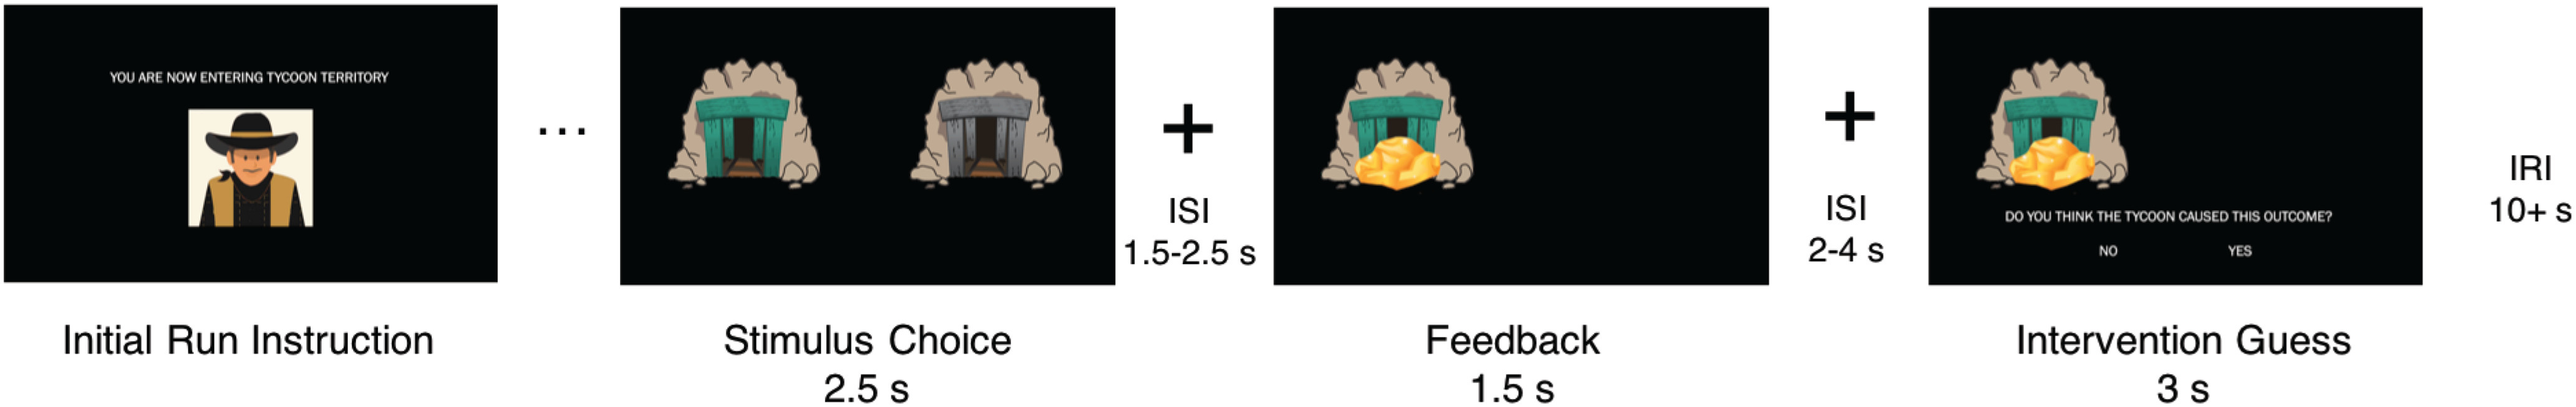
Task schematic. At the start of each run, participants were told which territory they were in (benevolent, “Tycoon”; or adversarial, “Bandit”). Trial components consist of a choice between two stimuli (2.5 s), a fixation ISI (1.5–2.5 s), feedback (win, “Gold”; or loss, “Rocks”; 1.5 s), a fixation ISI (2–4 s), and an intervention guess (3 s). At the end of each run, a fixation inter-run interval was presented for 10 s plus the residual amount of time from the stimulus choice and intervention guess events.
Participants completed four blocks of 30 trials (120 total trials) in different “mining territories.” A single block was presented for each functional run. Participants were instructed that different agents frequent each territory: a bandit will occasionally steal gold from the mines and replace it with rocks (adversarial condition), and a tycoon will occasionally leave extra gold in the mines (benevolent condition). During the task, participants completed two blocks of each condition, which were interleaved in a pseudorandomized fashion. The agents intervened on 30% of the trials (or 9 of 30 trials), and participants were told this proportion explicitly at the start of the task, though they did not know unambiguously whether the agent intervened on any particular trial. For example, the benevolent intervention produced rewards on 9 of 30 trials, and the adversarial intervention produced losses on 9 of 30 trials, regardless of the participant's choice. On trials where the hidden agent did not intervene, the underlying reward distribution for each mine in a pair was either 70% or 30%. The fact that both the intervention probability and reward probability are 30% is purely coincidental and has no special significance. After feedback and the presentation of a second ISI (2–4 s), participants were asked whether they believed the outcome they received was a result of hidden agent intervention (binary response of “Yes” or “No”; 3 s) and made their selection using the button box. The stimulus choice and intervention guess periods would end as soon as a button was pressed. Residual time from these periods was added to the subsequent IRI (10 s plus residual) at the end of the run/block.
Computational model.
We used a computational model developed in our earlier work (Dorfman et al., 2019) to analyze the behavioral and neural data. The model proposes an update rule (Eq. 1), where is the estimated value of a given action, is the reward outcome on each trial t, and is a parameter representing the learning rate that scales the reward prediction error (. The learning rate and prediction error are then scaled by a parameter that encodes the posterior probability of beliefs about agency over outcomes, , as follows:
| (1) |
The modulated learning rate is derived analytically to be consistent with Bayesian updating (Dorfman et al., 2019). In particular, it depends on beliefs about the two possible sources of the outcome: the intrinsic reward distribution of the action and the intervention of the hidden agent. The posterior belief encodes the degree to which the outcome should be attributed to the intrinsic reward distribution rather than to the hidden agent, which is affected by the experimental condition, whether feedback was positive or negative, as well as the trial history. From now on, we will omit the trial subscript t to keep the notation uncluttered.
We use the indicator random variable to denote whether the hidden agent intervened () or did not intervene () on any given trial. In our experimental task, with probability , the decision maker receives a reward from the intrinsic distribution , or with probability they receive a reward from a distribution determined by the hidden agent intervention . A rational observer who is familiar with the task structure (as our participants are) can use this to infer the posterior probability that a hidden agent did not intervene on a given trial, , which is given by Bayes' rule, as follows:
| (2) |
For simplicity, we summarize the posterior as the single quantity , which reflects a trial-by-trial estimate of the decision maker's belief that they caused the outcome, conditional on the history of actions and rewards for the relevant task block. In the study by Dorfman et al. (2019), we showed that the Bayes-optimal learning rate should be proportional to , and that depends on the task condition, the trial outcome, and the value of the chosen option (for more details, refer to the supplemental material in Dorfman et al., 2019).
Intuitively, the Bayesian models predict that the participant should discount learning about the reward probabilities when they believe that the outcome was generated by an external force. In other words, the learning rate is calculated by integrating one's cumulative past beliefs about agency into one's value estimate of a particular choice. Critically, the learning rate will differ in magnitude for positive and negative outcomes depending on how much agency the participant believes they have. For example, when the agent is adversarial, positive outcomes can only be generated from the intrinsic reward probabilities, whereas negative outcomes can be generated by either the hidden agent or the intrinsic reward probabilities. Consequently, negative outcomes are less informative about the reward probabilities in this scenario, leading to a lower learning rate.
We fit three candidate models and compared them based on participant behavior (Table 1). In one model, we fixed the prior probability of hidden agent intervention at 30% to replicate the instructions that participants received in the task, while in another model, we set the prior probability of intervention as the mean of the participant's subjective intervention judgments. The former we will refer to as the “fixed Bayesian model,” and the latter as the “empirical Bayesian model.” We hypothesized that either the fixed or empirical Bayesian models would best fit the behavior of our participants when compared with a four-learning rate model that fits separate learning rates for positive and negative prediction errors in each condition (e.g., positive benevolent, negative benevolent, positive adversarial, and negative adversarial).
Table 1.
Computational model descriptions and model comparison results
| Model name | Four-learning rate model | Fixed Bayesian model | Empirical Bayesian model |
|---|---|---|---|
| Description | RL model with different learning rate for each outcome valence × condition combination | RL model with learning rate modulated by trial-by-trial causal inferences | RL model with learning rate modulated by trial-by-trial causal inferences |
| Prior probability of intervention | N/A | Ground truth (30%) | Average of subjective intervention judgments |
| PXP | 0.001 | 0.17 | 0.82 |
N/A, Not available; RL, reinforcement learning.
To demonstrate how the Bayesian models predict different patterns of behavior for each outcome-by-condition scenario, we performed model simulations for the empirical Bayesian model and compared them to patterns of data from a previously published study as well as the current study (Fig. 2; Dorfman et al., 2019). The simulations (N = 1000) reveal how is differentially modulated dependent on the value of the chosen option, the task condition, and the trial outcome. In this case, we have plotted as a function of a model-agnostic proxy for the value of the chosen option by calculating the percentage of trials that were rewarded for that option. This allows us to compare patterns across the simulations and the participant data. We found that is higher for simulated trials where the hidden agent intervened compared with simulated trials where the hidden agent did not intervene (t(999) = 58.03, p < 0.0001, d = 0.69, 95% CI = 0.67, 0.72), providing confirmation that the Bayesian models are capable of correctly inferring hidden-agent interventions. We used two samples of participant data, one from the current study (n = 31) and one from a large, previously published sample (n = 255) where participants were given the same task instructions. A subset of this larger sample included a preregistered replication. All subsequent results reported in this article use only the current imaging sample (n = 31) unless otherwise noted.
Figure 2.
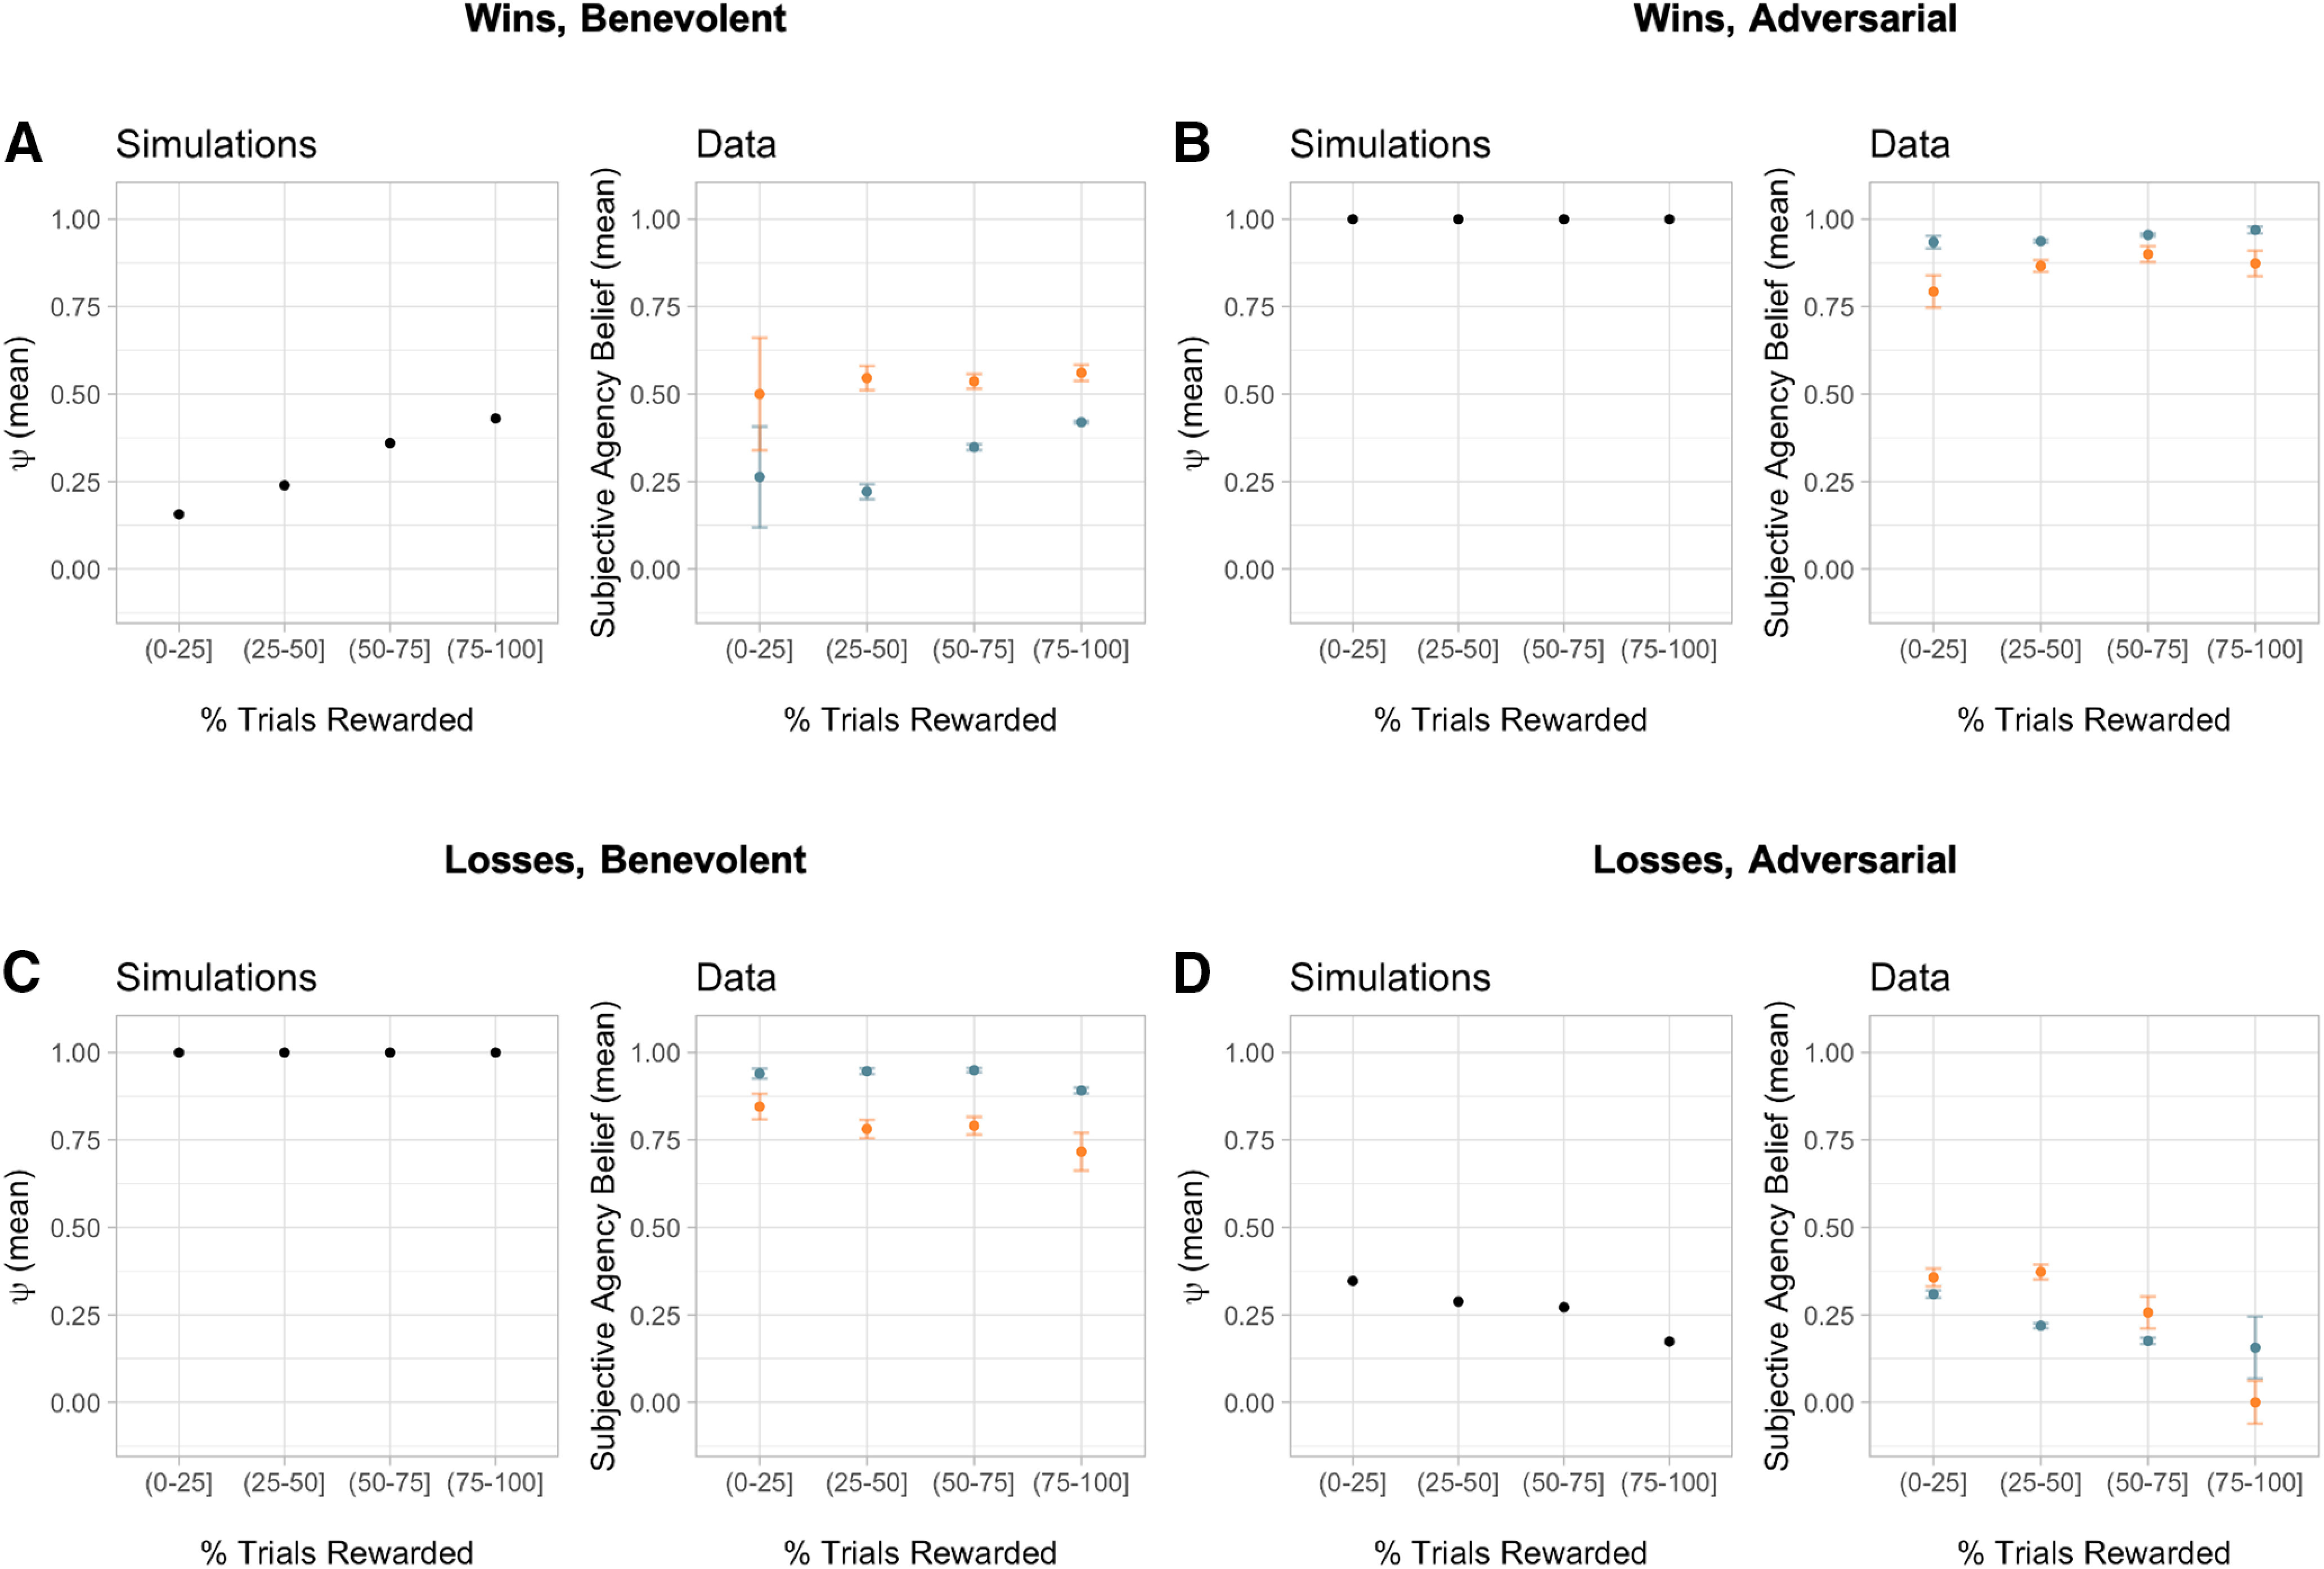
Influence of beliefs about agency on choice behavior. A–D, Left panels, Simulations of the empirical Bayesian model (N = 1000) demonstrate that the ψ parameter is differentially modulated depending on the value of the chosen option (calculated as a percentage of the trials rewarded), the task condition, and the trial outcome (A, wins, benevolent; B, wins, adversarial; C, losses, benevolent; D, losses, adversarial). Right panels, Participant data from both the current study (N = 31; orange) and a previously published study using the same task (N = 255; blue) illustrates similar patterns when looking at participants' subjectively reported beliefs about agency. Error bars represent the SEM. Some error bars are too small to be visible.
Behavioral model comparison.
We selected models for analyzing the neural data based on their fit to the behavioral data. We compared the empirical and fixed Bayesian models with the four-learning rate model using random-effects Bayesian model selection (Stephan et al., 2009; Rigoux et al., 2014). This procedure treats each participant as a random draw from a population-level distribution over models, which it estimates from the sample of model evidence values for each model. We approximated the log model evidence (LME) for each participant as LME = −0.5 * BIC, where BIC is the Bayesian information criterion based on maximum-likelihood estimation of the free parameters of the given model. For our comparison metric, we report the protected exceedance probability (PXP), the probability that a particular model is more frequent in the population than all other models under consideration, taking into account the possibility that some differences in model evidence are because of chance.
fMRI data acquisition and preprocessing.
Imaging data were collected on a 3.0 T Magnetom Prisma MRI scanner with the vendor 32-channel head coil (Siemens Healthcare) at the University of California, Riverside Center for Advanced Neuroimaging. A T1-weighted high-resolution multiecho magnetization-prepared rapid-acquisition gradient echo (ME-MPRAGE) anatomic scan (van der Kouwe et al., 2008) of the whole brain was acquired for each participant before any functional scanning (208 sagittal slices, voxel size = 0.8 × 0.8 × 0.8 mm, TR = 2400 ms, TE = 2.72 ms, TI = 1060 ms, flip angle = 8°, FOV = 256 mm). Functional images were acquired using a T2*-weighted echoplanar imaging pulse sequence. In total, four functional runs were collected for each participant, with each run corresponding to a single task block, two for each condition (78 interleaved axial–oblique slices per whole-brain volume, voxel size = 1.5 × 1.5 × 1.5 mm, TR = 2000 ms, TE = 32 ms, flip angle = 74°). Functional slices were oriented to a 30° tilt toward coronal from anterior commissure–posterior commissure alignment.
Functional data were preprocessed and analyzed using SPM12 (Wellcome Department of Imaging Neuroscience, London, UK). Each functional scan was realigned to correct for small movements between scans. The high-resolution T1-weighted ME-MPRAGE images were then coregistered to the mean realigned images, and the gray matter was segmented and normalized to the gray matter of a standard Montreal Neurological Institute (MNI) reference brain (resampled voxel size, 2 mm 343 isotropic). The functional images were then spatially smoothed with an 8 mm full-width at half-maximum Gaussian kernel, high-pass filtered at 1/128 Hz, and corrected for temporal autocorrelations using a first-order autoregressive model.
fMRI analysis.
General linear models (GLMs) included impulse regressors that were convolved with the hemodynamic response function. Feedback onsets were modeled as the regressor of interest. All trial events in addition to the regressor of interest for a particular GLM were included as nuisance regressors, as well as motion estimates derived from the realignment procedure and run-specific intercepts. Trial-by-trial parameters from the computational models were included in relevant GLMs as parametric modulators, modeled at the time of feedback (Table 2, GLM details).
Table 2.
GLM details
| Regressor name | Event | Which trials |
|---|---|---|
| GLM 1: RPE | Feedback onset | Nontimeouts |
| Feedback onset | Timeouts | |
| Trial onset | All | |
| Reaction time/trial offset | All | |
| Intervention guess onset | All | |
| Intervention guess offset | All | |
| GLM 2: | Feedback onset | Nontimeouts |
| Feedback onset | Timeouts | |
| Trial onset | All | |
| Reaction time/trial offset | All | |
| Intervention guess onset | All | |
| Intervention guess offset | All | |
| GLM 3: RPE * | Feedback onset | Nontimeouts |
| Feedback onset | Timeouts | |
| Trial onset | All | |
| Reaction time/trial offset | All | |
| Intervention guess onset | All | |
| Intervention guess offset | All | |
| GLM 4: RPE and RPE * | Feedback onset | Nontimeouts |
| Feedback onset | Timeouts | |
| Trial onset | All | |
| Reaction time/trial offset | All | |
| Intervention guess onset | All | |
| Intervention guess offset | All | |
| GLM 5: losses and win trials for benevolent and adversarial trialsa | Feedback onset Feedback onset |
Nontimeouts Timeouts |
| Losses, benevolent; wins, benevolent; | Trial onset | All |
| losses, adversarial; and wins, adversarial | Reaction time/trial offset | All |
| Intervention guess onset | All | |
| Intervention guess onset | All |
Regressor of interest is reported in regular text; nuisance regressors are reported in italicized text.
aInteraction contrast: (win trials, adversarial condition + loss trials, benevolent condition) > (loss trials, adversarial condition + win trials, benevolent condition).
All group-level reported results are t-maps that have been whole-brain corrected at a voxel-wise threshold of p < 0.001 and cluster corrected at p < 0.05, familywise error (FWE). Region labels are based on the Harvard-Oxford Cortical and Subcortical Atlases and the SPM Automated Anatomical Labeling Atlas (Tzourio-Mazoyer et al., 2002; Rolls et al., 2015). Voxel coordinates are reported in MNI space. Regions of interest (ROIs) for ψ from GLM 2 were defined as 4 mm spheres around the peak voxels in the corrected ψ contrast.
Neural model comparison.
Following our previous work, we compared GLMs using the same random-effects Bayesian model selection approach that we used for behavioral model comparison (Rigoux et al., 2014; Tomov et al., 2018). For voxel-wise Bayesian model selection, we computed log posterior odds maps, which are similar to posterior probability maps (Rosa et al., 2010). For each voxel, we performed random-effects Bayesian model selection using the BICs from that voxel alone, which gave us the (expected) posterior probabilities r of the two GLMs we compared, rRPE (GLM 1, unmodulated RPE) and rRPE*ψ = 1 – rRPE (GLM 3, agency-modulated RPE). We then computed the log posterior odds for each voxel as log(rRPE/rRPE*ψ). This produced a brain map with an interpretable scale: 0 means a voxel does not distinguish between the models; positive values mean the voxel favors unmodulated RPE representation (GLM 1); and negative values mean the voxel favors agency-modulated RPE representation (GLM 3). We thresholded the absolute values at 1.097, corresponding to a ≥0.75 posterior probability favoring one model over the other. For subsequent analyses, ROIs for VS and dorsal striatum [posterior putamen (Put), a subregion of dorsal striatum] were defined as unions of bilateral 4 mm spheres around the peak voxels in the log posterior odds map for the corresponding regions. We chose to abbreviate the dorsal striatal ROI as Put since the peak voxels were in posterior putamen.
Effective connectivity.
For the update-specific effective connectivity analysis, we performed structural equation modeling (Spirtes, 2005; Ramsey et al., 2010). We extracted a beta series for feedback-onset events using a GLM that was nearly identical to GLM 1, except that there was a separate feedback-onset regressor on each (nontimeout) trial, and there was no parametric modulation. Using a beta series at feedback onset as opposed to the entire BOLD time course ensures that (1) we are only investigating functional coupling related to updating in response to feedback; and (2) our data points are relatively independent, which is a key assumption in structural equation modeling. Based on the univariate results reported below, we were interested in functional connectivity among four ROIs: the ψ ROIs in right inferior frontal gyrus (IFG) and right anterior insula (AI) from the ψ contrast in GLM 2, as well as the RPE ROI in bilateral VS and the RPE * ψ ROI in bilateral Put from the neural model comparison of GLMs 1 and 3. We also included the following three input variables: RPE, RPE * ψ, and ψ.
To explore the space of possible connectivity patterns, we used the IMaGES (independent multiple-sample greedy equivalence search) algorithm (Ramsey et al., 2010; Poldrack et al., 2011) from the TETRAD software package for causal modeling (Scheines et al., 1998). IMaGES is a modification of a greedy equivalence search (GES) algorithm (Meek, 1997), which starts with an empty causal graph and incrementally adds edges until it finds a graph that best fits the data according to the BIC. IMaGES adapts GES to modeling multiple datasets, such as multiple subjects in fMRI, by taking an average BIC across subjects (the IMscore).
We added the following required edges as prior knowledge for IMaGES: RPE VS, RPE * ψ Put, ψ IFG, ψ AI, since those ROIs were selected based on the corresponding input variables. This ensures that there is no circularity in the analysis (Kriegeskorte et al., 2009) and that any inferences about effective connectivity are not based on correlations between the variables used in the ROI selection procedure. We forbade the discovery of any edges between the input variables. We also restricted the search space to graphs that are compatible with our behavioral and computational modeling work. In particular, we only allowed edges between ROIs that represent variables that rely on one another for their computation, as follows: VS Put, IFG Put, AI Put, IFG AI, AI IFG.
We followed up with a confirmatory analysis using random-effects Bayesian model selection (Rigoux et al., 2014) on a restricted set of structural equation models that specifically test our hypotheses with respect to the winning causal graph identified by the IMaGES procedure. Fitting was performed using the semopy toolbox (Igolkina and Meshcheryakov, 2020) using Wishart maximum likelihood estimation, which assumes that the variables follow a multivariate normal distribution and their covariance follows a Wishart distribution. We then used the resulting BICs to perform random-effects Bayesian model selection, as described previously. Note that this is a different kind of random-effects analysis than the one used by the IMaGES algorithm and therefore provides a complementary way of assessing and quantifying the result.
It is worth noting that structural equation modeling cannot establish causal relations from associations alone (Bollen and Pearl, 2013). Rather, structural equation modeling is a statistical method to evaluate the consequences of a set of causal assumptions (corresponding to a particular structural equation model) and to measure how well they fit the data. Different sets of causal assumptions (corresponding to different structural equation models) lead to different predictions that are more or less consistent with the data. While this does not prove or disprove any of the causal assumptions, it can lend credence to some causal assumptions over others, which can guide the design of intervention studies to specifically test these assumptions. In the context of our study, we motivate our causal assumptions with prior literature as well as the results from our modeling and behavioral work. In the rest of the article, we refer to causal relations between pairs of regions favored by this analysis as “functional coupling” or “effective connectivity,” as is standard in the field (Poldrack et al., 2011), with the explicit understanding that this is only suggestive of possible anatomic connectivity and corresponding information flow.
We would also like to distinguish causality in the context of our structural equation modeling analysis, which refers to information flow between different brain regions (and is inferred by us, the researchers), from causality in the context of our modeling and behavioral analysis, which refers to the participant's ability to control the outcome (and is inferred by the participant).
Results
Behavior and computational model
To verify that participants made attribution judgments consistent with the experimental manipulation, we examined hidden agent intervention judgments by outcome valence (win, loss) and condition (adversarial, benevolent). There was a significant condition by outcome valence interaction (F(1,30) = 76.83, p < 0.0001), where participants were more likely to believe that the hidden agent had intervened after negative compared with positive outcomes in the adversarial condition, and after positive compared with negative outcomes in the benevolent condition. Providing further evidence that participants understood the structure of the task, we found that participants' binary intervention judgments were positively correlated with the objective truth about intervention on a particular trial ((1, N = 31) = 140.35, p < 0.0001). Replicating results from our previous work (Dorfman et al., 2019; Cohen et al., 2020), we also found that across all conditions, participants were more likely to believe that negative outcomes were caused by the hidden agent compared with positive outcomes (F(1,30) = 12.65, p < 0.001).
We found that the empirical Bayesian model (PXP = 0.82) was superior to both the fixed Bayesian model (PXP = 0.17) and the four-learning rate model (PXP = 0.001). The model demonstrates our predicted two-way asymmetry between valence and condition driven by inferences about hidden agent intervention, replicating our previous studies. We therefore used the empirical Bayesian model in all subsequent fMRI analyses.
To further interrogate our model, we also tested how the model predictions correspond to the subjective intervention judgments, which were not used for fitting or model comparison. We found that the model-predicted learning rates were significantly lower for trials where participants believed that the hidden agent intervened, compared with trials where they believed that the hidden agent did not intervene (t(30) = −6.49, p < 0.0001, d = −1.17). In addition, participants' judgments about intervention also showed a significant median point-biserial correlation with the intervention belief predicted by the model (r = 0.424, p < 0.0001), and this intervention belief was also significantly greater for trials where the participants believed that the hidden agent did not intervene compared with trials where they believed intervention occurred (t(30) = 7.39, p < 0.0001, d = 2.12).
In addition to the model comparison, we performed several model-agnostic analyses that demonstrate that the participants' beliefs and behavior are consistent with our Bayesian model. First, the Bayesian model predicts that agency beliefs should depend on the value of the chosen option, the task condition, and the trial outcome in a characteristic way (Fig. 2, left panels). We found that the participants' subjective beliefs about agency show a similar pattern, both in our current study and in a previously published behavioral study using the same task and a larger sample size (Fig. 2, right panels). This pattern of beliefs arises for the following reasons. In the benevolent condition, a loss (Fig. 2C) could be caused only by the participant, which results in a high value of in the model, corresponding to the high subjective agency beliefs in the participants. A similar pattern holds for wins in the adversarial condition (Fig. 2B). The other two patterns are subtler. In the benevolent condition, a win (Fig. 2A) could be caused either by the participant or by the hidden agent. If the chosen option has a low value (i.e., was rewarded on a lower percentage of trials), then this option likely is intrinsically unrewarding, and hence it is more likely that the win was caused by the hidden agent rather than the participant. This would result in a lower and a correspondingly low subjective agency belief. Conversely, high-value options are more likely to deliver rewards because of their intrinsic reward distributions, and hence it is more likely that the win was caused by the participant rather than the hidden agent. This would result in a higher and a correspondingly high subjective agency belief. The opposite pattern holds for losses in the adversarial condition (Fig. 2D).
Second, to investigate the influence of agency beliefs on choice, we calculated participants' average number of repeated choices and compared this choice behavior within subjective intervention judgments and feedback valence (Fig. 3). The model predicts that participants should repeat rewarding choices and avoid unrewarding choices when they believe they caused them, more so than when they believe they did not cause them. Consistent with this prediction, in the current sample (n = 31), there was a significant interaction between the effects of feedback valence (positive or negative) and subjective agency judgments (self or other) on repeated choice behavior (F(1,30) = 8.57, p < 0.01). However, post hoc, pairwise t tests revealed no significant differences between conditions, likely because of reduced power. To corroborate these findings, we conducted the same analysis in a sample from our previous study (Dorfman et al., 2019) using the same task (n = 255). Using this larger sample, we also find a significant interaction effect (F(1,255) = 29.65, p < 0.0001), as well as significant differences between conditions, showing that participants repeat choices more when they attribute negative outcomes to the hidden agent instead of to themselves (t(252) = 2.96, p = 0.003, d = 0.19, 95% CI = 0.06, 0.31), and repeat choices more when they attribute positive outcomes to themselves compared with the hidden agent (t(249) = −1.99, p = 0.048, d = −0.13, 95% CI = −0.25, 0.00), consistent with the structure of the task.
Figure 3.
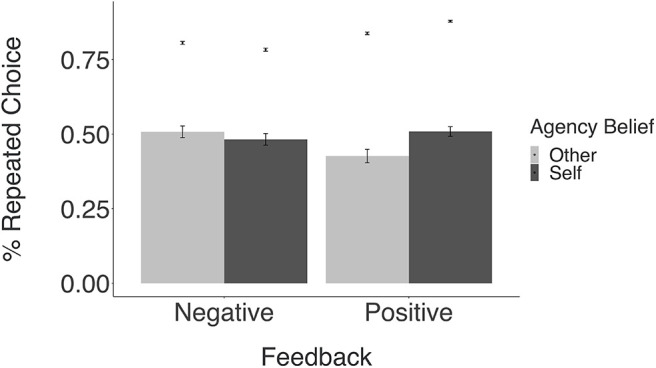
Relationship between beliefs about agency and repeated choice behavior. Mean repeated choice is plotted as a function of feedback valence (negative or positive) and subjective agency beliefs (self or other). Bars represent data from the current imaging sample (n = 31), and points represent data from a previously published study using the same task (n = 255). Error bars represent the SEM.
All model-based fMRI analyses used trial-by-trial regressors extracted from the empirical Bayesian model (Tables 1, 2).
Reward prediction error signals in striatum and medial prefrontal cortex
We first sought to verify that our task elicited the canonical striatal and prefrontal activation associated with RPEs. By entering a trial-by-trial RPE signal from the winning computational model (empirical Bayesian model) as a parametric modulator at feedback onset into a whole-brain GLM (Table 2, GLM 1) we found robust activation in ventral striatum, which extended to the ventromedial PFC (vmPFC; Fig. 4A, Table 3).
Figure 4.

Reward prediction errors. A, B, Group-level statistical maps from GLM 1 (A) and GLM 3 (B) showing brain regions tracking unmodulated (A) and agency-modulated (B) reward prediction errors, respectively (single voxels thresholded at p < 0.001; whole-brain cluster FWE corrected at α = 0.05).
Table 3.
BOLD Activation for RPE
| Region label | Extent | t Value | MNI coordinates |
||
|---|---|---|---|---|---|
| x | y | z | |||
| Right accumbens | 10,142 | 11.405 | 10 | 6 | −10 |
| Left cerebral cortex | 10,142 | 8.972 | −14 | 4 | −12 |
| Right amygdala | 10,142 | 7.477 | 24 | −6 | −14 |
| Left cerebellum | 3592 | 6.357 | −38 | −74 | −34 |
| Left cerebellum | 3592 | 6.166 | −26 | −48 | −26 |
| Left inferior temporal gyrus | 3592 | 6.135 | −56 | −50 | −16 |
| Right superior occipital gyrus | 2518 | 5.794 | 22 | −78 | 40 |
| Left cuneus | 2518 | 5.396 | −12 | −78 | 40 |
| Left precuneus | 2518 | 5.177 | −6 | −62 | 36 |
| Left superior frontal gyrus | 732 | 5.583 | −18 | 24 | 54 |
| Left superior frontal gyrus | 732 | 5.203 | −20 | 36 | 52 |
| Left middle frontal gyrus | 732 | 4.693 | −32 | 24 | 58 |
| Right superior frontal gyrus | 645 | 5.554 | 20 | 34 | 52 |
| Right superior frontal gyrus | 645 | 4.863 | 28 | 44 | 46 |
| Right superior frontal gyrus | 645 | 4.264 | 18 | 50 | 40 |
| Precentral gyrus | 638 | 5.216 | 20 | −24 | 58 |
| Right postcentral gyrus | 638 | 4.720 | 24 | −46 | 68 |
| Postcentral gyrus | 638 | 4.286 | 24 | −36 | 60 |
| Right cerebellum | 168 | 4.909 | 42 | −72 | −36 |
| Right cerebellum | 168 | 3.733 | 48 | −64 | −38 |
| Left middle frontal gyrus | 560 | 4.831 | −48 | 48 | 6 |
| Left middle frontal gyrus | 560 | 4.636 | −44 | 46 | 24 |
| Left superior frontal gyrus | 560 | 4.625 | −12 | 68 | 10 |
| Left precentral gyrus | 527 | 4.752 | −26 | −30 | 66 |
| Left precentral gyrus | 527 | 4.491 | −22 | −22 | 72 |
| Precentral gyrus | 527 | 4.458 | −14 | −30 | 62 |
| Left angular gyrus | 354 | 4.684 | −40 | −60 | 38 |
| Left angular gyrus | 354 | 4.447 | −44 | −70 | 30 |
| Left angular gyrus | 354 | 4.024 | −40 | −68 | 46 |
| Right cerebellum | 203 | 4.608 | 18 | −68 | −28 |
| Cerebellar vermis | 203 | 4.042 | 4 | −74 | −30 |
| Left precuneus | 2518 | 3.563 | −8 | −70 | 38 |
| Right rectal gyrus | 10,142 | 3.648 | 14 | 28 | −10 |
| Left precentral gyrus | 527 | 3.719 | −22 | −28 | 70 |
Up to three subpeaks for the largest cluster are included. Voxel coordinates are reported in MNI space. All results have been whole-brain corrected at a voxel-wise threshold of p < 0.001 and cluster-corrected at p < 0.05, FWE.
Our computational model posits that the RPE is scaled by the agency belief to obtain an agency-modulated RPE (RPE * ), which is used to update action values. Furthermore, previous studies in humans, nonhuman primates, and rodents have shown that different subregions of the striatum receive dopamine inputs encoding different kinds of RPEs or value signals (Balleine et al., 2007; Matsumoto and Hikosaka, 2009; Watabe-Uchida et al., 2012; Menegas et al., 2015). This led us to hypothesize that different brain regions, and in particular different parts of the striatum, might be encoding the agency-modulated RPE (RPE * ) and the unmodulated RPE. We therefore performed a similar whole-brain analysis with model-derived trial-by-trial estimates of RPE * (Table 2, GLM 3), which yielded a similar set of regions in ventral striatum and ventromedial prefrontal cortex (Fig. 4B, Table 4). This analysis rules out the possibility that neither RPE nor RPE * are represented in striatum; however, it leaves open the question of which (if any) of the two signals dominates in which subregions of striatum.
Table 4.
BOLD activation for RPE *
| Region label | Extent | t Value | MNI coordinates |
||
|---|---|---|---|---|---|
| x | y | z | |||
| Right caudate | 4766 | 8.204 | 10 | 6 | −8 |
| Left putamen | 4766 | 7.407 | −14 | 6 | −10 |
| Right hippocampus | 4766 | 6.899 | 24 | −8 | −14 |
| Right inferior occipital gyrus | 802 | 6.685 | 30 | −92 | −8 |
| Right inferior occipital gyrus | 802 | 5.268 | 50 | −80 | 0 |
| Right inferior occipital gyrus | 802 | 4.489 | 38 | −88 | 0 |
| Left cerebellum | 2197 | 6.405 | −36 | −76 | −34 |
| Left cerebellum | 2197 | 5.937 | −26 | −46 | −26 |
| Left inferior occipital gyrus | 2197 | 5.078 | −28 | −94 | −4 |
| Right inferior temporal gyrus | 976 | 5.672 | 62 | −10 | −30 |
| Right cerebellum | 976 | 5.165 | 36 | −40 | −26 |
| Right inferior temporal gyrus | 976 | 5.110 | 62 | −30 | −16 |
| Left putamen | 167 | 5.641 | −26 | −4 | 18 |
| Left putamen | 167 | 4.351 | −30 | −4 | 8 |
| Right superior frontal gyrus | 340 | 5.075 | 20 | 36 | 52 |
| Right superior frontal gyrus | 340 | 4.531 | 28 | 44 | 46 |
| Right superior frontal gyrus | 340 | 3.930 | 18 | 50 | 46 |
| Left inferior temporal gyrus | 331 | 5.074 | −56 | −42 | −14 |
| Left inferior temporal gyrus | 331 | 4.122 | −58 | −54 | −12 |
| Left middle temporal gyrus | 331 | 3.642 | −64 | −46 | −4 |
| Right thalamus | 275 | 5.032 | 14 | −16 | 18 |
| Right caudate nucleus | 275 | 4.731 | 18 | −4 | 24 |
| Right caudate nucleus | 275 | 3.498 | 10 | −4 | 16 |
| White matter | 393 | 4.935 | 26 | −28 | 48 |
| White matter | 393 | 4.770 | 20 | −28 | 58 |
| Right postcentral gyrus | 393 | 4.583 | 26 | −42 | 70 |
| Right precuneus | 1048 | 4.808 | 4 | −62 | 42 |
| Left cingulate | 1048 | 4.804 | −14 | −44 | 38 |
| Left precuneus | 1048 | 4.766 | −8 | −58 | 36 |
| Left superior frontal gyrus | 376 | 4.746 | −20 | 28 | 58 |
| Left superior frontal gyrus | 376 | 4.394 | −16 | 50 | 46 |
| Left middle frontal gyrus | 376 | 3.968 | −32 | 24 | 58 |
| Right superior occipital gyrus | 171 | 4.621 | 22 | −78 | 40 |
| Right superior occipital gyrus | 171 | 4.189 | 26 | −70 | 50 |
| Left postcentral gyrus | 247 | 4.222 | −22 | −34 | 68 |
| Left precentral gyrus | 247 | 4.207 | −28 | −24 | 58 |
| Left paracentral lobule | 247 | 4.170 | −16 | −20 | 70 |
| Left fusiform gyrus | 2197 | 3.528 | −44 | −66 | −10 |
Up to three subpeaks for the largest cluster are included. Voxel coordinates are reported in MNI space. All results have been whole-brain corrected at a voxel-wise threshold of p < 0.001 and cluster-corrected at p < 0.05, FWE.
To directly test the hypothesis that different parts of the striatum might be computing the unmodulated and agency-modulated RPEs, we entered both regressors into a single GLM (Table 2, GLM 4) and looked at the contrast between the two regressors (RPE – RPE * ). However, no voxels survived after correcting for multiple comparisons. This was true even when looking at the contrast for each regressor in isolation and is likely because of the fact that the two regressors are highly correlated (average Pearson correlation, p = 0.81) and are trading off with each other (Mumford et al., 2015). While at first glance these results seem to suggest that the signals are not distinguishable using fMRI, the univariate analyses reported in this section may not be sufficiently sensitive to uncover a functional dissociation.
Differential sensitivity of RPEs to causal beliefs in ventral and dorsal striatum
An alternative approach to testing whether a given brain region is sensitive to unmodulated versus agency-modulated RPEs is to perform model comparison between relevant GLMs (GLM 1, RPE; GLM 3, RPE * ; GLM 4, RPE and RPE * ). First, we sought to answer the question of whether both RPE signals are represented in overlapping subregions of striatum. For each voxel in the striatum, we performed a random-effects Bayesian model comparison (Rosa et al., 2010) among GLMs 1, 3 and 4. We found that none of the voxels in striatum favored GLM 4 (maximum posterior probability, <0.03; maximum PXP, <0.0001), thus ruling out the possibility that the same voxels represent both unmodulated and agency-modulated RPEs.
This left us with the possibility that the two RPE signals are represented in different subregions of striatum, or the possibility that only one of them is represented and the other is simply picking up the signal because of the strong correlation. To directly test the differential representation of the two RPE signals, we once again performed a random-effects Bayesian model comparison for each voxel in the striatum (Rosa et al., 2010), this time only between GLMs 1 and 3. To visualize the comparison, we computed the log posterior odds as log(rRPE/rRPE*ψ), where rRPE is the posterior probability of GLM 1 (unmodulated RPE) and rRPE*ψ is the posterior probability of GLM 3 (agency-modulated RPE). This resulted in a log posterior odds map quantifying the extent to which each voxel favors unmodulated RPE (GLM 1) over agency-modulated RPE (GLM 3) representation, with positive values favoring unmodulated RPE, negative values favoring agency-modulated RPE, and zero indicating the indifference point. We thresholded the map to only show voxels where the posterior probability of either model is ≥0.75. This revealed a graded pattern of RPE representation across striatum, with anterior ventral regions favoring unmodulated RPE representation (Fig. 5A) and posterior dorsolateral regions favoring agency-modulated RPE representation (Fig. 5B).
Figure 5.

Log posterior odds of unmodulated versus agency-modulated RPEs. A, B, Log posterior odds map comparing GLM 1 (unmodulated RPE) and GLM 3 (agency-modulated RPE) showing striatal regions favoring unmodulated RPEs in ventral striatum (red voxels; A) and agency-modulated RPEs in dorsal striatum (blue voxels; B). Single voxels thresholded at posterior probability of ≥0.75 (log odds = 1.097). Color scales represent log posterior odds = log(rRPE/rRPE*ψ), where rRPE is the posterior probability of GLM 1 and rRPE*ψ is the posterior probability of GLM 3.
As an alternative way to quantify the same result, we performed model comparison in these ROIs. We defined a ventral striatum region as the union of two 4 mm spheres around the peak positive voxel (i.e., favoring unmodulated RPE), one in each hemisphere (MNI coordinates [−16, 8, −14] and [14, 8, −12]; we refer to this ROI as VS). We similarly defined a dorsal striatum region as the union of two 4 mm spheres around the peak negative voxel (i.e., favoring agency-modulated RPE), one in each hemisphere (MNI coordinates [−28, 2, 2] and [28, −14, 2]; we refer to this ROI as Put, since these voxels fall in posterior putamen). We then performed random-effects Bayesian model selection comparing GLM 1 and GLM 3 in those two ROIs (note that this is not an independent confirmatory analysis, but rather a complementary way to quantify this same result, which additionally takes into account the probability of the null hypothesis that there is no difference between GLM 1 and GLM 3). We found that ventral striatum favored unmodulated RPE representation (PXP for GLM 1 = 0.95; PXP for GLM 3 = 0.05), while dorsal striatum favored agency-modulated RPE representation (PXP for GLM 1 = 0.13; PXP for GLM 3 = 0.87).
Causal beliefs in anterior insula and inferior frontal gyrus
We next sought to identify regions that parametrically tracked , the model quantity that quantifies the degree to which participants believe they caused each outcome. To do so, we fitted a whole-brain GLM that included a parametric modulator for the belief about causal structure at feedback onset (. Specifically, the quantity represents (one minus) the posterior over hidden causes, with higher values for accounting for a stronger sense of agency over the previous outcome. Using as a single parametric modulator (Table 2, GLM 2), a whole-brain analysis revealed a cluster in the right hemisphere with the following two subpeaks (Table 5): one in right anterior insula (Fig. 6A; 157 voxels; peak [36, 16, 6]), and another in the triangular region of right inferior frontal gyrus (Fig. 6A; 157 voxels; peak [42, 24, 24]). We defined two ROIs as 4 mm spheres around the corresponding peak voxels and henceforth refer to them as AI and IFG, respectively. These ROIs were then used for effective connectivity analyses, as discussed below.
Table 5.
BOLD activation for belief about
| Region label | Extent | t Value | MNI coordinates |
||
|---|---|---|---|---|---|
| x | y | z | |||
| Right inferior frontal gyrus (pars triangularis) | 157 | 4.306 | 42 | 24 | 24 |
| Right insula | 157 | 4.170 | 36 | 16 | 6 |
Up to three subpeaks for the largest cluster are included. Voxel coordinates are reported in MNI space. All results have been whole-brain corrected at a voxel-wise threshold of p < 0.001 and cluster-corrected at p < 0.05, FWE.
Figure 6.

Beliefs about causal structure. A, Group-level statistical maps from GLM 2 showing brain regions tracking posterior beliefs about agency, ; single voxels thresholded at p < 0.001; and whole-brain cluster FWE corrected at α = 0.05). Color scales represent t values. Left, AI (peak [36, 16, 6]). Right, IFG (peak [42, 24, 24]). B, Group-level statistical maps from GLM 5 showing brain regions activated for a valence-by-condition interaction, a model-agnostic measure of beliefs about agency. Single voxels thresholded at p < 0.001; whole-brain cluster FWE corrected at α = 0.05). Color scales represent t values. The same slice is shown across regions for purposes of comparison, but peak coordinates differ. Left, AI (peak [38, 16, 10]). Right, IFG (peak [42, 26, 16]).
To investigate brain regions that are active during causal beliefs in a way that is agnostic to our computational model, we computed a whole-brain, two-way interaction contrast between feedback valence and condition (win trials, adversarial condition – loss trials, adversarial condition – win trials, benevolent condition + loss trials, benevolent condition; Table 2, GLM 5). For clarity, this contrast can be equivalently written as follows: (win trials, adversarial condition + loss trials, benevolent condition) > (loss trials, adversarial condition + win trials, benevolent condition). Importantly, this analysis allowed us to interrogate which regions are associated with task trials where it was possible that the hidden agent intervened (i.e., losses in the adversarial condition and wins in the benevolent condition) compared with trials where it was not possible (i.e., wins in the adversarial condition and losses in the benevolent condition), providing a model-agnostic proxy for the agency parameter () from our computational model. Results confirm those from the model-based analysis, with a cluster of activation with subpeaks in both the right anterior insula and right inferior frontal gyrus (Fig. 6B; 224 voxels; peak [38, 16, 10]; peak [42, 26, 16]), as well as two additional clusters in the bilateral anterior cingulate cortex (153 voxels, peak [−8, 38, 6]) and left fusiform gyrus (135 voxels; peak [−42, −54, −14]; Table 6, all subpeaks).
Table 6.
BOLD Activation for feedback-by-condition interaction
| Region label | Extent | t Value | MNI coordinates |
||
|---|---|---|---|---|---|
| x | y | z | |||
| Right insula | 224 | 5.144 | 38 | 16 | 10 |
| Right inferior frontal gyrus (pars triangularis) | 224 | 4.826 | 32 | 32 | 8 |
| Right inferior frontal gyrus (pars triangularis) | 224 | 3.559 | 42 | 26 | 16 |
| Left anterior cingulate cortex | 153 | 4.705 | −8 | 38 | 6 |
| Right anterior cingulate cortex | 153 | 4.528 | 8 | 32 | 12 |
| Right anterior cingulate cortex | 153 | 3.935 | 8 | 38 | 24 |
| Left fusiform gyrus | 135 | 4.396 | −42 | −54 | −14 |
| Left fusiform gyrus | 135 | 3.899 | −32 | −46 | −20 |
Up to three subpeaks for the largest cluster are included. Voxel coordinates are reported in MNI space. All results have been whole-brain corrected at a voxel-wise threshold of p < 0.001 and cluster-corrected at p < 0.05, FWE.
Effective connectivity from anterior insula to dorsal striatum but not from ventral striatum to dorsal striatum during updating
Our computational model posits that causal beliefs () and RPEs are computed separately and then combined (RPE * ) to compute the action value update. Having identified regions that are associated with these quantities, we next sought to characterize the flow of information between those regions during updating. There are different possible patterns of connectivity between these regions of interest that would be consistent with our model and with different hypotheses about corticostriatal architectures that have been put forward in the literature. In particular, actor-critic models of the basal ganglia favor parallel striatal architectures where state–value and action–value RPEs are computed independently in ventral striatum and dorsal striatum, respectively (Joel et al., 2002). This predicts that there will be no effective connectivity from ventral striatum to dorsal striatum in our data. Conversely, some authors have reported evidence favoring a serial striatal architecture (Haber et al., 2000; Voorn et al., 2004; Ikeda et al., 2013) according to which results from computations in one part of the striatum are passed to another. This predicts that there will be ective connectivity from ventral striatum to dorsal striatum, with dorsal striatum integrating information about RPEs from ventral striatum. Similarly, dorsal striatum might be integrating information about agency beliefs from either or none of the prefrontal regions associated with .
To arbitrate between these hypothesized mappings, we performed effective connectivity analysis using structural equation modeling (Spirtes, 2005; Ramsey et al., 2010; Igolkina and Meshcheryakov, 2020) with a beta series extracted from feedback-onset events. We searched the space of possible effective connectivity patterns using the IMaGES algorithm (see Materials and Methods) and found that in the pattern most consistent with the data, dorsal striatum (abbreviated Put, since the peak voxels were in posterior putamen, a subregion of dorsal striatum) receives input from anterior insula, but not from ventral striatum or inferior frontal gyrus (Fig. 7A). Additionally, there is effective connectivity between anterior insular and inferior frontal gyrus, although the direction cannot be inferred from the data. Formally, there are two effective connectivity patterns (structural equation model 1A: IFG AI, AI Put; structural equation model 1B: AI IFG, AI Put) that correspond to causal graphs that are part of the same Markov equivalence class and hence cannot be disambiguated from our data. We confirmed this using Bayesian model selection (Rigoux et al., 2014) with the two equivalent structural equation models (Fig. 7B; PXP for model 1A = 0.57; PXP for model 1B = 0.43).
Figure 7.
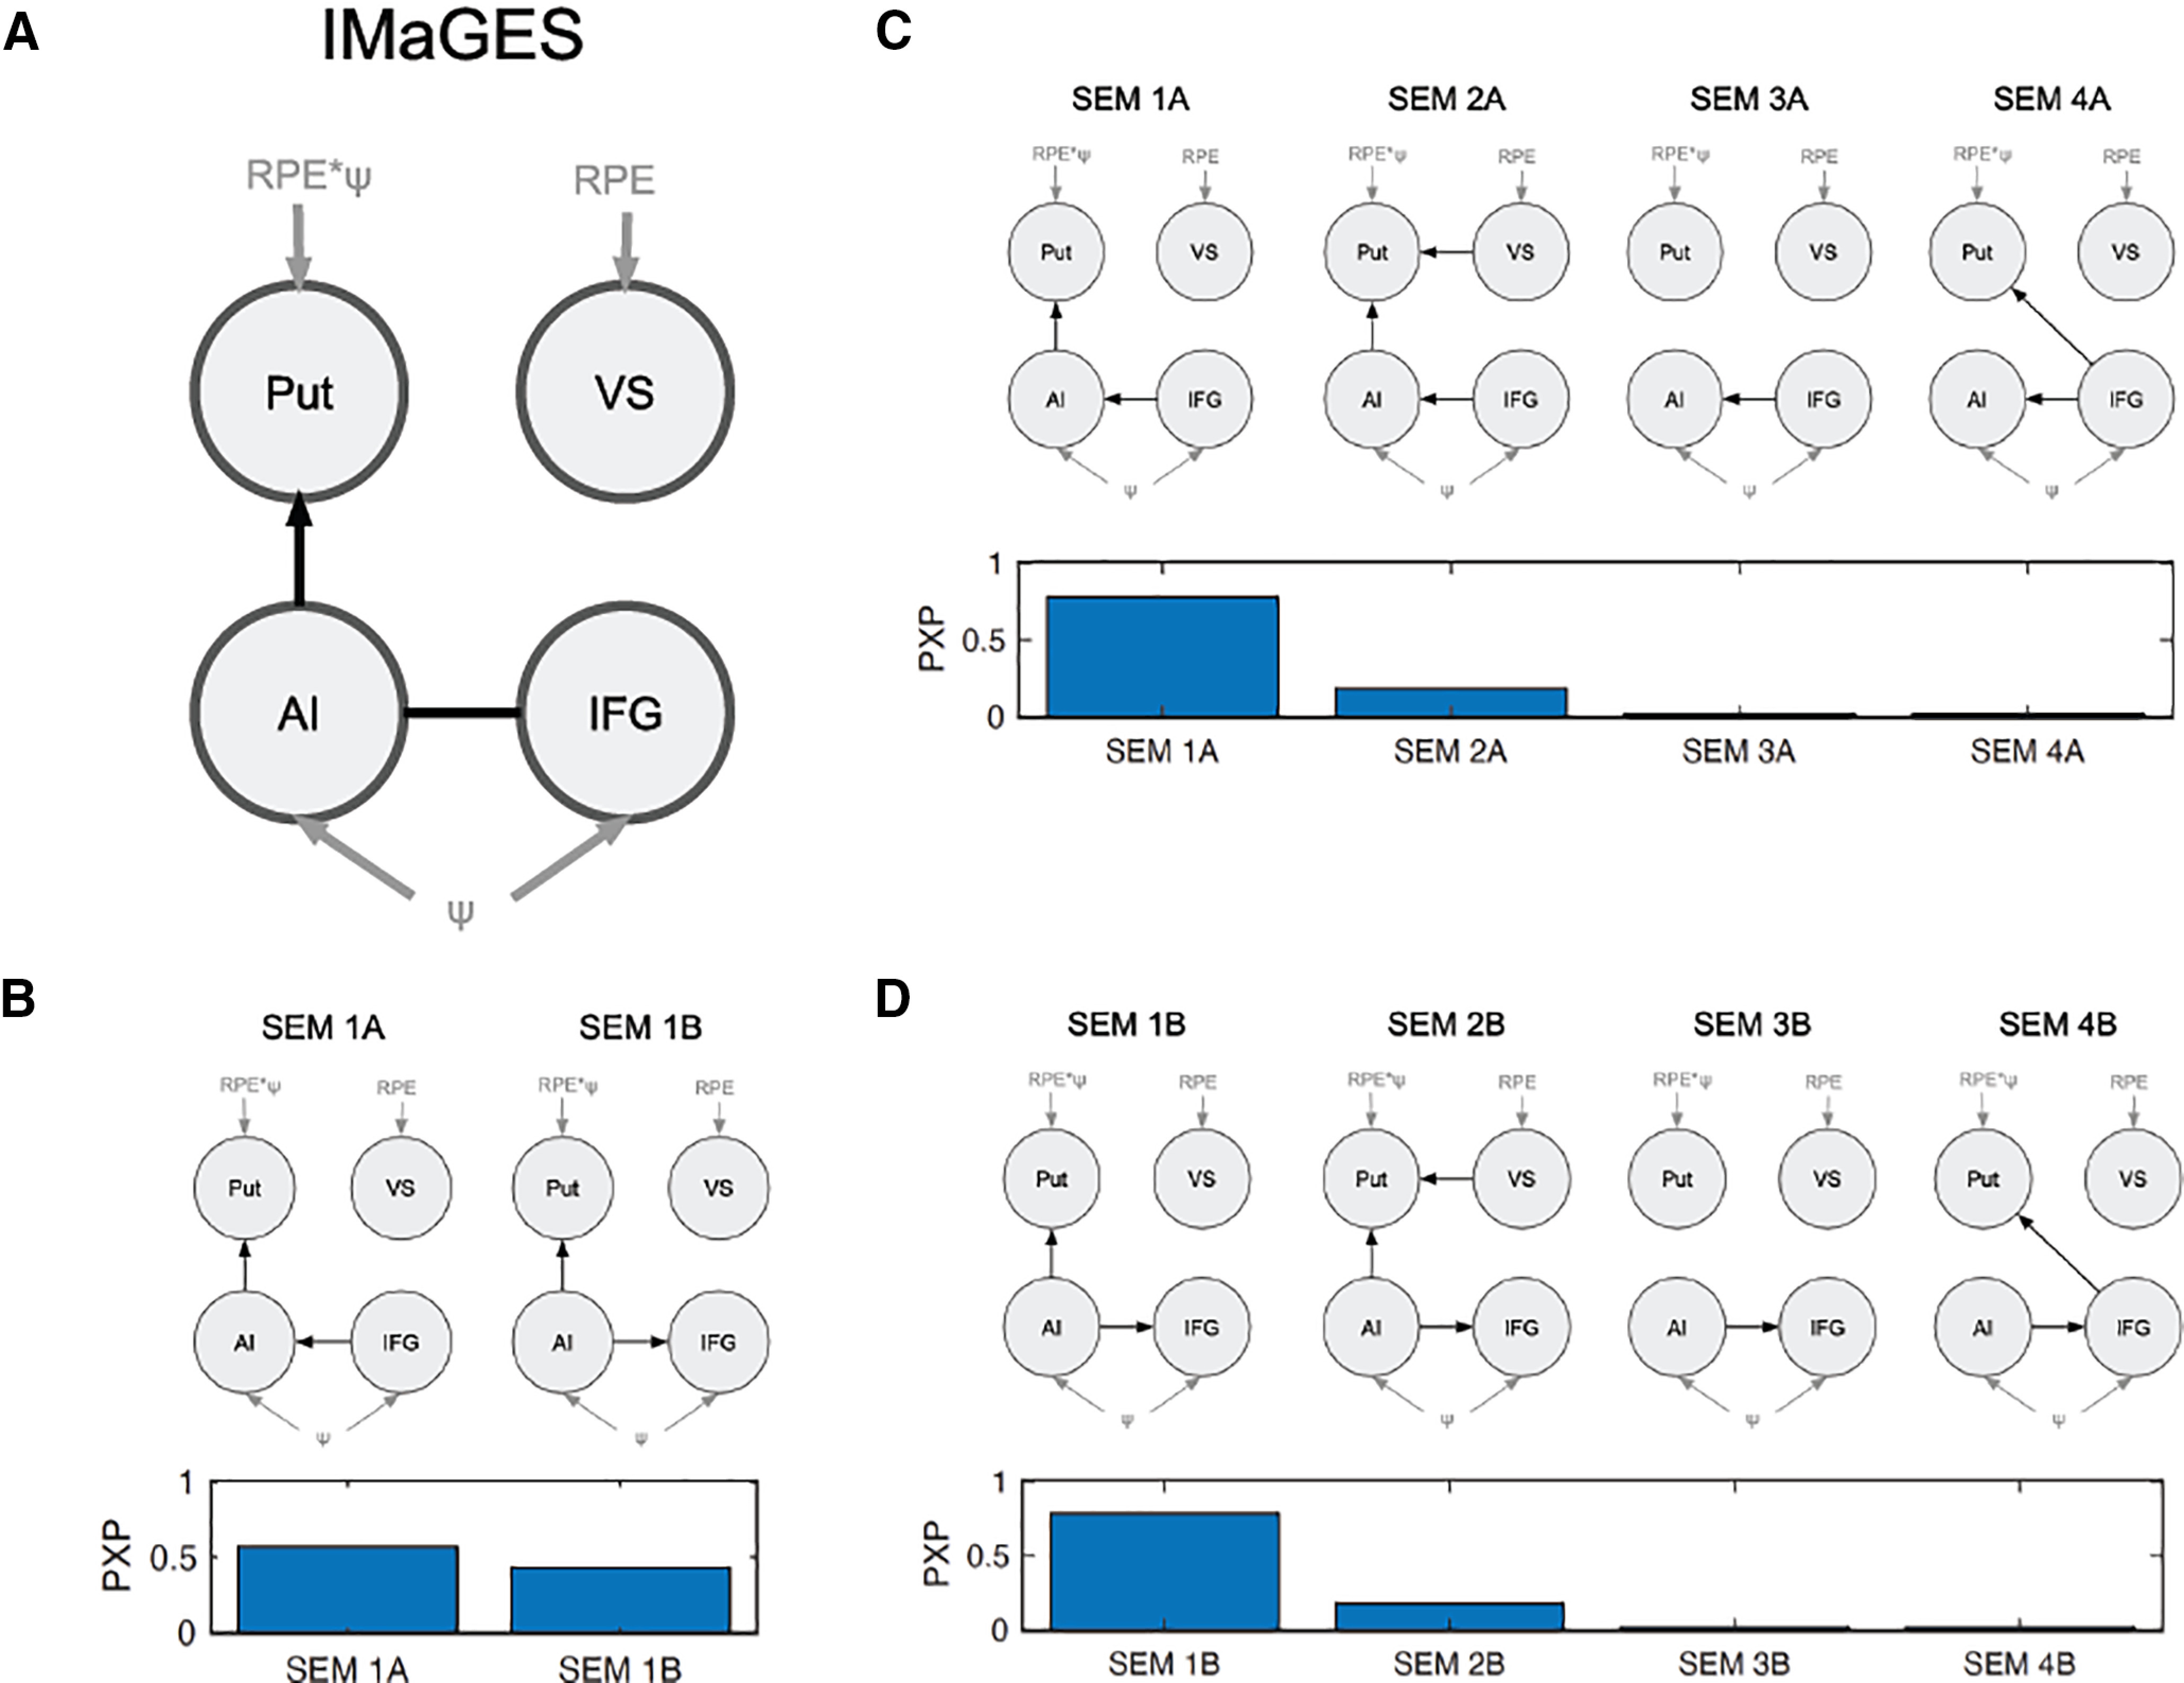
Effective connectivity analysis. A, Winning connectivity pattern found by IMaGES algorithm using TETRAD. B, Bayesian model selection with the two equivalent structural equation models (SEMs) from A. C, D, Bayesian model selection comparing modifications to SEM 1A (C) and SEM 1B (D). Gray nodes and edges indicate input variables. Undirected edges indicate that the either direction is consistent with the data.
We performed additional model comparisons with modifications of the winning model to explicitly quantify the strength of the evidence favoring the above hypotheses (Fig. 7C,D). In particular, we considered structural equation models where dorsal striatum receives input from ventral striatum (VS Put), consistent with a serial striatal architecture (model 2A and 2B). We also considered structural equation models where dorsal striatum receives no input from the cortical regions (models 3A and 3B) or where it receives input from inferior frontal gyrus instead (models 4A and 4B). Splitting these into two model comparisons to account for the ambiguity between structural equation models 1A and 1B, we found that in both cases, the original winning structural equation model was favored (PXP for model 1A = 0.78; PXP for model 2A = 0.18; PXP for model 3A = 0.02; PXP for model 4A = 0.02; PXP for model 1B = 0.79; PXP for model 2B = 0.18; PXP for model 3B = 0.02; PXP for model 4B = 0.02). These results are in line with a hypothetical architecture where dorsal striatum computes agency-modulated RPEs based on input about causal beliefs from anterior insula.
Discussion
The present study used fMRI to uncover the neurobiological mechanisms that determine how causal beliefs modulate learning from positive and negative feedback. We measured differences in brain activation during a reinforcement learning task that manipulated participants' causal beliefs about feedback. Whole-brain analyses revealed that AI and IFG represent causal beliefs, and that the striatum encodes both unmodulated and agency-modulated RPEs. However, a voxel-wise model comparison demonstrated that casual gating of RPEs follows an anatomic gradient, with VS representing unmodulated RPEs and DS representing agency-modulated RPEs. Finally, we analyzed alternative routes of how causal inference from cortical regions guides action selection in striatum using structural equation modeling and found effective connectivity from AI to DS, but not from VS to DS, suggesting a corticostriatal network for agency-modulated reinforcement learning.
These results replicate our prior research and recapitulate canonical neural signatures of feedback learning. First, we replicated our previous behavioral findings, showing increased learning for reward outcomes relative to loss outcomes in the adversarial condition and for loss outcomes relative to reward outcomes in the benevolent condition, and that participant choice behavior was best explained by our hypothesized empirical Bayesian model. We also replicated our previous results, which demonstrated that, collapsed across conditions, participants were more likely to believe that they caused positive outcomes and the hidden agent caused negative outcomes, which is consistent with a self-serving bias (the attribution of good outcomes to oneself and bad outcomes to external forces; Campbell and Sedikides, 1999; Hughes and Zaki, 2015). Using the RPE from our winning model, we also found robust activation of the striatum and vmPFC during feedback, demonstrating that participants are exhibiting prediction error activation consistent with the previous literature.
While these results reiterate that the striatum is integral for simple reinforcement learning, it was unclear whether additional regions contribute to a process of agency-modulated reinforcement learning. To investigate how causal beliefs influence feedback learning, we first conducted an exploratory whole-brain analysis using the model parameter as a parametric modulator to identify regions associated with agency beliefs. We found that activation in both AI and IFG was associated with increased self-agency beliefs. We confirmed these results using a model-agnostic, whole-brain analysis that tested the interaction between feedback valence and task condition. These results showed significant clusters of activation in AI extending to IFG.
A wealth of evidence implicates both AI and IFG in a variety of functions related to causal inference. In particular, the insula is recruited during agency judgments (Farrer and Frith, 2002; David et al., 2008; Sperduti et al., 2011), and both the insula and IFG are activated when rewards are personally chosen versus when they are chosen by a computer (Romaniuk et al., 2019). There is also evidence that these regions are especially sensitive to negative self-attributions (Cabanis et al., 2013), personally undesirable estimation errors (Sharot et al., 2011), and both self-generated and externally generated errors (Cracco et al., 2016). The IFG has also been shown to represent action–outcome likelihoods, and observed and executed goals or actions (Iacoboni et al., 1999; Heiser et al., 2003).
While AI and IFG seem to play a role in the representation of causal beliefs, our findings shed light on the specific computational processes associated with these regions during causal and latent state inference. Previously, we demonstrated that causal beliefs and their updating track with activation of the right AI and bilateral IFG, respectively, when participants made inferences about the causal relationships among cues, contexts, and outcomes (Tomov et al., 2018). In addition, representations of the belief about causal structure in the AI tracked with variability in behavioral sensitivity to the true causal structure of the environment (Tomov et al., 2018). Similarly, we previously reported an overlapping region of right AI that tracks likelihood estimates of group membership (Lau et al., 2020). Importantly, this estimate is calculated by gauging how similar the participant is to each of the possible group members, necessitating some form of self-representation. Indeed, a recent study reports that AI and IFG activation are associated with causal structure in a self-concept network (Elder et al., 2020). Together, these results suggest that AI and IFG represent inferences about the structure of the environment by calculating, integrating, and comparing information using the self as a reference point. Both AI and IFG have been associated with a number of self-referential and self-related processes, including interoceptive awareness (Critchley et al., 2004; Mutschler et al., 2009), error awareness (Klein et al., 2013), mismatch detection, subjective confidence (Sherman et al., 2016), and self-awareness or consciousness (Karnath et al., 2005; Craig, 2009; Braun et al., 2018).
Our finding that dorsal and ventral subdivisions of the striatum encode different RPEs dovetails with literature suggesting various action-related functional distinctions between these regions. Studies have overwhelmingly implicated the DS in instrumental learning tasks, which involve outcome-linked, self-generated actions (O'Doherty et al., 2004; Tricomi et al., 2004). However, DS not only tracks underlying reward–outcome contingencies, it also tracks information about beliefs regarding these contingencies. For example, DS is activated for self-serving attributions, when participants believe they cause positive outcomes and someone or something else causes negative outcomes (Blackwood et al., 2003; Seidel et al., 2010).
Our results also provide a possible explanation for how causal beliefs in the insula integrate with agency-modulated RPEs in DS. Specifically, we found that AI is functionally coupled to DS, which is consistent with anatomic studies showing white matter tracts between these regions (Ghaziri and Nguyen, 2018; Tian and Zalesky, 2018). This coupling suggests that beliefs about causal structure might be passed from AI to DS to compute the agency-modulated RPE that is ultimately used for updating action values. Additionally, this analysis did not favor coupling between VS and DS. This is consistent with an architecture in which the two striatal regions receive RPE signals independently from each other (e.g., from midbrain dopaminergic neurons), rather than VS passing the unmodulated RPE to DS. This interpretation is consistent with theories of parallel striatal architectures, which posit that ventral and dorsal striatum compute different types of RPEs in parallel (Joel et al., 2002), rather than theories of serial striatal architectures, which suggest that RPE information is passed from some parts of the striatum to others in a serial fashion (Haber et al., 2000; Voorn et al., 2004; Ikeda et al., 2013).
The current study also demonstrated functional connectivity between IFG and AI during feedback, which is consistent with studies of white matter connectivity in humans (Deen et al., 2011; Cerliani et al., 2012). However, our analysis was unable to distinguish the direction of connectivity, so it remains unclear whether IFG computes causal beliefs and passes them to AI, or vice versa. This could be investigated in future studies using perturbation techniques such as transcranial magnetic stimulation and transcranial direct current stimulation. If the locus of the computation lies in the IFG, then perturbing both regions should have the same effect on behavior. Alternatively, if the locus of the computation lies in AI, then only perturbing AI should have an effect. Such interventional studies would circumvent the limitations of structural equation modeling and other methods for determining neural connectivity from observational data, which are suggestive of true underlying anatomic connectivity or information flow.
One limitation of our study is that it was not designed to disentangle RPE from feedback valence. Consequently, feedback is highly correlated with RPE in our design, and including it as a nuisance regressor in our GLMs eliminates all effects of RPE and RPE * . This points to an alternative interpretation of our findings, namely that feedback (rather than RPE) modulated by causal belief is represented in dorsal striatum, and unmodulated feedback is represented in ventral striatum. However, RPE coding in striatal BOLD is a well established finding (Berns et al., 2001; Breiter et al., 2001; Knutson et al., 2001; Pagnoni et al., 2002; McClure et al., 2003; O'Doherty et al., 2003, 2004), and, like many studies of reward learning, we sought to directly build on these findings, rather than to replicate what is already known. Future work could address this limitation by augmenting the experimental design with additional conditions with positive/negative RPEs crossed with positive/negative feedback.
In summary, these results build on our previous behavioral and modeling work to shed light on the brain networks that underpin agency-modulated reinforcement learning. Our results point to AI and IFG as possible origin regions of causal beliefs about agency, which DS then integrates with RPE signals. This agency-modulated RPE is distinct from and computed in parallel with the unmodulated RPE represented in VS. Together, these results bridge the gap between the rich literature grounding reinforcement learning in basal ganglia circuitry and recent evidence of causal structure learning in the PFC. By linking these regions in a way that is consistent with their prescribed combinational role, our findings pave the way to characterizing the neural circuits that allow humans to properly attribute outcomes to themselves or to external causes, and to use that knowledge for rational reward-based learning.
Footnotes
Funding for this work was provided by the Office of Naval Research (Grants N00014-17-1-2984 and N00014-17-1-2961), the Toyota Corporation, and the Alfred P. Sloan Foundation. The TETRAD software was developed by the Center for Causal Discovery at the University of Pittsburgh, supported by Grant U54HG008540.
The authors declare no competing financial interests.
References
- Balleine BW, Delgado MR, Hikosaka O (2007) The role of the dorsal striatum in reward and decision-making. J Neurosci 27:8161–8165. 10.1523/JNEUROSCI.1554-07.2007 [DOI] [PMC free article] [PubMed] [Google Scholar]
- Berns GS, McClure SM, Pagnoni G, Montague PR (2001) Predictability modulates human brain response to reward. J Neurosci 21:2793–2798. 10.1523/JNEUROSCI.21-08-02793.2001 [DOI] [PMC free article] [PubMed] [Google Scholar]
- Blackwood NJ, Bentall RP, Ffytche DH, Simmons A, Murray RM, Howard RJ (2003) Self-responsibility and the self-serving bias: an fMRI investigation of causal attributions. Neuroimage 20:1076–1085. 10.1016/S1053-8119(03)00331-8 [DOI] [PubMed] [Google Scholar]
- Bollen KA, Pearl J (2013) Eight myths about causality and structural equation models. In: Handbooks of sociology and social research. Amsterdam: Springer. [Google Scholar]
- Braun N, Debener S, Spychala N, Bongartz E, Sörös P, Müller HHO, Philipsen A (2018) The senses of agency and ownership: a review. Front Psychol 9:535. 10.3389/fpsyg.2018.00535 [DOI] [PMC free article] [PubMed] [Google Scholar]
- Breiter HC, Aharon I, Kahneman D, Dale A, Shizgal P (2001) Functional imaging of neural responses to expectancy and experience of monetary gains and losses. Neuron 30:619–639. 10.1016/s0896-6273(01)00303-8 [DOI] [PubMed] [Google Scholar]
- Cabanis M, Pyka M, Mehl S, Müller BW, Loos-Jankowiak S, Winterer G, Wölwer W, Musso F, Klingberg S, Rapp AM, Langohr K, Wiedemann G, Herrlich J, Walter H, Wagner M, Schnell K, Vogeley K, Kockler H, Shah NJ, Stöcker T, et al. (2013) The precuneus and the insula in self-attributional processes. Cogn Affect Behav Neurosci 13:330–345. 10.3758/s13415-012-0143-5 [DOI] [PubMed] [Google Scholar]
- Campbell WK, Sedikides C (1999) Self-threat magnifies the self-serving bias: a meta-analytic integration. Rev Gen Psychol 3:23–43. 10.1037/1089-2680.3.1.23 [DOI] [Google Scholar]
- Cerliani L, Thomas RM, Jbabdi S, Siero JCW, Nanetti L, Crippa A, Gazzola V, D'Arceuil H, Keysers C (2012) Probabilistic tractography recovers a rostrocaudal trajectory of connectivity variability in the human insular cortex. Hum Brain Mapp 33:2005–2034. 10.1002/hbm.21338 [DOI] [PMC free article] [PubMed] [Google Scholar]
- Cohen AO, Nussenbaum K, Dorfman HM, Gershman SJ, Hartley CA (2020) The rational use of causal inference to guide reinforcement learning strengthens with age. NPJ Sci Learn 5:16. 10.1038/s41539-020-00075-3 [DOI] [PMC free article] [PubMed] [Google Scholar]
- Cracco E, Desmet C, Brass M (2016) When your error becomes my error: anterior insula activation in response to observed errors is modulated by agency. Soc Cogn Affect Neurosci 11:357–366. 10.1093/scan/nsv120 [DOI] [PMC free article] [PubMed] [Google Scholar]
- Craig ADB (2009) How do you feel–now? The anterior insula and human awareness. Nat Rev Neurosci 10:59–70. [DOI] [PubMed] [Google Scholar]
- Critchley HD, Wiens S, Rotshtein P, Ohman A, Dolan RJ (2004) Neural systems supporting interoceptive awareness. Nat Neurosci 7:189–195. 10.1038/nn1176 [DOI] [PubMed] [Google Scholar]
- David N, Newen A, Vogeley K (2008) The “sense of agency” and its underlying cognitive and neural mechanisms. Conscious Cogn 17:523–534. 10.1016/j.concog.2008.03.004 [DOI] [PubMed] [Google Scholar]
- Deen B, Pitskel NB, Pelphrey KA (2011) Three systems of insular functional connectivity identified with cluster analysis. Cereb Cortex 21:1498–1506. 10.1093/cercor/bhq186 [DOI] [PMC free article] [PubMed] [Google Scholar]
- Dorfman HM, Bhui R, Hughes BL, Gershman SJ (2019) Causal inference about good and bad outcomes. Psychol Sci 30:516–525. 10.1177/0956797619828724 [DOI] [PMC free article] [PubMed] [Google Scholar]
- Elder J, Cheung B, Davis T, Hughes BL (2020) Mapping the self: a network approach for understanding psychological and neural representations of self-concept structure. PsyArXiv. Advance online publication. Retrieved July 8, 2021. doi: 10.31234/osf.io/hj87w. [DOI] [PubMed] [Google Scholar]
- Farrer C, Frith CD (2002) Experiencing oneself vs another person as being the cause of an action: the neural correlates of the experience of agency. Neuroimage 15:596–603. 10.1006/nimg.2001.1009 [DOI] [PubMed] [Google Scholar]
- Ghaziri J, Nguyen DK (2018) Structural connectivity of the insula. In: Island of Reil (insula) in the human brain: anatomical, functional, clinical and surgical aspects (Turgut M, Yurttaş C, Tubbs RS, eds), pp 77–83. Cham, Switzerland: Springer International. [Google Scholar]
- Haber SN, Fudge JL, McFarland NR (2000) Striatonigrostriatal pathways in primates form an ascending spiral from the shell to the dorsolateral striatum. J Neurosci 20:2369–2382. 10.1523/JNEUROSCI.20-06-02369.2000 [DOI] [PMC free article] [PubMed] [Google Scholar]
- Heiser M, Iacoboni M, Maeda F, Marcus J, Mazziotta JC (2003) The essential role of Broca's area in imitation. Eur J Neurosci 17:1123–1128. 10.1046/j.1460-9568.2003.02530.x [DOI] [PubMed] [Google Scholar]
- Hughes BL, Zaki J (2015) The neuroscience of motivated cognition. Trends Cogn Sci 19:62–64. 10.1016/j.tics.2014.12.006 [DOI] [PubMed] [Google Scholar]
- Iacoboni M, Woods RP, Brass M, Bekkering H, Mazziotta JC, Rizzolatti G (1999) Cortical mechanisms of human imitation. Science 286:2526–2528. 10.1126/science.286.5449.2526 [DOI] [PubMed] [Google Scholar]
- Igolkina AA, Meshcheryakov G (2020) Semopy: a Python package for structural equation modeling. Struct Equ Modeling 27:952–963. 10.1080/10705511.2019.1704289 [DOI] [Google Scholar]
- Ikeda H, Saigusa T, Kamei J, Koshikawa N, Cools AR (2013) Spiraling dopaminergic circuitry from the ventral striatum to dorsal striatum is an effective feed-forward loop. Neuroscience 241:126–134. 10.1016/j.neuroscience.2013.03.023 [DOI] [PubMed] [Google Scholar]
- Joel D, Niv Y, Ruppin E (2002) Actor-critic models of the basal ganglia: new anatomical and computational perspectives. Neural Netw 15:535–547. 10.1016/S0893-6080(02)00047-3 [DOI] [PubMed] [Google Scholar]
- Karnath H-O, Baier B, Nägele T (2005) Awareness of the functioning of one's own limbs mediated by the insular cortex? J Neurosci 25:7134–7138. 10.1523/JNEUROSCI.1590-05.2005 [DOI] [PMC free article] [PubMed] [Google Scholar]
- Klein TA, Ullsperger M, Danielmeier C (2013) Error awareness and the insula: links to neurological and psychiatric diseases. Front Hum Neurosci 7:14. 10.3389/fnhum.2013.00014 [DOI] [PMC free article] [PubMed] [Google Scholar]
- Knutson B, Fong GW, Adams CM, Varner JL, Hommer D (2001) Dissociation of reward anticipation and outcome with event-related fMRI. Neuroreport 12:3683–3687. 10.1097/00001756-200112040-00016 [DOI] [PubMed] [Google Scholar]
- Kriegeskorte N, Simmons WK, Bellgowan PSF, Baker CI (2009) Circular analysis in systems neuroscience: the dangers of double dipping. Nat Neurosci 12:535–540. [DOI] [PMC free article] [PubMed] [Google Scholar]
- Lau T, Gershman SJ, Cikara M (2020) Social structure learning in human anterior insula. Elife 9:e53162. 10.7554/eLife.53162 [DOI] [PMC free article] [PubMed] [Google Scholar]
- Leotti LA, Delgado MR (2011) The inherent reward of choice. Psychol Sci 22:1310–1318. 10.1177/0956797611417005 [DOI] [PMC free article] [PubMed] [Google Scholar]
- Matsumoto M, Hikosaka O (2009) Two types of dopamine neuron distinctly convey positive and negative motivational signals. Nature 459:837–841. 10.1038/nature08028 [DOI] [PMC free article] [PubMed] [Google Scholar]
- McClure SM, Berns GS, Montague PR (2003) Temporal prediction errors in a passive learning task activate human striatum. Neuron 38:339–346. 10.1016/S0896-6273(03)00154-5 [DOI] [PubMed] [Google Scholar]
- Meek C (1997) Graphical models: selecting causal and statistical models. PhD thesis, Carnegie Mellon University. [Google Scholar]
- Menegas W, Bergan JF, Ogawa SK, Isogai Y, Umadevi Venkataraju K, Osten P, Uchida N, Watabe-Uchida M (2015) Dopamine neurons projecting to the posterior striatum form an anatomically distinct subclass. Elife 4:e10032. 10.7554/eLife.10032 [DOI] [PMC free article] [PubMed] [Google Scholar]
- Mumford JA, Poline J-B, Poldrack RA (2015) Orthogonalization of regressors in FMRI models. PLoS One 10:e0126255. 10.1371/journal.pone.0126255 [DOI] [PMC free article] [PubMed] [Google Scholar]
- Mutschler I, Wieckhorst B, Kowalevski S, Derix J, Wentlandt J, Schulze-Bonhage A, Ball T (2009) Functional organization of the human anterior insular cortex. Neurosci Lett 457:66–70. 10.1016/j.neulet.2009.03.101 [DOI] [PubMed] [Google Scholar]
- Niv Y (2009) Reinforcement learning in the brain. J Math Psychol 53:139–154. 10.1016/j.jmp.2008.12.005 [DOI] [Google Scholar]
- O'Doherty JP, Dayan P, Friston K, Critchley H, Dolan RJ (2003) Temporal difference models and reward-related learning in the human brain. Neuron 38:329–337. 10.1016/S0896-6273(03)00169-7 [DOI] [PubMed] [Google Scholar]
- O'Doherty J, Dayan P, Schultz J, Deichmann R, Friston K, Dolan RJ (2004) Dissociable roles of ventral and dorsal striatum in instrumental conditioning. Science 304:452–454. [DOI] [PubMed] [Google Scholar]
- Pagnoni G, Zink CF, Montague PR, Berns GS (2002) Activity in human ventral striatum locked to errors of reward prediction. Nat Neurosci 5:97–98. 10.1038/nn802 [DOI] [PubMed] [Google Scholar]
- Peirce JW (2007) PsychoPy—Psychophysics software in Python. J Neurosci Methods 162:8–13. 10.1016/j.jneumeth.2006.11.017 [DOI] [PMC free article] [PubMed] [Google Scholar]
- Poldrack RA, Mumford JA, Nichols TE (2011) Handbook of functional MRI data analysis. Cambridge, UK: Cambridge UP. [Google Scholar]
- Ramsey JD, Hanson SJ, Hanson C, Halchenko YO, Poldrack RA, Glymour C (2010) Six problems for causal inference from fMRI. Neuroimage 49:1545–1558. 10.1016/j.neuroimage.2009.08.065 [DOI] [PubMed] [Google Scholar]
- Rigoux L, Stephan KE, Friston KJ, Daunizeau J (2014) Bayesian model selection for group studies—revisited. NeuroImage 84:971–985. 10.1016/j.neuroimage.2013.08.065 [DOI] [PubMed] [Google Scholar]
- Rolls ET, Joliot M, Tzourio-Mazoyer N (2015) Implementation of a new parcellation of the orbitofrontal cortex in the automated anatomical labeling atlas. Neuroimage 122:1–5. 10.1016/j.neuroimage.2015.07.075 [DOI] [PubMed] [Google Scholar]
- Romaniuk L, Sandu A-L, Waiter GD, McNeil CJ, Xueyi S, Harris MA, Macfarlane JA, Lawrie SM, Deary IJ, Murray AD, Delgado MR, Steele JD, McIntosh AM, Whalley HC (2019) The neurobiology of personal control during reward learning and its relationship to mood. Biol Psychiatry Cogn Neurosci Neuroimaging 4:190–199. 10.1016/j.bpsc.2018.09.015 [DOI] [PMC free article] [PubMed] [Google Scholar]
- Rosa MJ, Bestmann S, Harrison L, Penny W (2010) Bayesian model selection maps for group studies. Neuroimage 49:217–224. 10.1016/j.neuroimage.2009.08.051 [DOI] [PMC free article] [PubMed] [Google Scholar]
- Scheines R, Spirtes P, Glymour C, Meek C, Richardson T (1998) The TETRAD project: constraint based aids to causal model specification. Multivariate Behav Res 33:65–117. 10.1207/s15327906mbr3301_3 [DOI] [PubMed] [Google Scholar]
- Schultz W, Dayan P, Montague PR (1997) A neural substrate of prediction and reward. Science 275:1593–1599. 10.1126/science.275.5306.1593 [DOI] [PubMed] [Google Scholar]
- Seidel E-M, Eickhoff SB, Kellermann T, Schneider F, Gur RC, Habel U, Derntl B (2010) Who is to blame? Neural correlates of causal attribution in social situations. Soc Neurosci 5:335–350. 10.1080/17470911003615997 [DOI] [PMC free article] [PubMed] [Google Scholar]
- Sharot T, Korn CW, Dolan RJ (2011) How unrealistic optimism is maintained in the face of reality. Nat Neurosci 14:1475–1479. 10.1038/nn.2949 [DOI] [PMC free article] [PubMed] [Google Scholar]
- Sherman MT, Seth AK, Kanai R (2016) Predictions shape confidence in right inferior frontal gyrus. J Neurosci 36:10323–10336. 10.1523/JNEUROSCI.1092-16.2016 [DOI] [PMC free article] [PubMed] [Google Scholar]
- Späti J, Chumbley J, Doerig N, Brakowski J, Grosse Holtforth M, Seifritz E, Spinelli S (2015) Valence and agency influence striatal response to feedback in patients with major depressive disorder. J Psychiatry Neurosci 40:394–400. 10.1503/jpn.140225 [DOI] [PMC free article] [PubMed] [Google Scholar]
- Sperduti M, Delaveau P, Fossati P, Nadel J (2011) Different brain structures related to self- and external-agency attribution: a brief review and meta-analysis. Brain Struct Funct 216:151–157. 10.1007/s00429-010-0298-1 [DOI] [PubMed] [Google Scholar]
- Spirtes P (2005) Graphical models, causal inference, and econometric models. J Econ Methodol 12:3–34. 10.1080/1350178042000330887 [DOI] [Google Scholar]
- Stephan KE, Penny WD, Daunizeau J, Moran RJ, Friston KJ (2009) Bayesian model selection for group studies. Neuroimage 46:1004–1017. 10.1016/j.neuroimage.2009.03.025 [DOI] [PMC free article] [PubMed] [Google Scholar]
- Stolz DS, Müller-Pinzler L, Krach S, Paulus FM (2020) Internal control beliefs shape positive affect and associated neural dynamics during outcome valuation. Nat Commun 11:1230. 10.1038/s41467-020-14800-4 [DOI] [PMC free article] [PubMed] [Google Scholar]
- Tian Y, Zalesky A (2018) Characterizing the functional connectivity diversity of the insula cortex: subregions, diversity curves and behavior. Neuroimage 183:716–733. 10.1016/j.neuroimage.2018.08.055 [DOI] [PubMed] [Google Scholar]
- Tomov MS, Dorfman HM, Gershman SJ (2018) Neural computations underlying causal structure learning. J Neurosci 38:7143–7157. 10.1523/JNEUROSCI.3336-17.2018 [DOI] [PMC free article] [PubMed] [Google Scholar]
- Tricomi EM, Delgado MR, Fiez JA (2004) Modulation of caudate activity by action contingency. Neuron 41:281–292. 10.1016/s0896-6273(03)00848-1 [DOI] [PubMed] [Google Scholar]
- Tzourio-Mazoyer N, Landeau B, Papathanassiou D, Crivello F, Etard O, Delcroix N, Mazoyer B, Joliot M (2002) Automated anatomical labeling of activations in SPM using a macroscopic anatomical parcellation of the MNI MRI single-subject brain. Neuroimage 15:273–289. 10.1006/nimg.2001.0978 [DOI] [PubMed] [Google Scholar]
- van der Kouwe AJW, Benner T, Salat DH, Fischl B (2008) Brain morphometry with multiecho MPRAGE. Neuroimage 40:559–569. 10.1016/j.neuroimage.2007.12.025 [DOI] [PMC free article] [PubMed] [Google Scholar]
- Voorn P, Louk JM, Groenewegen HJ, Robbins TW, Pennartz CMA (2004) Putting a spin on the dorsal–ventral divide of the striatum. Trends Neurosci 27:468–474. 10.1016/j.tins.2004.06.006 [DOI] [PubMed] [Google Scholar]
- Watabe-Uchida M, Zhu L, Ogawa SK, Vamanrao A, Uchida N (2012) Whole-brain mapping of direct inputs to midbrain dopamine neurons. Neuron 74:858–873. 10.1016/j.neuron.2012.03.017 [DOI] [PubMed] [Google Scholar]
- Zink CF, Pagnoni G, Martin-Skurski ME, Chappelow JC, Berns GS (2004) Human striatal responses to monetary reward depend on saliency. Neuron 42:509–517. 10.1016/s0896-6273(04)00183-7 [DOI] [PubMed] [Google Scholar]