

Abstract
Episodic memory requires information to be stored and recalled in sequential order, and these processes are disrupted in schizophrenia. Hippocampal phase precession and theta sequences are thought to provide a biological mechanism for sequential ordering of experience at timescales suitable for plasticity. These phenomena have not previously been examined in any models of schizophrenia risk. Here, we examine these phenomena in a maternal immune activation (MIA) rodent model. We show that while individual pyramidal cells in the CA1 region continue to precess normally in MIA animals, the starting phase of precession as an animal enters a new place field is considerably more variable in MIA animals than in controls. A critical consequence of this change is a disorganization of the ordered representation of experience via theta sequences. These results provide the first evidence of a biological-level mechanism that, if it occurs in schizophrenia, may explain aspects of disorganized sequential processing that contribute to the cognitive symptoms of the disorder.
SIGNIFICANCE STATEMENT Hippocampal phase precession and theta sequences have been proposed as biophysical mechanisms by which the sequential structure of cognition might be ordered. Disturbances of sequential processing have frequently been observed in schizophrenia. Here, we show for the first time that phase precession and theta sequences are disrupted in a maternal immune activation (MIA) model of schizophrenia risk. This is a result of greater variability in the starting phase of precession, indicating that the mechanisms that coordinate precession at the assembly level are disrupted. We propose that this disturbance in phase precession underlies some of the disorganized cognitive symptoms that occur in schizophrenia. These findings could have important preclinical significance for the identification and treatment of schizophrenia risk factors.
Keywords: hippocampus, phase precession, schizophrenia, theta
Introduction
The hippocampus is known to be involved in memory-related processes where information is encoded, stored, and recalled sequentially, including spatial navigation (O'Keefe and Nadel, 1978), episodic memory (Tulving and Markowitsch, 1998), and thinking about the future (Schacter et al., 2007). Hippocampal phase precession has been proposed to underlie the sequential organization of information (Dragoi and Buzsáki, 2006; Wikenheiser and Redish, 2015; Jaramillo and Kempter, 2017; Buzsáki and Tingley, 2018). Phase precession describes the phenomenon whereby the firing of a hippocampal “place cell” precesses systematically from later to earlier phases of the underlying local field potential (LFP) theta oscillation as the animal advances across the cell's “place field” (O'Keefe and Recce, 1993; Skaggs et al., 1996; Huxter et al., 2003; Tingley and Buzsáki, 2018). Phase precession has also recently been confirmed in humans (Qasim et al., 2021).
At the network level, an emergent property of phase precession occurs when a population of cells with overlapping place fields are co-active (Fig. 1). Within a single theta cycle (∼120 ms), these cells tend to fire in a “theta sequence” (Foster and Wilson, 2007), thereby reproducing the ordered spatial arrangement of their place fields within a timescale that is appropriate for the induction of synaptic plasticity (Skaggs et al., 1996; Dan and Poo, 2004). Theta sequences may therefore provide a biological mechanism for sequential memory encoding and storage (Dragoi and Buzsáki, 2006; Jaramillo and Kempter, 2017), as well as event prediction (Foster and Wilson, 2007; Lisman and Redish, 2009; Wikenheiser and Redish, 2015). Coherent theta sequences depend on the coordinated activity of cell assemblies (Dragoi and Buzsáki, 2006; Itskov et al., 2008; Middleton and McHugh, 2016), so that co-active cells have both a similar degree of precession over space and time, and a similar starting phase as the animal enters a new firing field (Schmidt et al., 2009; Feng et al., 2015). A failure of this coordination could disrupt theta sequences, thereby disturbing some of the cellular mechanisms that underlie sequential memory and predictive processes.
Figure 1.

Schematic diagram of place cells, phase precession, and theta sequences. A, Canonical place field defined by firing rate. B, Example of a place field defined by its phase code. Note that cell spiking begins at a later phase of the theta cycle and precesses to an earlier phase as the animal moves through the field. The range of phase precession across the place field is also lower than 360°. C, Illustration of how the phase of firing of a single cell advances across several theta cycles as an animal moves from left to right through a place field as in B. D, When an animal is in a particular location along a track (top), there will be a number of place cells active, all with overlapping place fields (A-E; middle). Vertical black lines delineate the position of the animal in each of the place fields and the resultant phase of the theta cycle that the cell fires in. As a result, cells A-E fire in an ordered sequence across a theta cycle where the order matches their relative spatial relationship (bottom). Note that the generation of this ordered sequence depends on the starting phase and the slope of precession being coherent across all cells A-E.
Structural, biochemical, and functional abnormalities of the hippocampus have previously been observed in several neurodevelopmental disorders, including schizophrenia (Heckers and Konradi, 2002; Harrison, 2004; Li et al., 2019). Such disturbances likely contribute to several cognitive symptoms associated with schizophrenia, including the disorganization of sensory and contextual information, memory and imagination (Hardy-Baylé et al., 2003; D'Argembeau et al., 2008). Furthermore, sequential processing deficits that may have a hippocampal component are well documented in schizophrenia (Lisman and Buzsáki, 2008; Meck et al., 2013; Eichenbaum, 2017), including disturbed judgment of temporal order and duration (Ciullo et al., 2016; Thoenes and Oberfeld, 2017), and impaired sequence learning (Pedersen et al., 2008; Siegert et al., 2008). Similar deficits have also been observed in first-degree relatives and other at-risk individuals during the prodromal phase (Dickinson et al., 2007), and they are independent of other cognitive impairments (Ciullo et al., 2016), suggesting that they may be a primary feature of the disorder. It is possible, therefore, that dysfunction in hippocampal phase precession and theta sequences could underlie some of the sequencing and disorganization symptoms observed in schizophrenia (Lisman and Buzsáki, 2008). To our knowledge, however, no previous studies have systematically investigated theta sequences and phase precession in any models of the disorder.
Here, we examined phase precession and theta sequences in the maternal immune activation (MIA) model of schizophrenia risk. The MIA model is built on epidemiological evidence suggesting that exposure to viruses or other pathogens during the gestation period is an etiologic risk factor for the development of schizophrenia or autism spectrum disorder (Adams et al., 1993; Brown and Meyer, 2018). Several studies have confirmed that MIA offspring manifest many of the neurobiological, cognitive and behavioral symptoms of schizophrenia, including irregularities of hippocampal structure and neural transmission, reduced sensorimotor gating, decreased behavioral flexibility, and memory deficits (Meyer et al., 2005; Zuckerman and Weiner, 2005; Wolff and Bilkey, 2010; Brown and Meyer, 2018).
Materials and Methods
Animals and experimental design
All subjects were generated using the MIA intervention as we have described previously (Dickerson et al., 2010; Wolff and Bilkey, 2015). Female Sprague Dawley rats (approximately three months old) were time-mated with gestation day (GD)1 considered to be the first day after copulation. On GD15, pregnant rats were briefly anesthetized with isoflurane (5%; Bayer) and administered either a single injection of polyinosinic:polycytidylic acid (poly I:C; Sigma-Aldrich) 4.0 mg/kg, intravenous, dissolved in 0.9% saline (Baxter), or an equivalent saline injection 1 ml/kg. Poly I:C and saline treatments were always performed in pairs on the same day. All dams and pups were housed in open cages before weaning. After birth, litters were culled to a maximum of six male pups and, post-weaning, were housed in littermate groups of two to three in individually ventilated cages. Only male offspring were used for experimental purposes because of resource limitations. At this stage all pups were randomly allocated a litter number. The housing room was maintained at a normal 12/12 h light/dark cycle, and temperature controlled to 20–22°C. Immature rats were provided with access to food and water ad libitum, and after three months were food deprived to no less than 85% of their free-feeding weight in preparation for the experimental procedure. Water was available ad libitum throughout the entire experimental procedure. All rats weighed between 400 and 650 g at the time of surgery.
Apparatus and training
The apparatus consisted of a rectangular wooden circuit measuring 900 × 800 mm (Fig. 2A). All arms were 100 mm wide with 270-mm-high side walls. The entire apparatus was painted in matte black and was devoid of visual cues. A video camera was mounted to the ceiling of the recording room to track the animals' position, which was captured from three infrared LED lights attached to the acquisition system's head stage. All experiments were performed in a darkened environment with some ambient light from the recording computer and a small lamp aimed away from the apparatus into one corner of the room.
Figure 2.

Experimental procedures. A, Diagram of the rectangular track. Rats were pretrained to run in a clockwise direction for a food reward delivered at the center of the bottom arm. B, Diagram of the hippocampus showing the target area for surgical implantation, and an example photograph of histology demonstrating electrode placement in the pyramidal cell layer of CA1 (top). Below is a diagram of tetrode recording locations for both groups, with control (CTL) locations shown in black, and MIA locations in red. Modified image is originally from Paxinos and Watson (2006). C, Examples of cluster cutting of three separate cells for CTL and MIA recordings (on left), and an example of a place field (shown here before linearization of the track). The X denotes the reward area.
The mature male offspring (3–12 months) were trained over a period of 5–15 d. Animals were randomly selected according to their litter number, with a maximum of two rats per litter. On days 1–5, rats were habituated to the recording room, apparatus and food reward, and were allowed to free-forage for Coco Pops (Kellogg Company) scattered throughout the apparatus. Following successful habituation, whereby rats actively explored the maze and consumed the food reward, the placement of Coco Pops was gradually restricted, first to the top two corners of the track and in the center of the reward arm, and then to the reward arm only. During this period, rats were trained to run in a clockwise direction and were turned back to the correct direction with a paddle when necessary. Coco-pops (approximately six per reward delivery) were delivered manually by the experimenter. Training was considered completed when rats consistently ran in a clockwise direction for the food reward over a 20-min session.
Surgical procedures
All experimental protocols were approved by the Otago University Animal Ethics Committee and conducted in accordance with New Zealand animal welfare legislation. Following successful training, animals were anesthetized with 5% isoflurane (Merial New Zealand) in oxygen and maintained at 1.5–2.5% throughout surgery. After animals were deeply anesthetized, they were given a subcutaneous injection of Atropine (1 mg/kg) to ease their breathing, as well as the analgesics Carprofen (1 mg/kg) and Temgesic (buprenorphine; 0.1 ml), and a prophylactic antibiotic, Amphoprim (trimethoprim and sulfamethazine, 0.2 ml). Rats were then mounted on a stereotaxic apparatus (David Kopf Instruments) above a heating pad, and a lubricating eye gel (Visine) was applied. The scalp was shaved and sterilized with Betadine (Povidone-iodine), followed by a subcutaneous injection in the scalp of the local anesthetic Lopaine (lignocaine hydrochloride 20 mg ml−1; 0.1 ml diluted in 0.4 ml of saline). After exposing the skull, an opening was drilled above the left hemisphere dorsal hippocampus, and a custom built, eight-channel microdrive containing two moveable tetrode bundles of equal length was targeted to the CA1 subregion at −3.8 mm AP from bregma, −2.5 mm ML from the midline, and lowered just above the pyramidal cell layer (1.8 mm from dura; Fig. 2B). Electrodes consisted of 25-µm nichrome, heavy formvar insulated wire (Stablohm 675 HFV NATRL; California Fine Wire Company), and had been gold electroplated until impedences were reduced to ∼200–300 kΩ (NanoZ, Neuralynx). Microdrives were secured to the skull with jewelers' screws and dental cement, and a ground wire was secured to an additional screw placed above the right hemisphere. Post-surgery rats received a secondary dose of Amphoprim immediately on waking, and then an additional dose of Carprofen 24 h later. Rats were provided with ad libitum food and water postsurgery and were given 8 d to recover.
Experimental procedure and electrophysiological recordings
Following recovery, rats were again food deprived to no less than 85% of their free-feeding weight. Post-operative training was conducted to ensure that the animals could still perform the task adequately. Rats were then attached to a multichannel data acquisition system (DacqUSB; Axona Ltd), and single unit data were closely monitored as tetrodes were slowly lowered (∼40 µm/d) toward the dorsal CA1 pyramidal cell layer until well-isolated single units were identified. Extracellular unit activity was first passed through an AC-coupled unity gain amplifier before passing through to the recording system. Single unit data were bandpass filtered between 600 and 6000 Hz, and sampled at a rate of 48 kHz with 24-bit resolution. For each tetrode, one electrode with minimal spiking activity was selected as a reference. Action potential thresholds were set at a minimum of 70–80 µV and recorded for a 1-ms window whenever the spiking amplitude met this threshold. All spike events were time-stamped relative to the beginning of the recording. LFP data were simultaneously recorded from electrodes that has active place cells and were referenced to ground. LFP data were filtered at 500 Hz (with notch filtering selective for activity at 50 Hz) with a gain of ∼500, and sampled at 48 kHz. The animal's location was determined from three infrared LEDs mounted on the animal's headstage and recorded by a camera located above the chamber. Positional data were analyzed with a sampling rate of 50 Hz and then converted into x and y coordinates by the recording system. Once well-isolated single units were identified, tetrodes were not lowered any further for the duration of the experiment. Rats ran no more than one session per day, for ∼60–80 laps per session. Single unit, position and LFP data were saved for later analysis. All recordings with at least one putative place cell were included in the final dataset on the condition that there was a minimum of four separate recordings from that particular animal.
Isolation of single units
For each recording, single units were identified manually offline using purpose designed cluster cutting software (Plexon Offline Sorter, version 3), primarily via the peak-to-valley distance and principal components analysis of the waveforms. Putative place cells were isolated if they had an average firing rate <5 Hz, a peak to trough spike width of ∼400 µs, and a complex pattern of bursting activity identified from the autocorrelation of spike times (Fig. 2C). All cells that did not meet these criteria were excluded from further analysis. Sorted data were then exported to MATLAB (version R2019a, The MathWorks), and analysis of single unit, position and LFP data were conducted in MATLAB with custom-written scripts.
Analysis of place cell properties
The rectangular track was linearized so that the starting location was the lower left corner (Fig. 2A). Place fields were identified by dividing the track floor into 1-cm-long bins and creating an occupancy map from the position tracking data based on the amount of time the rat spent in each bin. Spikes were binned similarly for each single unit by identifying the number of spikes that occurred within each bin. Element-wise division was then used between the spike map and the occupancy map to create a firing mate map where each bin contained the firing rate for a cell. Firing rate maps were smoothed with a 10-cm-wide moving window. Place fields were then detected automatically by detecting regions of at least 10 cm in length that had a firing rate of at least twice the mean firing rate for the cell (Porter et al., 2018). If more than two place fields were detected for a cell, only the largest was analyzed. Following this, each place field map was analyzed separately to determine place field length and mean infield firing rate. Where place fields wrapped around the start-end position of the linearized maze they were linearly shifted before firing rate analysis.
Spatial information content provides a measure of how informative a spike from a cell is regarding the animal's current location within an environment. Place cells with a higher information value therefore provide a more reliable prediction of current location than cells with a lower information value (Skaggs et al., 1993). The formula for information content, measured in bits per spike is:
where the environment is divided into N distinct bins (i = 1, …, N), pI denotes the occupancy probability of bin i, λi is the mean firing rate for bin i, and λ is the overall mean firing rate of the cell.
Correlations of theta frequency and speed were generated for each recording from every tetrode that had single unit activity. This process involved estimating instantaneous values for theta frequency from the Hilbert transform of LFP filtered between 6 and 10 Hz. Estimates of instantaneous speed were determined by monitoring the animals change in position over 500-ms time windows. Speed and theta frequency data were then sampled at one second intervals and correlated. Samples where speed was below 5 cm/s were excluded from the analysis.
Analysis of LFP properties
Sampling of LFPs occurred from either the same electrode from which unit data were detected or one in the same bundle. LFP activity was sampled at 4800 Hz. To determine theta waveform shape, the LFP was bandpass filtered between 6 and 10 Hz and a phase profile was determined using the Hilbert transform. A sample waveform of 200-ms duration was subsequently captured whenever the phase data indicated a trough had been reached. These samples were then averaged, as were the phase profiles.
Phase precession analysis
For all phase precession analyses, the phase reference was always to the LFP signal taken from the CA1 pyramidal cell layer, and 0° corresponds to the trough of the oscillation. An EEG amplitude threshold was also applied to discard spikes recorded where theta was of very low amplitude. This threshold was set at 0.25 of 1 SD of the amplitude envelope generated by the Hilbert transform from the theta-filtered LFP of each recording. On average it removed ∼8% of spikes from the dataset. For all spikes that occurred within a place field, spike phase was determined by matching the animal's position within the place field to the instantaneous phase of the 6- to 10-Hz theta rhythm, and then analyzed using procedures described previously (Kempter et al., 2012). This involves using circular-linear regression to provide a robust estimate of the slope and phase offset of the regression line, and a correlation coefficient for circular-linear data analogous to the Pearson product-moment correlation coefficient for linear-linear data. The fits were constrained to have a slope of no more than −2 and +1 theta cycles per place field transverse. Phase precession analysis was conducted by pooling spiking data from all passes through the place field within a given recording session. Because theta states are associated with locomotion (Vanderwolf, 1969), phase precession analysis was only performed on data where the animal was running at least 5 cm/s.
Analysis of theta sequences
For this analysis recordings where at least three cells had been recorded simultaneously were identified. The place fields of these cells were then displayed on a 20 × 20 pixel matrix and the center marked manually. Here, the center was defined as the bin with the highest firing rate that was closest to the center of place field mass. For cells with multiple place fields, the largest place field was always selected except in cases where this cell was situated directly in the reward region. In such cases, the next largest place field located in a non-reward location was selected. Cells with a single place field located in the reward area were included if the place field covered regions adjacent to reward, but were excluded if they were restricted to reward area only (such cells had place fields that were smaller than average, and were not common). This was to ensure that analysis of cell spiking unrelated to the theta rhythm, such as that which occurs during epochs of consummation, when theta oscillations are absent or weak, was minimized. Place field location around the track was then converted to polar coordinates so that the distance between place fields could be represented in angular format. Ripple events (140–200 Hz) were detected in the LFP and any spikes that occurred during these events were discarded. The time between every spike generated by each of the cells in the recording was determined, and where that time interval was within a set window (e.g., 40 ms), the data were correlated with the angular distance between the place fields of the two cells using a circular-linear correlation. The use of a circular representation helped to resolve the difficulty of determining whether a place field is ahead of or behind another in a topologically circular apparatus.
Histology
Following completion of experiments, rats were anaesthetized with 5% isoflurane in oxygen, and a 2-mA direct current was passed through each electrode for ∼1 s to lesion the site of the electrode tip. Rats were then euthanized with an overdose of isoflurane and transcardially perfused, first with 120 ml of 0.9% saline, and then 120 ml of 10% formalin in saline. Brains were then carefully extracted from the skull after removal of the Microdrive, and stored in 10% formalin in saline. One week before sectioning, brains were transferred first to 10% formalin in H2O for 24 h, and then to a 10% formalin/30% sucrose solution for ∼3–7 d, until the brain sunk to the bottom of the sucrose solution. Dehydrated brains were then sectioned into 60-μm coronal slices with a cryostat (Leica CM1950). Sections were then mounted on slides and stained with a thionine acetate Nissl stain (Santa Cruz Biotechnology After slides were dry (minimum 24 h), electrode placement was imaged with a local power (1.5×) digital microscope (Leica Biosystems, LLC) to verify electrode placement (Fig. 2B).
Statistical analyses
For all statistical analyses, we performed the following procedure. First, raw data were transformed to a lognormal distribution if appropriate. All data (either in raw form or the log transform) were then checked for assumptions of normality and equality of variances. These checks were performed in GraphPad Prism 8.1.1 (GraphPad Software), using the D'Agostino–Pearson test for normality, and the F test to compare variances. If data did not meet the assumptions for normality based on the D'Agostino–Pearson test, visual inspection of histograms and QQ plots was performed, and extreme outliers were removed using the GraphPad function for removal of outliers. All data that failed to meet assumptions of normality based on this procedure were then analyzed using the appropriate non-parametric test. Details about the specific tests used are provided in the results section, and in Table 1. For normally distributed data with unequal variances, Welch's t test was used instead of a Student's t test. All t tests were two-tailed. Data with a normal distribution are presented as mean ± SEM unless explicitly stated otherwise in the figure legends. For all data that did not meet normality assumptions, the median is depicted instead. Significance levels were defined as p < 0.05. Additional information about significance levels is provided in the figures as: *p < 0.05, **p < 0.01, ***p < 0.001.
Table 1.
Measures of phase precession (circular-linear correlation) in hippocampal place cells following an MIA intervention
| Mean ± SEM | Test (df) | Result | Significant | ||
|---|---|---|---|---|---|
| All cells | CTL (n = 222) | MIA (n = 327) | |||
| Correlation | −0.10 ± 0.02 | −0.10 ± 0.02 | t test (547) | t = 0.36 | p = 0.717 |
| p Value | 0.22 ± 0.02 | 0.24 ± 0.02 | Mann−Whitney | U = 34,438 | p = 0.308 |
| Slope | −219.30 ± 15.24 | 222.62 ± 14.35 | Welch's t test (513.1) | t = 0.16 | p = 0.876 |
| Cells (s) for p < 0.05 | CTL (n = 112) | MIA (n = 145) | |||
| Correlation (s) | −0.15 ± 0.03 | −0.18 ± 0.02 | Mann−Whitney | U = 7992 | p = 0.829 |
| p Value (s) | 0.01 ± 0.00 | 0.007 ± 0.00 | Mann−Whitney | U = 7671 | p = 0.447 |
| Slope (s) | −267.44 ± 20.65 | −307.687 ± 19.61 | t test (255) | t = 1.41 | p = 0.161 |
Upper data include all cells. Lower data are from the subset of cells (marked “s”) that displayed significant (p < 0.05) phase precession.
Additional circular statistics (to compare group differences in the intercept of the circular correlation of phase and position, and to generate the mean vector length (MVL) for animal by animal and litter by litter analyses) were performed in Oriana 4 (Kovach Computing Services). Group differences for angular variance (defined as 1-MVL) were performed using the variance ratio F test, found at https://www.statskingdom.com/220VarF2.html.
Results
MIA results in increased firing rates, but basic place field properties and theta dynamics are largely unchanged
A total of 327 place cells from nine MIA animals and 222 place cells from eight control (CTL) animals were recorded from the dorsal CA1 region of the hippocampus as animals ran around a rectangular track for a food reward (refer to methods). The firing rate of cells recorded from MIA animals was significantly higher than for control cells, including both the mean firing rate (Mann–Whitney U = 26,557, p < 0.001) and the infield firing rate (U = 30,118, p < 0.001; Fig. 3A). The increased firing rates in the MIA group did not appear to be because of differences in running speed, as mean speed through the non-reward arms was not significantly different between groups (Mann–Whitney U = 76,689, p = 0.283; Fig. 3B). The MIA intervention had no significant effect on place field length (t(547) = 1.79, p = 0.075), although there was a trend toward slightly larger place fields among MIA cells (Fig. 3C). There was also no significant group difference for the information content measure of place field specificity (Mann–Whitney U = 76,475, p = 0.314; Fig. 3D). A comparison of the LFP activity, recorded from the electrodes at which place cells were located, showed that the frequency of theta oscillations was marginally, but significantly, lower in the CTL group (Welch's t(131.1) = 4.09, p < 0.001; Fig. 3F). Inspection of LFP waveforms revealed that CTL and MIA theta oscillations were of near identical shape, although CTL waves have a marginally, but significantly, higher amplitude (Mann–Whitney U = 64,494, p < 0.001; Fig. 3H). Importantly, the phase profile of the theta waveform, as generated by the Hilbert transform, was virtually identical across the two groups (Fig. 3I). However, only CTL recordings demonstrated evidence of theta frequency fluctuations that were significantly correlated with speed, as measured by a comparison of r values generated for each recording (Mann–Whitney U + 2669, p < 0.001; Fig. 3J).
Figure 3.
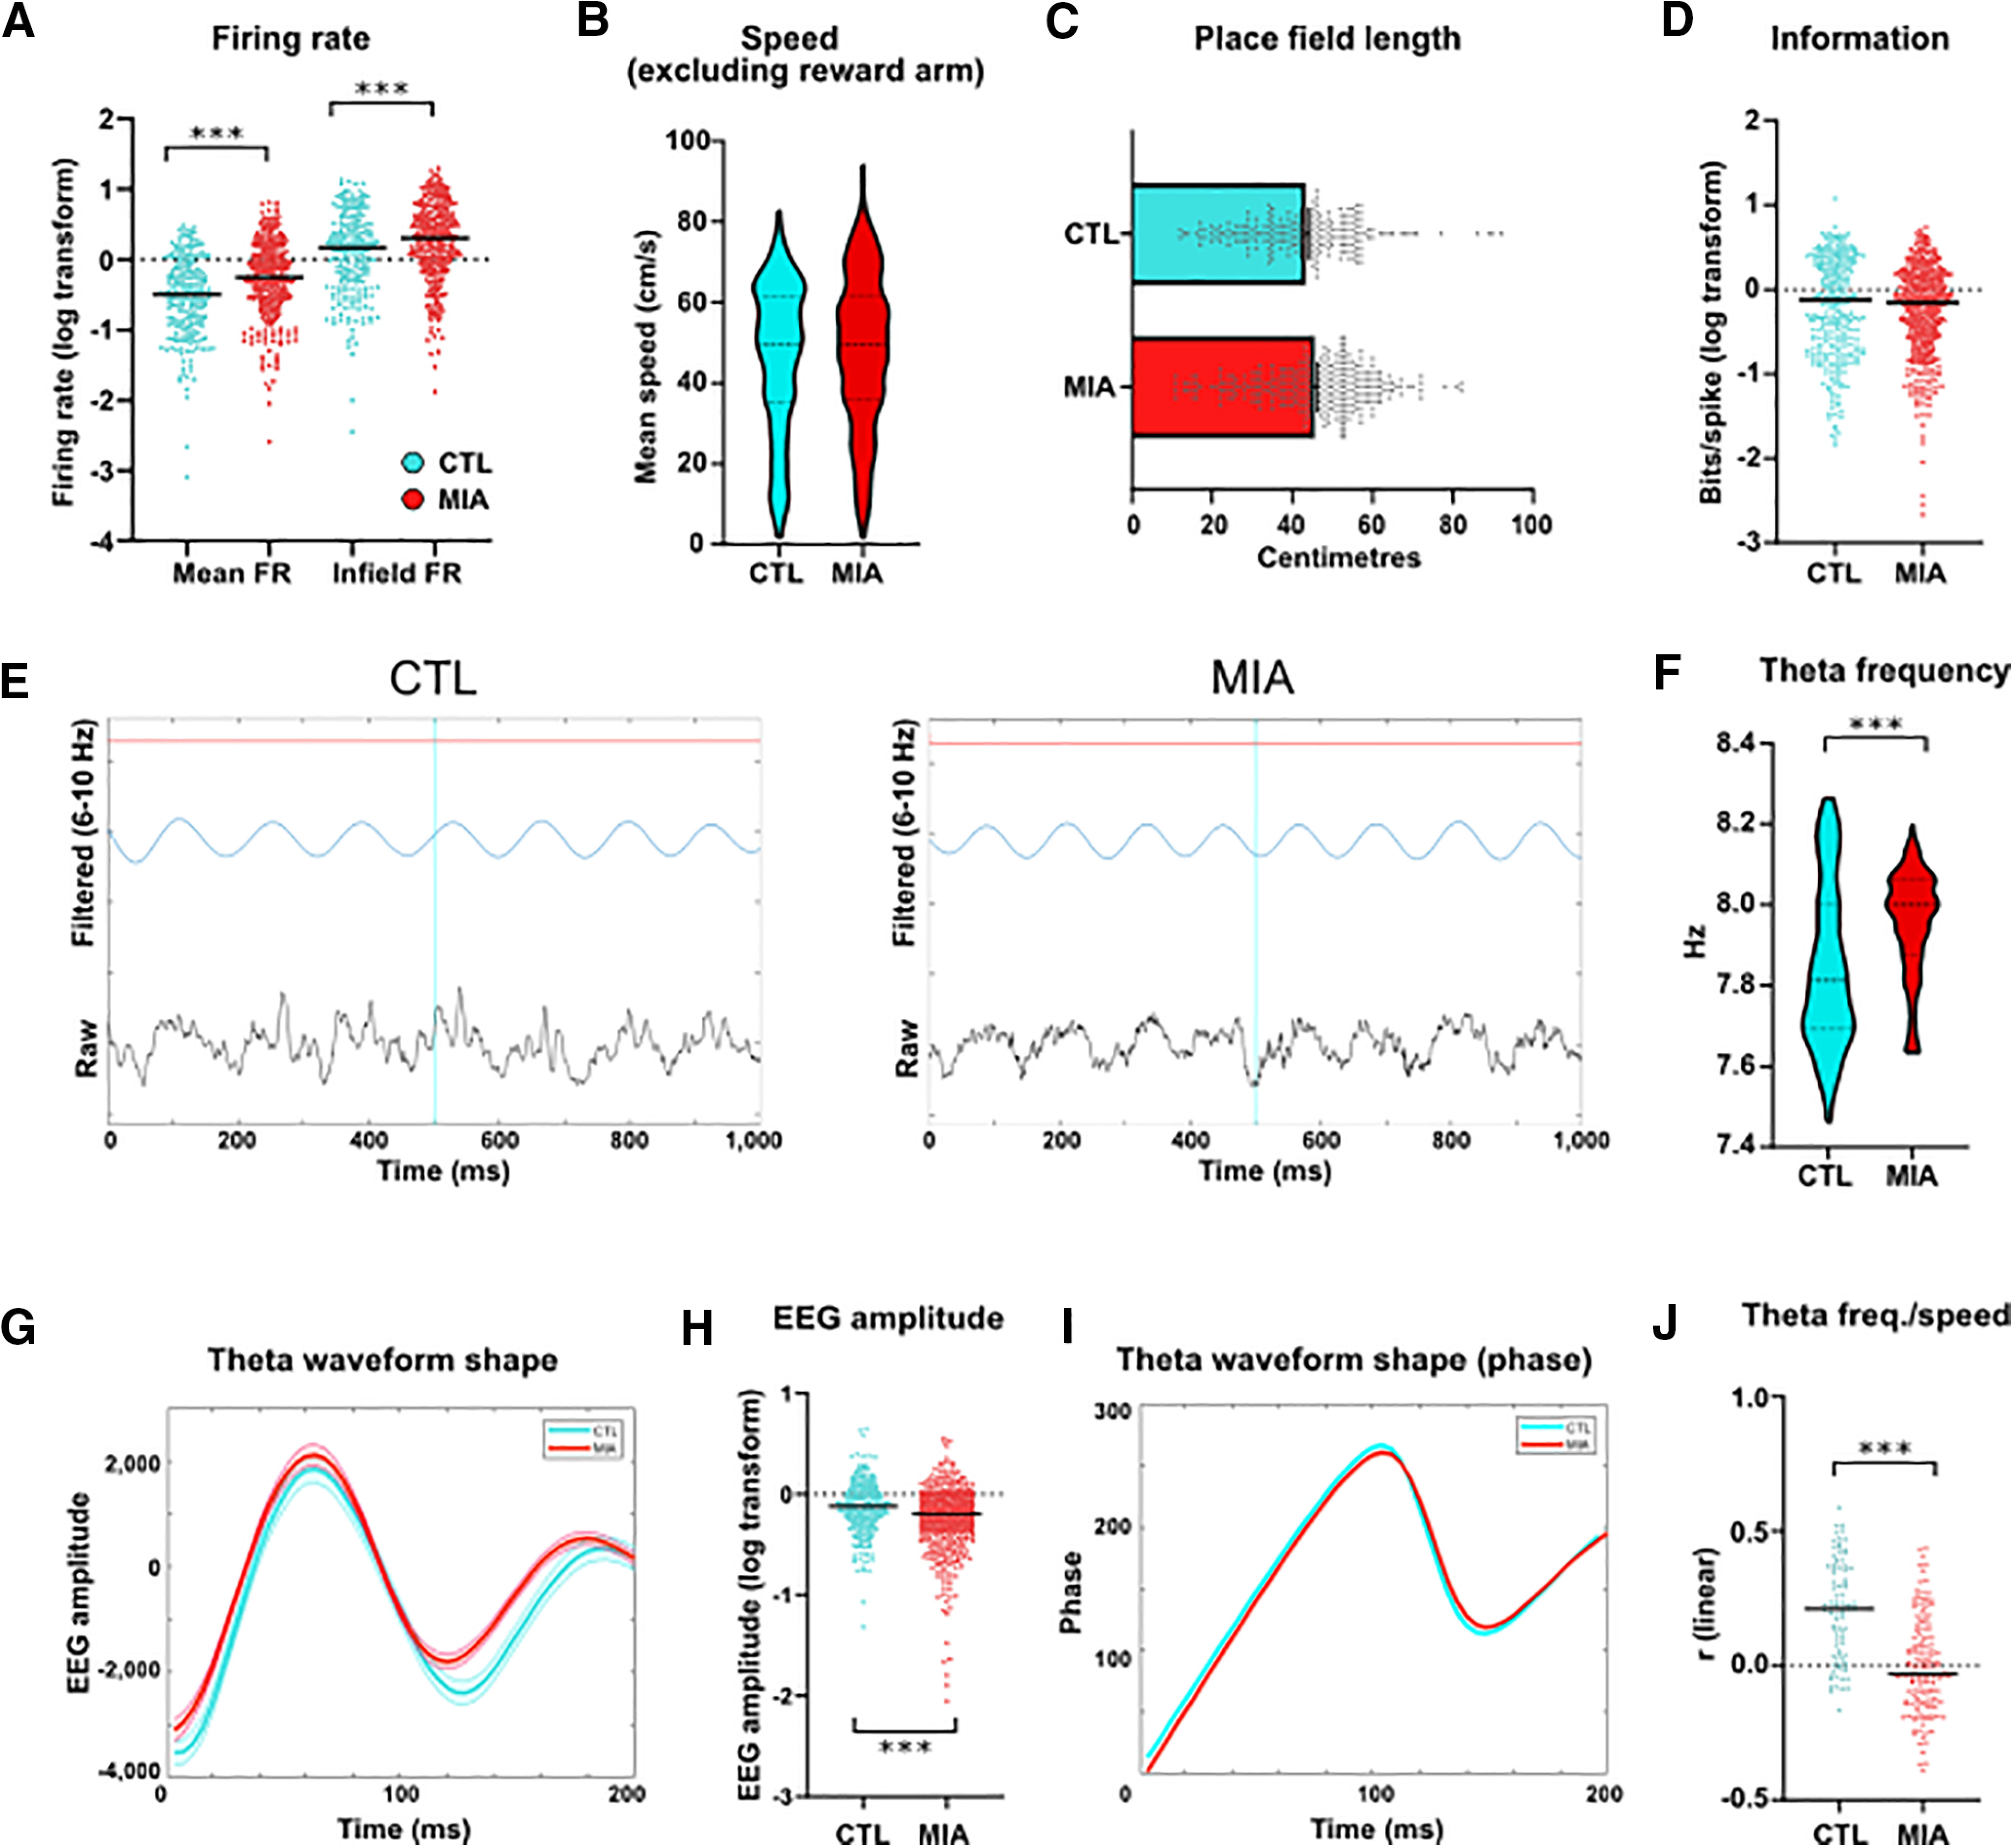
Basic properties of single units and LFP oscillations in MIA and CTL animals. A, Mean firing rates (FR) of single units across the entire track and inside the place field. Black bars denote the median. B, Mean speed across the three non-reward arms. C, Place field length. Bars denote mean and SE. D, Information content in bits per spike. Bars denote median. E, Example of filtered and raw EEG recordings. F, Theta frequency in Hertz. G, Average (±SEM) waveform shape for all LFP data, bandpass filtered between 6 and 10 Hz and with samples triggered from the trough. H, LFP amplitude. Bars denote median. I, Average phase profile of the theta waveform as in G, as determined from Hilbert transform. J, Median r value of the linear correlation of theta frequency and speed for each recording. Significance levels for all images: *p < 0.05, **p < 0.01, ***p < 0.001.
Individual cells continue to precess normally following the MIA manipulation
Phase precession was characterized as animals moved through the place fields of putative pyramidal cells. When data from all cells from each of the groups were examined, there was no significant difference between the MIA and CTL cells for the majority of phase precession properties. This included the r value of the circular-linear correlation of phase and position, the p value of that correlation, and the slope of the regression line (Table 1). These results indicated that the MIA intervention did not alter the ability of individual cells to precess, and that this precession had a similar structure and slope across the place field when compared with phase precession in CTL cells (for example plots, see Fig. 4). Since these data included all cells, regardless of whether they had significant phase precession (circular-linear correlation p < 0.05) or not, we also examined these characteristics in the subset of cells that had a significant p value for the circular-linear correlation (s = significant subset). This subset accounted for 50% of all CTL cells (n = 112) and 44% of MIA cells (n = 145). These proportions were not significantly different to expected values (χ2, p = 0.159). Again, we found no significant differences for any of the phase precession measures described above, confirming that individual cells continue to precess normally following an MIA intervention (Table 1, lower half), regardless of whether the whole population of cells, or just the significantly precessing cells were analyzed.
Figure 4.

A, Example plots of phase precession showing cell firing phase relative to position across the three non-reward arms of the track. Track is linearized, and zero on the x-axis corresponds to the bottom left corner in Figure 2A. Animal is moving left to right in these and other diagrams. Firing phase is duplicated across two theta cycles on the y-axis for clarity. B, Data as displayed in A, normalized to each place field for analysis. The red line denotes the line of best-fit for the circular-linear regression.
Starting phase of precession is more variable in the MIA group
While individual MIA cells appeared to display unimpaired phase precession, a clear between-group difference was observed for the intercept of the regression line of the circular-linear correlation, a measure that quantifies the starting phase of precession as the animal enters the place field (Fig. 5A). While the mean intercepts were similar between groups (CTL = 56.54°, MIA = 60.58°, where 0° denotes the trough of the theta oscillation at the cell layer, Watson Williams F(1,547) = 0.15, p = 0.694), the variance in starting phase angle was considerably lower for CTL cells, as evidenced by a longer MVL (CTL = 0.30, MIA = 0.13) and higher concentration (CTL = 0.62, MIA = 0.26). This difference between groups was confirmed in three separate analyses. First, we performed a Mardia–Watson–Wheeler test (a nonparametric test for circular data that considers differences in either the mean or variance), which returned a significant result (W = 7.27, p = 0.026). As further verification that this difference emerges specifically from the variance, we then performed a variance ratio F test on angular variance, which returned a significant result (F = 0.66, p < 0.001). We also computed the difference from the group mean angle for each individual cell and then compared between groups. Again, the result was significant (Mann–Whitney U = 31,516, p = 0.009), indicating that MIA cells have a higher variance in starting phase as they begin to precess through a place field (Fig. 5B). Although the starting phase variance was significantly greater in the MIA group, both groups had a non-uniform distribution of this measure that was significantly different from zero, indicating that, despite the variance, the MIA group still demonstrated a preferred starting phase (CTL Rayleigh Z = 19.44 p < 0.001; MIA Z = 5.59, p = 0.004). As before, we re-examined these differences using the subset of cells with significant phase-location correlations (p < 0.05). Again, MIA cells had a smaller MVL (CTL = 0.42, MIA = 0.24) and a lower concentration (CTL = 0.92, MIA = 0.49; Fig. 5C), although again, the intercept distribution was significantly different from zero in both groups, (CTL Rayleigh Z = 19.44, p = 0.001; MIA Z = 8.11, p < 0.001). The result of the Mardia–Watson–Wheeler test was significant (W = 7.09, p = 0.029), as was the variance ratio F test (F = 0.58, p = 0.003) and the group difference from mean angle (U = 6785, p = 0.024; Fig. 5D), confirming that circular variance remained higher in the MIA group. These results were not dependent on either the increased firing rates observed in MIA cells, as correlations between the difference from mean intercept angle and either infield firing rate or mean firing rate were non-significant for both groups (infield firing rates: CTL r = 0.00, p = 0.95; MIA r = 0.03, p = 0.591; mean firing rates: CTL r = –0.01, p = 0.892; MIA r = 0.06, p = 0.28).
Figure 5.
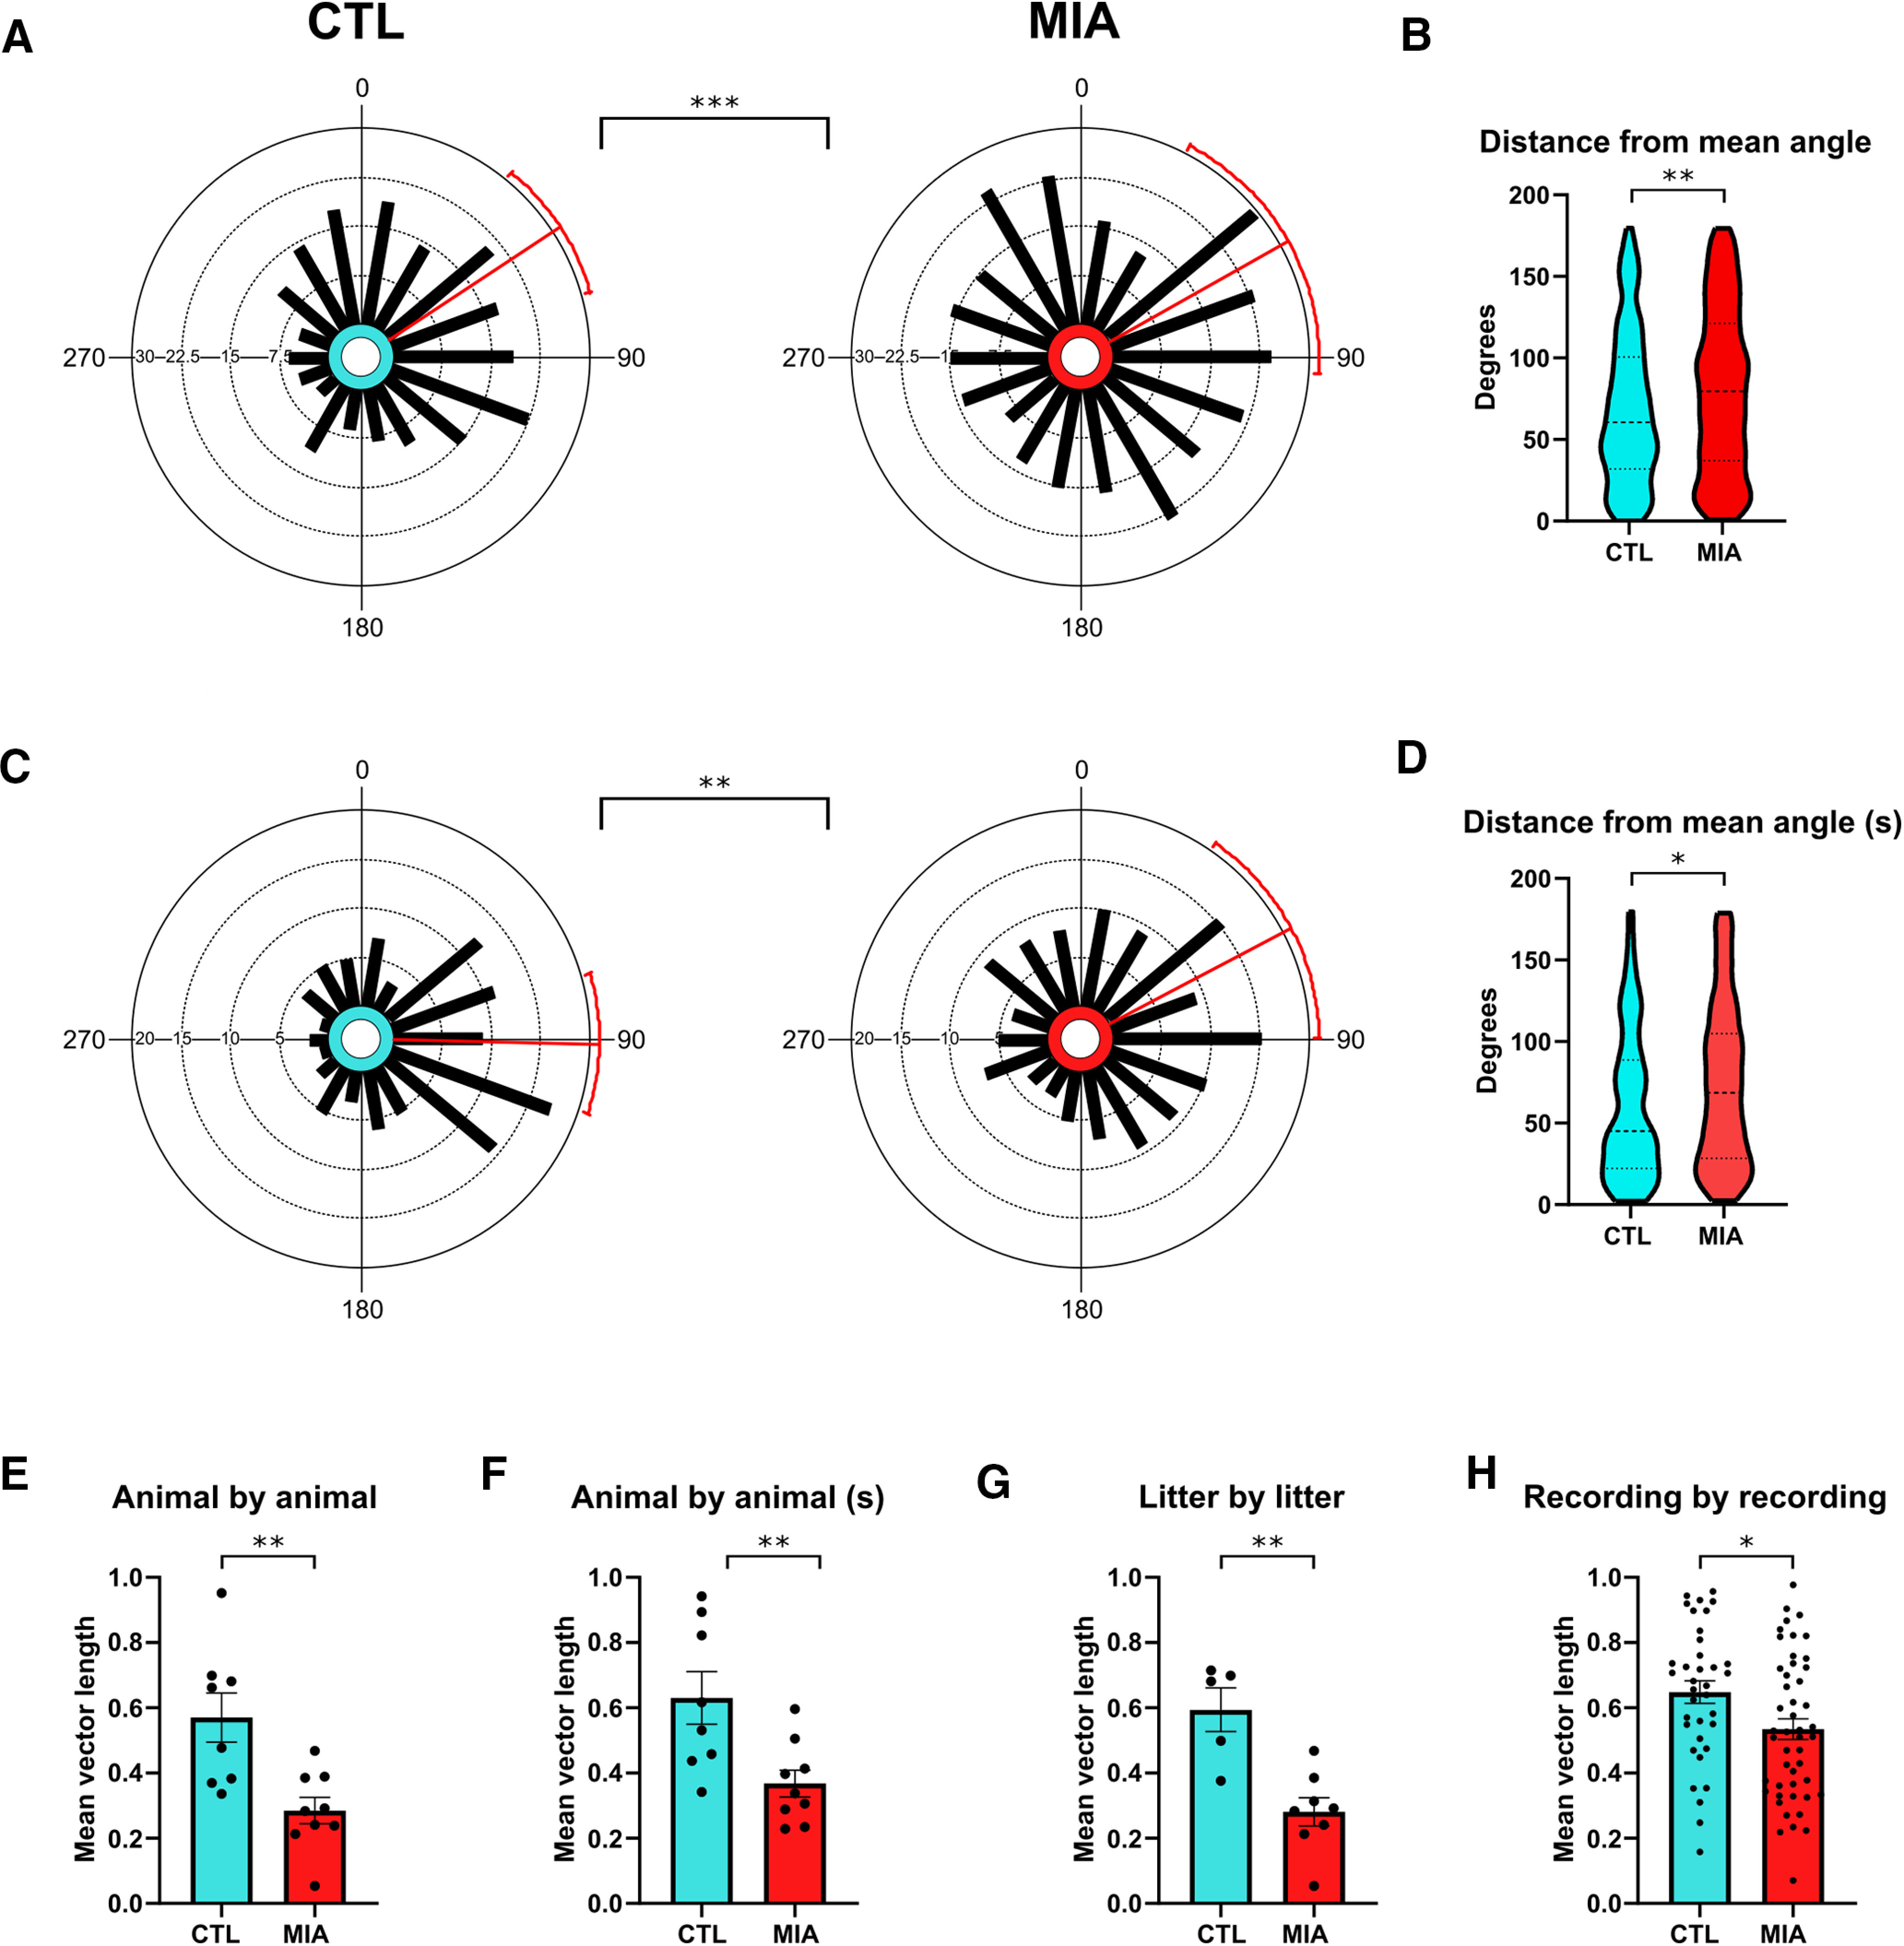
Precession starting phase is more variable in MIA cells. A, Circular histograms of intercept values for both groups, where all cells with a place field are included in the analysis. Red bars denote the mean angle with 95% confidence intervals. Between group differences are based on the variance ratio F test. B, Violin plots showing the distance from the mean angle for each individual cell. C, D, As for A, B, respectively, except only cells with significant phase precession (circular linear correlation p < 0.05) are included (s = significant subset). E, Mean vector length (MVL) on an animal-by-animal basis. F, As for E, but only including cells that have significant phase precession. G, MVL on a litter-by-litter basis. H, MVL calculated across cells recorded simultaneously in a single recording (three cells minimum). Error bars for E–H denote standard error.
To ensure that these results were not driven by aberrant recordings from a small proportion of the MIA animals, we also tested for starting phase variance on a between-animal basis (Fig. 5E). The MVL of the starting phase for CTL cells, calculated on a per animal basis was 0.57, much greater than that for MIA animals (0.29, t(15) = 3.43, p = 0.004). Again, these results were upheld following the removal of cells with weak (p > 0.05) phase precession (MVL CTL = 0.63; MIA = 0.37, t(15) = 3.01, p = 0.009; Fig. 5F). Similarly, when calculated across the litters from which each animal came from, the MVL of starting phase in MIA litters (0.28, n = 8) was significantly smaller than that of control litters (0.59, n = 5, t(11) = 4.13, p = 0.002; Fig. 5G), indicating that these results are consistent across both individual animals and litter groups.
The finding that cells from MIA animals show greater variability in phase precession starting phase, while other measures of the phenomenon, particularly the regression fit, remain intact, indicates that the variability does not occur on a moment-to-moment basis. One possibility is that individual MIA cells have particular preferred starting phases, which are stable over time for that cell and can co-occur simultaneously alongside other cells with widely different starting phases. An alternative possibility is that the population of MIA cells could all have a similar starting phase at a particular time period, but this starting phase could shift coherently for the population between one recording session and the next, which should not disrupt theta sequences. To examine this possibility, we determined the MVL across cells for each individual recording that had a minimum of three simultaneously recorded cells. The results showed a shorter MVL for MIA cells (0.53) compared with CTL cells (0.65; t(82) = 2.41, p = 0.018), indicating that starting phase was significantly more variable across simultaneously recorded MIA cells. This demonstrated that the phenomenon was not a result of recording-to-recording phase shifts across a coherent population (Fig. 5H).
Theta sequences are disrupted in the MIA group
One outcome of coordinated phase precession across a population of cells is a theta sequence, the phenomenon by which the firing of several place cells recapitulates their relative locations during a single theta cycle (Skaggs et al., 1996; Foster and Wilson, 2007). A possible effect of the increased variance of starting phase in MIA cells is a disturbance of the ordered temporal/spatial structure of theta sequences (Schmidt et al., 2009; Feng et al., 2015). To test for this, we examined the correlations between the spike time difference of simultaneously recorded cell pairs and the distance between their respective place fields. If theta sequences are intact, this correlation should be positive, indicating that the difference in firing time between individual place cells tends to be greater within the theta cycle when the individual cell's place fields are further apart. Because theta sequences are a circular phenomenon and because the running track was topologically circular it becomes difficult to determine lead/lag relationships at greater times and distances. For these reasons we limited our analysis to spike pairs from different cells that occurred within a portion of the theta cycle over a time window of 40 ms. This time period reflects the upper limits at which spike time-dependent plasticity (STDP) occurs (Dan and Poo, 2004), a plasticity phenomenon that has been linked theoretically to theta sequences (Mehta et al., 2002). It is also within the temporal window of sharp-wave ripple replay/preplay events and so spikes that occurred during ripples in the LFP were discarded to exclude this phenomenon. As predicted, we found a significant positive circular-linear correlation between the time difference between spike pairs and the distance between place fields in CTL cells (r = 0.11, p < 0.001; Fig. 6). In contrast, for MIA cells there was no correlation (r = 0.01, p = 0.447). The difference between the MIA and CTL correlation coefficients was significant when tested using Fisher's r to z transformation (z = 5.94, p < 0.001), confirming that theta sequences are disrupted in the MIA group. These results cannot be explained by group differences in place field distance, as the mean distance of CTL fields (86 ± 5.6°) was not statistically different to the MIA mean distance (82.7 ± 4.4, t(208) = 0.59, p = 0.553). With a 40-ms analysis window the slope of the time/distance relationship in CTL cells was 44° across the period, which corresponds to around 130° in a 120-ms theta cycle. This is lower than might be expected, as on average precession occurred over 220° of the theta cycle in our data; however, when the duration of the analysis window was reduced to 30 ms, the CTL slope was 56° (224° across a 120-ms theta cycle). In contrast, the slope for the MIA data fit was virtually flat (−1.3°/30 ms and −3.8°/40 ms; −5°/cycle and −11°/cycle respectively (Fig. 6).
Figure 6.

Significant positive circular-linear correlations occur between angular distance between place fields and the time between spikes in the CTL group, demonstrating that theta sequences are intact. In contrast, no such relationship was observed for the MIA group. The distance between place field centers in a clockwise direction (cw) is shown on the y-axis as a circular measure, repeated for two cycles for clarity. Time between spike pairs is shown on the x-axis for three different maximum time windows. In each example, the line of best fit, is projected out to 120 ms (approximately one theta cycle) to demonstrate how much phase shift might occur across a full cycle. Dashed blue lines are included to aid visualization of this phase shift.
Discussion
Our control data are consistent with previous studies showing that as an animal enters a CA1 place field, the cell's firing will initially occur just after the trough of the local theta cycle (O'Keefe and Recce, 1993; Skaggs et al., 1996; Dragoi and Buzsáki, 2006). In contrast, the MIA intervention produces greater variance in this starting phase, such that individual cells are more likely to begin firing at different phases of the theta cycle. This effect occurs without changes to other phase precession properties of individual cells, such as the robustness of precession and the phase/distance relationship (slope). This MIA-induced change was observed both at the level of the pooled dataset, and after filtering for the subset of cells that showed the strongest phase precession. Incoherent starting phase was also observed in the MIA group when data were analyzed on either an animal by animal or litter by litter basis. These disturbances also occurred independently of any group differences in place field size, information content, or mean speed through the non-reward arms. Furthermore, it was not related to differences in firing rate. There was no also evidence to suggest the small between-group differences we observed in theta amplitude and frequency were a factor, as the phase profile of theta was maintained across time and phase-location correlations were preserved.
Positive correlations of theta frequency and speed have been observed previously (Geisler et al., 2007), and our CTL data are consistent with these findings. This relationship was not apparent in the MIA group. This disruption is unlikely to account for the increased variability in starting phase observed in this group as phase precession does not appear to be affected by running speed (Huxter et al., 2003). Rather, given that theta frequency has been shown to predict speed via a hippocampal-lateral septum pathway (Bender et al., 2015), this may reflect disturbed transmission of theta sequences to downstream structures (Tingley and Buzsáki, 2018).
One potential explanation for the increased variance in starting phase is that electrode depth was more variable in the MIA group, as previous reports have demonstrated that theta phase varies with electrode depth across the stratum radiatum of CA1 (Buzsáki et al., 1985; Lubenov and Siapas, 2009). This explanation is unlikely however given that we observed no systematic differences in electrode placement after histology, and both cells and LFPs were always recorded from the same depth. Furthermore, starting phase variation in MIA animals could be observed across cells that were simultaneously recorded from the same tetrode bundle.
Theta sequences are phase precession-related phenomena whereby individual cells contribute to a population-based representation of the local ordering of place fields within a theta cycle. One predicted consequence of increased variability in the starting phase of precession is that theta sequences will be disrupted, such that the organized structure of spatial locations or experience will be reconstructed in a disorganized manner during the theta sequence (Fig. 7). Our data support this prediction, showing that in MIA animals there is a disruption in the temporal relationship between cell pair firing during a theta cycle and the spatial distance between the place fields of the cell pairs.
Figure 7.

The effect of the MIA manipulation on starting phase and theta sequences. A cartoon of CTL data is displayed on the left as for Figure 1B,D where coherent starting phase and slope allow cells A-E to fire in an ordered sequence within a theta cycle that matches the relative spatial ordering of the place cells' fields (bottom). Variance in starting phase, as occurs in the MIA animals (right), would, however, disrupt this replay sequence despite MIA cells still displaying phase precession. Note that as a consequence of the variable starting phase the disorganized theta sequence (bottom) is more dispersed across the theta cycle in MIA animals.
While it was initially assumed that theta sequences were an inevitable consequence of phase precession (Skaggs et al., 1996), recent findings suggest that they can be dissociated (Dragoi and Buzsáki, 2006; Foster and Wilson, 2007; Itskov et al., 2008; Feng et al., 2015). Our data provide additional evidence that theta sequences require additional network coherence above and beyond the precession of individual cells, including a consistent starting phase as animals enter a new place field. Inhibitory interneurons may play an important role in this process (Kamondi et al., 1998; Magee, 2001; Maurer et al., 2006; Losonczy et al., 2010; Royer et al., 2012; Chadwick et al., 2016; Nicola and Clopath, 2019). GABAergic systems are known to be disturbed in both schizophrenia patients (Akbarian and Huang, 2006), and in MIA animal models of the disorder (Dickerson et al., 2014; Corradini et al., 2018), including specific disruptions to PV expressing interneurons (Lodge et al., 2009; Gonzalez-Burgos et al., 2015; Steullet et al., 2017). These changes could underlie the increased starting phase variability demonstrated in this study, and are also consistent with the elevated firing rates observed in the MIA group.
In rodents, theta sequences are necessary for maintaining internally generated place fields when external cues are held constant (Wang et al., 2015), and for non-spatial event sequencing (Terada et al., 2017), suggesting that they may play a larger role in sequential processing beyond spatial cognition. Theta sequences have also been associated with goal planning and prediction (Gupta et al., 2012; Wikenheiser and Redish, 2015) and phase precession has been associated with non-spatial forms of sequential processing in both rodents (Pastalkova et al., 2008; Royer et al., 2012) and humans (Heusser et al., 2016; Qasim et al., 2021). In humans, the hippocampus is involved in both episodic memory processes and thinking about the future (Schacter et al., 2007), and theta sequences may therefore have a fundamental role in these processes (Wang et al., 2015; Jaramillo and Kempter, 2017; Terada et al., 2017; Buzsáki and Tingley, 2018). In support of this hypothesis, the developmental emergence of theta sequences coincides with the maturation of hippocampal memory (Muessig et al., 2019), and increases in hippocampal theta power have been observed in humans undertaking sequential planning tasks (Kaplan et al., 2020).
The disrupted theta sequences observed after a MIA intervention could therefore contribute to episodic and relational memory impairments. Although MIA-induced memory deficits are not always apparent in simple memory tasks, they frequently emerge as task complexity increases, including tasks that involve a working memory or reversal component (Bitanihirwe et al., 2010; Wolff et al., 2011; Savanthrapadian et al., 2013). To date no MIA study has explicitly examined sequential memory, although a recent study has demonstrated that MIA animals display deficits in temporal perception (Deane et al., 2017). In contrast, impairments in temporal processing and sequential ordering are well documented in individuals with schizophrenia, their first-degree relatives, and other at-risk individuals (Ciullo et al., 2016; Thoenes and Oberfeld, 2017). For example, a recent meta-analysis has confirmed that patients with schizophrenia have more variable, and therefore less precise, judgment of temporal order than healthy control participants (Thoenes and Oberfeld, 2017). This lack of precision when making temporal judgements may reflect a fundamental disorganization in the encoding and storage of events as they occur across time and space, such that the sequential order of information becomes scrambled or unstable. Disordered sequential processing could also have additional effects on a wide range of cognitive processes that require sequential ordering, including episodic memory, speech production, goal planning, and flexible decision-making processes. These cognitive processes are all disturbed in schizophrenia (Barch and Ceaser, 2012). It has also been suggested that disorganized temporal processing may be a potential trait marker of the disorder, with underlying relevance to several classic symptoms (Andreasen et al., 1999). For example, disordered sequences could contribute to erroneous connections being made between externally generated stimuli and internally generated thoughts and actions, resulting in misattributions of agency and control, as well as other forms of delusion and paranoia (Andreasen et al., 1999; Thoenes and Oberfeld, 2017).
One further consequence of increased variability in the starting phase of precession is that sequential spiking would not be clustered as tightly within each individual theta cycle, particularly if individual cells precess <360° (Schmidt et al., 2009). Thus, the clustering of spikes within a single theta cycle is likely to be more dispersed following an MIA intervention, potentially contributing to the erroneous association of spikes across successive theta cycles. For example, spikes which represent the end of an earlier sequence might be misattributed as early spikes in the next cycle (see Fig. 7). This may have important consequences in terms of how experience is segmented into “chunks” (Gupta et al., 2012), and as a result MIA animals may have difficulty processing discrete units of information that are updated continuously across successive theta cycles. One proposed analogy for this phenomenon is a series of sentences without punctuation marks, and this lack of “punctuation” may contribute to the confused order of thoughts that occurs in schizophrenia (Lisman and Buzsáki, 2008). Furthermore, such blurring of event boundaries is likely to have profound implications for memory and learning (Lisman and Buzsáki, 2008), as current evidence suggests that the ability to successfully parse events into meaningful segments predicts performance on numerous tasks (Richmond et al., 2017). Consistent with these findings, individuals with schizophrenia appear to have event segmentation deficits at both perceptual (Coffman et al., 2016) and high-order levels (Zalla et al., 2004).
In summary, our results demonstrate that the coherent activity of individually precessing cells is compromised following an MIA intervention, resulting in disordered theta sequences. This finding provides a potential biological-level mechanism that may explain some aspects of disorganized temporal processing in schizophrenia and underlie some of the core features of the disorder, particularly the disruption of episodic memory and planning processes.
Footnotes
This work was supported by the Health Research Council of New Zealand Grant 19/044.
The authors declare no competing financial interests.
References
- Adams W, Kendell R, Hare E, Munk-Jørgensen P (1993) Epidemiological evidence that maternal influenza contributes to the aetiology of schizophrenia: an analysis of Scottish, English, and Danish data. Br J Psychiatry 163:522–534. 10.1192/bjp.163.4.522 [DOI] [PubMed] [Google Scholar]
- Akbarian S, Huang H-S (2006) Molecular and cellular mechanisms of altered GAD1/GAD67 expression in schizophrenia and related disorders. Brain Res Rev 52:293–304. 10.1016/j.brainresrev.2006.04.001 [DOI] [PubMed] [Google Scholar]
- Andreasen NC, Nopoulos P, O'Leary DS, Miller DD, Wassink T, Flaum M (1999) Defining the phenotype of schizophrenia: cognitive dysmetria and its neural mechanisms. Biol Psychiatry 46:908–920. 10.1016/s0006-3223(99)00152-3 [DOI] [PubMed] [Google Scholar]
- Barch DM, Ceaser A (2012) Cognition in schizophrenia: core psychological and neural mechanisms. Trends Cogn Sci 16:27–34. 10.1016/j.tics.2011.11.015 [DOI] [PMC free article] [PubMed] [Google Scholar]
- Bender F, Gorbati M, Cadavieco MC, Denisova N, Gao X, Holman C, Korotkova T, Ponomarenko A (2015) Theta oscillations regulate the speed of locomotion via a hippocampus to lateral septum pathway. Nat Commun 6:8521. 10.1038/ncomms9521 [DOI] [PMC free article] [PubMed] [Google Scholar]
- Bitanihirwe BK, Peleg-Raibstein D, Mouttet F, Feldon J, Meyer U (2010) Late prenatal immune activation in mice leads to behavioral and neurochemical abnormalities relevant to the negative symptoms of schizophrenia. Neuropsychopharmacology 35:2462–2478. 10.1038/npp.2010.129 [DOI] [PMC free article] [PubMed] [Google Scholar]
- Brown AS, Meyer U (2018) Maternal immune activation and neuropsychiatric illness: a translational research perspective. Am J Psychiatry 175:1073–1083. 10.1176/appi.ajp.2018.17121311 [DOI] [PMC free article] [PubMed] [Google Scholar]
- Buzsáki G, Tingley D (2018) Space and time: the hippocampus as a sequence generator. Trends Cogn Sci 22:853–869. 10.1016/j.tics.2018.07.006 [DOI] [PMC free article] [PubMed] [Google Scholar]
- Buzsáki G, Rappelsberger P, Kellényi L (1985) Depth profiles of hippocampal rhythmic slow activity ('theta rhythm') depend on behaviour. Electroencephalogr Clin Neurophysiol 61:77–88. 10.1016/0013-4694(85)91075-2 [DOI] [PubMed] [Google Scholar]
- Chadwick A, van Rossum MC, Nolan MF (2016) Flexible theta sequence compression mediated via phase precessing interneurons. Elife 5:e20349. 10.7554/eLife.20349 [DOI] [PMC free article] [PubMed] [Google Scholar]
- Ciullo V, Spalletta G, Caltagirone C, Jorge RE, Piras F (2016) Explicit time deficit in schizophrenia: systematic review and meta-analysis indicate it is primary and not domain specific. Schizophr Bull 42:505–518. 10.1093/schbul/sbv104 [DOI] [PMC free article] [PubMed] [Google Scholar]
- Coffman BA, Haigh SM, Murphy TK, Salisbury DF (2016) Event-related potentials demonstrate deficits in acoustic segmentation in schizophrenia. Schizophr Res 173:109–115. 10.1016/j.schres.2016.03.012 [DOI] [PMC free article] [PubMed] [Google Scholar]
- Corradini I, Focchi E, Rasile M, Morini R, Desiato G, Tomasoni R, Lizier M, Ghirardini E, Fesce R, Morone D, Barajon I, Antonucci F, Pozzi D, Matteoli M (2018) Maternal immune activation delays excitatory-to-inhibitory gamma-aminobutyric acid switch in offspring. Biol Psychiatry 83:680–691. 10.1016/j.biopsych.2017.09.030 [DOI] [PubMed] [Google Scholar]
- Dan Y, Poo MM (2004) Spike timing-dependent plasticity of neural circuits. Neuron 44:23–30. [DOI] [PubMed] [Google Scholar]
- D'Argembeau A, Raffard S, Van der Linden M (2008) Remembering the past and imagining the future in schizophrenia. J Abnorm Psychol 117:247–251. 10.1037/0021-843X.117.1.247 [DOI] [PubMed] [Google Scholar]
- Deane AR, Millar J, Bilkey DK, Ward RD (2017) Maternal immune activation in rats produces temporal perception impairments in adult offspring analogous to those observed in schizophrenia. PLoS One 12:e0187719. 10.1371/journal.pone.0187719 [DOI] [PMC free article] [PubMed] [Google Scholar]
- Dickerson DD, Wolff AR, Bilkey DK (2010) Abnormal long-range neural synchrony in a maternal immune activation animal model of schizophrenia. J Neurosci 30:12424–12431. 10.1523/JNEUROSCI.3046-10.2010 [DOI] [PMC free article] [PubMed] [Google Scholar]
- Dickerson D, Overeem K, Wolff A, Williams J, Abraham W, Bilkey D (2014) Association of aberrant neural synchrony and altered GAD67 expression following exposure to maternal immune activation, a risk factor for schizophrenia. Transl Psychiatry 4:e418. 10.1038/tp.2014.64 [DOI] [PMC free article] [PubMed] [Google Scholar]
- Dickinson D, Ramsey ME, Gold JM (2007) Overlooking the obvious: a meta-analytic comparison of digit symbol coding tasks and other cognitive measures in schizophrenia. Arch Gen Psychiatry 64:532–542. 10.1001/archpsyc.64.5.532 [DOI] [PubMed] [Google Scholar]
- Dragoi G, Buzsáki G (2006) Temporal encoding of place sequences by hippocampal cell assemblies. Neuron 50:145–157. 10.1016/j.neuron.2006.02.023 [DOI] [PubMed] [Google Scholar]
- Eichenbaum H (2017) On the integration of space, time, and memory. Neuron 95:1007–1018. 10.1016/j.neuron.2017.06.036 [DOI] [PMC free article] [PubMed] [Google Scholar]
- Feng T, Silva D, Foster DJ (2015) Dissociation between the experience-dependent development of hippocampal theta sequences and single-trial phase precession. J Neurosci 35:4890–4902. 10.1523/JNEUROSCI.2614-14.2015 [DOI] [PMC free article] [PubMed] [Google Scholar]
- Foster DJ, Wilson MA (2007) Hippocampal theta sequences. Hippocampus 17:1093–1099. 10.1002/hipo.20345 [DOI] [PubMed] [Google Scholar]
- Geisler C, Robbe D, Zugaro M, Sirota A, Buzsáki G (2007) Hippocampal place cell assemblies are speed-controlled oscillators. Proc Natl Acad Sci USA 104:8149–8154. 10.1073/pnas.0610121104 [DOI] [PMC free article] [PubMed] [Google Scholar]
- Gonzalez-Burgos G, Cho RY, Lewis DA (2015) Alterations in cortical network oscillations and parvalbumin neurons in schizophrenia. Biol Psychiatry 77:1031–1040. 10.1016/j.biopsych.2015.03.010 [DOI] [PMC free article] [PubMed] [Google Scholar]
- Gupta AS, Van Der Meer MA, Touretzky DS, Redish AD (2012) Segmentation of spatial experience by hippocampal theta sequences. Nat Neurosci 15:1032–1039. 10.1038/nn.3138 [DOI] [PMC free article] [PubMed] [Google Scholar]
- Hardy-Baylé MC, Sarfati Y, Passerieux C (2003) The cognitive basis of disorganization symptomatology in schizophrenia and its clinical correlates: toward a pathogenetic approach to disorganization. Schizophr Bull 29:459–471. 10.1093/oxfordjournals.schbul.a007019 [DOI] [PubMed] [Google Scholar]
- Harrison PJ (2004) The hippocampus in schizophrenia: a review of the neuropathological evidence and its pathophysiological implications. Psychopharmacology (Berl) 174:151–162. 10.1007/s00213-003-1761-y [DOI] [PubMed] [Google Scholar]
- Heckers S, Konradi C (2002) Hippocampal neurons in schizophrenia. J Neural Transm (Vienna) 109:891–905. 10.1007/s007020200073 [DOI] [PMC free article] [PubMed] [Google Scholar]
- Heusser AC, Poeppel D, Ezzyat Y, Davachi L (2016) Episodic sequence memory is supported by a theta–gamma phase code. Nat Neurosci 19:1374–1380. 10.1038/nn.4374 [DOI] [PMC free article] [PubMed] [Google Scholar]
- Huxter J, Burgess N, O'Keefe J (2003) Independent rate and temporal coding in hippocampal pyramidal cells. Nature 425:828–832. 10.1038/nature02058 [DOI] [PMC free article] [PubMed] [Google Scholar]
- Itskov V, Pastalkova E, Mizuseki K, Buzsaki G, Harris KD (2008) Theta-mediated dynamics of spatial information in hippocampus. J Neurosci 28:5959–5964. 10.1523/JNEUROSCI.5262-07.2008 [DOI] [PMC free article] [PubMed] [Google Scholar]
- Jaramillo J, Kempter R (2017) Phase precession: a neural code underlying episodic memory? Curr Opin Neurobiol 43:130–138. 10.1016/j.conb.2017.02.006 [DOI] [PubMed] [Google Scholar]
- Kamondi A, Acsády L, Wang XJ, Buzsáki G (1998) Theta oscillations in somata and dendrites of hippocampal pyramidal cells in vivo: activity-dependent phase-precession of action potentials. Hippocampus 8:244–261. [DOI] [PubMed] [Google Scholar]
- Kaplan R, Tauste Campo A, Bush D, King J, Principe A, Koster R, Ley Nacher M, Rocamora R, Friston KJ (2020) Human hippocampal theta oscillations reflect sequential dependencies during spatial planning. Cogn Neurosci 11:122–131. 10.1080/17588928.2019.1676711 [DOI] [PubMed] [Google Scholar]
- Kempter R, Leibold C, Buzsáki G, Diba K, Schmidt R (2012) Quantifying circular–linear associations: hippocampal phase precession. J Neurosci Methods 207:113–124. 10.1016/j.jneumeth.2012.03.007 [DOI] [PubMed] [Google Scholar]
- Li Y, Shen M, Stockton ME, Zhao X (2019) Hippocampal deficits in neurodevelopmental disorders. Neurobiol Learn Mem 165:106945. 10.1016/j.nlm.2018.10.001 [DOI] [PMC free article] [PubMed] [Google Scholar]
- Lisman J, Buzsáki G (2008) A neural coding scheme formed by the combined function of gamma and theta oscillations. Schizophr Bull 34:974–980. 10.1093/schbul/sbn060 [DOI] [PMC free article] [PubMed] [Google Scholar]
- Lisman J, Redish AD (2009) Prediction, sequences and the hippocampus. Phil Trans R Soc Lond B Biol Sci 364:1193–1201. 10.1098/rstb.2008.0316 [DOI] [PMC free article] [PubMed] [Google Scholar]
- Lodge DJ, Behrens MM, Grace AA (2009) A loss of parvalbumin-containing interneurons is associated with diminished oscillatory activity in an animal model of schizophrenia. J Neurosci 29:2344–2354. 10.1523/JNEUROSCI.5419-08.2009 [DOI] [PMC free article] [PubMed] [Google Scholar]
- Losonczy A, Zemelman BV, Vaziri A, Magee JC (2010) Network mechanisms of theta related neuronal activity in hippocampal CA1 pyramidal neurons. Nat Neurosci 13:967–972. 10.1038/nn.2597 [DOI] [PMC free article] [PubMed] [Google Scholar]
- Lubenov EV, Siapas AG (2009) Hippocampal theta oscillations are travelling waves. Nature 459:534–539. 10.1038/nature08010 [DOI] [PubMed] [Google Scholar]
- Magee JC (2001) Dendritic mechanisms of phase precession in hippocampal CA1 pyramidal neurons. J Neurophysiol 86:528–532. 10.1152/jn.2001.86.1.528 [DOI] [PubMed] [Google Scholar]
- Maurer AP, Cowen SL, Burke SN, Barnes CA, McNaughton BL (2006) Phase precession in hippocampal interneurons showing strong functional coupling to individual pyramidal cells. J Neurosci 26:13485–13492. 10.1523/JNEUROSCI.2882-06.2006 [DOI] [PMC free article] [PubMed] [Google Scholar]
- Meck WH, Church RM, Matell MS (2013) Hippocampus, time, and memory—a retrospective analysis. Behav Neurosci 127:642–654. 10.1037/a0034201 [DOI] [PMC free article] [PubMed] [Google Scholar]
- Mehta M, Lee A, Wilson M (2002) Role of experience and oscillations in transforming a rate code into a temporal code. Nature 417:741–746. 10.1038/nature00807 [DOI] [PubMed] [Google Scholar]
- Meyer U, Feldon J, Schedlowski M, Yee BK (2005) Towards an immuno-precipitated neurodevelopmental animal model of schizophrenia. Neurosci Biobehav Rev 29:913–947. 10.1016/j.neubiorev.2004.10.012 [DOI] [PubMed] [Google Scholar]
- Middleton SJ, McHugh TJ (2016) Silencing CA3 disrupts temporal coding in the CA1 ensemble. Nat Neurosci 19:945–951. 10.1038/nn.4311 [DOI] [PubMed] [Google Scholar]
- Muessig L, Lasek M, Varsavsky I, Cacucci F, Wills TJ (2019) Coordinated emergence of hippocampal replay and theta sequences during post-natal development. Curr Biol 29:834–840.e4. 10.1016/j.cub.2019.01.005 [DOI] [PMC free article] [PubMed] [Google Scholar]
- Nicola W, Clopath C (2019) A diversity of interneurons and Hebbian plasticity facilitate rapid compressible learning in the hippocampus. Nat Neurosci 22:1168–1181. 10.1038/s41593-019-0415-2 [DOI] [PubMed] [Google Scholar]
- O'Keefe J, Nadel L (1978) The hippocampus as a cognitive map. Oxford: Clarendon Press. [Google Scholar]
- O'Keefe J, Recce ML (1993) Phase relationship between hippocampal place units and the EEG theta rhythm. Hippocampus 3:317–330. 10.1002/hipo.450030307 [DOI] [PubMed] [Google Scholar]
- Pastalkova E, Itskov V, Amarasingham A, Buzsáki G (2008) Internally generated cell assembly sequences in the rat hippocampus. Science 321:1322–1327. 10.1126/science.1159775 [DOI] [PMC free article] [PubMed] [Google Scholar]
- Paxinos G, Watson C (2006) The rat brain in stereotaxic coordinates. San Diego: Elsevier. [DOI] [PubMed] [Google Scholar]
- Pedersen A, Siegmund A, Ohrmann P, Rist F, Rothermundt M, Suslow T, Arolt V (2008) Reduced implicit and explicit sequence learning in first-episode schizophrenia. Neuropsychologia 46:186–195. 10.1016/j.neuropsychologia.2007.07.021 [DOI] [PubMed] [Google Scholar]
- Porter BS, Schmidt R, Bilkey DK (2018) Hippocampal place cell encoding of sloping terrain. Hippocampus 28:767–782. 10.1002/hipo.22966 [DOI] [PMC free article] [PubMed] [Google Scholar]
- Qasim SE, Fried I, Jacobs J (2021) Phase precession in the human hippocampus and entorhinal cortex. Cell 184:3242–3255.e10. [DOI] [PMC free article] [PubMed] [Google Scholar]
- Richmond LL, Gold DA, Zacks JM (2017) Event perception: translations and applications. J Appl Res Mem Cogn 6:111–120. 10.1016/j.jarmac.2016.11.002 [DOI] [PMC free article] [PubMed] [Google Scholar]
- Royer S, Zemelman BV, Losonczy A, Kim J, Chance F, Magee JC, Buzsáki G (2012) Control of timing, rate and bursts of hippocampal place cells by dendritic and somatic inhibition. Nat Neurosci 15:769–775. 10.1038/nn.3077 [DOI] [PMC free article] [PubMed] [Google Scholar]
- Savanthrapadian S, Wolff AR, Logan BJ, Eckert MJ, Bilkey DK, Abraham WC (2013) Enhanced hippocampal neuronal excitability and LTP persistence associated with reduced behavioral flexibility in the maternal immune activation model of schizophrenia. Hippocampus 23:1395–1409. 10.1002/hipo.22193 [DOI] [PubMed] [Google Scholar]
- Schacter DL, Addis DR, Buckner RL (2007) Remembering the past to imagine the future: the prospective brain. Nat Rev Neurosci 8:657–661. 10.1038/nrn2213 [DOI] [PubMed] [Google Scholar]
- Schmidt R, Diba K, Leibold C, Schmitz D, Buzsáki G, Kempter R (2009) Single-trial phase precession in the hippocampus. J Neurosci 29:13232–13241. 10.1523/JNEUROSCI.2270-09.2009 [DOI] [PMC free article] [PubMed] [Google Scholar]
- Siegert RJ, Weatherall M, Bell EM (2008) Is implicit sequence learning impaired in schizophrenia? A meta-analysis. Brain Cogn 67:351–359. 10.1016/j.bandc.2008.02.005 [DOI] [PubMed] [Google Scholar]
- Skaggs WE, McNaughton BL, Gothard KM (1993) An information-theoretic approach to deciphering the hippocampal code. Presented at Advances in Neural Information Processing Systems 5 (NIPS 1992). San Mateo, CA: Morgan Kaufmann. [Google Scholar]
- Skaggs WE, McNaughton BL, Wilson MA, Barnes CA (1996) Theta phase precession in hippocampal neuronal populations and the compression of temporal sequences. Hippocampus 6:149–172. [DOI] [PubMed] [Google Scholar]
- Steullet P, Cabungcal JH, Coyle J, Didriksen M, Gill K, Grace AA, Hensch TK, LaMantia A-S, Lindemann L, Maynard TM, Meyer U, Morishita H, O'Donnell P, Puhl M, Cuenod M, Do KQ (2017) Oxidative stress-driven parvalbumin interneuron impairment as a common mechanism in models of schizophrenia. Mol Psychiatry 22:936–943. 10.1038/mp.2017.47 [DOI] [PMC free article] [PubMed] [Google Scholar]
- Terada S, Sakurai Y, Nakahara H, Fujisawa S (2017) Temporal and rate coding for discrete event sequences in the hippocampus. Neuron 94:1248–1262.e4. 10.1016/j.neuron.2017.05.024 [DOI] [PubMed] [Google Scholar]
- Thoenes S, Oberfeld D (2017) Meta-analysis of time perception and temporal processing in schizophrenia: differential effects on precision and accuracy. Clin Psychol Rev 54:44–64. 10.1016/j.cpr.2017.03.007 [DOI] [PubMed] [Google Scholar]
- Tingley D, Buzsáki G (2018) Transformation of a spatial map across the hippocampal-lateral septal circuit. Neuron 98:1229–1242.e5. 10.1016/j.neuron.2018.04.028 [DOI] [PMC free article] [PubMed] [Google Scholar]
- Tulving E, Markowitsch HJ (1998) Episodic and declarative memory: role of the hippocampus. Hippocampus 8:198–204. [DOI] [PubMed] [Google Scholar]
- Vanderwolf CH (1969) Hippocampal electrical activity and voluntary movement in the rat. Electroencephalogr Clin Neurophysiol 26:407–418. 10.1016/0013-4694(69)90092-3 [DOI] [PubMed] [Google Scholar]
- Wang Y, Romani S, Lustig B, Leonardo A, Pastalkova E (2015) Theta sequences are essential for internally generated hippocampal firing fields. Nat Neurosci 18:282–288. 10.1038/nn.3904 [DOI] [PubMed] [Google Scholar]
- Wikenheiser AM, Redish AD (2015) Hippocampal theta sequences reflect current goals. Nat Neurosci 18:289–294. 10.1038/nn.3909 [DOI] [PMC free article] [PubMed] [Google Scholar]
- Wolff AR, Bilkey DK (2010) The maternal immune activation (MIA) model of schizophrenia produces pre-pulse inhibition (PPI) deficits in both juvenile and adult rats but these effects are not associated with maternal weight loss. Behav Brain Res 213:323–327. 10.1016/j.bbr.2010.05.008 [DOI] [PubMed] [Google Scholar]
- Wolff AR, Bilkey DK (2015) Prenatal immune activation alters hippocampal place cell firing characteristics in adult animals. Brain Behav Immun 48:232–243. 10.1016/j.bbi.2015.03.012 [DOI] [PubMed] [Google Scholar]
- Wolff AR, Cheyne KR, Bilkey DK (2011) Behavioural deficits associated with maternal immune activation in the rat model of schizophrenia. Behav Brain Res 225:382–387. 10.1016/j.bbr.2011.07.033 [DOI] [PubMed] [Google Scholar]
- Zalla T, Verlut I, Franck N, Puzenat D, Sirigu A (2004) Perception of dynamic action in patients with schizophrenia. Psychiatry Res 128:39–51. 10.1016/j.psychres.2003.12.026 [DOI] [PubMed] [Google Scholar]
- Zuckerman L, Weiner I (2005) Maternal immune activation leads to behavioral and pharmacological changes in the adult offspring. J Psychiatr Res 39:311–323. 10.1016/j.jpsychires.2004.08.008 [DOI] [PubMed] [Google Scholar]