

Abstract
Numerous anthropological studies have been aimed at estimating jaw-adductor muscle forces, which, in turn, are used to estimate bite force. While primate jaw adductors show considerable intra- and intermuscular heterogeneity in fibre types, studies generally model jaw-muscle forces by treating the jaw adductors as either homogeneously slow or homogeneously fast muscles. Here, we provide a novel extension of such studies by integrating fibre architecture, fibre types and fibre-specific tensions to estimate maximum muscle forces in the masseter and temporalis of five anthropoid primates: Sapajus apella (N = 3), Cercocebus atys (N = 4), Macaca fascicularis (N = 3), Gorilla gorilla (N = 1) and Pan troglodytes (N = 2). We calculated maximum muscle forces by proportionally adjusting muscle physiological cross-sectional areas by their fibre types and associated specific tensions. Our results show that the jaw adductors of our sample ubiquitously express MHC α-cardiac, which has low specific tension, and hybrid fibres. We find that treating the jaw adductors as either homogeneously slow or fast muscles potentially overestimates average maximum muscle forces by as much as approximately 44%. Including fibre types and their specific tensions is thus likely to improve jaw-muscle and bite force estimates in primates.
Keywords: myosin heavy chain, maximum isometric tension, hybrid fibres, masseter, temporalis, muscle force
1. Introduction
Considerable effort in anthropology has been directed at modelling feeding mechanics in extant primates with the goal of gaining insights into feeding-system adaptations in extant and extinct taxa. Research linking feeding-system design and function has relied heavily on biomechanical models based fundamentally on engineering principles. For example, from decades of in vivo experimental studies of how the mandible is strained during chewing, incision and isometric biting (e.g. [1–3]), a large body of literature has emerged applying beam theory to hypothesize how the mandibular corpus should be expected to model, remodel and adapt to withstand various loads during feeding, and to infer feeding behaviour and diet from mandibular morphology [4–9]. Additionally, the primate masticatory complex is often treated as a lever system (e.g. [10–12]), which, in conjunction with estimates of jaw-muscle force, have been used to model and estimate bite force capabilities (e.g. [13–18]). More recently, finite-element analysis (FEA) has become widely employed in biological anthropology to characterize the stress and strain patterns of the craniofacial complex under a variety of loading conditions (e.g. [19–22]) and to test hypotheses of craniofacial function and feeding adaptations (e.g. [23–26]).
All of these approaches are based on mechanical engineering principles and involve the application of a variety of input parameters. For instance, in FEA models of stress and strain patterns associated with feeding, bone tissue and bone material properties must be assigned, as well as applied muscle force vectors and muscle forces [24,25,27–29]. Similarly, bite force calculations require the input of muscle forces, often estimated from the anatomical (ACSA) or physiological cross-sectional area (PCSA) (e.g. [15,30–34]; for a review of methods for estimating PCSA see [35]). The validity of these models is in part dependent on the accuracy of the input parameters.
A focus of many studies of craniofacial structure and function has been modelling bite forces. This is because bite force is an important performance variable related to feeding (e.g. [36,37]) as well as non-feeding behaviours such as aggressive biting [38]. Bite force capacity is one of a number of factors that influence an animal's feeding strategies (e.g. seed predation, frugivory, folivory) and dietary range (e.g. accessing items across a range of material and geometric properties), and plays a crucial role in an animal's ability to efficiently ingest and break down food [39–41].
Bite force is modulated by a number of factors, including leverage (i.e. moment arms of the chewing muscles and bite points) and the force-generating capacity of the chewing muscles. Two important properties that influence muscle force are a muscle's PCSA and the physiological properties of muscle fibre types (fibre phenotype). Over the past 25 years, there has been a sizeable increase in static architectural estimates of ACSAs and PCSAs of the chewing muscles of strepsirrhine [30,33,42–46] and anthropoid [30–32,34,47–53] primates. This work has facilitated combining architectural estimates of jaw-adductor muscle force with muscle leverage to estimate bite force in extant [15,33,54,55] and, though a more formidable task, extinct human and non-human primates (e.g. [16,46,54,56]).
To convert muscle force estimates to bite force requires estimating the maximum isometric muscle force of the jaw adductors, i.e. the masseter, temporalis and medial pterygoid muscles. This is achieved by multiplying muscle ACSAs or PCSAs by a specific tension, i.e. force/area [57]. To date, however, studies estimating muscle force in primates, and converting muscle force to bite force, have assigned a specific tension value to muscle force estimates derived using whole muscles, and even muscle groups (e.g. [58–60]). This is despite considerable intra- and intermuscular heterogeneity of muscle fibre types and their contractile properties, including specific tensions (see table 1 and references therein; see Close [77] for an early review).
Table 1.
Range of specific tension values reported in the literature. Both the muscles and muscle level sampled are reported.a
| mammal(s) | muscle(s) | muscle level sampled | specific tension reported (N cm−2) | author |
|---|---|---|---|---|
| cat | gastrocnemius, soleus | whole muscle | 22.5 | Spector et al. [59] |
| cat | gastrocnemius, soleus | single fibre | 10.3–43.8 | Lucas et al. [61] |
| cat | flexor digitorum longus | single motor unit | 5.9–34.3 | Dum et al. [62] |
| cat | tibialis anterior | single motor unit | 16.8–27.5 | Bodine et al. [63] |
| cat, dog | diaphragm, longissimus dorsi, masseter, semimembranosus, soleus, temporalis, tibialis anterior | single fibre | 10.2–38 | Toniolo et al.b [64] |
| chimpanzee | gastrocnemius, vastus lateralis | single fibre | 9.6–15 | O'Neill et al. [65] |
| cow | diaphragm, longissimus dorsi, masseter | single fibre | 5–11.3 | Toniolo et al. [66] |
| dog | longissimus dorsi, semimembranosus, extraocular, laryngeal, temporalis | single fibre | 10–13 | Toniolo et al.b [67] |
| human | vastus lateralis | single fibre | 6.2–22.2 | Gilliver et al. [68] |
| human | soleus, vastus lateralis | single fibre | 8–21 | Larsson & Moss [69] |
| human | latissimus dorsi | single fibre | 11.6–16.4 | Paoli et al. [70] |
| human | vastus lateralis | single fibre | 4.37–6.47 | Bottinelli et al. [71] |
| mouse | gastrocnemius, soleus, tibialis anterior, vastus lateralis | single fibre | 22.4–37.7 | Andruchov et al. [72] |
| mouse, rat, rabbit, sheep, cow | extensor digitorum longus, soleus | single fibre | 6–24.8 | Seow & Ford [73] |
| mouse, rabbit, rat, human | extensor digitorum longus, gastrocnemius | single fibre | 4–7.5 | Pellegrino et al. [74] |
| rabbit | extraocular | single fibre | 14–46 | Lynch et al.b [75] |
| rat | extensor digitorum longus, soleus, plantaris | single fibre | 21.1–43.9 | Bottinelli et al. [76] |
aThe ranges reported for each study reflect variation across muscles, fibre types within a muscle and/or experiments under different conditions.
bThese values were not reported directly in the text. They were determined to the nearest approximation from graphic data presented by the author.
Here, we present a novel extension of these studies by combining jaw-adductor muscle force estimates from PCSAs with muscle fibre types quantified from the same muscles. We assign specific tension values (Po) based on the percentage cross-sectional area (%CSA) of fibres expressing a particular fibre type by taking advantage of recent empirically derived Po values for the major myosin heavy chain (MHC) proteins that contribute to the fibre types found in mammalian jaw muscles. We compare our fibre-type adjusted muscle force estimates with those obtained assuming either homogeneously slow or homogeneously fast fibre phenotypes. We show that jaw-muscle force estimates based on the presumption of homogeneous fibre types assigned a single specific tension potentially overestimate average maximum muscle forces by as much as 44% and 36% for the masseter and temporalis muscles, respectively. These data add to the longstanding work of anthroengineering by providing a method for potentially fine-tuning jaw-muscle and bite force estimates in primates.
1.1. Estimating muscle force
Muscle function is largely dependent on two intrinsic properties of muscle: muscle fibre architecture [78] and the composition and distribution of fibre types within a muscle [76,79,80]. Muscle fibre architecture represents the internal organization of a muscle and the orientation of fibres relative to the muscle's force-generating capacity [78]. PCSA is proportional to a muscle's maximum force-generating capacity [57], while the expression and distribution of the various MHC isoforms within a muscle influence the contractile properties of muscle fibres, including speed of shortening, isometric tension and tension cost [81]. Combining a muscle's PCSA with its specific tension allows for an estimate of a muscle's maximum tetanic tension.
Numerous studies have combined architectural estimates of muscle force with specific tension values to estimate maximum tetanic tension for limb (e.g. [57,82,83]) and jaw musculature (e.g. [16,51]). A wide range of specific tension values, from as low as 4 N cm−2 [74] to as high as 46 N cm−2 [75] (table 1), have been reported for skeletal muscles and attributed to fibre type. Studies have generally assigned a single specific tension value to whole muscles, or to muscle groups. However, there is ample evidence from single-fibre studies that tension values are lower in slow (type 1) as compared with fast (type 2) fibres, in many cases significantly so (e.g. [62–67,70,71,74–76]).
Fibre-specific tensions have the potential to significantly influence muscle and, by extension, bite force estimates. One reason is that mammalian chewing muscles express a greater variety of MHC isoforms than limb muscles [84]; these isoforms add considerably to the range of contractile properties expressed in the chewing muscles. Another reason is that mammalian chewing muscles show a large degree of heterogeneity in fibre-type distribution, both within and between muscles (e.g. [85,86]). Lastly, mammalian chewing muscles express large quantities of hybrid fibres, i.e. fibres that express more than one MHC isoform along their length (see reviews by [87,88]). Notably, anthropoid primate chewing muscles display an abundance of hybrid fibres [89,90]. Fibres expressing multiple MHC isoforms are reported to have contractile properties intermediate between ‘nearest neighbour’ pure MHC isoforms [91] (figure 1). For the chewing muscles, in particular, these factors collectively suggest that applying a single specific tension value to whole muscles is likely to over- or underestimate maximum muscle tension and, thus, bite forces.
Figure 1.
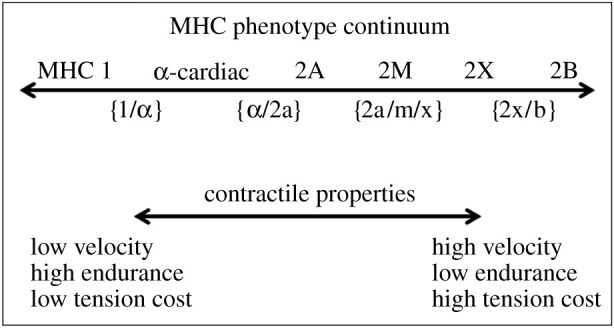
Fibre phenotype continuum illustrating the six main myosin heavy chain isoforms observed in mammalian jaw muscles, each operating at different capacities along the continuum. Hybrid fibres are denoted with brackets below the arrow but may occur in any combination. Maximum unloaded shortening velocity and tension cost increases from left to right while fatigue resistance decreases left to right.
1.2. Jaw-muscle fibre phenotypes
A muscle's fibre phenotype is the quantitative expression of MHC isoforms within that muscle. The contractile properties of these isoforms can be expressed along a continuum, from slower contracting, fatigue resistant (type 1: MHC-1, MHC α-cardiac) to fast contracting, fatigable (type 2: MHC-2A, MHC-M, MHC-2X; figure 1). MHC-1 and MHC-2 (MHC-2A and MHC-2X) isoforms, common to the limb muscles, are expressed in mammalian jaw-closing muscles, including those of primates [86,92–94]. Additional major MHC isoforms are expressed in the chewing muscles, but not the limb muscles. These include MHC α-cardiac [95] and MHC-M (fast-type 2 or masticatory myosin) [85]. MHC α-cardiac has been reported in a variety of mammals (e.g. [96,97]), including human [87,98] and more recently non-human [90,99] primates. This fibre type has a higher contraction velocity than MHC-1 but it is similar to MHC-1 in having high endurance and a low energy cost of activation [100,101]. Animals that execute tens of thousands of chews a day at low force amplitudes, such as marsupial grazers [96], have chewing muscles that homogeneously express MHC α-cardiac. This fibre phenotype is believed to confer a benefit to animals that chew with exceptionally high frequency but do not ruminate, because the higher rate of cross-bridge cycling compared with MHC-1 fibres [101] facilitates the rapid and efficient breakdown of food into fine particles for fermentation. MHC-M is a phylogenetically ancient myosin specific to the masticatory muscles [102] and has been functionally linked to rapid, powerful muscle and bite forces for prey capture [85].
Most single-fibre studies that have measured isometric tension in mammalian skeletal muscles have reported on MHC-1 and MHC-2 fibres in limb muscles (e.g. [64–67,103]). By contrast, isometric tension measured from single fibres that express MHC α-cardiac and MHC-M are far more limited, having been reported for the jaw muscles of cow [65] and dog and cat [64,67]. MHC α-cardiac tension in cow masseter has been reported at approximately 5 N cm−2 [66], lower than specific tension estimates for MHC-1 fibres. Fibres expressing MHC-M developed significantly higher isometric tension (38 N cm−2) when compared with MHC-1, MHC α-cardiac and MHC-2 fibres [64]. Isometric tension reported for hybrid fibres indicates that their contractile forces are intermediate relative to the combination of pure myosin isoforms expressed within that fibre [66,71]. Their intermediate tension is consistent with their other physiological characteristics, such as their contractile velocity and fatigue resistance [65,80,91,104–106].
2. Material and methods
2.1. Sample
We estimated PCSAs and determined the four major MHC isoforms present in the superficial masseter and temporalis muscles of five anthropoid primates: Sapajus apella (N = 3), Cercocebus atys (N = 4), Macaca fascicularis (N = 3), Gorilla gorilla (N = 1) and Pan troglodytes (N = 2). All tissues were from captive individuals with no evidence of craniodental or temporomandibular joint pathology or muscle atrophy. All had been fresh frozen for varying amounts of time, then thawed and fixed in 10% buffered formalin and stored in 10% buffered formalin until use. Specimens were obtained from regional primate centres or zoological institutions and no animals were sacrificed for the purposes of this study (see electronic supplementary material).
2.2. Measurements
2.2.1. Physiological cross-sectional area
The fibre architecture methods used in this study have been described in detail elsewhere (e.g. [30,50,51,53,55,107]). Briefly, the masseter and temporalis muscles were dissected en masse from the cranium. The deep and superficial portions of the masseter were separated and the superficial masseter and temporalis weighed to the nearest 0.01 or 0.1 g, depending on muscle size. The superficial masseter muscles were sectioned from superficial to deep along their lengths into multiple segments while the temporalis muscles were sectioned into anterior, middle and posterior segments (figure 2), using stress lines visible on the epimysium as guides (e.g. [108]). For each muscle segment, fibre length (Lf) from adjacent fibres was measured from multiple sampling sites from the superficial and intermediate compartments of the masseter (but excluding the deep masseter) and from the superficial and deep temporalis. Only intact fibres running from tendon attachment to tendon attachment were included (i.e. no cut fibres were measured). Pinnation angle (θ) was estimated for each fibre following Anapol & Barry [107]. We included only specimens whose jaws were fixed in comparable postures (i.e. at occlusion). Thus, for the purposes of this study (following Taylor & Vinyard [50]), we did not normalize fibre length by a standard sarcomere length.1
Figure 2.

Photograph of a female M. fascicularis head depicting the temporalis and masseter muscles exposed in situ. Black lines depict the sectioning of the temporalis into anterior (A), middle (M) and posterior (P) regions. Red lines depict sections of the masseter along the length of the muscle into muscle segments. Modified from Terhune et al. [53].
Using our estimates of muscle mass, Lf and pinnation angle, we calculated PCSA using the following equation [110]:
where 1.0564 g cm−3 is an estimate of the specific density of skeletal muscle [111].
2.2.2. Immunohistochemistry
We excised small blocks of muscle tissue from the anterior superficial masseter (ASM), superficial anterior temporalis (SAT) and deep anterior temporalis (DAT). The muscle blocks (approx. 8–10 mm long × approx. 8–10 mm wide × approx. 4 mm deep) were cut perpendicular to the muscle's long axis and immersed in 70% ethanol solution for 48–72 h before paraffin embedding to aid in the reconstitution of the fibres. Immunohistochemistry (IHC) sample preparation and staining were subsequently carried out in the Immunohistology Laboratory, Department of Pathology, Duke University School of Medicine, Durham, NC, USA. Tissue preservation and formalin fixation can reduce the availability of reactive sites, potentially resulting in variable and diminished staining intensity [112,113]. We thus used an IHC protocol specifically developed and tested by the Department of Pathology to improve the staining of formalin-fixed tissue [55,99,114].
Briefly, each paraffin-embedded muscle block was sectioned at 5 µm using a cryostat. Serial sections were mounted on glass microscope slides to undergo final IHC procedures. Each section was pre-treated with 1% bovine serum albumin (BSA; Sigma) and then dissolved in Tris-buffered saline, 0.1% with Tween 20 (TBST) for 20 min. Four serial sections per muscle region were stained against MHC-1 (reacting with skeletal-slow myosin; 1 : 400 dilution; NOQ7.5.4D; Sigma), MHC α-cardiac (reacting with α-cardiac-slow myosin; 1 : 400 dilution; MYH6; Sigma), MHC-2 (reacting with skeletal-fast myosin; 1 : 400 dilution; MY-32, no. 4276; Sigma; we did not differentiate among the various MHC-2 isoforms) and MHC-M (reacting with masticatory myosin; 1 : 200 dilution; 2F4; Developmental Studies Hybridoma Bank, University of Iowa) antibodies.
Photographs were taken of the resulting stained histological sections using a Nikon DS-Fi3 high-definition camera attached to a Nikon 50i microscope and NIS Elements software v. 4.5 (Nikon Instruments Inc., Melville, NY). Photographs were saved as digital images at 4× magnification and stitched together in Microsoft PowerPoint to create a complete image of each stained muscle section. Regions of interest (ROIs) were selected for counting and scoring staining intensities and for measuring cross-sectional areas (CSAs) of selected cells, ensuring that the ROIs were representative of the range of variation in staining across the muscle section.
Each ROI was photographed at 10× and imported into ImageJ v. 1.52 [115]. Using the ‘Multi-point’ tool in ImageJ, a minimum of 300 fibres was counted per muscle region for each specimen and scored for staining intensity as strong, intermediate, weak or unstained [86,90,99]. Serial sections for the same muscle region enabled us to determine if a cell stained against only one of the four antibodies (pure fibre) or two or more antibodies (hybrid fibre). Based on the antibodies used in this study, three different hybrid types were possible: (i) slow hybrids, expressing more than one slow myosin (MHC-1 and MHC α-cardiac) [116,117]; (ii) fast hybrids, expressing more than one fast myosin (MHC-2 and MHC-M) [118]; and (iii) intermediate hybrids, expressing combinations of both slow and fast myosins.
CSAs (µm2) of a subset of approximately 50 cells [114] per muscle region were measured using the ‘Polygon’ and ‘Freehand selection’ tools in ImageJ. Selected cells were representative of the staining patterns for each of the four antibodies for each muscle region. We used these cell CSAs to calculate the %CSA representing each fibre type expressed in our sampled muscle section.
2.2.3. Muscle force estimation
To estimate maximum muscle force (MF %CSA), we used a modified version of the conventional formula where a muscle PCSA is multiplied by a muscle-specific tension [57]. Here, we multiplied the %CSA of each fibre type within a muscle by the muscle's PCSA (cm2), yielding a fibre-type specific estimate of PCSA (cm2). For example, the superficial masseter PCSA of C. atys ABT8 was estimated as 6.73 cm2 (electronic supplementary material, table S1). Of that 6.73 cm2, 57% %CSA was represented by the MHC-1 + MHC α-cardiac + MHC-2 hybrid fibre type (slow + 2), 20% %CSA was represented by MHC α-cardiac + MHC-2 + MHC-M hybrid fibre type (fast + α-cardiac) and 23% %CSA was represented by the MHC-1 + MHC α-cardiac hybrid fibre type (pure–slow hybrid). Each of these fibre-type specific CSAs was then multiplied by empirically derived specific tension estimates for each fibre type (as reported in table 2) and these were summed across the muscle to estimate MF %CSA (see electronic supplementary material, S1 methods and table S1). Based on the intermediate contractile properties of hybrid fibres, we averaged the known isometric tensions of all myosin isoforms expressed within a hybrid fibre to determine specific tension for that hybrid fibre type [99]:
Table 2.
Isometric tension values (Po) used in this study.
| MHC-1 | MHC α-cardiac | MHC-2 | MHC-M | |
|---|---|---|---|---|
| isometric tension (N cm−2)a | 22.5 | 5 | 26.3 | 38 |
aAll isometric tension values reported here are from single-fibre studies. Po for MHC-1 (N = 8 fibres) and MCH-2 are from carnivore trunk and limb muscle [64]. The current study did not differentiate among the MHC-2 isoforms; thus, we used an average Po of MHC-2A and MHC-2X (N = 32 fibres). MHC α-cardiac values are from cow (Bos taurus) masseter (N = 25 fibres) [66]. Po for MHC-M (N = 23 fibres) is from carnivore masseter and temporalis muscles [64].
Studies that employ estimates of the contractile properties of muscle (e.g. Po, Vo) generally report and use the mean values (for example, see O'Neill et al. [65], and electronic supplementary material therein). We follow this approach here. While variation in tension estimates (table 1) could impact the reported means that we used in our muscle force estimates, we believe this is no different from employing mean values of fibre length and pinnation angle that are used to estimate muscle PCSAs.
To determine the impact of proportionally adjusting muscle force estimates by their fibre types and associated specific tensions, we compared our MF %CSAs with muscle forces estimated using specific tension values for a homogeneously slow (PCSA × 22.5 N cm−2) and homogeneously fast muscle (PCSA × 26.3 N cm−2). We used the specific tension value for MHC-2 (table 2) to be consistent with most studies that have applied specific tension estimates from limb muscles. Employing these two specific tension estimates thus allows us to bracket the range of muscle force estimates typically used to estimate jaw-muscle (and bite) forces.
3. Results
Hybrid fibres were ubiquitous throughout the sampled species. Very few fibres expressed pure–slow or pure–fast phenotypes (figure 3), the single exception being the SAT in one S. apella (S. apella 31) that expressed 24% %CSA pure α-cardiac. The two most common hybrid combinations observed were: MHC-1 + MHC α-cardiac + MHC-2 and MHC α-cardiac + MHC-2 + MHC-M (table 3). Following Taylor & Holmes [99], we refer to these hybrid fibre phenotypes as the slow + 2 and fast + α-cardiac, respectively. The distinction between the slow + 2 and fast + α-cardiac hybrids is based on the nearly invariant counterstaining between MHC-1 and MHC-M. Other fibre types observed included MHC α-cardiac + MHC-2, pure–slow hybrid (MHC-1 + MHC α-cardiac), pure–fast hybrid (MHC-2 + MHC-M), MHC α-cardiac + MHC-M and pure MHC-2; a small percentage of fibres (less than or equal to 5%) co-stained for all four antibodies (table 3). Representative figures of the MHC expression patterns for each species are shown in figure 4.
Figure 3.

20× images of the same muscle fascicle in the anterior superficial masseter of M. fascicularis. (a) NOQ7.5.4D (MHC-1); (b) MYH6 (MHC α-cardiac); (c) MY32 (MHC-2); (d) (MHC-M). Note the abundance of hybrid fibres. Arrows point to the same cell co-staining with intermediate or dark intensity for MHC-1, MHC α-cardiac and MHC-2 (the slow + 2 hybrid). Asterisks indicate the same cell co-staining with light or intermediate intensity for MHC α-cardiac, MHC-2 and MHC-M (the fast + α-cardiac hybrid). Note the counter-staining between (a) cells that express MHC-1 and (d) those that express MHC-M.
Table 3.
%CSA of each fibre type observed in each specimen. slow + 2 and fast + α-cardiac were the most common hybrid fibre types observed. slow + 2 = MHC-1 + MHC α-cardiac + MHC-2; fast + α-cardiac = MHC α-cardiac + MHC-2 + MHC-M; slow-hybrid = MHC-1 + MHC α-cardiac; fast-hybrid = MHC-2 + MHC-M; all = MHC-1 + MHC α-cardiac + MHC-2 + MHC-M.
| species | slow + 2 (%) | fast + α-cardiac (%) | MHC α-cardiac + MHC-2 (%) | pure–slow hybrid (%) | pure–fast hybrid (%) | MHC α-cardiac + MHC-M (%) | pure MHC α-cardiac (%) | pure MHC-2 (%) | all (%) |
|---|---|---|---|---|---|---|---|---|---|
| superficial masseter | |||||||||
| S. apella 30 | 23 | 77 | — | — | — | — | — | — | — |
| S. apella 31 | 23 | 62 | 16 | — | — | — | — | — | — |
| S. apella 32 | 16 | 84 | — | — | — | — | — | — | — |
| C. atys (ABT4) | 98 | 1 | — | — | — | — | — | 1 | — |
| C. atys (ABT5) | 92 | — | — | — | — | — | — | 8 | — |
| C. atys (ABT6) | 32 | 67 | — | — | — | — | — | — | — |
| C. atys (ABT8) | 57 | 20 | — | 23 | — | — | — | — | — |
| M. fascicularis (ABTWLH3) | 63 | 3 | 34 | — | — | — | — | — | — |
| M. fascicularis (CJV222) | 39 | 61 | — | — | — | — | — | — | — |
| M. fascicularis (CJV221) | 16 | 84 | — | — | — | — | — | — | — |
| G. gorilla (NCZ488) | 94 | 6 | — | — | — | — | — | — | — |
| P. troglodytes (CJV190) | 19 | 76 | — | — | — | — | — | — | 5 |
| P. troglodytes (CJV189) | 23 | 75 | 2 | — | — | — | — | — | — |
| anterior temporalis | |||||||||
| S. apella 30 | 18 | 82 | — | — | — | — | — | — | — |
| S. apella 31 | 27 | — | — | 5 | — | 44 | 24 | — | — |
| S. apella 32 | 31 | 66 | 1 | 1 | — | — | — | — | — |
| C. atys (ABT 4) | 56 | — | — | — | 44 | — | — | — | — |
| C. atys (ABT 5) | 87 | — | — | — | 13 | — | — | — | — |
| C. atys (ABT 6) | 61 | 39 | — | — | — | — | — | — | — |
| C. atys (ABT 8) | 56 | 44 | — | — | — | — | — | — | — |
| M. fascicularis (ABTWLH3) | 47 | — | — | 53 | — | — | — | — | — |
| M. fascicularis (CJV222) | 32 | 68 | — | — | — | — | — | — | 1 |
| M. fascicularis (CJV221) | 51 | 45 | — | — | — | — | — | — | 3 |
| G. gorilla (NCZ 488) | 73 | 27 | — | — | — | — | — | — | — |
| P. troglodytes (CJV190) | 16 | 81 | — | — | — | — | 3 | — | — |
| P. troglodytes (CJV189) | 20 | 60 | 20 | — | — | — | — | — | — |
Figure 4.

Representative serial sections for left column: (a) S. apella SAT; (b) C. atys ASM; (c) M. fascicularis DAT; right column: (d) G. gorilla ASM; (e) G. gorilla SAT; and (f) P. troglodytes ASM, stained for NOQ7.5.4D (MHC-1; upper left square), MYH6 (MHC α-cardiac; upper right square), MY-32 (MHC-2; lower left square) and 2F4 (MHC-M; lower right square). Note the ubiquitous expression of fibres co-expressing two or more MHC isoforms, the abundance of α-cardiac fibres and the consistent counterstaining between NOQ7.5.4 and 2F4. For G. gorilla, note the intermuscular differences in distribution and staining intensities between the ASM (d) and SAT (e; see also Taylor & Holmes [99]). All figures were taken at 10×. Scale bar, 50 µm.
Table 4 compares our estimated maximum muscle forces (MF %CSA) with muscle forces estimated assuming a homogeneously slow (MF slow = 100% MHC-1) and a homogeneously fast (MF fast = 100% MHC-2) fibre type. The percentage difference between our estimates and homogeneously slow or fast muscles ranged from 4.4% to 44.1% for the masseter and from 7.3% to 36.1% for the temporalis. Whether treated as a homogeneously slow or homogeneously fast muscle, maximum muscle forces were always greater than those estimated for our MF %CSA (the difference between MF slow and MF %CSA was negligible for S. apella).
Table 4.
Average maximum muscle force estimates (N cm−2) for the superficial masseter and temporalis muscles assuming a homogeneously slow fibre expression (MF slow), incorporating %CSA of all fibre types expressed (MF %CSA), and assuming a homogeneously fast fibre expression (MF fast).a–c.
| species | superficial masseter |
temporalis |
||||||||
|---|---|---|---|---|---|---|---|---|---|---|
| MF slow | MF %CSA | MF fast | %Dif MF %CSA versus MF slow | %Dif MF %CSA versus MF fast | MF slow | MF %CSA | MF fast | %Dif MF %CSA versus MF slow | %Dif MF %CSA versus MF fast | |
| S. apella | 220.9 | 211.5 | 258.2 | 4.4 | 22.1 | 391.6 | 356.2 | 457.8 | 9.9 | 28.5 |
| s.d. | (39.7) | (30.8) | (46.4) | (146.0) | (166.9) | (170.6) | ||||
| C. atys | 149.0 | 126.9 | 174.2 | 17.4 | 37.3 | 359.9 | 335.5 | 420.7 | 7.3 | 25.4 |
| s.d. | (31.6) | (36.9) | (36.9) | (106.7) | (95.3) | (124.7) | ||||
| M. fascicularis | 90.98 | 83.12 | 106.34 | 9.5 | 27.9 | 271.9 | 238.0 | 317.8 | 14.2 | 33.5 |
| s.d. | (28.6) | (34.4) | (33.4) | (64.0) | (87.4) | (74.8) | ||||
| G. gorilla | 777.7 | 630.7 | 909.1 | 23.3 | 44.1 | 1272.4 | 1092.8 | 1487.3 | 16.4 | 36.1 |
| s.d. | — | — | — | — | — | — | ||||
| P. troglodytes | 813.3 | 792.2 | 950.6 | 2.7 | 20.0 | 1132.8 | 1065.6 | 1324.1 | 6.3 | 24.3 |
| s.d. | — | — | — | — | — | — | ||||
aMF slow: muscle force estimates based on 100% MHC-1 with Po = 22.5 N cm−2; MF fast: muscle force estimates based on 100% MHC-2 with Po = 26.3 N cm−2; %Dif: % difference; s.d., standard deviation.
bValues are averaged by muscle for each species.
c% difference calculated by subtracting MF slow or MF fast from MF %CSA, taking the absolute value (ABS) of that difference, dividing by MF %CSA and multiplying by 100, e.g. ABS [(MF %CSA − MF slow)/(MF %CSA)] * 100.
4. Discussion and conclusion
Anthropological studies that have estimated maximum muscle and bite forces in extant human and non-human primates have generally applied either a slow-type (e.g. 22.5 N cm−2) [51] or fast-type (e.g. [16,119,120]) specific tension value uniformly across the chewing muscles; faster tension values have also been applied to studies that have modelled bite forces in extinct primates and non-primate mammals (e.g. [21,54,121]). Importantly, tension values applied to the jaw adductors derive exclusively from work on non-primate mammalian limb muscles (e.g. [57,59,83]).
We show that average maximum jaw-muscle force estimates that account for fibre-type proportions and their fibre-specific tensions (MF %CSA) are smaller by as much as 30% than those assigned a single specific tension across the entire muscle (table 4). As might be expected, these differences in jaw-muscle force estimates translate into differences in bite force (see electronic supplementary material). At first glance, it may seem counterintuitive that our fibre-type specific tension estimates of muscle force are lower than those obtained when assigning specific tensions that are either homogeneously slow or fast. This pattern is explained by the fact that MHC α-cardiac is abundantly expressed across both the superficial masseter and temporalis in all our sample species, consistent with previous studies of non-primate mammals (e.g. [122]), as well as human [98] and non-human primates [90,99]. The reported Po of approximately 5 N cm−2 for MHC α-cardiac [66] is lower than the Po reported for MHC-1 (e.g. [64–67] and references therein). Incorporating the high proportion of fibres expressing MHC α-cardiac in our samples, with its lower Po, thus lowers the maximum muscle force estimates compared with those obtained when using even a slow-type specific tension.
We used mean Po values estimated from single fibres in our muscle force estimates, following previous muscle performance studies (e.g. [65]). As with all estimates of muscle kinetic and contractile properties, as well as input parameters of muscle PCSA (e.g. [47]), the mean values used in this study exhibit a range (e.g. [64,66]). We were unable to bracket the range of specific tension for each of the four MHC isoforms used in the current study as these were not explicitly reported by Toniolo et al. [64,66]. These authors do report significant differences in mean Po between MHC-1 and MHC-M, and between MHC 2A and MHC-M [64]. The Po for MHC α-cardiac is roughly 25% of that of MHC-1 [64,66], suggesting this value likely differs significantly from MHC-1, MHC-2A, MHC-2X and MHC-M. We are thus reasonably confident that the variation around the mean Po values within each MHC isoform is substantially lower than the variation between MHC isoforms. When Po is estimated from single fibres from the same muscle using the same experimental protocol, as is the case in the work reported by Toniolo et al. [64,67], the mean can be expected to represent the best estimate. Future work to explore variation in contractile properties and how it effects muscle force estimates could be better addressed by resampling techniques where the ranges of specific tension could be explicitly incorporated in the model.
Fibre-type adjusted jaw-muscle PCSAs (like PCSAs unadjusted for fibre type) represent static estimates of the relative force contribution of each chewing muscle to total jaw-adductor muscle force. Our focus in this study is to further refine static muscle force estimates by incorporating an additional and important parameter—the Po of the various fibre types that make up a given muscle and their proportions—and to evaluate the impact of accounting for various fibre types on these muscle force estimates. These parameters do not account for the fact that the jaw adductors fire both synchronously and asynchronously during chewing [123,124]. However, when combined with estimates of jaw-muscle mechanical advantage, they can be used to estimate maximum isometric bite force anywhere along the tooth row using static models (e.g. [10–12]) and have been fruitfully applied to biomechanical and evolutionary questions of feeding behaviour and diet in a wide range of extant primates (e.g. [16,17,33]) and non-primate mammals (e.g. [36]) and in palaeobiological contexts (e.g. [125]).
Similar to other studies of mammalian jaw-muscle fibre types (e.g. [86,88,90,98,99]), hybrid fibres were ubiquitous in our primate sample and fibres that expressed MHC α-cardiac generally co-expressed MHC-1 (e.g. [122]) as well as MHC-2 (figure 3; see also [90,99]). As such, hybrid fibres were proportionally averaged across all the MHC isoforms expressed. It is also important to point out that, to date, mammalian single-fibre specific tension values reported for MHC-1 and MHC-2 are known only from limb and trunk muscles; to our knowledge, these have not been reported from the chewing muscles of any mammal. We employed a Po for MHC-1 of 22.5 N cm−2 [64], which is higher than those reported for humans (e.g. [65] and references therein) and at least some other mammals (e.g. [64,66,67,74]). Had we employed a specific tension for MHC-1 closer to those reported for humans (many report Po approx. 10–18 N cm−2; [65] and references therein), our MF %CSAs would have been lower still.
The variation reported across specific tension estimates is likely to be due to a number of factors. While there is no clear correlation between specific tension and body mass [65,73,74], some of these differences can be attributed to variation across muscles and species (table 1). Different methods used to measure maximum isometric muscle force (Po) are also likely to account for some of this variation. For example, experimental measurements of maximum isometric muscle force (Po) are temperature dependent [126] as well as dependent on tissue preparation, e.g. whether estimated from skinned single muscle fibres (e.g. [127]) versus from stimulated intact whole muscle (e.g. [59]). Measuring isometric tension from single fibres of primate chewing muscles has proven challenging (P. Reiser 2019, personal communication). Given this, valuable next steps would include measuring isometric tension of single fibres expressing MHC-1 and MHC-2 from a variety of mammalian chewing muscles to determine if their contractile properties are similar to those expressed in limb muscles. Likewise, estimating Po from mammalian chewing muscles that express MHC α-cardiac and hybrid combinations would further contribute to refining estimates of maximum muscle forces.
Our results for a select subset of anthropoid primates suggest that fibre types have the potential to strongly impact muscle (and bite) force estimates. Accounting for the intra- and intermuscular heterogeneity of primate jaw-muscle fibre phenotypes is thus likely to improve muscle and bite forces estimates in extant taxa. While fibre types cannot be directly estimated in palaeontological specimens, skeletal estimates of bite force have been modelled in extinct hominins by applying correction factors based in part on architectural estimates of jaw-muscle PCSAs derived from extant primates (e.g. Eng et al. [16]). Adjusting these PCSAs by fibre type in extant taxa may thus improve bite force estimates in palaeobiological contexts, particularly if the bite force estimates in extant taxa can be validated by in vivo bite force studies.
Acknowledgements
For access to primate tissues, we thank the Cleveland Museum of Natural History (L. Jellema), North Carolina Zoo (E. Lynch), Yerkes National Primate Research Center (K.L. Summerville), and W.L. Hylander, C.F. Ross and C.J. Vinyard. We thank C. Wall for her time and expertise, L. Taylor for assistance with the figures and E. Boyle, S. Brown, A. Darke, K. Lunn, D. Saechao, A. Santas and M. West for help with data collection. We gratefully acknowledge Z. Su for developing and refining the IHC protocol and performing the IHC work.
Endnote
Skeletal muscle fibre length is influenced by joint posture and normalizing fibre length by a standard sarcomere length has been empirically shown to eliminate this error [89,109]. Gape-dependent variation in fibre lengths of the chewing muscles is effectively eliminated when normalizing measured fibre lengths by a sarcomere length of 2.41 μm, such that normalized fibre lengths are not significantly different (p < 0.05) from fibre lengths measured at occlusion [109]. In the absence of gape-dependent variation in our sample, we thus report PCSAs based on non-normalized fibre lengths.
Data accessibility
Additional data are provided in the electronic supplementary material [128].
Authors' contributions
M.H. and A.B.T contributed equally to conceptualization, methodology, data collection and formal analysis, original draft preparation, writing and editing, and visualization.
Competing interests
We declare we have no competing interests.
Funding
This work was funded by grants from the National Science Foundation (grant nos. NSF BCS 1719743, 0962677, 0833394, 0635649, 0552285 and 0452160), a Duke Arts and Sciences Council Research Grant and the Duke University School of Medicine Core Voucher Program.
References
- 1.Hylander WL, Bays R. 1979. An in vivo strain-gauge analysis of the squamosal-dentary joint reaction force during mastication and incisal biting in Macaca mulatta and Macaca fascicularis. Arch. Oral Biol. 24, 689-697. ( 10.1016/0003-9969(79)90119-5) [DOI] [PubMed] [Google Scholar]
- 2.Hylander WL. 1979. The functional significance of primate mandibular form. J. Morphol. 160, 223-239. ( 10.1002/jmor.1051600208) [DOI] [PubMed] [Google Scholar]
- 3.Hylander WL. 1979. Mandibular function in Galago crassicaudatus and Macaca fascicularis: an in vivo approach to stress analysis of the mandible. J. Morphol. 159, 253-296. ( 10.1002/jmor.1051590208) [DOI] [PubMed] [Google Scholar]
- 4.Cole TM III. 1992. Postnatal heterochrony of the masticatory apparatus in Cebus apella and Cebus albifrons. J. Hum. Evol. 23, 253-282. ( 10.1016/S0047-2484(05)80003-X) [DOI] [Google Scholar]
- 5.Daegling DJ. 1989. Biomechanics of cross-sectional size and shape in the hominoid mandibular corpus. Am. J. Phys. Anthropol. 80, 91-106. ( 10.1002/ajpa.1330800111) [DOI] [PubMed] [Google Scholar]
- 6.Daegling DJ. 1992. Mandibular morphology and diet in the genus Cebus. Int. J. Primatol. 13, 545-570. ( 10.1007/BF02547832) [DOI] [Google Scholar]
- 7.Hylander WL. 1988. Implications of in vivo experiments for interpreting the functional significance of ‘robust’ australopithecine jaws. In Evolutionary history of the ‘robust’ australopithecines (ed. Grine F), pp. 55-83. New York, NY: Taylor and Francis. [Google Scholar]
- 8.Ravosa MJ. 2000. Size and scaling in the mandible of living and extinct apes. Folia Primatol. 71, 305-322. ( 10.1159/000021754) [DOI] [PubMed] [Google Scholar]
- 9.Vinyard CJ, Ravosa MJ. 1998. Ontogeny, function, and scaling of the mandibular symphysis in papionin primates. J. Morphol. 235, 157-175. () [DOI] [PubMed] [Google Scholar]
- 10.Greaves W. 1978. The jaw lever system in ungulates: a new model. J. Zool. 184, 271-285. ( 10.1111/j.1469-7998.1978.tb03282.x) [DOI] [Google Scholar]
- 11.Hylander WL. 1975. The human mandible: lever or link? Am. J. Phys. Anthropol. 43, 227-242. ( 10.1002/ajpa.1330430209) [DOI] [PubMed] [Google Scholar]
- 12.Spence MA, Demes B. 1993. Biomechanical analysis of masticatory system configuration in Neandertals and Inuits. Am. J. Phys. Anthropol. 91, 1-20. ( 10.1002/ajpa.1330910102) [DOI] [PubMed] [Google Scholar]
- 13.Dechow PC, Carlson DS. 1990. Occlusal force and craniofacial biomechanics during growth in rhesus monkeys. Am. J. Phys. Anthropol. 83, 219-237. ( 10.1002/ajpa.1330830211) [DOI] [PubMed] [Google Scholar]
- 14.Demes B, Creel N. 1988. Bite force, diet, and cranial morphology of fossil hominids. J. Hum. Evol. 17, 657-670. ( 10.1016/0047-2484(88)90023-1) [DOI] [Google Scholar]
- 15.Deutsch AR, Dickinson E, Leonard KC, Pastor F, Muchlinski MN, Hartstone-Rose A. 2020. Scaling of anatomically derived maximal bite force in primates. Anat. Rec. 303, 2026-2035. ( 10.1002/ar.24284) [DOI] [PubMed] [Google Scholar]
- 16.Eng CM, Lieberman DE, Zink KD, Peters MA. 2013. Bite force and occlusal stress production in hominin evolution. Am. J. Phys. Anthropol. 151, 544-557. ( 10.1002/ajpa.22296) [DOI] [PubMed] [Google Scholar]
- 17.Norconk MA, Wright BW, Conklin-Brittain NL, Vinyard CJ. 2009. Mechanical and nutritional properties of food as factors in platyrrhine dietary adaptations. In South American primates (eds Garber PA, Estrada A, Bicca-Marques JC, Heymann EW, Strie KB), pp. 279-319. Berlin, Germany: Springer. [Google Scholar]
- 18.Wright BW. 2005. Craniodental biomechanics and dietary toughness in the genus Cebus. J. Hum. Evol. 48, 473-492. ( 10.1016/j.jhevol.2005.01.006) [DOI] [PubMed] [Google Scholar]
- 19.Panagiotopoulou O, Iriarte-Diaz J, Wilshin S, Dechow PC, Taylor AB, Abraha HM, Aljunid SF, Ross CF. 2017. In vivo bone strain and finite element modeling of a rhesus macaque mandible during mastication. Zoology 124, 13-29. ( 10.1016/j.zool.2017.08.010) [DOI] [PMC free article] [PubMed] [Google Scholar]
- 20.Strait DS, Richmond BG, Spencer A, Ross CF, Dechow PC, Wood BA. 2007. Masticatory biomechanics and its relevance to early hominid phylogeny: an examination of palatal thickness using finite-element analysis. J. Hum. Evol. 52, 585-599. ( 10.1016/j.jhevol.2006.11.019) [DOI] [PubMed] [Google Scholar]
- 21.Strait DS, et al. 2009. The feeding biomechanics and dietary ecology of Australopithecus africanus. Proc. Natl Acad. Sci. USA 106, 2124-2129. ( 10.1073/pnas.0808730106) [DOI] [PMC free article] [PubMed] [Google Scholar]
- 22.Wroe S, Moreno K, Clausen P, McHenry C, Curnoe D. 2007. High-resolution three-dimensional computer simulation of hominid cranial mechanics. Anat. Rec. 290, 1248-1255. ( 10.1002/ar.20594) [DOI] [PubMed] [Google Scholar]
- 23.Gröning F, Liu J, Fagan MJ, O'Higgins P. 2011. Why do humans have chins? Testing the mechanical significance of modern human symphyseal morphology with finite element analysis. Am. J. Phys. Anthropol. 144, 593-606. ( 10.1002/ajpa.21447) [DOI] [PubMed] [Google Scholar]
- 24.Ledogar JA, Luk TH, Perry JM, Neaux D, Wroe S. 2018. Biting mechanics and niche separation in a specialized clade of primate seed predators. PLoS ONE 13, e0190689. ( 10.1371/journal.pone.0190689) [DOI] [PMC free article] [PubMed] [Google Scholar]
- 25.Panagiotopoulou O, Iriarte-Diaz J, Abraha HM, Taylor AB, Wilshin S, Dechow PC, Ross CF. 2020. Biomechanics of the mandible of Macaca mulatta during the power stroke of mastication: loading, deformation, and strain regimes and the impact of food type. J. Hum. Evol. 147, 102865. ( 10.1016/j.jhevol.2020.102865) [DOI] [PMC free article] [PubMed] [Google Scholar]
- 26.Ross CF, Berthaume MA, Dechow PC, Iriarte-Diaz J, Porro LB, Richmond BG, Spencer M, Strait D. 2011. In vivo bone strain and finite-element modeling of the craniofacial haft in catarrhine primates. J. Anat. 218, 112-141. ( 10.1111/j.1469-7580.2010.01322.x) [DOI] [PMC free article] [PubMed] [Google Scholar]
- 27.Gröning F, Fagan M, O'Higgins P. 2012. Modeling the human mandible under masticatory loads: which input variables are important? Anat. Rec. 295, 853-863. ( 10.1002/ar.22455) [DOI] [PubMed] [Google Scholar]
- 28.Ross CF, Patel BA, Slice DE, Strait DS, Dechow PC, Richmond BG, Spencer MA. 2005. Modeling masticatory muscle force in finite element analysis: sensitivity analysis using principal coordinates analysis. Anat. Rec. 283, 288-299. ( 10.1002/ar.a.20170) [DOI] [PubMed] [Google Scholar]
- 29.Strait DS, Wang Q, Dechow PC, Ross CF, Richmond BG, Spencer MA, Patel BA. 2005. Modeling elastic properties in finite-element analysis: how much precision is needed to produce an accurate model? Anat. Rec. 283, 275-287. ( 10.1002/ar.a.20172) [DOI] [PubMed] [Google Scholar]
- 30.Anapol F, Shahnoor N, Ross CF. 2008. Scaling of reduced physiologic cross-sectional area in primate muscles of mastication. In Primate craniofacial function and biology (eds Vinyard C, Matthew R, Wall C), pp. 201-216. Berlin, Germany: Springer. [Google Scholar]
- 31.Antón S. 1999. Macaque masseter muscle: internal architecture, fiber length and cross-sectional area. Int. J. Primatol. 20, 441-462. ( 10.1023/A:1020509006259) [DOI] [Google Scholar]
- 32.Antón SC. 2000. Macaque pterygoid muscles: internal architecture, fiber length, and cross-sectional area. Int. J. Primatol. 21, 131-156. ( 10.1023/A:1005431831444) [DOI] [Google Scholar]
- 33.Perry JM, Hartstone-Rose A, Wall CE. 2011. The jaw adductors of strepsirrhines in relation to body size, diet, and ingested food size. Anat. Rec. 294, 712-728. ( 10.1002/ar.21354) [DOI] [PubMed] [Google Scholar]
- 34.Taylor AB, Vinyard CJ. 2013. The relationships among jaw-muscle fiber architecture, jaw morphology, and feeding behavior in extant apes and modern humans. Am. J. Phys. Anthropol. 151, 120-134. ( 10.1002/ajpa.22260) [DOI] [PubMed] [Google Scholar]
- 35.Martin ML, Travouillon KJ, Fleming PA, Warburton NM. 2020. Review of the methods used for calculating physiological cross-sectional area (PCSA) for ecological questions. J. Morphol. 281, 778-789. ( 10.1002/jmor.21139) [DOI] [PubMed] [Google Scholar]
- 36.Herrel A, De Smet A, Aguirre LF, Aerts P. 2008. Morphological and mechanical determinants of bite force in bats: do muscles matter? J. Exp. Biol. 211, 86-91. ( 10.1242/jeb.012211) [DOI] [PubMed] [Google Scholar]
- 37.Mara KR, Motta PJ, Huber DR. 2010. Bite force and performance in the durophagous bonnethead shark, Sphyrna tiburo. J. Exp. Zool. 313, 95-105. ( 10.1002/jez.576) [DOI] [PubMed] [Google Scholar]
- 38.Williams SH, Peiffer E, Ford S. 2009. Gape and bite force in the rodents Onychomys leucogaster and Peromyscus maniculatus: does jaw-muscle anatomy predict performance? J. Morphol. 270, 1338-1347. ( 10.1002/jmor.10761) [DOI] [PubMed] [Google Scholar]
- 39.Erickson GM, Lappin AK, Vliet KA. 2003. The ontogeny of bite-force performance in American alligator (Alligator mississippiensis). J. Zool. 260, 317-327. ( 10.1017/S0952836903003819) [DOI] [Google Scholar]
- 40.Herrel A, Spithoven L, Van Damme R, De Vree F. 1999. Sexual dimorphism of head size in Gallotia galloti: testing the niche divergence hypothesis by functional analyses. Funct. Ecol. 13, 289-297. ( 10.1046/j.1365-2435.1999.00305.x) [DOI] [Google Scholar]
- 41.Verwaijen D, Van Damme R, Herrel A. 2002. Relationships between head size, bite force, prey handling efficiency and diet in two sympatric lacertid lizards. Funct. Ecol. 16, 842-850. ( 10.1046/j.1365-2435.2002.00696.x) [DOI] [Google Scholar]
- 42.Dickinson E, Kolli S, Schwenk A, Davis CE, Hartstone-Rose A. 2020. DiceCT analysis of the extreme gouging adaptations within the masticatory apparatus of the aye-aye (Daubentonia madagascariensis). Anat. Rec. 303, 282-294. ( 10.1002/ar.24303) [DOI] [PubMed] [Google Scholar]
- 43.Leonard KC, Boettcher ML, Dickinson E, Malhotra N, Aujard F, Herrel A, Hartstone-Rose A. 2020. The ontogeny of masticatory muscle architecture in Microcebus murinus. Anat. Rec. 303, 1364-1373. ( 10.1002/ar.24259) [DOI] [PubMed] [Google Scholar]
- 44.Perry JM, Macneill KE, Heckler AL, Rakotoarisoa G, Hartstone-Rose A. 2014. Anatomy and adaptations of the chewing muscles in Daubentonia (Lemuriformes). Anat. Rec. 297, 308-316. ( 10.1002/ar.22844) [DOI] [PubMed] [Google Scholar]
- 45.Perry JM, Wall CE. 2008. Scaling of the chewing muscles in prosimians. In Primate craniofacial function and biology (eds Vinyard CJ, Ravosa M, Wall C), pp. 217-240. Boston, MA: Springer. [Google Scholar]
- 46.Perry JMG. 2008. The anatomy of mastication in extant strepsirrhines and Eocene adapines. PhD dissertation, Duke University, Durham, NC, USA. [Google Scholar]
- 47.Dickinson E, Fitton LC, Kupczik K. 2018. Ontogenetic changes to muscle architectural properties within the jaw-adductor musculature of Macaca fascicularis. Am. J. Phys. Anthropol. 167, 291-310. ( 10.1002/ajpa.23628) [DOI] [PubMed] [Google Scholar]
- 48.Dickinson E, Stark H, Kupczik K. 2018. Non-destructive determination of muscle architectural variables through the use of dice CT. Anat. Rec. 301, 363-377. ( 10.1002/ar.23716) [DOI] [PubMed] [Google Scholar]
- 49.Taylor AB, Eng CM, Anapol FC, Vinyard CJ. 2009. The functional correlates of jaw-muscle fiber architecture in tree-gouging and nongouging callitrichid monkeys. Am. J. Phys. Anthropol. 139, 353-367. ( 10.1002/ajpa.20991) [DOI] [PubMed] [Google Scholar]
- 50.Taylor AB, Vinyard CJ. 2004. Comparative analysis of masseter fiber architecture in tree-gouging (Callithrix jacchus) and nongouging (Saguinus oedipus) callitrichids. J. Morphol. 261, 276-285. ( 10.1002/jmor.10249) [DOI] [PubMed] [Google Scholar]
- 51.Taylor AB, Vinyard CJ. 2009. Jaw-muscle fiber architecture in tufted capuchins favors generating relatively large muscle forces without compromising jaw gape. J. Hum. Evol. 57, 710-720. ( 10.1016/j.jhevol.2009.06.001) [DOI] [PMC free article] [PubMed] [Google Scholar]
- 52.Taylor AB, Yuan T, Ross CF, Vinyard CJ. 2015. Jaw-muscle force and excursion scale with negative allometry in platyrrhine primates. Am. J. Phys. Anthropol. 158, 242-256. ( 10.1002/ajpa.22782) [DOI] [PubMed] [Google Scholar]
- 53.Terhune CE, Hylander WL, Vinyard CJ, Taylor AB. 2015. Jaw-muscle architecture and mandibular morphology influence relative maximum jaw gapes in the sexually dimorphic Macaca fascicularis. J. Hum. Evol. 82, 145-158. ( 10.1016/j.jhevol.2015.02.006) [DOI] [PubMed] [Google Scholar]
- 54.O'Connor CF, Franciscus RG, Holton NE. 2005. Bite force production capability and efficiency in Neandertals and modern humans. Am. J. Phys. Anthropol. 127, 129-151. ( 10.1002/ajpa.20025) [DOI] [PubMed] [Google Scholar]
- 55.Taylor AB, Terhune CE, Toler M, Holmes M, Ross CF, Vinyard CJ. 2018. Jaw-muscle fiber architecture and leverage in the hard-object feeding sooty mangabey are not structured to facilitate relatively large bite forces compared to other papionins. Anat. Rec. 301, 325-342. ( 10.1002/ar.23718) [DOI] [PubMed] [Google Scholar]
- 56.Perry JM. 2018. Inferring the diets of extinct giant lemurs from osteological correlates of muscle dimensions. Anat. Rec. 301, 343-362. ( 10.1002/ar.23719) [DOI] [PubMed] [Google Scholar]
- 57.Powell PL, Roy RR, Kanim P, Bello MA, Edgerton VR. 1984. Predictability of skeletal muscle tension from architectural determinations in guinea pig hindlimbs. J. Appl. Physiol. 57, 1715-1721. ( 10.1152/jappl.1984.57.6.1715) [DOI] [PubMed] [Google Scholar]
- 58.Roy RR, Meadows ID, Baldwin KM, Edgerton VR. 1982. Functional significance of compensatory overloaded rat fast muscle. J. Appl. Physiol. 52, 473-478. ( 10.1152/jappl.1982.52.2.473) [DOI] [PubMed] [Google Scholar]
- 59.Spector SA, Gardiner PF, Zernicke RF, Roy RR, Edgerton VR. 1980. Muscle architecture and force-velocity characteristics of cat soleus and medial gastrocnemius: implications for motor control. J. Neurophysiol. 44, 951-960. ( 10.1152/jn.1980.44.5.951) [DOI] [PubMed] [Google Scholar]
- 60.Wickiewicz TL, Roy RR, Powell PL, Perrine JJ, Edgerton VR. 1984. Muscle architecture and force-velocity relationships in humans. J. Appl. Physiol. 57, 435-443. ( 10.1152/jappl.1984.57.2.435) [DOI] [PubMed] [Google Scholar]
- 61.Lucas S, Ruff R, Binder M. 1987. Specific tension measurements in single soleus and medial gastrocnemius muscle fibers of the cat. Exp. Neurol. 95, 142-154. ( 10.1016/0014-4886(87)90013-6) [DOI] [PubMed] [Google Scholar]
- 62.Dum R, Burke R, O'Donovan M, Toop J, Hodgson J. 1982. Motor-unit organization in flexor digitorum longus muscle of the cat. J. Neurophysiol. 47, 1108-1125. ( 10.1152/jn.1982.47.6.1108) [DOI] [PubMed] [Google Scholar]
- 63.Bodine S, Roy RR, Eldred E, Edgerton VR. 1987. Maximal force as a function of anatomical features of motor units in the cat tibialis anterior. J. Neurophysiol. 57, 1730-1745. ( 10.1152/jn.1987.57.6.1730) [DOI] [PubMed] [Google Scholar]
- 64.Toniolo L, Cancellara P, Maccatrozzo L, Patruno M, Mascarello F, Reggiani C. 2008. Masticatory myosin unveiled: first determination of contractile parameters of muscle fibers from carnivore jaw muscles. Am. J. Physiol. Cell Physiol. 295, C1535-C1542. ( 10.1152/ajpcell.00093.2008) [DOI] [PubMed] [Google Scholar]
- 65.O'Neill MC, Umberger BR, Holowka NB, Larson SG, Reiser PJ. 2017. Chimpanzee super strength and human skeletal muscle evolution. Proc. Natl Acad. Sci. USA 114, 7343-7348. ( 10.1073/pnas.1619071114) [DOI] [PMC free article] [PubMed] [Google Scholar]
- 66.Toniolo L, Maccatrozzo L, Patruno M, Caliaro F, Mascarello F, Reggiani C. 2005. Expression of eight distinct MHC isoforms in bovine striated muscles: evidence for MHC-2B presence only in extraocular muscles. J. Exp. Biol. 208, 4243-4253. ( 10.1242/jeb.01904) [DOI] [PubMed] [Google Scholar]
- 67.Toniolo L, et al. 2007. Fiber types in canine muscles: myosin isoform expression and functional characterization. Am. J. Physiol. Cell Physiol. 292, C1915-C1926. ( 10.1152/ajpcell.00601.2006) [DOI] [PubMed] [Google Scholar]
- 68.Gilliver S, Degens H, Rittweger J, Sargeant A, Jones D. 2009. Variation in the determinants of power of chemically skinned human muscle fibres. Exp. Physiol. 94, 1070-1078. ( 10.1113/expphysiol.2009.048314) [DOI] [PubMed] [Google Scholar]
- 69.Larsson L, Moss R. 1993. Maximum velocity of shortening in relation to myosin isoform composition in single fibres from human skeletal muscles. J. Physiol. 472, 595-614. ( 10.1113/jphysiol.1993.sp019964) [DOI] [PMC free article] [PubMed] [Google Scholar]
- 70.Paoli A, Pacelli QF, Cancellara P, Toniolo L, Moro T, Canato M, Miotti D, Reggiani C. 2013. Myosin isoforms and contractile properties of single fibers of human latissimus dorsi muscle. BioMed Res. Int. 205, 2203-2210. ( 10.1155/2013/249398) [DOI] [PMC free article] [PubMed] [Google Scholar]
- 71.Bottinelli R, Canepari M, Pellegrino M, Reggiani C. 1996. Force-velocity properties of human skeletal muscle fibres: myosin heavy chain isoform and temperature dependence. J. Physiol. 495, 573-586. ( 10.1113/jphysiol.1996.sp021617) [DOI] [PMC free article] [PubMed] [Google Scholar]
- 72.Andruchov O, Andruchova O, Wang Y, Galler S. 2004. Kinetic properties of myosin heavy chain isoforms in mouse skeletal muscle: comparison with rat, rabbit, and human and correlation with amino acid sequence. Am. J. Physiol. Cell Physiol. 287, C1725-C1732. ( 10.1152/ajpcell.00255.2004) [DOI] [PubMed] [Google Scholar]
- 73.Seow C, Ford L. 1991. Shortening velocity and power output of skinned muscle fibers from mammals having a 25,000-fold range of body mass. J. Gen. Physiol. 97, 541-560. ( 10.1085/jgp.97.3.541) [DOI] [PMC free article] [PubMed] [Google Scholar]
- 74.Pellegrino M, Canepari M, Rossi R, D'Antona G, Reggiani C, Bottinelli R. 2003. Orthologous myosin isoforms and scaling of shortening velocity with body size in mouse, rat, rabbit and human muscles. J. Physiol. 546, 677-689. ( 10.1113/jphysiol.2002.027375) [DOI] [PMC free article] [PubMed] [Google Scholar]
- 75.Lynch GS, Frueh BR, Williams DA. 1994. Contractile properties of single skinned fibres from the extraocular muscles, the levator and superior rectus, of the rabbit. J. Physiol. 475, 337-346. ( 10.1113/jphysiol.1994.sp020074) [DOI] [PMC free article] [PubMed] [Google Scholar]
- 76.Bottinelli R, Schiaffino S, Reggiani C. 1991. Force-velocity relations and myosin heavy chain isoform compositions of skinned fibres from rat skeletal muscle. J. Physiol. 437, 655-672. ( 10.1113/jphysiol.1991.sp018617) [DOI] [PMC free article] [PubMed] [Google Scholar]
- 77.Close R. 1972. Dynamic properties of mammalian skeletal muscles. Physiol. Rev. 52, 129-197. ( 10.1152/physrev.1972.52.1.129) [DOI] [PubMed] [Google Scholar]
- 78.Gans C, Gaunt AS. 1991. Muscle architecture in relation to function. J. Biomech. 24, 53-65. ( 10.1016/0021-9290(91)90377-Y) [DOI] [PubMed] [Google Scholar]
- 79.Bodine SC, Roy R, Meadows D, Zernicke R, Sacks R, Fournier M, Edgerton V. 1982. Architectural, histochemical, and contractile characteristics of a unique biarticular muscle: the cat semitendinosus. J. Neurophysiol. 48, 192-201. ( 10.1152/jn.1982.48.1.192) [DOI] [PubMed] [Google Scholar]
- 80.Reiser PJ, Moss R, Giulian GG, Greaser ML. 1985. Shortening velocity in single fibers from adult rabbit soleus muscles is correlated with myosin heavy chain composition. J. Biol. Chem. 260, 9077-9080. ( 10.1016/S0021-9258(17)39330-4) [DOI] [PubMed] [Google Scholar]
- 81.Schiaffino S, Reggiani C. 2011. Fiber types in mammalian skeletal muscles. Physiol. Rev. 91, 1447-1531. ( 10.1152/physrev.00031.2010) [DOI] [PubMed] [Google Scholar]
- 82.Anapol FC, Jungers WL. 1986. Architectural and histochemical diversity within the quadriceps femoris of the brown lemur (Lemur fulvus). Am. J. Phys. Anthropol. 69, 355-375. ( 10.1002/ajpa.1330690308) [DOI] [PubMed] [Google Scholar]
- 83.Sacks RD, Roy RR. 1982. Architecture of the hind limb muscles of cats: functional significance. J. Morphol. 173, 185-195. ( 10.1002/jmor.1051730206) [DOI] [PubMed] [Google Scholar]
- 84.Hoh JF. 2002. ‘Superfast’ or masticatory myosin and the evolution of jaw-closing muscles of vertebrates. J. Exp. Biol. 205, 2203-2210. ( 10.1242/jeb.205.15.2203) [DOI] [PubMed] [Google Scholar]
- 85.Rowlerson A, Mascarello F, Veggetti A, Carpenè E. 1983. The fibre-type composition of the first branchial arch muscles in Carnivora and Primates. J. Muscle Res. Cell Motil. 4, 443-472. ( 10.1007/BF00711949) [DOI] [PubMed] [Google Scholar]
- 86.Wall CE, Briggs MM, Huq E, Hylander WL, Schachat F. 2013. Regional variation in IIM myosin heavy chain expression in the temporalis muscle of female and male baboons (Papio anubis). Arch. Oral Biol. 58, 435-443. ( 10.1016/j.archoralbio.2012.09.008) [DOI] [PMC free article] [PubMed] [Google Scholar]
- 87.Korfage JA, Koolstra JH, Langenbach GE, Van Eijden TM. 2005. Fiber-type composition of the human jaw muscles—(part 2) role of hybrid fibers and factors responsible for inter-individual variation. J. Dent. Res. 84, 784-793. ( 10.1177/154405910508400902) [DOI] [PubMed] [Google Scholar]
- 88.Medler S. 2019. Mixing it up: the biological significance of hybrid skeletal muscle fibers. J. Exp. Biol. 222, 200832. ( 10.1242/jeb.200832) [DOI] [PubMed] [Google Scholar]
- 89.Taylor AB, Terhune CE, Vinyard CJ. 2019. The influence of masseter and temporalis sarcomere length operating ranges as determined by laser diffraction on architectural estimates of muscle force and excursion in macaques (Macaca fascicularis and Macaca mulatta). Arch. Oral Biol. 105, 35-45. ( 10.1016/j.archoralbio.2019.05.015) [DOI] [PMC free article] [PubMed] [Google Scholar]
- 90.Wall CE, Holmes M, Soderblom EJ, Taylor AB. 2018. Proteomics and immunohistochemistry identify the expression of α-cardiac myosin heavy chain in the jaw-closing muscles of sooty mangabeys (order Primates). Arch. Oral Biol. 91, 103-108. ( 10.1016/j.archoralbio.2018.01.019) [DOI] [PubMed] [Google Scholar]
- 91.Pette D. 2006. Skeletal muscle plasticity–history, facts and concepts. In Skeletal muscle plasticity in health and disease (eds Bottinelli R, Reggiani C), pp. 1-27. Berlin, Germany: Springer. [Google Scholar]
- 92.Andreo J, Oliveira J, Navarro J, Roque D, Roque J, Buchain R. 2002. Histoenzymology and morphometry of the masticatory muscles of tufted capuchin monkey (Cebus apella Linnaeus, 1758). Okajimas Folia Anat. Jpn. 79, 33-41. ( 10.2535/ofaj.79.33) [DOI] [PubMed] [Google Scholar]
- 93.Maxwell LC, Carlson DS, McNamara JA Jr, Faulkner JA. 1979. Histochemical characteristics of the masseter and temporalis muscles of the rhesus monkey (Macaca mulatta). Anat. Rec. 193, 389-401. ( 10.1002/ar.1091930306) [DOI] [PubMed] [Google Scholar]
- 94.Miller AJ, Farias M. 1988. Histochemical and electromyographic analysis of craniomandibular muscles in the rhesus monkey, Macaca mulatta. J. Oral Maxillofac. Surg. 46, 767-776. ( 10.1016/0278-2391(88)90187-5) [DOI] [PubMed] [Google Scholar]
- 95.Bredman J, Wessels A, Weijs W, Korfage J, Soffers C, Moorman A. 1991. Demonstration of ‘cardiac-specific’ myosin heavy chain in masticatory muscles of human and rabbit. Histochem. J. 23, 160-170. ( 10.1007/BF01046587) [DOI] [PubMed] [Google Scholar]
- 96.Hoh JF, Kim Y, Sieber LG, Zhong WW, Lucas CA. 2000. Jaw-closing muscles of kangaroos express α-cardiac myosin heavy chain. J. Muscle Res. Cell Motil. 21, 673-680. ( 10.1023/A:1005676106940) [DOI] [PubMed] [Google Scholar]
- 97.Sciote J, Rowlerson A, Hopper C, Hunt N. 1994. Fibre type classification and myosin isoforms in the human masseter muscle. J. Neurol. Sci. 126, 15-24. ( 10.1016/0022-510X(94)90089-2) [DOI] [PMC free article] [PubMed] [Google Scholar]
- 98.Korfage JA, Koolstra JH, Langenbach GE, Van Eijden TM. 2005. Fiber-type composition of the human jaw muscles—(part 1) origin and functional significance of fiber-type diversity. J. Dent. Res. 84, 774-783. ( 10.1177/154405910508400901) [DOI] [PubMed] [Google Scholar]
- 99.Taylor AB, Holmes MA. 2021. Fiber-type phenotype of the jaw-closing muscles in Gorilla gorilla, Pan troglodytes, and Pan paniscus: a test of the frequent recruitment hypothesis. J. Hum. Evol. 151, 102938. ( 10.1016/j.jhevol.2020.102938) [DOI] [PubMed] [Google Scholar]
- 100.Herron TJ, Korte FS, McDonald KS. 2001. Loaded shortening and power output in cardiac myocytes are dependent on myosin heavy chain isoform expression. Am. J. Physiol. Heart Circ. Physiol. 281, H1217-H1222. ( 10.1152/ajpheart.2001.281.3.H1217) [DOI] [PubMed] [Google Scholar]
- 101.Sciote JJ, Kentish JC. 1996. Unloaded shortening velocities of rabbit masseter muscle fibres expressing skeletal or alpha-cardiac myosin heavy chains. J. Physiol. 492, 659-667. ( 10.1113/jphysiol.1996.sp021335) [DOI] [PMC free article] [PubMed] [Google Scholar]
- 102.Qin H, Hsu MK, Morris BJ, Hoh JF. 2002. A distinct subclass of mammalian striated myosins: structure and molecular evolution of ‘superfast’ or masticatory myosin heavy chain. J. Mol. Evol. 55, 544-552. ( 10.1007/s00239-002-2349-6) [DOI] [PubMed] [Google Scholar]
- 103.Rome L, Sosnicki A, Goble D. 1990. Maximum velocity of shortening of three fibre types from horse soleus muscle: implications for scaling with body size. J. Physiol. 431, 173-185. ( 10.1113/jphysiol.1990.sp018325) [DOI] [PMC free article] [PubMed] [Google Scholar]
- 104.Andruchova O, Stephenson GM, Andruchov O, Stephenson DG, Galler S. 2006. Myosin heavy chain isoform composition and stretch activation kinetics in single fibres of Xenopus laevis iliofibularis muscle. J. Physiol. 574, 307-317. ( 10.1113/jphysiol.2006.109926) [DOI] [PMC free article] [PubMed] [Google Scholar]
- 105.Pette D, Staron RS. 2000. Myosin isoforms, muscle fiber types, and transitions. Microsc. Res. Tech. 50, 500-509. () [DOI] [PubMed] [Google Scholar]
- 106.Staron RS, Pette D. 1993. The continuum of pure and hybrid myosin heavy chain-based fibre types in rat skeletal muscle. Histochemistry 100, 149-153. ( 10.1007/BF00572901) [DOI] [PubMed] [Google Scholar]
- 107.Anapol F, Barry K. 1996. Fiber architecture of the extensors of the hindlimb in semiterrestrial and arboreal guenons. Am. J. Phys. Anthropol. 99, 429-447. () [DOI] [PubMed] [Google Scholar]
- 108.Anapol F, Gray JP. 2003. Fiber architecture of the intrinsic muscles of the shoulder and arm in semiterrestrial and arboreal guenons. Am. J. Phys. Anthropol. 122, 51-65. ( 10.1002/ajpa.10269) [DOI] [PubMed] [Google Scholar]
- 109.Felder A, Ward SR, Lieber RL. 2005. Sarcomere length measurement permits high resolution normalization of muscle fiber length in architectural studies. J. Exp. Biol. 208, 3275-3279. ( 10.1242/jeb.01763) [DOI] [PubMed] [Google Scholar]
- 110.Lieber RL. 2010. Skeletal muscle structure, function, and plasticity. Philadelphia, PA: Wolters-Kluwer. [Google Scholar]
- 111.Méndez J. 1960. Density and composition of mammalian muscle. Metabolism 9, 184-188. [Google Scholar]
- 112.Kojima R, Medina MF, Jouffroy FK, Okada M. 2002. Effects of fixation and preservation conditions on immunohistochemical profiles of the skeletal muscle fibers in Japanese macaques. Z. Morphol. Anthropol. 83, 315-324. ( 10.1127/zma/83/2002/315) [DOI] [PubMed] [Google Scholar]
- 113.Werner M, Chott A, Fabiano A, Battifora H. 2000. Effect of formalin tissue fixation and processing on immunohistochemistry. Am. J. Surg. Pathol. 24, 1016-1019. ( 10.1097/00000478-200007000-00014) [DOI] [PubMed] [Google Scholar]
- 114.Huq E, Taylor AB, Su Z, Wall CE. 2018. Fiber type composition of epaxial muscles is geared toward facilitating rapid spinal extension in the leaper Galago senegalensis. Am. J. Phys. Anthropol. 166, 95-106. ( 10.1002/ajpa.23405) [DOI] [PMC free article] [PubMed] [Google Scholar]
- 115.Schneider CA, Rasband WS, Eliceiri KW. 2012. NIH Image to ImageJ: 25 years of image analysis. Nat. Methods 9, 671-675. ( 10.1038/nmeth.2089) [DOI] [PMC free article] [PubMed] [Google Scholar]
- 116.Galler S, Puchert E, Gohlsch B, Schmid D, Pette D. 2002. Kinetic properties of cardiac myosin heavy chain isoforms in rat. Pflüg. Arch. 445, 218-223. ( 10.1007/s00424-002-0934-6) [DOI] [PubMed] [Google Scholar]
- 117.Kwa S, Weijs W, Juch P. 1995. Contraction characteristics and myosin heavy chain composition of rabbit masseter motor units. J. Neurophysiol. 73, 538-549. ( 10.1152/jn.1995.73.2.538) [DOI] [PubMed] [Google Scholar]
- 118.Van Wessel T, Langenbach G, Korfage J, Brugman P, Kawai N, Tanaka E, Van Eijden T. 2005. Fibre-type composition of rabbit jaw muscles is related to their daily activity. Eur. J. Neurosci. 22, 2783-2791. ( 10.1111/j.1460-9568.2005.04466.x) [DOI] [PubMed] [Google Scholar]
- 119.Perry JM, Hartstone-Rose A, Logan RL. 2011. The jaw adductor resultant and estimated bite force in primates. Anat. Res. Int. 112, 929848. ( 10.1155/2011/929848) [DOI] [PMC free article] [PubMed] [Google Scholar]
- 120.Weijs W, Hillen B. 1985. Cross-sectional areas and estimated intrinsic strength of the human jaw muscles. Acta Neerl. Morph. 23, 267-274. [PubMed] [Google Scholar]
- 121.Thomason J. 1991. Cranial strength in relation to estimated biting forces in some mammals. Can. J. Zool. 69, 2326-2333. ( 10.1139/z91-327) [DOI] [Google Scholar]
- 122.Hoh JF, Kang LH, Sieber LG, Lim JH, Zhong WW. 2006. Myosin isoforms and fibre types in jaw-closing muscles of Australian marsupials. J. Comp. Physiol. 176, 685-695. ( 10.1007/s00360-006-0091-x) [DOI] [PubMed] [Google Scholar]
- 123.Herring SW, Wineski LE. 1986. Development of the masseter muscle and oral behavior in the pig. J. Exp. Zool. 237, 191-207. ( 10.1002/jez.1402370206) [DOI] [PubMed] [Google Scholar]
- 124.Vinyard CJ, Wall CE, Williams SH, Hylander WL. 2008. Patterns of variation across primates in jaw-muscle electromyography during mastication. Am. Zool. 48, 294-311. ( 10.1093/icb/icn071) [DOI] [PubMed] [Google Scholar]
- 125.Wroe S, McHenry C, Thomason J. 2005. Bite club: comparative bite force in big biting mammals and the prediction of predatory behaviour in fossil taxa. Proc. R. Soc. B 272, 619-625. ( 10.1098/rspb.2004.2986) [DOI] [PMC free article] [PubMed] [Google Scholar]
- 126.Stienen G, Kiers J, Bottinelli R, Reggiani C. 1996. Myofibrillar ATPase activity in skinned human skeletal muscle fibres: fibre type and temperature dependence. J. Physiol. 493, 299-307. ( 10.1113/jphysiol.1996.sp021384) [DOI] [PMC free article] [PubMed] [Google Scholar]
- 127.Zajac FE. 1989. Muscle and tendon: properties, models, scaling, and application to biomechanics and motor control. Crit. Rev. Biomed. Eng. 17, 359-411. [PubMed] [Google Scholar]
- 128.Holmes M, Taylor AB. 2021. Data from: The influence of jaw-muscle fibre-type phenotypes on estimating maximum muscle and bite forces in primates. FigShare. [DOI] [PMC free article] [PubMed]
Associated Data
This section collects any data citations, data availability statements, or supplementary materials included in this article.
Data Citations
- Holmes M, Taylor AB. 2021. Data from: The influence of jaw-muscle fibre-type phenotypes on estimating maximum muscle and bite forces in primates. FigShare. [DOI] [PMC free article] [PubMed]
Data Availability Statement
Additional data are provided in the electronic supplementary material [128].