

Abstract
The choice of TiO2 crystal phase (i. e., anatase, rutile, or brookite) greatly influences catalyst performance in the gas‐phase ketonization of small volatile fatty acids, such as acetic acid and propionic acid. Rutile TiO2 was found to perform best, combining superior activity, as exemplified by an exceptional reaction rate of 141.8 mmol h−1 gcat −1 (at 425 °C and 24 h−1) with excellent ketone selectivity when propionic acid was used. Brookite, to the best of our knowledge never reported before as a viable ketonization catalyst, was found to outperform the well‐studied anatase phase, but not rutile. Operando Fourier‐transform IR spectroscopy measurements combined with on‐line mass spectrometry showed that bidentate carboxylates were the most abundant surface species on the rutile and brookite surfaces, while on anatase both monodentate and bidentate carboxylates co‐existed. The bidendate carboxylates were thought to be precursors to the active ketonization species, likely monodentate intermediates more prone to C−C coupling. Ketonization activity did not directly correlate with acidity; the observed, strong crystal phase effect did suggest that ketonization activity is influenced strongly by geometrical factors that determine the ease of formation of the relevant surface intermediates.
Keywords: carboxylic acid, infrared spectroscopy, ketonization, operando spectroscopy, titanium dioxide
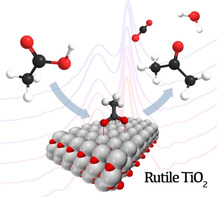
Rutile rules! Rutile proves highly active in the gas‐phase ketonization of volatile fatty acids, a versatile acid upgrading reaction. Operando IR measurements provide insight into why rutile outperforms other titania crystal phases.
Introduction
The ketonization reaction couples two carboxylic acids into a ketone, carbon dioxide, and water. This reaction has received much interest recently as an important means for the production of transportation fuels and chemicals from biobased feedstock, such as bio‐oils[1] or, from other circular feedstock, such as fermented wastewater streams.[2, 3] Indeed, the ketone products are versatile precursor molecules that can be further upgraded to various value‐added products, for example, to fuel components, lubricants,[4, 5, 6] or alkylated aromatics.[7, 8] Amphoteric metal oxides, such as TiO2,[9, 10, 11, 12, 13] ZrO2,[13, 14] CeO2,[15, 16, 17, 18] or CexZr(1‐x)O2,[19, 20] have been heavily studied for this process as a result of their high ketonization activity and selectivity. The mechanism of the reaction is still a matter of debate, however.[21, 22, 23]
It is generally accepted that the ketonization reaction requires a pair of adjacent coordinatively unsaturated metal cations together with metal cation/oxygen anion pairs. Brønsted basic sites are necessary for the α‐H abstraction and carboxylic acid coordination, while Lewis acid sites are also responsible for carboxylate stabilization and activation of the second carboxylic acid.[21] Surface defects, such as oxygen vacancies and/or reduced metal centers (e. g., Ti3+), have been suggested to be very beneficial for the ketonization reaction.[21, 24] A density functional theory (DFT) study[24] on reduced ZrO2 suggested that oxygen vacancies stabilize the reaction product and strongly reduce the activation energy, while reduced Zr3+ centers were found to be crucial to stabilize the acyl intermediate. Several reaction mechanisms have been proposed in the literature, with the one involving a β‐ketoacid intermediate with C−C bond formation as the rate‐limiting step being most widely assumed.[9, 10, 21, 22, 23, 24, 25, 26] C−C coupling was proposed to proceed between different surface species: (a) bidentate carboxylate and acylium intermediates;[24, 25] (b) a monodentate carboxylate and enolate anion;[10, 26] or (c) a bidentate carboxylate and enolate anion.[22, 27]
The proposed reaction cycles[10, 25] are illustrated in Figure 1. The primary step is the dissociative adsorption of acids with the formation of either a bridging bidentate (step A) or monodentate (step F) carboxylate. α‐Hydrogen abstraction from the bidentate surface species then leads to the formation of the dianion enolate (step B). Dehydroxylation of a second acid molecule (step D) yields an acylium intermediate that can be attacked by the enolate dianion forming the β‐ketoacid intermediate (step E). Decarboxylation of the β‐ketoacid then finally gives the ketone and carbon dioxide products.[28] Alternatively, the following mechanism was suggested:[10, 26, 29] the 1‐hydroxy enolate anion formed upon α‐hydrogen abstraction (step G) attacks an adjacent monodentate carboxylate (or molecularly adsorbed acid) producing α‐hydroxy γ‐carboxy alkoxide that dehydrates to the common β‐ketoacid (step I), followed by decarboxylation to a ketone.
Figure 1.
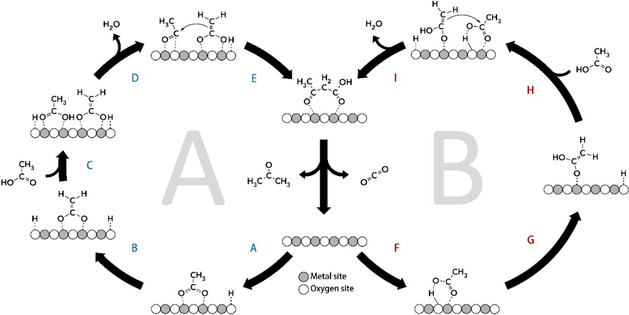
Reaction steps involved in acetic acid ketonization via the C−C coupling of an acylium intermediate and bidentate carboxylate (A); enolate and monodentate carboxylate(B).
The adsorption geometry of carboxylic acids on titanium dioxide, as one of the most commonly used ketonization catalysts, has been thoroughly investigated both experimentally and computationally. Acids adsorb on the metal oxide surface molecularly or dissociatively, forming monodentate or bidentate (chelating and bridging) carboxylates (Figure 2a). Coordination as a bidentate chelate is unlikely as it would lead to unstable hepta‐coordinated TiIV.[30, 31, 32] On all the most stable faces of TiO2 phases [anatase (101), rutile (110) and brookite (210)] two different kinds of Ti atoms, both 5‐ and 6‐fold‐coordinated (Ti5C, Ti6C) are present, together with 2‐ and 3‐fold‐coordinated O atoms (O2C, O3C). However, different distances between two closest cation atoms lead to various acid adsorption modes on these polymorphs. Studying the adsorption and photo‐induced decomposition of acetone and acetic acid on thin‐films of anatase, rutile, and brookite, Mattsson and Österlund[33] observed that the adsorbate‐surface interactions increase in the order anatase < brookite < rutile, with the bidentate anion formation being favored on rutile and brookite surfaces, while acetic acid adsorbed molecularly on anatase. The difference in adsorption geometries on TiO2 polymorphs ia ruled by the distance between two coordinatively unsaturated Ti cations.[32] The shorter Ti−Ti distance on rutile (i. e., 2.99[10] or 2.96 Å[30, 32, 34]) and brookite (i. e., 3.56 Å[35]) promote dissociative adsorption into bridging bidentates, while the longer Ti−Ti distances on anatase (i. e., 3.71,[32] 3.78,[30, 35] 3.81,[34] or 3.83 Å[10]) lead to molecular adsorption. The formation of bridging bidentates on rutile was observed experimentally [infrared (IR) spectroscopy,[10, 30, 33, 36] near‐edge X‐ray absorption fine structure (NEXAFS),[37] and scanning tunneling microscopy (STM)[38]] and is supported by theoretical studies.[10, 31, 34, 36, 39] Bidentates were also observed experimentally (IR)[33] and suggested theoretically[35] for the brookite surface. However, there is contradictory theoretical and experimental evidence for the adsorption of acids on anatase. Some theoretical studies reported that molecular adsorption is favored on the anatase (101) surface,[32, 35, 39] while other studies suggest dissociative adsorption forming monodentate[10] or bridging bidentate carboxylates.[34, 40] The latter were also observed experimentally by STM.[41] Using temperature programmed desorption (TPD), Kim and Barteau[42] observed molecularly and dissociatively adsorbed species to co‐exist at room temperature on an anatase surface during the adsorption of formic, acetic, or propionic acids. Similarly, both molecularly adsorbed acid and bidentate acetate were observed by Fourier‐transform (FT)IR spectroscopy on TiO2 P25 (i. e., a 80 : 20 mixture of anatase and rutile).[12, 43, 44] The presence of water was furthermore reported to affect the adsorption mode on anatase, favoring the formation of bidentates from initially monodentate molecular carboxylic acid.[32, 44]
Figure 2.

(a) Different adsorption configurations of acetic acid on a catalyst surface. (b) Equilibrium of surface carboxylates and ketenes on a catalyst surface during acetic acid ketonization.
A number of these adsorbed species have been implicated in catalysis. Several authors claimed bridging‐bidentates (Figure 1, step A) to be the active surface species in acetic acid ketonization on TiO2,[9, 10, 11, 12, 27, 45] ZrO2,[25, 27, 46] CeO2,[12, 17, 27, 47] and ZnO‐Cr2O3 [48] and supported these observations by DFT studies.[24, 25] Alternatively, studying structure requirements for ketonization reaction on single crystal TiO2 (001) surface, Kim and Barteau[49] stated that ketonization requires two acetates coordinated to the same Ti4+ cation, which necessitates monodentate adsorption. IR spectroscopy measurements investigating the acetate bonding mode [using transmission FTIR,[11, 12] diffuse reflectance infrared Fourier transform (DRIFT),[27, 48] reflection absorption infrared spectroscopy (RAIRS)[47]] suggested that bridging bidentates are the main species present on a ketonization catalyst surface. However, most of these IR studies were done on surfaces with the acid pre‐adsorbed and, more importantly, under conditions far removed from a practical ketonization catalyst application. Recent studies by Wang and Iglesia[10] also suggest, based on DFT and detailed kinetic studies, that molecularly adsorbed acid or monodentate carboxylate species are the reactive species on the TiO2 catalyst and transform upon the α‐hydrogen abstraction to 1‐hydroxy enolates (Figure 1, step G), which undergo C−C coupling with a co‐adsorbed acid (Figure 1, step I). The bidentate carboxylates were concluded to be stable spectator species, unreactive towards ketonization and proposed to be in equilibrium with the ketene by‐product (Figure 2b), which could be scavenged by hydrogenation. By in‐situ transmission FTIR spectroscopy of the ketonization reaction of acetic acid, unreactive bidentates were seen to prevail on the rutile surface, while on anatase reactive monodentates were detected. Similarly, Shylesh et al.[26] observed only molecularly adsorbed acid on highly active isolated Zr centers supported on SiO2, while bidentate species were detected on less active clustered Zr on silica. However, these FTIR studies[10, 26] were performed at 200–250 °C, which is lower than the reported temperature necessary for the reaction to occur (275 °C).[50] The combined TPD and FTIR studies of pre‐adsorbed acetic acid[11, 43] reveal that the acid adsorption mode is temperature dependent with both bidentate and monodentate carboxylates being observed at <300 °C, while only bidentates were observed at >300 °C. Therefore, insight into the actual reactive surface species during ketonization and correlating them with the physicochemical properties of a catalyst (such as crystal phase) or reaction temperature remains a challenge. Moreover, the number of studies comparing the TiO2 polymorphs in terms of ketonization activity is limited[10, 51] and a comparison of anatase, rutile, and brookite is missing.
Here, we report on the effect of the TiO2 crystal phase on the catalytic performance in the gas‐phase ketonization reaction of propionic acid and compare the results were insightful with acetic acid. Commercial pure‐phase anatase, rutile, and brookite titania catalysts were studied as a function of increasing time on stream. Rutile TiO2 was found to possess superior ketonization activity and selectivity, followed by brookite and finally anatase. To the best of our knowledge, brookite TiO2 has not yet been reported as a catalyst for ketonization, but is found to outperform anatase, the typical phase of titania used. The effect on the mode of acid adsorption was studied by operando transmission FTIR spectroscopy coupled with on‐line mass spectrometry (MS) under catalytically relevant temperatures (250–425 °C), showing that bidentate carboxylates are the dominant species on rutile and brookite polymorphs, while on anatase both monodentate and bidentate species co‐exist.
Results and Discussion
Catalyst characterization
Table 1 summarizes the Brunauer‐Emmett‐Teller (BET) surface areas, pore volumes, and crystallite size of the TiO2 catalysts. The adsorption isotherms are given in Figure 3. The H3 hysteresis type shown by all polymorphs indicated that the materials consist of aggregates of plate‐like particles.[52] The low specific surface area of anatase TiO2 (AN, 9 m2 g−1) can be ascribed to the interspace between dense non‐porous particles. The rutile (RU) and brookite (BR) samples showed similar values of 29 and 35 m2 g−1, respectively. The average pore size of AN (80 nm) and RU (65 nm) are in the macropore range, while for BR the value of 24 nm lies in the mesopore range.[52]
Table 1.
Physicochemical properties of the TiO2 catalyst materials under study.
|
Property |
Anatase |
Rutile |
Brookite |
|---|---|---|---|
|
surface area[a] [m2 g−1] |
9 |
29 |
35 |
|
pore volume[a] [cm3 g−1] |
0.06 |
0.24 |
0.35 |
|
mean crystallite size[b] [nm] |
71 |
31 |
20 |
|
number of acid sites[c] [μmol g−1] |
17 |
71 |
122 |
|
number of acid sites[c] [μmol m−2] |
1.9 |
2.4 |
3.5 |
[a] Calculated by the BET method. [b] Calculated by Scherrer's equation from XRD diffractogram. [c] Measured by TPD‐NH3.
Figure 3.
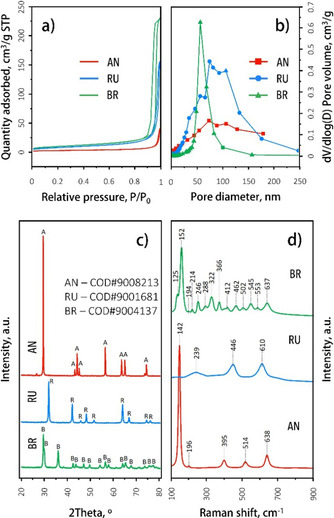
Physicochemical properties of the three TiO2 catalyst materials under study. (a) N2 adsorption and desorption isotherms. (b) Barrett‐Joyner‐Halenda (BJH) pore diameters. (c) XRD patterns. d) Raman spectra.
The mean crystallite size (Table 1) was calculated from the X‐ray diffraction (XRD) patterns (Figure 3c) using the Scherrer equation on the (101), (110), and (121) Bragg reflections of AN, RU, and BR, respectively. The crystallite sizes of RU and BR are comparable, while for AN the size is about three to four times bigger. Importantly, the XRD patterns also confirmed that the AN, RU, and BR materials are phase‐pure, with no other crystalline phases detected (Figure 3c). This was further corroborated by Raman spectroscopy, a sensitive tool for studying phase purity of TiO2 because all three polymorphs have highly characteristic bands (Table S1).[33, 50, 53] The Raman spectra presented in Figure 3d indeed only show the bands corresponding to phase‐pure anatase, rutile, and brookite.
The acidity of the materials was determined by TPD of ammonia (Table 1). Here, the acid site density followed the order: BR>RU>AN, with all TPD profiles (Figure 4a) showing two distinct peaks: the low‐temperature (LT) peak around 200 °C for weak acid sites and a high‐temperature (HT) one at approximately 350 °C corresponding to strong acid sites. The HT peak intensity decreased in the order BR>RU>AN, with the latter, however, showing the highest desorption temperature. Weak acid sites prevailed on the AN surface, whereas the RU and BR surfaces contained mainly strong acid sites. FTIR spectroscopy analysis after pyridine adsorption showed that all acid sites correspond to Lewis acid sites (Figure 4b). No Brønsted acid sites were observed, except for a small broad band at 1550 cm−1 observed for BR. The acidity order is the same as the one found by TPD (Figure 4c).
Figure 4.
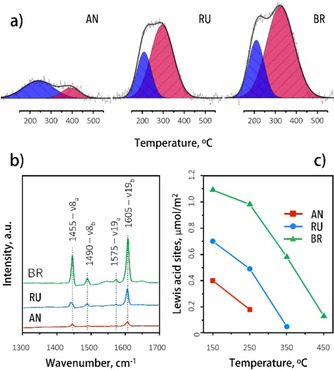
(a) TPD profiles after NH3 probe molecule adsorption. (b) FTIR spectra of the TiO2 catalysts with adsorbed pyridine. (c) Evolution of the pyridine adsorbed on Lewis acid sites as a function of evacuation temperature.
Catalyst testing
The catalytic performance of the three TiO2 polymorphs (i. e., AN, RU, and BR) was studied in the gas‐phase ketonization of propionic acid for the same weight of catalyst at different temperatures (i. e., 325, 375, and 425 °C). The influence of any mass transfer limitations was checked using the Weiss‐Prater method,[54] with the criterion found to be <0.3 for all reactions, indicating pore diffusion limitations were absent.
At 325 °C (Figure 5), both RU and BR showed comparable activity with ketone formation rates of 1.3 and 1.4 mmol h−1 gcat −1, respectively, and with high selectivity towards the ketone (>90 %), while AN was not active (0.2 mmol h−1 gcat −1). 3‐pentanone is the main product of the reaction with some paraffins/olefins being detected as a minor product. Higher ketonization rate were seen at 375 °C (Figure 5), with RU now outperforming (92 % conversion and 17.9 mmol h−1 gcat −1) both moderately active BR (56 % and 10.7 mmol h−1 gcat −1) and poorly performing AN (10 % and 1.7 mmol h−1 gcat −1). Both RU and BR show comparably high selectivity towards 3‐pentanone (≈95 %), while for AN also the selectivity was found to be significantly lower (≈77 %).
Figure 5.
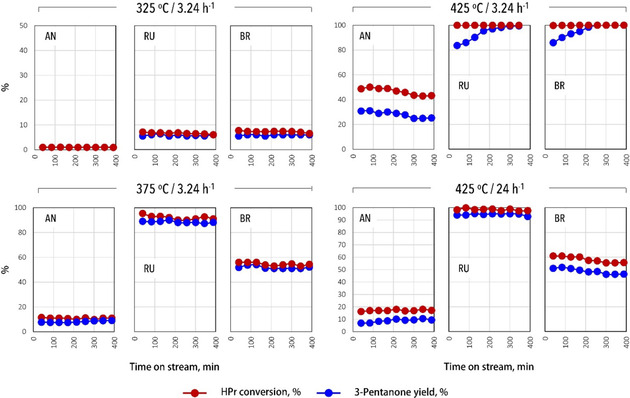
Gas‐phase ketonization of propionic acid (HPr) as a function of time on stream and at different temperatures and space velocities over the TiO2 catalysts.
The results of the ketonization at 425 °C are also presented in Figure 5. The reaction proceeded at full conversion over RU and BR catalysts at the set weight hourly space velocity (WHSV) and is accompanied by the formation of a mixture of pentene isomers as a side reaction. The olefins are formed due to the secondary reduction reaction of the ketone to alcohol, followed by subsequent dehydration to olefin.[55] The hydrogen source for this reduction is suggested to come from cyclization of the ketone condensation product. The selectivity shifts over time towards the ketone, as also reported elsewhere, suggesting gradual deactivation of the sites involved in H2 evolution and ketone reduction/dehydration.[55] The increase in propionic acid conversion over AN was accompanied by a considerable drop in the selectivity (from 77 to 60 %).
For a reliable comparison of the catalytic performance of the polymorphs, the WHSV value was increased as not to operate at full conversion (Figure 5). Surprisingly, a WHSV increase of no less than 7.5 times (from 3.24 to 24 h−1) was required to achieve less than full propionic acid conversion, being 95 % for RU under these conditions, still with an excellent 3‐pentanone selectivity of around 95 % and an exceptionally high ketone formation rate of 141.8 mmol h−1 gcat −1. The conversion over BR was around 60 % (75 mmol h−1 gcat −1) at this high space velocity; however, in this case, the selectivity decreased to 80 %. AN showed again the lowest activity and selectivity, 20 and 50 %, respectively, the rate being 13.7 mmol h−1 gcat −1 in this case. Importantly, no olefins were observed at the higher space velocity, indicating that aldol condensation/cyclization/hydrogen transfer and reduction/dehydration reactions of ketones are consecutive and favored at lower WHSV.
The above‐described results clearly show that the ketonization activity under these reaction conditions by catalyst weight followed the order RU>BR>AN, with the latter catalyst showing the lowest selectivity as well. As surface area varied significantly, the results were also compared in terms of moles of ketone produced/acid converted per m2 of catalyst (Figure 6). At low temperature, RU and BR then show comparable performance, superior to AN, while at higher temperature RU again performed best. All TiO2 polymorphs exhibited no obvious deactivation over the tested time on stream. There also seems to be no simple correlation between catalyst acidity and performance, suggesting they are sufficiently acidic and that other (e. g., geometric) characteristics play a more important role. In a recent study, Almutairi et al.[27] compared various metal oxides (i. e., TiO2, ZrO2, CeO2, and Al2O3) in the gas‐phase ketonization of acetic acid, also finding no correlation between the acidity of the metal oxides and their ketonization activity.
Figure 6.
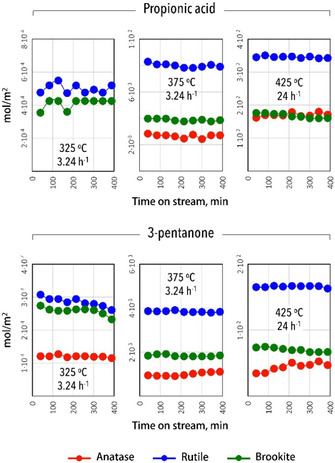
Catalyst activity, expressed in yield or conversion for the gas‐phase ketonization of propionic acid over anatase, rutile, and brookite at different reaction temperatures, normalized by surface area as a function of time on stream.
The number of studies comparing the ketonization activities of TiO2 polymorphs is rather limited. Aranda‐Pérez et al.[51] studied the liquid‐phase ketonization of acetic acid over 5 wt% Ru on anatase, rutile, and the anatase/rutile mixture (i. e., the P25 TiO2), finding the ketonization rates for rutile to be nearly two times faster than anatase. The difference in activity was attributed to the shorter Ti−Ti distances on rutile leading to shorter intermolecular distances between two adsorbed carboxylate fragments, thus easing the formation of coupling product. On the contrary, Wang and Iglesia[10] reported fivefold higher initial ketonization rates over anatase compared to rutile. Here, the shorter Ti−Ti distances of the majority low‐index planes of rutile were instead thought to induce the formation of unreactive bridging bidentate, leading to lower reactivity. The low ketonization activity of rutile was then attributed to residual anatase surfaces. In our case, the characterization data shows RU to be phase‐pure, precluding any attribution of activity to residual anatase. Given these contrasting observations, we have decided to investigate the mode of adsorption of the acid substrate on the titania catalysts with FTIR spectroscopy under operando conditions.
Operando IR spectroscopy
As discussed above, carboxylic acids can adsorb on metal oxide surfaces molecularly or dissociatively forming monodentate and bidentate carboxylates. All these surface species can, in principle, be distinguished by the characteristic FTIR bands of their carboxylic (−COOH) or carboxylate groups (−COO−), as summarized in Table S2. We observed crystal phase‐dependent surface coverage and correlate these with catalytic performance, as monitored by FTIR spectroscopy and on‐line MS, respectively. Acetic acid, for spectral simplicity and to allow MS monitoring (see below), was studied in addition to propionic acid and spectra were recorded during ketonization of these acids over TiO2 catalysts at different temperatures 250–425 °C.
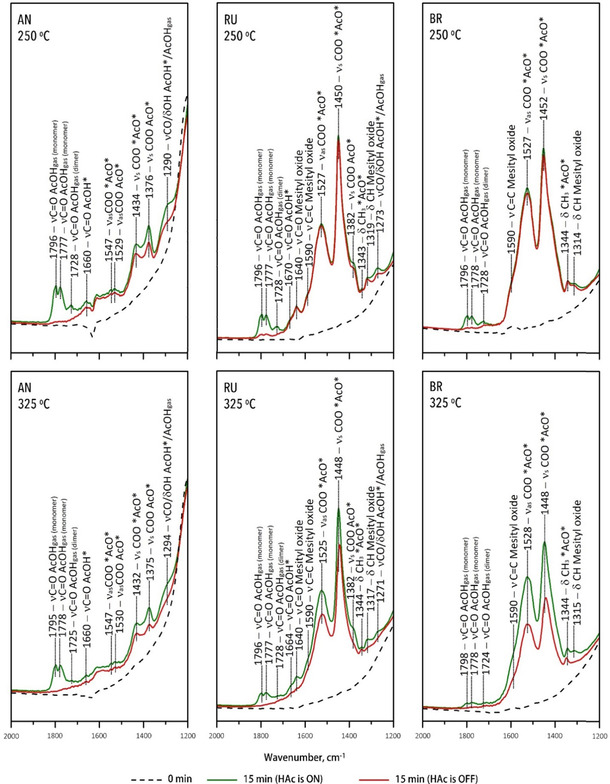
The operando FTIR spectra obtained during acetic acid ketonization at 325 °C are shown in Figure 7. Gaseous acetic acid showed the characteristic C−O stretching band at 1375 and at 1282 cm−1 caused by C−O vibrations coupled with δOH and strong bands at 1798, 1777, and 1734 cm−1 corresponding to C=O stretching of monomeric and dimeric acetic acid, respectively.[10, 11, 12, 33, 43, 56] On the AN surface, acetic acid adsorbed both molecularly and dissociatively, forming monodentate and bidentate carboxylates. While distinct FTIR peaks can be detected, though, the overall signal was rather weak, also in comparison to recent literature,[10] due to the low surface area of TiO2 anatase (9 vs. 240 m2 g−1). It should be noted, as well, that most studies instead used mixtures of TiO2 phases[11, 12] or TiO2 of unknown phase‐purity,[10] while the materials used in this study are demonstrated above to be phase‐pure. The band at 1660 cm−1 is assigned to ν C=O vibrations of acetic acid molecularly adsorbed at a Lewis acid site (Ti4+) through the lone‐pair electrons of the carbonyl group.[10, 12, 43] The FTIR bands at 1376 and 1547 cm−1 correspond to asymmetric and symmetric COO stretching vibrations of monodentate acetate.[10] However, it should be noted that the ν sym COO vibrations of monodentate carboxylates do overlap with the broad νCO/ δOH band of gaseous acetic acid. Nevertheless, after removal of HAc from the gas phase, as indicated by the disappearance of the strong C=O bands around 1700 cm−1, the 1375 and 1547 cm−1 bands remained, supporting the presence of monodentate species. The FTIR bands at 1434 and 1530 cm−1 are assigned to COO vibrations of bidentate acetate.[10] The ν sym COO vibration intensities of the carboxylates suggest that both species are present in similar amounts on anatase. The spectral evolution upon outgassing is illustrated in Figure 8, showing the adsorbed carboxylates to be stable and remain on the anatase surface after 25 min; notably, the bidentate carboxylates desorbed more slowly than the monodentate ones.
Figure 7.
Operando FTIR spectra in the 1200–2000 cm−1 region of the different TiO2 materials under study with 1.66 kPa acetic acid.
Figure 8.

Evolution of the operando FTIR spectra in the 1200–2000 cm−1 region of the different TiO2 materials under study with 1.66 kPa acetic acid upon outgassing.
In their recent study, Wang and Iglesia[10] reported monodentate carboxylates to be the dominant species on anatase, with bands associated with bidentates only appearing after removal of acid from the gas‐phase. However, these FTIR studies were performed at 250 °C, which is lower than the temperatures required and typically used for gas‐phase ketonization (>300 °C).[22, 57] Pei and Ponec[11] reported FTIR spectra of HAc adsorbed on anatase TiO2 at various temperatures, observing both mono‐ and bidentate carboxylates on the catalyst surface at <300 °C. At increasing temperature, the monodentate bands gradually decreased until they disappeared entirely above 300 °C. These results further highlight the dynamics and possible temperature dependence of carboxylate adsorption. For comparison, FTIR spectra were, therefore, also recorded with acetic acid at 250 °C (Figure 7). The spectra are near identical to those observed at 325 °C (Figure 7), showing similar relative intensities of the relevant carboxylate bands, but with a higher absolute intensity that allows the peaks to be more clearly identified. Similar spectra were recorded at ketonization temperatures of 375 and 425 °C (Figure S1), suggesting that the adsorption mode does not change over this temperature range.
The FTIR spectra of the RU and BR catalysts under study are also shown in Figure 7. These higher surface area polymorphs showed significantly higher intensity peaks compared to anatase. On RU, the strong FTIR bands at 1450 and 1527 cm−1 together with the weak band at 1343 cm−1 corresponded to the COO stretching vibrations and CH3 in‐plane scissoring of adsorbed bidentate acetate.[12, 27, 30, 33, 43, 48] The shoulders at 1382 and 1664 cm−1 imply the presence of monodentate and molecularly adsorbed acetic acid, respectively, presented as minority species. On the BR surface, however, only bands corresponding to bidentate species (1527, 1452, and 1344 cm−1) were observed (Figure 7).
Furthermore, several new surface species were detected on BR and RU. The νC=O band at 1640 cm−1 and the νC=C band at 1590 cm−1 originated from an α,β‐conjugated carbonyl bond, respectively, bound to weak Lewis acid sites. These bands, together with the weak bands at 1319 and 1208 cm−1, suggested absorbance of the acetone condensation product mesityl oxide on RU and BR surfaces.[12] Upon outgassing (Figure 8) the strong bidentate bands disappeared very slowly, indicating these species to be rather stable on the surface.
The reaction products were simultaneously followed by on‐line MS during the operando FTIR spectroscopy experiments. The on‐line MS data recorded at 250 and 325 °C (Figure S2) showed the formation of ketone product (m/z=58) on all TiO2 polymorphs, demonstrating the true operando nature of the FTIR spectroscopy measurements. Acetone production was constant over AN, whereas over the RU and BR catalysts, it increased with increasing time‐on‐stream. Based on the relative intensities, the observed trend in ketone yield (RU>BR>AN) is the same as with propionic acid ketonization at 325 °C (Figure 5). Ketene was the main by‐product observed on all catalysts. It should be, however, pointed out that the mass spectrum of acetic acid also shows a signal at m/z=42, the value for the molecular ion of the ketene. The abundance of the ketene molecular ion is, however, five‐fold higher compared to acid, allowing ketene formation to be followed as well. Significant amounts of ketene were observed on the most active RU and BR catalysts, with the ketene peak exceeding that of acid. Moreover, the ketene peak mimicked the profile of the acetone peak, supporting the bidentate‐ketene equilibrium that was suggested elsewhere.[10] The aldol condensation product of acetone, mesityl oxide (m/z=83) was also detected for RU and BR, supporting the FTIR spectroscopy observations (Figure 7).
FTIR spectra of propionic acid ketonization are shown in Figure 9. The operando spectra show similar bands as for the reaction with acetic acid, indicating adsorption of HPr as bidentate on RU, and as both mono‐ and bidentates on AN. These observations are in agreement with NEXAFS results revealing that bond geometry does not change with increasing alkyl chain length.[37] On BR, however, a small band corresponding to symmetric COO− stretch of monodentate carboxylate at 1380 cm−1 was observed in addition to strong bidentate bands (1513 and 1438 cm−1), contrary to spectra with adsorbed acetic acid. Moreover, on RU, the symmetric COO− stretch was higher than the asymmetric vibration, while the opposite is typically the case, as was also observed by Wang and Iglesia.[10] The spectrum recorded upon outgassing showed a strong band around 1440 cm−1 that overlapped with ν as COO− of the bidentate carboxylate. This band was also seen during desorption of pre‐adsorbed acid from TiO2 P25 and has been assigned to bidentate species.[11, 12, 43, 44] However, comparison of the RU and BR spectra, showed that this band is quite pronounced on rutile, while it seems to be absent on brookite. The band can also be seen for the spectra recorded of rutile with acetic rather than propionic acid; so far, the origin of this band remains unknown. The other new FTIR band at 1470 cm−1 was assigned to scissoring C−H vibrations of the propionic acid alkyl chain. It should be noted that the use of MS was unfeasible for the propionic acid ketonization reaction as the m/z values of the various components [propionic acid (m/z=29), 3‐pentanone (m/z=29 and 57), pentene (m/z=57), aldol dimer product (m/z=29)] overlap.
Figure 9.

Operando FTIR spectra in the 1200–2000 cm−1 region of TiO2 with 1.66 kPa propionic acid at 325 °C.
Comparing the FTIR data and the on‐line GC results we can conclude that bidentate carboxylates prevail on the more active RU and BR catalysts (Figure 7). Based on DFT calculations and kinetic studies, Wang and Iglesia[10] concluded bidentates to be unreactive spectators, however, while monodentate and/or molecularly adsorbed acid species were considered to be catalytically active. Pham et al.[21] have also proposed that the more stable bidentate carboxylates form initially on the surface, after which they may transform in the catalytic cycle to a less restricted monodentate configuration that undergoes C−C coupling with another species to a ketone. A recent study by Almutairi et al.[27] observed a facile exchange between bidentate carboxylate and molecularly adsorbed acids under mild conditions, supporting the assumption that the more stable bidentate adsorbate transforms to more reactive (e. g., monodentate) species during the reaction. However, since the various species coexist in equilibrium on the catalyst surface (Figure 2b), they are kinetically indistinguishable. Based on these observations, we suggest that bidentate carboxylates are not merely spectators, but in equilibrium with and real precursors to the relevant active species, such as monodentate carboxylates. That the Ti–Ti distance in RU is shorter than in BR or AN would then facilitate adsorption of these bidentate precursors, contributing to the superior activity and selectivity seen for this phase.
Conclusions
A comparison of the three polymorphs of TiO2, namely anatase, rutile, and brookite, in the gas‐phase ketonization of propionic acid showed rutile to be the most active and selective catalyst over a wide range of temperatures (i. e., 325–425 °C). Contrary to previous reports, phase‐pure anatase was found to perform very poorly. Catalyst performance did not directly correlate with the material's acidity, which suggests that geometrical factors (i. e., the ease with which certain adsorbates are formed and react) are more important. Indeed, operando Fourier‐transform FTIR spectroscopy indicated clear differences in surface speciation: while both monodentate and bidentate carboxylates are present in similar amounts on the anatase surface, bidentate carboxylates are the most abundant species on the highly active rutile and brookite surfaces. The adsorption configuration was found to be independent of the reaction temperature. The shorter Ti−Ti distances on rutile could facilitate adsorption of such bidentates. These rather stable bidentate carboxylates are presumed to be precursors transforming into active species (e. g., monodentate carboxylates) during the reaction. However, the presented results do not rule out that bidentate carboxylates may act as active species. The co‐existence of various species in equilibrium on a catalyst surface makes them kinetically indistinguishable, making it challenging to conclude on the actual nature of active species by operando FTIR spectroscopy studies. The detailed characterization of the catalyst materials together with the operando studies at catalytically relevant temperatures, thus provide new insight into the gas‐phase ketonization of carboxylic acids.
Experimental Section
Catalyst preparation
Anatase (≥99 %, trace metals basis), rutile (99.5 %, trace metals basis), and brookite (99.99 %, trace metals basis) TiO2 materials were purchased from Sigma‐Aldrich. The catalyst materials are denoted as AN (anatase), RU (rutile), and BR (brookite).
Catalyst characterization
Powder XRD patterns were recorded on a Bruker‐AXS D2 Phaser X‐ray diffractometer using Co‐Kα1,2 radiation (λ=1.790 Å). Diffraction patterns were collected between 20 and 90° 2θ with an increment of 0.03° 2θ per 1 s. N2 physisorption isotherms were recorded to determine surface areas and pore volumes with a Micromeritics Tristar 3000 setup operating at 77 K. The samples were outgassed for 20 h at 573 K under N2 flow prior to the measurements. Surface areas were determined using the BET theory, while pore volumes [cm3 g−1] were calculated by the BJH method. Raman spectra were recorded on a Renishaw InVia Raman microscope, using 532 nm diode laser excitation through a 50× objective, under 0.24 mW with an integration time of 10 s. All Raman spectra are shown as obtained: no smoothing, background correction, or baseline subtraction was performed. TPD of NH3 as probe molecule was used to study acidity. Measurements were recorded on Micromeritics AutoChem II 2920 for 200 mg of TiO2 catalyst using 10 % NH3/He. Prior to adsorption, the catalyst material was dried in an inert gas at 425 °C for 1 h. The adsorption of NH3 was performed at 50 °C, with the desorption profile studied at 10 °C min−1 ramp up to 700 °C. The number of acid sites was measured by integrating the area under the curve of NH3‐TPD. FTIR spectroscopy of adsorbed pyridine was performed with a Thermo Nicolet iS5 FT‐IR spectrometer using vacuum cells. About 20 mg of the catalyst material was pressed into a self‐supporting wafer, loaded into a cell, and dried at 425 °C for 1 h in the vacuum of 10−3 to 10−5 mbar. Pyridine adsorption (20 mbar) was carried out at 150 °C with excess pyridine removed applying vacuum. The call was heated at 10 °C min−1 to a 550 °C with FTIR spectra recorded at 150, 250, and 350 °C. For each spectrum, 32 scans were recorded with a resolution of 4 cm−1. Operando FTIR spectroscopy data were recorded on a Tensor 27 FTIR spectrometer equipped with an internal room‐temperature DLaTGS detector. A catalyst was pelletized into a wafer (15–25 mg) and placed into 5 cm3 stainless steel cell with KBr windows (Figure S3). Prior to the measurements, the catalyst was dried at 425 °C (10 °C min−1) for 1 h in flowing N2 (5 mL min−1). The acid [acetic acid (HAc), Acros, 99.8 %, or propionic acid (HPr), Alfa Aesar, 99 %] was injected over the pellet with a vapor pressure of 1.66 kPa. For each spectrum, 32 scans were recorded with a resolution of 4 cm−1. On‐line MS data was measured on an Omnistar Pfeiffer Vacuum MS equipped with quadrupole detector. Ion currents (fragment m/z data obtained from the NIST Chemistry WebBook database https://webbook.nist.gov) were recorded for the main products and by‐products, using the program Quadstar 32‐Bit.
Catalyst testing
The gas‐phase ketonization was studied with time on stream in a fixed bed reactor at different temperatures. The reaction setup is schematically shown in Figure S3. Propionic acid (HPr, Alfa Aesar, 99 %) was pumped by a HPLC pump (LC‐20AT, Shimadzu). Mass flow controllers (F‐201CV, Bronkhorst) were used to control the flow of N2. The borosilicate reactor (i.d. 8 mm) was loaded with a TiO2 catalyst (particle size of 212–150 μm) mixed with two volumes of silicon carbide. Prior to the reaction the catalyst bed was kept at 425 °C for 1 h in N2 flow (100 mL min−1). The catalytic studies were performed at atmospheric pressure. The reaction products were analyzed by on‐line GC (Bruker, 430‐GC) equipped with flame ionization detector and a PoraPLOT Q‐HT analytical column. Cyclooctane (Sigma‐Aldrich, ≥99 %) was used as an internal standard. Acid conversion, ketone yield and selectivity were calculated according to equations Eq. S1–Eq. S3.
Conflict of interest
The authors declare no conflict of interest.
Supporting information
As a service to our authors and readers, this journal provides supporting information supplied by the authors. Such materials are peer reviewed and may be re‐organized for online delivery, but are not copy‐edited or typeset. Technical support issues arising from supporting information (other than missing files) should be addressed to the authors.
Supplementary
Acknowledgements
Dustin Eekhof (Utrecht University, UU) and Ellen Sterk (UU) are acknowledged for their experimental contributions. Dr. Ana Hernández Giménez (UU) and Dr. Matteo Monai (UU) are acknowledged for helpful discussions on the operando FT‐IR spectroscopy‐online MS analysis. Nynke Krans (UU) is thanked for taking the TEM images, while Dr. Thomas Hartman (UU) and Dr. Katinka S. Wondergem (UU) are acknowledged for their help with Raman spectroscopy. Giorgio Totarella (UU) is thanked for fruitful discussions on physisorption analysis. The authors acknowledge the financial support by STW and Paques through the STW‐Paques Program.
E. V. Fufachev, B. M. Weckhuysen, P. C. A. Bruijnincx, ChemSusChem 2021, 14, 2710.
References
- 1.Pham T. N., Shi D., Resasco D. E., Appl. Catal. B 2014, 145, 10–23. [Google Scholar]
- 2.Reyhanitash E., Fufachev E., Van Munster K. D., Van Beek M. B. M., Sprakel L. M. J., Edelijn C. N., Weckhuysen B. M., Kersten S. R. A., Bruijnincx P. C. A., Schuur B., Green Chem. 2019, 21, 2023–2034. [Google Scholar]
- 3.Fufachev E. V., Weckhuysen B. M., Bruijnincx P. C. A., ACS Sustainable Chem. Eng. 2020, 8, 11292–11298. [Google Scholar]
- 4.Corma A., Renz M., Schaverien C., ChemSusChem 2008, 1, 739–741. [DOI] [PubMed] [Google Scholar]
- 5.Balakrishnan M., Sacia E. R., Sreekumar S., Gunbas G., Gokhale A. A., Scown C. D., Toste F. D., Bell A. T., Proc. Natl. Acad. Sci. USA 2015, 112, 25, 1–6. [DOI] [PMC free article] [PubMed] [Google Scholar]
- 6.Sacia E. R., Balakrishnan M., Deaner M. H., Goulas K. A., Toste F. D., Bell A. T., ChemSusChem 2015, 8, 1726–1736. [DOI] [PubMed] [Google Scholar]
- 7.Fufachev E. V., Weckhuysen B. M., Bruijnincx P. C. A., Green Chem. 2020, 22, 3229–3238. [Google Scholar]
- 8.Fufachev E. V., Chemical Building Blocks from Fermented Wastewater by Chemocatalytic Conversion; PhD Thesis, Utrecht, Utrecht University, 2019. [Google Scholar]
- 9.Pham T. N., Shi D., Resasco D. E., J. Catal. 2014, 314, 149–158. [Google Scholar]
- 10.Wang S., Iglesia E., J. Catal. 2017, 345, 183–206. [Google Scholar]
- 11.Pei Z. F., Ponec V., Appl. Surf. Sci. 1996, 103, 171–182. [Google Scholar]
- 12.Hasan M. A., Zaki M. I., Pasupulety L., Appl. Catal. A 2003, 243, 81–92. [Google Scholar]
- 13.Pestman R., Koster R. M., van Duijne A., Pieterse J. A. Z., Ponec V., J. Catal. 1997, 168, 265–272. [Google Scholar]
- 14.Ignatchenko A. V., Kozliak E. I., ACS Catal. 2012, 2, 1555–1562. [Google Scholar]
- 15.Gliński M., Kijeński J., Jakubowski A., Appl. Catal. A 1995, 128, 209–217. [Google Scholar]
- 16.Randery S. D., Warren J. S., Dooley K. M., Appl. Catal. A 2002, 226, 265–280. [Google Scholar]
- 17.Nagashima O., Sato S., Takahashi R., Sodesawa T., J. Mol. Catal. A 2005, 227, 231–239. [Google Scholar]
- 18.Snell R. W., Shanks B. H., ACS Catal. 2014, 4, 512–518. [Google Scholar]
- 19.Gärtner C. A., Serrano-Ruiz J. C., Braden D. J., Dumesic J. A., ChemSusChem 2009, 2, 1121–1124. [DOI] [PubMed] [Google Scholar]
- 20.Zaytseva Y. A., Panchenko V. N., Simonov M. N., Shutilov A. A., Zenkovets G. A., Renz M., Simakova I. L., Parmon V. N., Top. Catal. 2013, 56, 846–855. [Google Scholar]
- 21.Pham T. N., Sooknoi T., Crossley S. P., Resasco D. E., ACS Catal. 2013, 3, 2456–2473. [Google Scholar]
- 22.Pacchioni G., ACS Catal. 2014, 4, 2874. [Google Scholar]
- 23.Ignatchenko A. V., Catal. Today 2019, 338, 3–17. [Google Scholar]
- 24.Tosoni S., Pacchioni G., J. Catal. 2016, 344, 465–473. [Google Scholar]
- 25.Pulido A., Oliver-Tomas B., Renz M., Boronat M., Corma A., ChemSusChem 2013, 6, 141–151. [DOI] [PubMed] [Google Scholar]
- 26.Shylesh S., Bettinson L. A., Aljahri A., Head-Gordon M., Bell A. T., ACS Catal. 2020, 10, 4566–4579. [Google Scholar]
- 27.Almutairi S. T., Kozhevnikova E. F., Kozhevnikov I. V., Appl. Catal. A 2018, 565, 135–145. [Google Scholar]
- 28.Ignatchenko A. V., Springer M. E., Walker J. D., Brennessel W. W., J. Phys. Chem. C 2021, 125, 3368–3384. [Google Scholar]
- 29.Wang S., Iglesia E., J. Phys. Chem. C 2017, 121, 18030–18046. [Google Scholar]
- 30.Rotzinger F. P., Kesselman-Truttmann J. M., Hug S. J., Shklover V., Grätzel M., J. Phys. Chem. B 2004, 108, 5004–5017. [Google Scholar]
- 31.McGill P. R., Idriss H., Surf. Sci. 2008, 602, 3688–3695. [Google Scholar]
- 32.Vittadini A., Selloni A., Rotzinger F. P., Grätzel M., J. Phys. Chem. B 2000, 104, 1300–1306. [Google Scholar]
- 33.Mattsson A., Österlund L., J. Phys. Chem. C 2010, 114, 14121–14132. [Google Scholar]
- 34.Luschtinetz R., Gemming S., Seifert G., Eur. Phys. J. Plus 2011, 126, 98, 1–13. [Google Scholar]
- 35.Li W. K., Gong X. Q., Lu G., Selloni A., J. Phys. Chem. C 2008, 112, 6594–6596. [Google Scholar]
- 36.Ojamäe L., Aulin C., Pedersen H., Käll P. O., J. Colloid Interface Sci. 2006, 296, 71–78. [DOI] [PubMed] [Google Scholar]
- 37.Gutiérrez-Sosa A., Martínez-Escolano P., Raza H., Lindsay R., Wincott P. L., Thornton G., Surf. Sci. 2001, 471, 163–169. [Google Scholar]
- 38.Onishi H., Yamaguchi Y., Fukui K. I., Iwasawa Y., J. Phys. Chem. 1996, 100, 9582–9584. [Google Scholar]
- 39.Miller K. L., Falconer J. L., Medlin J. W., J. Catal. 2011, 278, 321–328. [Google Scholar]
- 40.Raghunath P., Lin M. C., J. Phys. Chem. C 2008, 112, 22, 8276–8287. [Google Scholar]
- 41.Grinter D. C., Nicotra M., Thornton G., J. Phys. Chem. C 2012, 116, 11643–11651. [Google Scholar]
- 42.Kim K. S., Barteau M. A., Langmuir 1988, 4, 945–953. [Google Scholar]
- 43.Liao L.-F., Lien C.-F., Lin J.-L., Phys. Chem. Chem. Phys. 2001, 3, 3831–3837. [Google Scholar]
- 44.Backes M. J., Lukaski A. C., Muggli D. S., Appl. Catal. B 2005, 61, 21–35. [Google Scholar]
- 45.Pham T. N., Shi D., Sooknoi T., Resasco D. E., J. Catal. 2012, 295, 169–178. [Google Scholar]
- 46.Ignatchenko A. V., J. Phys. Chem. C 2011, 115, 16012–16018. [Google Scholar]
- 47.Calaza F. C., Chen T. L., Mullins D. R., Xu Y., Overbury S. H., Catal. Today 2015, 253, 65–76. [Google Scholar]
- 48.Bayahia H., Kozhevnikova E. F., Kozhevnikov I. V., Appl. Catal. B 2015, 165, 253–259. [Google Scholar]
- 49.Kim K. S., Barteau M. A., J. Catal. 1990, 125, 353–375. [Google Scholar]
- 50.Li J. G., Ishigaki T., Acta Mater. 2004, 52, 5143–5150. [Google Scholar]
- 51.Aranda-Pérez N., Ruiz M. P., Echave J., Faria J., Appl. Catal. A 2017, 531, 106–118. [Google Scholar]
- 52.Thommes M., Kaneko K., Neimark A. V., Olivier J. P., Rodriguez-Reinoso F., Rouquerol J., Sing K. S. W., Pure Appl. Chem. 2015, 87, 1051–1069. [Google Scholar]
- 53.Tompsett G. A., Bowmaker G. A., Cooney R. P., Metson J. B., Rodgers K. A., Seakins J. M., J. Raman Spectrosc. 1995, 26, 57–62. [Google Scholar]
- 54.Weisz P. B., Prater C. D., Adv. Catal. 1954, 6, 143–196. [Google Scholar]
- 55.Oliver-Tomas B., Renz M., Corma A., J. Mol. Catal. A 2016, 415, 1–8. [Google Scholar]
- 56.G. Socrates, Infrared and Raman Characteristic Group Frequencies: Tables and Charts, 3rd ed., Wiley, Hoboken, 2004.
- 57.Gaertner C. A., Serrano-Ruiz J. C., Braden D. J., Dumesic J. A., J. Catal. 2009, 266, 71–78. [Google Scholar]
Associated Data
This section collects any data citations, data availability statements, or supplementary materials included in this article.
Supplementary Materials
As a service to our authors and readers, this journal provides supporting information supplied by the authors. Such materials are peer reviewed and may be re‐organized for online delivery, but are not copy‐edited or typeset. Technical support issues arising from supporting information (other than missing files) should be addressed to the authors.
Supplementary