

Abstract
Introduction:
Clinical reports show a positive correlation between phytosterol concentrations and severity of cholestatic liver disease markers in infants during long-term administration of parenteral lipid emulsions. Establishing a causal link between phytosterols and cholestasis has been complicated by confounding factors of lipid emulsion load, fatty acid composition, and vitamin E in many of these studies.
Aim:
The goal of this study is to determine whether altering the phytosterol concentration within a common soybean oil-based emulsion will alter the onset and severity of cholestasis in parenterally fed preterm piglets.
Methods:
Preterm piglets were administered for 21 days either enteral nutrition (ENT) or parenteral nutrition prepared from a soybean oil-based emulsion containing either 24.0% (depleted, DEP), 100% (Intralipid, normal phytosterol concentration NP), and 144% (enriched, ENR) total phytosterol concentration.
Results:
At the end of the study, plasma and liver phytosterol concentrations were highest in the ENR group followed by NP, then DEP and ENT. Serum direct bilirubin, serum bile acids, and gamma glutamyl transferase was higher in the ENR and NP groups compared either DEP or ENT groups. All PN lipid groups showed evidence of mild hepatic steatosis, but no change in hepatic expression of proinflammatory cytokines or farnesoid X receptor target genes.
Conclusion:
The increase in serum direct bilirubin was lower in the depleted group vs. the lipid emulsions with normal or enriched phytosterols. Our results provide additional evidence that phytosterols are linked to an increase in serum markers of cholestasis in preterm PN-fed pigs.
Keywords: Soybean oil, phytosterols, total parenteral nutrition, bile salt export pump, bile acids, parenteral nutrition associated cholestasis
Introduction
Parenteral nutrition is an important nutritional intervention administered to preterm infants after birth. In most infants, PN is short-term and transition to enteral feeding occurs with minimal complications. However, in some infants, long-term PN support is required when gastrointestinal complications occur that impair sufficient absorption of enterally administered nutrients.1 Within this population, the development of parenteral nutrition associated cholestasis (PNAC), defined as plasma conjugated bilirubin concentration ≥ 2 mg/dL (34 μmol/L) may occur in as little as 14 days.2 This disease is characterized by elevated serum bile acids and bilirubin, elevated markers of hepatic and cholangiocyte injury, and hepatic steatosis. Untreated PNAC can progress to steatohepatitis, fibrosis, and in worst cases cirrhosis and end stage liver disease. Phytosterols or plant sterols are naturally occurring in vegetable oils such as corn, sunflower, soybean, and rapeseed oil.3 The amount of phytosterols in commercially available lipid emulsions differs and pure soybean oil-based emulsions, such as Intralipid (Fresenius Kabi, Germany), have the highest content in natural phytosterols. In infants that have developed PNAC, treatment with recently FDA approved Omegaven (Fresenius Kabi, Germany), a pure fish oil-based, n-3 fatty acid enriched, emulsion that contains very low phytosterol concentrations, is effective in reversing indices of cholestasis and reducing the risk of liver disease progression.4, 5
Infants and children accumulate phytosterols in serum when administered parenteral lipid emulsions that contain phytosterols,6-10 especially after extended PN administration (> 2 months).6 Infants who receive lipid emulsions rich in phytosterols, such as soybean oil-based or olive oil-based emulsions, for longer periods experience increased serum markers of cholestasis and liver damage.6, 8, 11-13 Elevated levels of phytosterols have been correlated with a marker of liver damage, alanine amino transferase,8 and a marker of biliary tract damage, gamma glutamyl transferase.9 Indirect results from clinical intervention studies have shown that treating infants that have developed PNAC with a pure fish oil-based emulsion (Omegaven), which contains negligible phytosterols, leads to a regression of steatosis and markers of liver damage.5, 14-17 However, these studies are confounded by lipid load, and the fact that Omegaven also is a rich source of the bioactive n-3 PUFAs and vitamin E, known for their anti-inflammatory and antioxidant effects.18-20 Thus, it is difficult to distinguish the potential benefit of lowering phytosterols from the effects of the n-3 fatty acids and vitamin E.
In piglet and human infant studies, PN administration with either pure fish oil, or a mixed oil-based emulsion containing 30% soybean oil, 30% medium-chain triglycerides (MCT), 25% olive oil, and 15% fish oil (SMOFlipid, Fresenius Kabi, Bad Homburg, Germany) protected piglets from cholestasis, whereas soybean oil-based emulsion (Intralipid) resulted in elevated serum direct bilirubin and bile acids.21-23 In these studies, the mixed-lipid emulsion, containing approximately one-half the phytosterol concentration as the soybean oil-based emulsion24, 25, was just as effective in preventing cholestasis as the pure fish oil-based emulsion, which has a negligible amount of phytosterols. This result suggests that a low dose of phytosterols in the lipid emulsion are not directly associated with development of cholestasis. However, studies in mice given PN containing pure fish oil-based emulsion supplemented with the phytosterol, stigmasterol, demonstrated liver injury similar to that seen in mice receiving soybean oil-based emulsion.26, 27 However, the mice required prior exposure to an intestinal inflammatory insult to create liver injury. These findings indicate that other factors besides the phytosterol content determine the impact of different lipid emulsions on hepatic integrity and function. There are large differences in the lipid composition between soybean oil-based emulsion (predominance of n-6 fatty acids), mixed-lipid emulsions (mix of saturated, monounsaturated, n-3, and n-6 fatty acids), and pure fish oil-based emulsion (predominance of n-3 fatty acids). Thus, an effect of the differential fatty acid composition of the emulsions regarding n-6 and n-3 fatty acid contents cannot be ruled out. Furthermore, the amount of added vitamin E is substantially higher in fish oil and mixed oil-based emulsions compared to soybean oil-based emulsions. Thus, it remains unclear which component exerts the greatest influence on the hepatotoxic properties of a lipid emulsion. Therefore, it is vital to test the effect of varying the phytosterol content in a single lipid emulsion to determine the impact of phytosterols on the development of PNAC without confounding differences in fatty acid composition and vitamin E content. Thus, the objective of this study is to determine whether a varied phytosterol content in a common soybean oil-based emulsion (Intralipid), directly associates with serum and hepatic markers of PNAC development after prolonged administration.
Materials and Methods
Animal and Study Design
All experiments were approved and conducted in accordance with the guidelines of the Animal Care and Use Committee and the Guide for the Care and Use of Laboratory Animals. Piglets were delivered via cesarean section 7 days preterm (day 107 gestation) as described previously.21 Immediately following delivery all piglets were implanted with a jugular catheter and piglets receiving enteral feeding additionally were implanted with an orogastric tube. Piglets were randomly assigned to four treatment groups. Piglets received either enteral (ENT) feeding or one of three parenteral treatments. The macronutrient intake during full PN intake was 25 g/(kg·d) glucose, 13 g/(kg·d) amino acids, 5.0 g/(kg·d) lipid. The enteral formula group was fed a milk-based formula (Litter Life; Merrick, Middletown, WI). The three PN groups of pigs received a soybean oil-based emulsion (Intralipid 20% lipid emulsion; Fresenius Kabi, Germany) formulated to contain variable amounts of phytosterols including a phytosterol depleted (DEP; 24.0% phytosterol), normal phytosterol (NP; 100% phytosterol), and phytosterol enriched (ENR; 144% phytosterol) Intralipid for the duration of the 21-d study (Table 1). Lipid emulsions were administered via a syringe pump and the glucose, amino acid, mineral, and vitamin solution (GAMVS) was administered via a peristaltic perfusion pump on continuous flow. Immediately above the catheter attachment site, a y-connector was used to merge lipid emulsion and GAMVS. The lipid emulsion preparations were provided by Fresenius Kabi. The DEP group had phytosterols extracted from the soybean oil-based emulsion using a proprietary method. The NP group was standard soybean oil-based emulsion without modification. The ENR group is soybean oil-based emulsion that was enriched with the phytosterol fraction removed from the DEP group. The DEP, NP and ENR emulsions were confirmed to meet the USP 729 standards for droplet size and endoxtoxin free by Fresenius Kabi. Samples were analyzed to confirm the depletion of phytosterols and measure the fatty acid and vitamin E composition of the lipid emulsions. Primary outcomes to be analyzed for the study were serum markers of cholestasis including direct bilirubin, GGT, aminotransaminases, and serum bile acids. Secondary measures for the study were to examine histological indices of liver injury and hepatic lipid accumulation.
Table 1.
Lipid emulsion sterol, fatty acid and vitamin E composition.
| DEP | NP | ENR | |
|---|---|---|---|
| Phytosterols, μmol/L | |||
| β-sitosterol | 183.3 ± 3.17 | 684.8 ± 0.07 | 964.5 ± 12.06 |
| Campesterol | 29.9 ± 0.55 | 222.1 ± 0.04 | 409.3 ± 4.59 |
| Stigmasterol | 19.4 ± 0.62 | 210.8 ± 0.02 | 351.4 ± 4.89 |
| Δ7-Stigmastenol | 33.8 ± 2.79 | 45.8 ± 0.20 | 36.2 ± 4.72 |
| Sitostanol | 7.2 ± 0.26 | 19.2 ± 0.01 | 28.8 ± 0.45 |
| Δ7-Avenasterol | 17.0 ± 0.65 | 26.7 ± 0.02 | 9.7 ± 2.91 |
| Δ5-Avenasterol | 7.3 ± 0.06 | 19.4 ± 0.01 | 14.5 ± 0.42 |
| Δ5.24-Stigmastadienol | 4.9 ± 0.05 | 17.0 ± 0.02 | 17.0 ± 3.16 |
| Campestanol | nd | 7.4 ± 0.02 | 12.4 ± 0.01 |
| Δ7-Campesterol | 2.5 ± 0.57 | 15.0 ± 0.03 | nd |
| Clerosterol | 2.4± 0.46 | 9.7 ± 0.23 | nd |
| Brasicasterol | nd | 2.5 ± 0.01 | nd |
| Total phytosterols | 307.6 ± 0.37 | 1280.4 ± 0.13 | 1843.8 ± 27.50 |
| Cholesterol, μmol/L | 902 ± 10.5 | 955 ± 13.7 | 999 ± 18.1 |
| Fatty acids, g/100g | |||
| Palmitic, C16:0 | 2.46 ± 0.12 | 2.47 ± 0.09 | 2.56 ± 0.10 |
| Stearic, C18:0 | 0.58 ± 0.03 | 0.59 ± 0.02 | 0.60 ± 0.02 |
| Oleic, C18:1 | 5.61 ± 0.21 | 5.47 ± 0.15 | 5.60 ± 0.18 |
| Linoleic, C18:2 | 9.41 ± 0.32 | 10.1 ± 0.25 | 9.46 ± 0.30 |
| Linolenic, C18:3 | 1.82 ± 0.12 | 1.68 ± 0.09 | 1.87 ± 0.15 |
| Vitamin E, μg/g | |||
| α-tocopherol | 0.24 ± 0.03 | 19.5 ± 0.15 | 36.9 ± 0.26 |
| β-tocopherol | 0.13 ± 0.01 | 2.00 ± 0.15 | 2.79 ± 2.55 |
| γ-tocopherol | 0.46 ± 0.02 | 82.1 ± 1.03 | 153 ± 4.26 |
| δ-tocopherol | 0.18 ± 0.02 | 33.4 ± 0.96 | 57.0 ± 1.17 |
Mean ± SEM
Phytosterol and Cholesterol Analysis
Quantitation of phytosterols (β-sitosterol, stigmasterol, campesterol) in the plasma and liver and cholesterol in the emulsions were performed using liquid chromatography tandem mass spectrometry (LC-MS/MS) as described previously22. The phytosterol concentration in the lipid emulsions supplied by Fresenius Kabi were quantified in their facilities as described in detail in the supplementary methods section.
Fatty Acid and Vitamin E Analysis
Pooled samples from the same manufactured batch of each lipid emulsion were used to determine the concentration of fatty acids in the DEP, NP, and ENR groups. Analysis of fatty acid composition was performed using GC-MS as described previously.28 Similarly, these pooled samples from each lipid emulsion were analyzed for the four tocopherol forms of vitamin E (α-, β-, δ-, γ-tocopherol) as described previously.29, 30 The tocotrienol forms of vitamin E were not analyzed for this study.
Serum Chemistry
Blood samples were collected and serum was analyzed on a Roche-Cobas 6000 analyzer as described in detail previously.31
Total Bile Acid Quantitation
To determine total bile acids, a commercially available kit was used according to manufacturer’s protocol (GenWay Biotech, San Diego, CA) as described previously.21 For liver, bile, and small intestine samples, the sample was homogenized in ethanol and the supernatant used for bile acid quantitation. Bile acid pools were calculated as described previously.21
Bile Acid Metabolism Gene Expression
Liver tissue was assayed by qRT-PCR for mRNA of FXR and its target genes involved in bile acid homeostasis including BSEP, sterol transporters, ABCG5/G8, and inflammatory gene, IL-1β as described previously.21
FGF-19 Assay
A commercially available kit was used according to manufacturer’s protocol on plasma samples as described previously.30
Histology
On study day 21, liver tissue was dissected from the left lobe and fixed in formalin for later H&E staining and OCT for oil red O staining. H&E stained sections were examined by a blinded pathologist from Fresenius Kabi and Baylor College of Medicine and scored for indices of injury (Table S1).21
Statistics
All values are graphically presented as mean ± SEM and the individual pig values are included in figures. The final day samples were analyzed by one-way ANOVA and differences detected due to treatment were tested for significance using Tukey’s post-hoc analysis. The variables measured over time (day 1-21) were analyzed using repeated measures two-way ANOVA with treatment and time of sampling as fixed effects. Differences detected due to treatment were tested for significance using Tukey’s post-hoc analysis. In addition to ANOVA analysis, regression analysis to model the best fit relationship between the serum chemistry variables (bilirubin and total bile acids) as dependent variables and both the daily phytosterol dose infused and the measured plasma phytosterol concentration (as independent variables) was calculated. Data from liver histology score were analyzed by Kruskal Wallis for ordinal score data. A p-value of < 0.05 was considered significant for all tests performed. Statistical analyses were performed using Minitab and GraphPad software packages. The pigs that died prior to day 21 were excluded from the final day analysis of liver tissue given that serum chemistry markers suggested that the severity of cholestasis increased progressively, especially in the last week of the 21 day study. We also excluded the serum chemistry measurements of piglets that died before day 21; however, our analysis of the serum samples on day 7 and day 14 from the excluded piglets indicated that their values were within the range of those piglets that were included in the final results.
Results
Lipid Emulsion Composition
The lipid emulsion extraction process led to a reduction of total phytosterols in the DEP group to 308 μM, which is 24.0% of the phytosterol concentration of the NP emulsion (1280 μM) (Table 1). The enriched group contains 144% (1844 μM) the phytosterol concentration of the NP emulsion. The removal of phytosterols did not alter the cholesterol concentration, nor the fatty acid composition, of the lipid emulsions between any groups. However, there was a substantial reduction (>90%) in the tocopherol forms of vitamin E (α-, β-, δ-, γ-tocopherol) in the DEP emulsion compared to the NP emulsion and an increase (>130%) in the ENR emulsion compared to the NP emulsion.
Survival, Weight Gain and Tissue Size
There was a decreased survival rate in piglets receiving the modified lipid emulsions DEP (6/14) and ENR (5/15) compared to either ENT (9/10) or NP (8/11) treatment groups (Table S2). In the surviving piglets, those that received DEP (48.7 ± 1.16 g/(kg·d)) PN had similar growth rates of the ENT (51.2 ± 0.85 g/(kg·d)) group. The NP (43.9 ± 1.15 g/(kg·d)) and ENR (43.9 ± 1.15 g/(kg·d)) groups had a significantly reduced growth rate over the 21 days compared to either DEP or ENT groups. Consistent with prior PN studies in piglets, the liver and lungs weights were significantly higher in the NP than ENT group. A similar significant increase in lung weight occurred in both DEP and ENR compared to ENT. All PN groups had significantly reduced intestine weight compared to the ENT group.
Phytosterols
The phytosterol contents of plasma collected at four time points, and liver tissue and bile that was collected in pigs at the end of the 21-day study are shown in Table 2 and Figure 1. There was a significant main effect of both treatment (P < 0.001) and time (P < 0.001) from the administration of phytosterols in the plasma phytosterol concentration. There was also significant (P < 0.001) interaction between phytosterol treatment and time over the 21-day period. The liver and bile pool size are shown as the product of either phytosterol concentration and the liver size (g/kg body weight) or bile volume collected from the gallbladder (ml/kg body weight). Consistent with the dose of phytosterol administered in the lipid emulsion, the total phytosterol content in the liver tissue was significantly higher in the NP (4.38 ± 0.63 nmol/kg bw) and ENR (7.87 ± 0.56 nmol/kg bw) groups than in the ENT (0.74 ± 0.04 nmol/kg bw) or DEP (1.43 ± 0.12 nmol/kg bw) groups. The total phytosterol content in bile was also significantly higher in the ENR group compared to all other groups.
Table 2.
Plasma, liver, and bile phytosterols
| ENT | DEP | NP | ENR | |
|---|---|---|---|---|
| Plasma Phytosterols (μmol/L) | ||||
| β-sitosterol | 2.58 ± 0.33 | 8.57 ± 1.53 | 34.6 ± 3.06bd | 61.0 ± 8.18cef |
| stigmasterol | 1.20 ± 0.13 | 0.94 ± 0.12 | 6.85 ± 0.60bd | 13.4 ± 1.56cef |
| campesterol | 4.40 ± 0.47 | 1.74 ± 0.22a | 8.75 ± 0.60bd | 13.9 ± 2.02cef |
| Combined phytosterol† | 8.17 ± 0.92 | 11.2 ± 1.86 | 50.2 ± 4.20bd | 88.3 ± 11.6cef |
| Liver Phytosterols (nmol/kg bw) | ||||
| β-sitosterol | 0.25 ± 0.01 | 0.59 ± 0.12 | 2.97 ± 0.38bd | 4.91 ± 0.42cef |
| stigmasterol | 0.25 ± 0.01 | 0.32 ± 0.02 | 0.59 ± 0.10bd | 1.43 ± 0.10cef |
| campesterol | 0.25 ± 0.01 | 0.59 ± 0.02 | 0.81 ± 0.18bd | 1.53 ± 0.13cef |
| Combined phytosterol† | 0.74 ± 0.04 | 1.43 ± 0.12 | 4.38 ± 0.63bd | 7.87 ± 0.56cef |
| Bile Phytosterols (μmol/kg bw) | ||||
| β-sitosterol | 7.97 ± 2.61 | 67.4 ± 32.7 | 53.6 ± 20.9 | 232 ± 62.0cef |
| stigmasterol | 33.5 ± 13.0 | 46.6 ± 10.7 | 48.0 ± 14.5 | 260 ± 62.4cef |
| campesterol | 8.16 ± 3.35 | 9.53 ± 5.38 | 8.48 ± 3.54 | 29.1 ± 8.86cf |
| Combined phytosterol† | 49.6 ± 18.9 | 123 ± 48.5 | 110 ± 38.0 | 521 ± 130cef |
Represents the combined values of β-sitosterol, campesterol, and stigmasterol
P<0.05 ENT vs. DEP
P<0.05 ENT vs. NP
P<0.05 ENT vs. ENR
P<0.05 DEP vs. NP
P<0.05 DEP vs. ENR
P<0.05 NP vs. ENR; Mean ± SEM
Figure 1.

Plasma and liver tissue phytosterol content in piglet during the 21-day study. Plasma total phytosterol concentrations in each treatment group during the 21-day study (top panel). Liver tissue total phytosterol content at the end of the 21-day study period. Values are expressed as mean ± S.E.M and as individual piglet values. Statistical analysis performed was repeated measures two-way ANOVA with post-hoc pairwise comparisons using Tukey’s test. Main effects of treatment (P<0.001), day (P<0.001), and treatment x day (P<0.001) were significant. aP<0.05 ENT vs. DEP; bP<0.05 ENT vs. NP; cP<0.05 ENT vs. ENR; dP<0.05 DEP vs. NP; eP<0.05 DEP vs. ENR; ENT, enteral, DEP, depleted; NP, Intralipid; ENR, enriched.
Cholestasis Markers
Serum chemistry values at the end of day 21 are presented in Figure 2 and for days 7-21 in Figure S1. There was a significant main effect of treatment (P < 0.001) and time (P < 0.001) on the clinical marker of cholestasis, direct bilirubin, with a strong interaction (P < 0.001) between time and treatment over the 21-day study. On day 21, serum direct bilirubin is significantly increased in the NP (1.39 ± 0.22 mg/dL) and ENR (1.61 ± 0.38 mg/dL) groups compared to both ENT (0.01 ± 0.001 mg/dL) and DEP (0.35 ± 0.03 mg/dL) treatment groups. The direct bilirubin concentrations did not differ in DEP and ENT piglets. Cholangiocyte injury as measured by serum GGT was elevated significantly as an effect of treatment (P = 0.034) and time (P < 0.001) with a significant interaction between the effects (P < 0.001). On day 21, there was a significant increase in NP (173 ± 54.6 U/L) and ENR (244 ± 133 U/L) groups compared to the ENT (51.7 ± 3.11 U/L). The mean GGT concentration in the DEP (51.7 ± 3.11 U/L) group was lower than in other PN groups, yet there was no statistical difference between DEP and the NP or ENR groups. There were significant positive correlations between both serum direct bilirubin (P < 0.001, R2 = 0.557), and GGT (P < 0.001, R2 = 0.409) and plasma phytosterol concentrations (Figure 2); also serum alkaline phosphatase and aspartate aminotransferase were significantly correlated with plasma phytosterol concentrations (data not shown). There was limited change in markers of liver injury between groups. AST had a small, but significant increase in the NP group compared to ENT; however, the ENR groups did not differ among any groups. There was a significant main effect of treatment (P < 0.001) and time (P < 0.001) for cholesterol and serum triglycerides (treatment, P = 0.007; time, P = 0.005), but there was no interaction between treatment and time for either group, (P = 0.336 and P = 0.795, respectively) (Figure S1).
Figure 2.

Serum markers of cholestasis and hepatic cholangiocyte injury from blood samples taken at end of the 21-day study. Direct bilirubin and GGT in serum shown in each treatment group (top panel) and correlated with plasma phytosterol concentrations (bottom panels). Values are expressed as mean ± S.E.M and as individual piglet values. Statistical analysis performed was one-way ANOVA with post-hoc pairwise comparisons using Tukey’s test. aP<0.05 ENT vs. DEP; bP<0.05 ENT vs. NP; cP<0.05 ENT vs. ENR; dP<0.05 DEP vs. NP; eP<0.05 DEP vs. ENR; ENT, enteral, DEP, depleted; NP, Intralipid; ENR, enriched; GGT, gamma glutamyl transferase.
Bile Acid Pools
The bile acid pool was altered by the administration of phytosterol containing lipid emulsions in PN (Figure 3). There was a significant increase in plasma bile acids in both the NP (43.8 ± 3.31 μM) and ENR (35.0 ± 1.69 μM) groups compared to the ENT (4.15 ± 0.64 μM) and DEP (7.03 ± 1.91 μM) groups. There was a significant difference in plasma bile acids between NP and ENR groups, though unexpectedly, the ENR group had lower plasma bile acids compared to the NP group. The ENR (18.3 ± 2.54 μmol/kg) group accumulated significantly more hepatic bile acids than any other group (ENT, 9.86 ± 1.75 μmol/kg; DEP, 9.37 ± 1.92 μmol/kg; NP, 15.36 ± 1.85 μmol/kg). The other phytosterol containing groups had hepatic bile acids comparable to the ENT group. There was significantly reduced bile flow into the gall bladder in the ENR (4.77 ± 1.79 μmol/kg) group compared to the ENT (25.1 ± 5.14 μmol/kg) group. The bile flow trended to be reduced in the DEP (12.3 ± 3.11 μmol/kg) an NP (15.5 ± 4.26 μmol/kg) groups, but not significantly compared to the ENT fed piglets. The bile flow into the small intestine was significantly reduced in the NP (0.62 ± 0.60 μmol/kg) and ENR (0.30 ± 0.05 μmol/kg) groups compared to the ENT (4.38 ± 0.78 μmol/kg) group. The DEP (2.12 ± 0.58 μmol/kg) group had moderate bile flow into the small intestine in between the ENT and other phytosterol groups. There were significant correlations between both plasma (P < 0.001, R2 = 0.594) and liver (P = 0.002, R2 = 0.302) bile acid concentrations and plasma phytosterols.
Figure 3.

Plasma, liver, gall bladder, and small intestine bile acid pools after the 21-day study (panel A). Correlation between plasma and liver bile acids and plasma phytosterol concentrations (panel B). Values are expressed as mean ± S.E.M and as individual piglet values. Statistical analysis performed was one-way ANOVA with post-hoc pairwise comparisons using Tukey’s test. aP<0.05 ENT vs. DEP; bP<0.05 ENT vs. NP; cP<0.05 ENT vs. ENR; dP<0.05 DEP vs. NP; eP<0.05 DEP vs. ENR; fP<0.05 NP vs. ENR; ENT, enteral, DEP, depleted; NP, Intralipid; ENR, enriched;
Liver Histopathology
The piglets receiving PN showed an increase in hepatic lipid accumulation relative to ENT fed piglets (Figure 4A). In general, the histopathology scoring showed a PN dependent effect on the liver. Single cell necrosis, vacuolization, and mixed infiltrate foci scores were all significantly increased in the DEP, NP, and ENR groups compared to ENT piglets (Figure 4B, Table S3). Mononuclear infiltrate foci decreased as phytosterol concentration increased, with significantly fewer observations in the ENR (1.2 ± 0.4) group compared to ENT (2.1 ± 0.6). Hyperplasia of oval cells was significantly increased in the NP (1.9 ± 0.4) and ENR (2.6 ± 0.5) groups, with DEP (1.7 ± 0.5) having an elevated score, but not significantly different than ENT (0.4 ± 0.5). There was a small decrease in glycogen deposition in all PN groups compared to ENT.
Figure 4.

Hepatic lipid accumulation and histopathology scoring. (A) Oil red O staining of liver and quantification of lipid accumulation by percent coverage of oil red O stain. (B) Heat map of hepatic histopathology scores. ENT, enteral, DEP, depleted; NP, Intralipid; ENR, enriched;
Hepatic Gene Expression
The pathogenesis of cholestasis during prolonged PN is not fully understood. We examined gene targets that regulate bile acid synthesis and transport, as well as, inflammatory mediators in the liver. The gene expression of the key regulator of bile acid homeostasis in the liver, FXR, did not differ between any groups (Figure 5A). Neither did the hepatic expression of FXR downstream target genes, Fgf19 and Shp. However, we did observe serum FGF19 was significantly reduced in the ENR (2.83 ± 0.61-fold) group compared to the ENT (9.24 ± 1.23-fold) and DEP (9.6 ± 1.33-fold) groups (Figure 5F). There was a significant reduction in gene expression of the bile acid import transport gene, Ntcp in both the DEP (0.52 ± 0.09-fold) and NP (0.56 ± 0.08-fold) groups, and trended towards reduction in the ENR (0.68 ± 0.17-fold) compared to the ENT (1.00 ± 0.10-fold) group, suggesting a PN-dependent effect on Ntcp expression (Figure 5B). The bile acid exporter into the systemic circulation, Organic solute transporter (Ost)-α was significantly increased in the NP (8.76 ± 2.62-fold) group compared to both ENT (1.00 ± 0.15-fold) and DEP (2.27 ± 0.53-fold). Multidrug resistance transporter 3, Mrp3, which typically acts as a xenobiotic efflux transporter, was significantly reduced in the DEP (0.59 ± 0.07-fold) and NP (0.53 ± 0.05-fold) groups and trended towards lower expression in the ENR (0.61 ± 0.06-fold) group compared to ENT (1.00 ± 0.14-fold). The other bile acid and phospholipid associated transporters in the liver were not different among any groups. Likewise, there was no change in the phytosterol-specific transporters, ATP binding cassette subfamily G member 5/8 (Abcg5/8) (Figure 5C). With regard to the synthesis of bile acids, the rate limiting enzyme Cyp7a1 gene expression was significantly reduced in DEP (0.04 ± 0.001-fold) and NP (0.29 ± 0.10-fold) groups compared to the ENT (1.00 ± 0.24-fold) (Figure 5D). Again, there is a PN-dominant effect as ENR (0.35 ± 0.19-fold) piglets also trended towards reduced expression as well. Though, this effect was not observed in Cyp8b1, which also functions in the bile acid synthesis pathway. Hepatic inflammation as assessed by the expression of cytokines Il-1β and Il-6 did not differ between any groups (Figure 5E).
Figure 5.
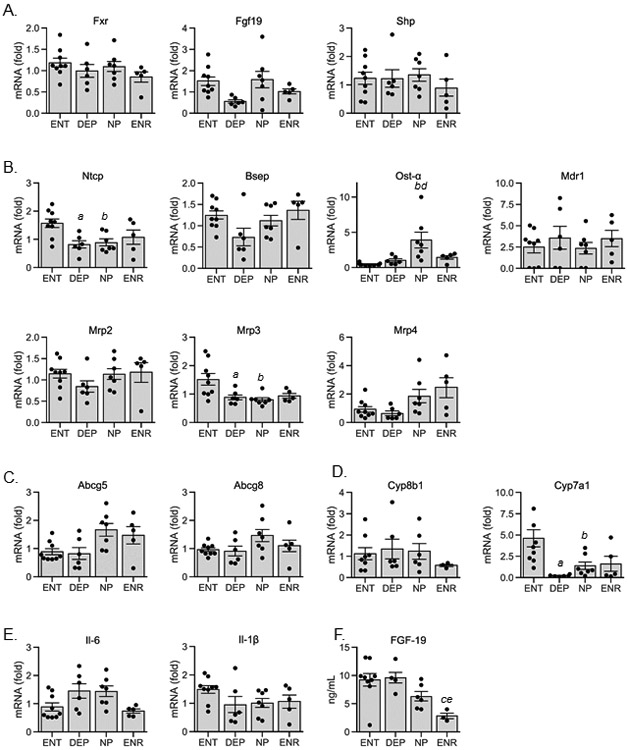
Hepatic gene expression and serum FGF-19 concentration. (A) bile acid synthesis regulatory genes: FXR, farnesoid x receptor; FGF19, fibroblast growth factor 19; SHP, small heterodimer partner; (B) bile acid transport genes: NTCP, sodium taurocholate co-transporting polypeptide; BSEP, bile salt export pump; OST-α, organic solute transporter; MDR1, multi-drug resistance 1; MRP2/3/4, multi-drug resistance-associated protein 2/3/4; (C) phytosterol transport genes: ABCG5/8, ATP-binding cassette transporter G5/8; (D) bile acid synthesis genes: CYP8B1/7A1, Cytochrome P450 8B1/7A1; (E) pro-inflammatory cytokine genes: IL-6/1β, interleukin-6/1β; (F) serum FGF-19. Values are expressed as mean ± S.E.M and as individual piglet values. Statistical analysis performed was one-way ANOVA with post-hoc pairwise comparisons using Tukey’s test. aP<0.05 ENT vs. DEP; bP<0.05 ENT vs. NP; cP<0.05 ENT vs. ENR; dP<0.05 DEP vs. NP; eP<0.05 DEP vs. ENR; fP<0.05 NP vs. ENR; ENT, enteral, DEP, depleted; NP, Intralipid; ENR, enriched.
Discussion
The goal of this study was to determine whether different amounts of phytosterols present in soybean oil-based emulsions are directly associated with an increase in serum markers of cholestasis in a well-established preterm piglet model. We aimed to only modify the phytosterol content in a soybean oil-based emulsion and eliminate the confounding effects of the lipid load, fatty acid composition, and vitamin E content. The analyses of the three lipid emulsions show that we achieved our targeted depletion and enrichment of the phytosterols without changing the fatty acid composition; however, there were differences in vitamin E content among the emulsions. Most importantly, our results show that differences in the daily infusion rates of parenteral phytosterols between the treatment groups directly translated into a positive correlation between circulating plasma and liver phytosterol accumulation and serum markers of cholestasis.
A key clinical endpoint used to diagnose cholestasis and liver injury is increased serum chemistry values for direct bilirubin, bile acids, and liver enzymes including GGT, ALT, AST, and ALP. In the current study, we found that the serum concentrations of direct bilirubin, GGT, and total bile acids progressively increased during the 21-day period and were higher in the NP and ENR groups compared to ENT and DEP piglets at the end of the study. However, there were no histopathological signs of cholestasis in any group. The changes in serum markers of cholestasis with increasing plasma and tissue accumulation of phytosterols were paralleled by increased plasma and liver pool sizes and lower gallbladder pool size of total bile acid. To further examine the direct effect of phytosterols on cholestasis, we calculated correlations between serum markers of cholestasis and liver injury and plasma phytosterol concentrations among piglets in all four treatment groups and found correlations between total bilirubin, direct bilirubin, GGT, ALP and AST with increasing plasma phytosterol concentrations. These results provide novel evidence that increased phytosterol accumulation in plasma and liver tissue directly increased serum markers of cholestasis and cholangiocyte injury.
We aimed to directly assess evidence of histological liver tissue injury after 21 days. The findings suggest that there was not a phytosterol-dependent effect on the liver injury, despite the changes in serum cholestasis markers. We did observe evidence of liver injury marked by steatosis and hepatocellular injury in all three PN groups, which supports a multifactorial cause for progressive liver injury during PN. This finding is consistent with our prior report finding elevated hepatic steatosis and portal infiltration in piglets given soybean oil-based emulsion.21 In that study, mixed oil- and fish oil-based emulsions did not accumulate hepatic lipids, suggesting the high n-6 fatty acid composition of soybean oil-based emulsions may play a role in the observed lipid accumulation. In the current study, the elevated mixed inflammatory infiltrate in all PN treated piglets may also be due to the predominance of n-6 enriched fatty acid composition of the lipid emulsion.
The reduction in phytosterol content in the DEP emulsion did not result in any change in the fatty acid profile or total cholesterol levels. The cholesterol content was added equally to all three emulsions separately as a part of the emulsifying agent, so this result was expected. However, we did not anticipate that all tocopherol forms of vitamin E would be depleted and enriched in the DEP and ENR emulsions, respectively. We previously observed a beneficial effect of α-tocopherol in preventing cholestasis in preterm piglets given a 5 g/(kg·d) daily soybean oil-based lipid load31. However, our recent study 30 and that of Muto el al.32, in term piglets given a relatively higher load (10 g/(kg·d)) of soybean oil-based emulsion found no protective effect of supplemental vitamin E on cholestasis, inflammation, or oxidative stress. The content of added vitamin E, in the form of α-tocopherol, in the soybean oil-based emulsions used in our previous reports were ~120 μg/ml and ~250 μg/ml for the pigs given daily lipid loads of 5 and 10 g/(kg·d), respectively30, 31. These reports in PN fed piglets suggest that there may be a hepatoprotective effect of vitamin E, but this was lost when high lipid loads are given. The hepatoprotective effects of vitamin E and especially the more biologically active α-tocopherol, rather than γ-tocopherol, are well documented in the literature in the context of fatty liver diseases33-35. We also should note that the vitamin E content of SMOFlipid and Omegaven ranges from ~150-250 μg/ml, mainly in the form of α-tocopherol, based on manufactures product specifications and our reports (29, 31). In comparison, in the current study the measured α-tocopherol content was 0.24, 19.5, and 36.9 ug/ml in the DEP, NP, and ENR emulsions, respectively. We posit that based on the evidence that α-tocopherol is hepatoprotective, the unexpected changes in tocopherol content that paralleled those of phytosterols in the different emulsions does not invalidate our finding that phytosterols were positively correlated with serum markers of cholestasis. Furthermore, the results indicate that in spite of parallel changes in the concentrations of hepatoprotective tocopherols and of phytosterols, it is most likely that phytosterols explain the increase in serum markers of cholestasis especially between the DEP and NP groups.
Currently, two mechanism are postulated to drive phytosterol-mediated cholestasis and liver injury. The first mechanism is that phytosterols directly antagonize bile acid homeostasis though disruption of FXR-mediated gene expression. This mechanism was first suggested by Carter et al. using transient transfection assays in immortalized cell lines36 and supported by findings in primary pig hepatocytes.21 In this study, we did not observe any change in direct targets of FXR gene signaling in the liver, including Bsep, the primary bile acid efflux transporter, or Shp, a key inhibitor of bile acid-synthetic genes. We found a reduction in Ntcp in all PN fed piglets, which would suggest there is some compensatory effect to reduce the uptake of bile acids into the liver. The onset of cholestasis and accumulation of hepatic bile acids during PN should trigger suppression of Cyp7a1 and bile acid synthesis. Interestingly, the reduction in Cyp7a1 expression was associated with lower circulating FGF-19 concentrations in the ENR compared to ENT piglets. This suggests that during PN there may be an uncoupling of hepatic signaling pathway whereby increasing intestine-derived circulating FGF19 acts to suppress hepatic Cyp7a1 expression.37 The second mechanism is that phytosterols enhance inflammation in the liver, which leads to liver injury. This pathway has been linked to activation of IL-1β in resident hepatic macrophages, Kupffer Cells.27, 38 However, we did not observe any increase in cytokine gene expression in the liver, which should represent the source of IL-1β activated by phytosterols.
One limitation to our study was the elevated mortality rate of piglets that received the two modified lipid emulsions, DEP and ENR. Based on necropsy reports, there was a high incidence of infection and impaired lung function. In previous studies from our laboratory using the TPN piglet model, we have not observed mortality rates above those seen in the NP group.21, 22, 30, 31, 39, 40 We did not determine the underlying cause of the increased mortality from the modified emulsion. These modified emulsions met USP standards and were determined to be endotoxin free, but we cannot rule out the possibility that the process of phytosterol depletion may have generated chemical compounds in these lipid solutions that in some way were detrimental to health. Given the elevated mortality in these groups, this likely limited our statistical power to detect differences among the treatment groups.
In conclusion, the findings from this preclinical study in an animal model of preterm piglets provide evidence that the amount of phytosterols present in an intravenous soybean oil-based emulsion is directly associated with increased serum markers of cholestasis, namely direct bilirubin, GGT and bile acids. These serum markers of cholestasis were also significantly and directly positively correlated to plasma phytosterol concentrations in piglets. However, there was no histopathological finding of liver tissue injury associated with increased phytosterol content in the lipid emulsions apart from slight hypertrophy of bile ducts and hyperplasia of oval cells. The mechanism to explain the current findings are unclear however, as neither targets of FXR gene expression, nor markers of inflammation were different between the treatment groups. More research into mechanisms using neonatal models of PN are necessary to clarify phytosterol-mediated cholestasis.
Supplementary Material
Clinical Relevancy Statement.
Administration of parenteral nutrition (PN) to infants is a life-saving intervention when enteral feeding is not possible. The long-term administration of PN containing pure soybean oil-based emulsions is suggested as a contributing factor for developing parenteral nutrition associated cholestasis (PNAC) in infants. A potential reason for this effect is that soybean oil-based emulsions contain plant sterols, phytosterols, which may suppress hepatic bile acid homeostasis and bile flow. This study is the first in preterm PN-fed pigs to reduce phytosterols within the same common soybean oil-based emulsion to directly compare whether varying phytosterol concentrations results in changes in cholestatic liver disease. This study provides direct information on the role of phytosterols and how phytosterols may contribute to the development of PNAC.
Acknowledgments
Funding Sources
This work was supported by a research grant from Fresenius Kabi and in part by federal funds from the USDA, Agricultural Research Service under Cooperative Agreement Number 58-6250-6-001, the Texas Medical Center Digestive Diseases Center (NIH Grant P30 DK-56338) and the National Institutes of Health Grant DK-094616 (D.G.B).
Financial disclosure: This work was supported in part by federal funds from the USDA, Agricultural Research Service under Cooperative Agreement Number 3092-51000-060-01 and a grant from Fresenius Kabi.
Footnotes
Conflict of interest: Fresenius Kabi, the manufacturer of soy oil-based emulsions, provided the modified lipid emulsions. In addition, they were involved in the design of the study and the editing and preparation of the manuscript. Fresenius Kabi was involved in histopathology scoring that was confirmed independently by pathologist at Baylor College of Medicine. The authors had final authority on inclusion of data and interpretation of results.
The content is solely the responsibility of the authors and does not necessarily represent the official views of the National Institutes of Health.
References
- 1.Carter BA, Shulman RJ. Mechanisms of disease: update on the molecular etiology and fundamentals of parenteral nutrition associated cholestasis. Nat.Clin.Pract.Gastroenterol.Hepatol 2007;4(5):277–287. [DOI] [PubMed] [Google Scholar]
- 2.Christensen RD, Henry E, Wiedmeier SE, Burnett J, Lambert DK. Identifying patients, on the first day of life, at high-risk of developing parenteral nutrition-associated liver disease. J Perinatol. May 2007;27(5):284–290. [DOI] [PubMed] [Google Scholar]
- 3.Ostlund RE Jr. Phytosterols in human nutrition. Annu Rev Nutr. 2002;22:533–549. [DOI] [PubMed] [Google Scholar]
- 4.Gura KM, Duggan CP, Collier SB, et al. Reversal of parenteral nutrition-associated liver disease in two infants with short bowel syndrome using parenteral fish oil: implications for future management. Pediatrics. Jul 2006;118(1):e197–201. [DOI] [PubMed] [Google Scholar]
- 5.Puder M, Valim C, Meisel JA, et al. Parenteral fish oil improves outcomes in patients with parenteral nutrition-associated liver injury. Ann.Surg 2009;250(3):395–402. [DOI] [PMC free article] [PubMed] [Google Scholar]
- 6.Clayton PT, Bowron A, Mills KA, Massoud A, Casteels M, Milla PJ. Phytosterolemia in children with parenteral nutrition-associated cholestatic liver disease. Gastroenterology. 1993;105(6):1806–1813. [DOI] [PubMed] [Google Scholar]
- 7.Pianese P, Salvia G, Campanozzi A, et al. Sterol profiling in red blood cell membranes and plasma of newborns receiving total parenteral nutrition. J Pediatr Gastroenterol Nutr. Nov 2008;47(5):645–651. [DOI] [PubMed] [Google Scholar]
- 8.Kurvinen A, Nissinen MJ, Andersson S, et al. Parenteral plant sterols and intestinal failure-associated liver disease in neonates. J.Pediatr.Gastroenterol.Nutr 2012;54(6):803–811. [DOI] [PubMed] [Google Scholar]
- 9.Kurvinen A, Nissinen MJ, Gylling H, et al. Effects of long-term parenteral nutrition on serum lipids, plant sterols, cholesterol metabolism, and liver histology in pediatric intestinal failure. J.Pediatr.Gastroenterol.Nutr 2011;53(4):440–446. [DOI] [PubMed] [Google Scholar]
- 10.Savini S, D'Ascenzo R, Biagetti C, et al. The effect of 5 intravenous lipid emulsions on plasma phytosterols in preterm infants receiving parenteral nutrition: a randomized clinical trial. Am J Clin Nutr Aug 2013;98(2):312–318. [DOI] [PubMed] [Google Scholar]
- 11.Gura KM, Lee S, Valim C, et al. Safety and efficacy of a fish-oil-based fat emulsion in the treatment of parenteral nutrition-associated liver disease. Pediatrics. 2008;121(3):e678–e686. [DOI] [PubMed] [Google Scholar]
- 12.Mutanen A, Nissinen MJ, Lohi J, Heikkila P, Gylling H, Pakarinen MP. Serum plant sterols, cholestanol, and cholesterol precursors associate with histological liver injury in pediatric onset intestinal failure. Am J Clin Nutr Oct 2014;100(4):1085–1094. [DOI] [PubMed] [Google Scholar]
- 13.Nghiem-Rao TH, Tunc I, Mavis AM, et al. Kinetics of phytosterol metabolism in neonates receiving parenteral nutrition. Pediatr Res. Apr 21 2015. [DOI] [PMC free article] [PubMed] [Google Scholar]
- 14.Nandivada P, Chang MI, Potemkin AK, et al. The natural history of cirrhosis from parenteral nutrition-associated liver disease after resolution of cholestasis with parenteral fish oil therapy. Ann Surg. Jan 2015;261(1):172–179. [DOI] [PMC free article] [PubMed] [Google Scholar]
- 15.Le HD, de Meijer VE, Robinson EM, et al. Parenteral fish-oil-based lipid emulsion improves fatty acid profiles and lipids in parenteral nutrition-dependent children. Am.J.Clin.Nutr 2011;94(3):749–758. [DOI] [PubMed] [Google Scholar]
- 16.Lee SI, Valim C, Johnston P, et al. Impact of fish oil-based lipid emulsion on serum triglyceride, bilirubin, and albumin levels in children with parenteral nutrition-associated liver disease. Pediatr.Res 2009;66(6):698–703. [DOI] [PMC free article] [PubMed] [Google Scholar]
- 17.Diamond IR, Sterescu A, Pencharz PB, Kim JH, Wales PW. Changing the paradigm: omegaven for the treatment of liver failure in pediatric short bowel syndrome. J.Pediatr.Gastroenterol.Nutr. 2009;48(2):209–215. [DOI] [PubMed] [Google Scholar]
- 18.Traber MG. Vitamin E regulatory mechanisms. Annu Rev Nutr. 2007;27:347–362. [DOI] [PubMed] [Google Scholar]
- 19.Traber MG, Frei B, Beckman JS. Vitamin E revisited: do new data validate benefits for chronic disease prevention? Curr Opin Lipidol. Feb 2008;19(1):30–38. [DOI] [PubMed] [Google Scholar]
- 20.Scorletti E, Byrne CD. Omega-3 fatty acids, hepatic lipid metabolism, and nonalcoholic fatty liver disease. Annu Rev Nutr. 2013;33:231–248. [DOI] [PubMed] [Google Scholar]
- 21.Vlaardingerbroek H, Ng K, Stoll B, et al. New generation lipid emulsions prevent PNALD in chronic parenterally fed preterm pigs. J Lipid Res. Mar 2014;55(3):466–477. [DOI] [PMC free article] [PubMed] [Google Scholar]
- 22.Call L, Molina T, Stoll B, et al. Parenteral lipids shape gut bile acid pools and microbiota profiles in the prevention of cholestasis in preterm pigs. J Lipid Res. Jul 2020;61(7):1038–1051. [DOI] [PMC free article] [PubMed] [Google Scholar]
- 23.Isaac DM, Alzaben AS, Mazurak VC, et al. Mixed Lipid, Fish Oil, and Soybean Oil Parenteral Lipids Impact Cholestasis, Hepatic Phytosterol, and Lipid Composition. J Pediatr Gastroenterol Nutr. Jun 2019;68(6):861–867. [DOI] [PubMed] [Google Scholar]
- 24.Cai W, Calder PC, Cury-Boaventura MF, De Waele E, Jakubowski J, Zaloga G. Biological and Clinical Aspects of an Olive Oil-Based Lipid Emulsion-A Review. Nutrients. Jun 15 2018;10(6). [DOI] [PMC free article] [PubMed] [Google Scholar]
- 25.Forchielli ML, Bersani G, Tala S, Grossi G, Puggioli C, Masi M. The spectrum of plant and animal sterols in different oil-derived intravenous emulsions. Lipids. Jan 2010;45(1):63–71. [DOI] [PubMed] [Google Scholar]
- 26.El Kasmi KC, Anderson AL, Devereaux MW, et al. Phytosterols Promote Liver Injury and Kupffer Cell Activation in Parenteral Nutrition-Associated Liver Disease. Sci.Transl.Med. 2013;5(206):206ra137. [DOI] [PMC free article] [PubMed] [Google Scholar]
- 27.El Kasmi KC, Vue PM, Anderson AL, et al. Macrophage-derived IL-1beta/NF-kappaB signaling mediates parenteral nutrition-associated cholestasis. Nat Commun. Apr 11 2018;9(1):1393. [DOI] [PMC free article] [PubMed] [Google Scholar]
- 28.Mohammad MA, Haymond MW. Regulation of lipid synthesis genes and milk fat production in human mammary epithelial cells during secretory activation. Am J Physiol Endocrinol Metab. Sep 15 2013;305(6):E700–716. [DOI] [PMC free article] [PubMed] [Google Scholar]
- 29.Guthrie G, Kulkarni M, Vlaardingerbroek H, et al. Multi-omic profiles of hepatic metabolism in TPN-fed preterm pigs administered new generation lipid emulsions. J Lipid Res. Sep 2016;57(9):1696–1711. [DOI] [PMC free article] [PubMed] [Google Scholar]
- 30.Guthrie G, Stoll B, Chacko S, Lauridsen C, Plat J, Burrin D. Rifampicin, not vitamin E, suppresses parenteral nutrition-associated liver disease development through the pregnane X receptor pathway in piglets. Am J Physiol Gastrointest Liver Physiol. Jan 1 2020;318(1):G41–G52. [DOI] [PMC free article] [PubMed] [Google Scholar]
- 31.Ng K, Stoll B, Chacko S, et al. Vitamin E in New-Generation Lipid Emulsions Protects Against Parenteral Nutrition-Associated Liver Disease in Parenteral Nutrition-Fed Preterm Pigs. JPEN J Parenter Enteral Nutr. Jan 16 2015. [DOI] [PMC free article] [PubMed] [Google Scholar]
- 32.Muto M, Lim D, Soukvilay A, et al. Supplemental Parenteral Vitamin E Into Conventional Soybean Lipid Emulsion Does Not Prevent Parenteral Nutrition-Associated Liver Disease in Full-Term Neonatal Piglets. JPEN J Parenter Enteral Nutr. May 2017;41(4):575–582. [DOI] [PubMed] [Google Scholar]
- 33.Baker MA, Cho BS, Anez-Bustillos L, et al. Fish oil-based injectable lipid emulsions containing medium-chain triglycerides or added alpha-tocopherol offer anti-inflammatory benefits in a murine model of parenteral nutrition-induced liver injury. Am J Clin Nutr. Apr 1 2019;109(4):1038–1050. [DOI] [PMC free article] [PubMed] [Google Scholar]
- 34.Schunck W-H, Fell GL, Anez-Bustillos L, et al. Alpha-tocopherol in intravenous lipid emulsions imparts hepatic protection in a murine model of hepatosteatosis induced by the enteral administration of a parenteral nutrition solution. Plos One. 2019;14(7). [DOI] [PMC free article] [PubMed] [Google Scholar]
- 35.Pacana T, Sanyal AJ. Vitamin E and nonalcoholic fatty liver disease. Curr Opin Clin Nutr Metab Care. Nov 2012;15(6):641–648. [DOI] [PMC free article] [PubMed] [Google Scholar]
- 36.Carter BA, Taylor OA, Prendergast DR, et al. Stigmasterol, a soy lipid-derived phytosterol, is an antagonist of the bile acid nuclear receptor FXR. Pediatr Res. Sep 2007;62(3):301–306. [DOI] [PubMed] [Google Scholar]
- 37.Holt JA, Luo G, Billin AN, et al. Definition of a novel growth factor-dependent signal cascade for the suppression of bile acid biosynthesis. Genes Dev. Jul 1 2003;17(13):1581–1591. [DOI] [PMC free article] [PubMed] [Google Scholar]
- 38.Guthrie G, Tackett B, Stoll B, Martin C, Olutoye O, Burrin DG. Phytosterols Synergize With Endotoxin to Augment Inflammation in Kupffer Cells but Alone Have Limited Direct Effect on Hepatocytes. JPEN J Parenter Enteral Nutr. Jan 2018;42(1):37–48. [DOI] [PMC free article] [PubMed] [Google Scholar]
- 39.Jain AK, Stoll B, Burrin DG, Holst JJ, Moore DD. Enteral bile acid treatment improves parenteral nutrition-related liver disease and intestinal mucosal atrophy in neonatal pigs. Am J Physiol Gastrointest Liver Physiol. Jan 15 2012;302(2):G218–224. [DOI] [PMC free article] [PubMed] [Google Scholar]
- 40.Stoll B, Horst DA, Cui L, et al. Chronic parenteral nutrition induces hepatic inflammation, steatosis, and insulin resistance in neonatal pigs. J Nutr. Dec 2010;140(12):2193–2200. [DOI] [PMC free article] [PubMed] [Google Scholar]
Associated Data
This section collects any data citations, data availability statements, or supplementary materials included in this article.