

Abstract
PERJETA (pertuzumab), administered with Herceptin (trastuzumab), is used in the treatment of human epidermal growth factor receptor 2‐positive breast cancer. Pertuzumab is currently approved with an initial loading dose of 840 mg, followed by a 420‐mg maintenance dose intravenously every 3 weeks. A reloading dose is required if there is a ≥6‐week delay in treatment. In response to the potential treatment disruption due to COVID‐19, the impact of dose delays and alternative dosing regimens on intravenous pertuzumab for human epidermal growth factor receptor 2‐positive breast cancer treatment is presented. Simulations were conducted by using the validated population pharmacokinetic model for pertuzumab, and included (1) 4‐, 6‐, and 9‐week dose delays of the 840 mg/420 mg every 3 weeks dosing regimen and (2) 840 mg/420 mg every 4 weeks and 840 mg every 6 weeks alternative dosing regimens. Simulations were compared with the currently approved pertuzumab dosing regimen. The simulations in 1000 virtual patients showed that a dose reload (840 mg) is required following a dose delay of ≥6 weeks to maintain comparable Ctrough (lowest concentration before the next dose is given) levels to clinical trials. The 840 mg/420 mg every 4 weeks and 840 mg every 6 weeks alternative dosing regimens decrease median steady‐state Ctrough by ≈40% compared with the approved regimen, and <90% of patients will be above the target Ctrough. Thus, the alternative 840 mg/420 mg every 4 weeks and 840 mg every 6 weeks pertuzumab dosing regimens are not recommended. Flexibility for intravenous PERJETA‐based regimens is available with an alternative route of pertuzumab administration (subcutaneous vs intravenous).
Keywords: breast cancer, dosing, HER2, modeling, pertuzumab, population pharmacokinetics
Pertuzumab, approved as PERJETA (injection for intravenous [IV] infusion)1 worldwide and within PHESGO (fixed‐dose combination with trastuzumab for subcutaneous [SC] injection; pertuzumab, trastuzumab, and hyaluronidase‐zzxf)2 in the US and European Union, is a humanized immunoglobulin G1 monoclonal antibody targeting human epidermal growth factor receptor 2 (HER2), which is overexpressed or amplified in 15% to 20% of breast cancers.3 PERJETA is added to Herceptin—both monoclonal antibodies targeting HER2—and chemotherapy to treat patients with HER2‐positive breast cancer across the neoadjuvant,4, 5 adjuvant,6 and metastatic7, 8 treatment settings. PERJETA is approved only when given in combination with Herceptin (and chemotherapy) in patients with HER2‐positive breast cancer, as PERJETA “monotherapy” (ie, without another HER‐2‐targeted agent like trastuzumab, but with chemotherapy) has been shown to be clinically inferior.4 Additionally, no drug–drug interactions (or steric hindrance) between pertuzumab and trastuzumab or between pertuzumab and docetaxel and other chemotherapies have been found, based on previous analyses.9, 10
The pharmacokinetics (PK) of pertuzumab IV have been well characterized across many clinical studies. Pertuzumab PK were first described in 481 patients with a variety of solid tumors from 11 phase 1/2 studies and the pivotal trial in HER2‐positive metastatic breast cancer, CLEOPATRA.11 This population pharmacokinetic (popPK) analysis by Garg et al11 (popPK model) not only characterized pertuzumab PK, but also supported the fixed, non‐weight‐based IV dosing regimen of an 840‐mg loading dose followed by a 420‐mg maintenance dose every 3 weeks (hereafter referred to as 840 mg/420 mg). The popPK model was first used to support the PERJETA IV dosing regimen in CLEOPATRA, and was subsequently successfully validated in both the HER2‐positive neoadjuvant and adjuvant early breast cancer treatment settings in the phase 2 NeoSphere12 and phase 3 APHINITY10 studies, respectively. Thus, the PK of pertuzumab are well characterized by the popPK model and are similar across indications tested.
Preclinical xenograft efficacy models have indicated that the target steady‐state Ctrough (lowest concentration before the next dose is given) for pertuzumab is 20 µg/mL for a maximal suppression of tumor growth.13 Given that pertuzumab is a targeted monoclonal antibody and the maximum tolerated dose was not reached (up to 15 mg/kg tested in single‐ascending‐dose studies), the dose for phase 3 studies (both IV and SC routes) was selected on the basis of achievement of the target pertuzumab steady‐state Ctrough of ≥20 µg/mL in 90% of patients.14
The phase 2 HER2‐positive neoadjuvant early breast cancer study NeoSphere exposure–response analysis indicated no association between pertuzumab IV serum Ctrough concentration and probability of pathologic complete response within the range observed in this study (20∼100 µg/mL), supporting no dose adjustments needed for patients with lower exposure.12 Similar flat exposure–efficacy relationships between invasive disease‐free survival and pertuzumab Ctrough were observed in patients with HER2‐positive adjuvant early breast cancer.10 Finally, pertuzumab PK has been shown to be consistent between patients with early and metastatic breast cancer.10 Therefore, targeting a pertuzumab Ctrough of ≥20 µg/mL in 90% of patients has proven survival benefits across the neoadjuvant, adjuvant, and metastatic HER2‐positive breast cancer treatment settings.15 Consistent with the preclinical xenograft studies, these analyses from clinical trials confirmed that the approved 840 mg/420 mg pertuzumab dosage regimen demonstrated favorable efficacy when 90% of patients had a pertuzumab Ctrough of >20 µg/mL in the treatment of HER2‐positive breast cancer.12
Pertuzumab is also available within a fixed‐dose combination with trastuzumab in an SC formulation, PHESGO. PHESGO was investigated in the phase 3 study FeDeriCa. The primary study end point of FeDeriCa was noninferiority in cycle 7 (ie, predose cycle 8) pertuzumab Ctrough between the SC and IV formulations. Because the approved IV PERJETA regimen is assumed to saturate HER2 receptor binding, an SC pertuzumab formulation with a noninferior steady‐state Ctrough would ensure at least the same degree of target saturation as with IV administration and therefore ensure similar efficacy.15 The feasibility of a pertuzumab SC product relied on the well‐characterized PK across the numerous clinical studies mentioned previously. The specific and saturable interaction of antibodies with their target influences the PK disposition, and once target sites are saturated, linear PK is observed.16 The popPK model for pertuzumab has shown that pertuzumab PK is linear in the range of clinical serum concentrations, indicating that all target sites are saturated at the approved dosing regimens. Based on those data, PHESGO was approved by the US Food and Drug Administration in all PERJETA indications. PHESGO is an attractive alternative to PERJETA during the pandemic since it has a shorter administration time compared with PERJETA and can therefore minimize patient exposure in health care settings. Additionally, for select patients, PHESGO can be administered at home by health care professionals upon chemotherapy cessation, ie, during the adjuvant setting or in the maintenance setting of advanced disease (when only HER2‐targeted therapies are administered).2, 17
The PERJETA label recommends a reloading dose (840 mg) if the dose is delayed by ≥6 weeks (ie, 42 days) from when the last dose was administered (ie, 3 weeks from the missed scheduled dose).1, 2 This recommendation is supported by clinical experience throughout pertuzumab's development.4, 5, 6, 7, 8 However, the impact of dose delays on the PK of pertuzumab has not been shared previously.
Additionally, as the world grapples with the COVID‐19 pandemic, social distancing recommendations and decreases in health care facility capacity are being observed. Given this challenging environment for patients and health care providers, it is critical to evaluate if alternative pertuzumab IV dosing regimens that allow for greater time between cycles can be supported by PK data without compromising outcomes. As the currently approved pertuzumab IV dose and dosing schedule are supported by PK data, PK modeling and simulations can inform the impact of dose delays and be used to explore potential alternative dosing schedules (ie, every 4 weeks or every 6 weeks).
Methods
Population PK Model
The development of the pertuzumab IV popPK model has been described previously.11 The popPK analysis was conducted via nonlinear mixed‐effects modeling with NONMEM (Nonlinear Mixed‐Effect Modeling) software, version 7.1.2 [ICON Development Solutions, Ellicott City, Maryland], using the first‐order conditional estimation method with eta‐epsilon interaction. Natural log‐transformed data were used for modeling. Interindividual variability was modeled as log‐normal distribution. An additive error model on the log‐transformed data was applied. Briefly, the final model, which served as the basis for the simulations presented in this article, is described hereafter. Pertuzumab PK in the 2‐ to 25‐mg/kg dose range was described by a 2‐compartment model with linear (first‐order) elimination, a clearance of 0.235 L/day, a volume of distribution of 3.11 L, and a terminal elimination half‐life of 18 days. Between‐subject variability was modest and normally distributed. Goodness‐of‐fit plots show good agreement between predicted and observed concentrations.11 Baseline serum albumin and lean body weight (LBW) are statistically significant covariates on pertuzumab clearance, while LBW is the statistically significant covariate on central and peripheral volume of distribution. The covariate selection process has been reported previously.11
R Shiny App
A PK/pharmacodynamic R Shiny app (in‐house Shiny server; R Foundation for Statistical Computing, Vienna, Austria) with Mrgsolve as the simulation engine was used for the popPK simulations for pertuzumab. Mrgsolve is an R package for simulation from hierarchical, ordinary differential equation‐based models typically employed in drug development.18 This Shiny app is a wrapper around Mrgsolve and provides a fast, real‐time, and flexible platform for the scenario simulations. The app first loads the model code in Mrgsolve format and then conducts simulations based on app‐simulated or user‐uploaded covariate information and dosing regimen, according to the user‐defined simulation time points. The Mrgsolve code for the pertuzumab popPK model (on file) was validated for the structure and statistical models to match with the simulations from NONMEM. The Shiny app was also validated to ensure the accuracy of the simulation results. The detailed validation process is beyond the scope of this article. Instead, we present the comparisons of the simulated steady‐state exposures (maximum concentration [Cmax], Ctrough) from the app and from the analysis by Garg et al,11 as a validity check (see Results section).
Simulations
The popPK simulations were generated for 1000 patients with the following statistically significant covariates (median [5th‐95th percentile]) based on the patient demographics from clinical studies used in the popPK model:11 LBW, 49.2 kg (38.9‐69.6) and serum albumin 3.9 g/dL (2.9‐4.65). The typical patient was derived as the median of 1000 simulated patients.
The approved pertuzumab IV dosage regimen of an 840‐mg loading dose followed by a 420‐mg maintenance dose every 3 weeks (referred to as base case or 840 mg/420 mg hereafter), dose delays, and alternative dosage regimens were simulated and compared. The doses were simulated as IV infusions given over a 1‐hour duration for the first dose and 30 minutes for all subsequent doses. Time points for pertuzumab PK simulations at each cycle for 6 cycles were matched to the Garg analysis (ie, time 0, 30 minutes, and 90 minutes; and 1, 2, 3, 4, 5, 6, 7, 8, 9, 10, 11, 12, 13, 14, 15, 16, 17, 18, 19, 20, and 21 days), and modified when applicable for dose delays and alternative dosing regimens. Additional time points beyond 21 days were included at the daily interval for each cycle, depending on the length of the cycle for the dose delay or alternative regimens.
Three different scenarios were simulated for dose delays: 4, 6, or 9 weeks, which corresponds to the duration between the 2 dosing intervals where the delay occurred. In all the dosing delay scenarios, the dose delays were assumed to occur at the end of the third dose (the steady state of pertuzumab). The delayed dose (the fourth dose) and the subsequent dose were simulated to be given as 840 mg/420 mg (reload) or as 420 mg (no reload). The alternative dosage regimen simulations included the following: (1) 840 mg × 1 followed by 420 mg every 4 weeks and (2) 840 mg every 6 weeks. The simulations from base case were compared to those from dose delays and alternative dosage regimens.
Exposure Parameters
Exposure parameters (area under the plasma concentration–time curve [AUC], Cmax, Ctrough) were simulated for the dosing scenarios listed above (see Simulations section). The steady‐state Ctrough was estimated at the fourth dose for the 840 mg/420 mg every 3 weeks base case and the alternative every 4 weeks/every 6 weeks dosing regimens. For dose delays, the Ctrough and percentage of patients above the target Ctrough (20 µg/mL) after the third (scheduled) and fourth (delayed) dose were compared to the Ctrough from the corresponding dose for the base case. For all dosing scenarios, Ctrough was simulated as the last concentration before the next dose was given. For alternative dosage regimens, the following exposure parameters were compared to the approved 840 mg/420 mg every 3 weeks dosing regimen: weekly AUC, Cmax, and Ctrough at cycle 1 and steady state.
To compare with the results from the popPK model, the steady‐state exposures (AUC, Cmax, Ctrough) following the base case were simulated by the app using the post hoc individual parameters (data on file), and the 5th‐95th percentile was derived.
Results
Pertuzumab Base Case PK
The model‐predicted exposure parameters of pertuzumab at the currently approved dosage regimen (base case) are shown in Figure 1 and Table 1. The median cycle 1 Ctrough is 50 µg/mL (5th‐95th percentiles, 24‐84 µg/mL), which is slightly above cycle 4 Ctrough (median, 48 µg/mL; 5th‐95th percentiles, 16‐92 µg/mL). The Ctrough is maintained above the target in >90% of patients immediately following the first dose (loading dose). Steady state is achieved for the remaining exposure parameters (AUC from time 0 to the last measurable concentration [AUC0‐τ] and Cmax) after the first maintenance dose (or second dose of therapy). Due to the loading dose (840 mg) at cycle 1, the AUC (median, 1910 µg • d/mL, 5th‐95th percentiles, 1320‐2680 µg • d/mL) and Cmax (median, 258 µg/mL; 5th‐95th percentiles, 177‐363 µg/mL) at cycle 1 is higher compared with cycle 4 (AUC median, 1640 µg • d/mL, 5th‐95th percentiles, 854‐2720 µg • d/mL; Cmax median, 176 µg/mL; 5th‐95th percentiles, 118‐253 µg • d/mL). As a validity check, the 5th‐95th percentile of the steady‐state exposures (Cmax, Ctrough) simulated by the app are well aligned with what were presented by the popPK model (see Table 2). Since AUC0‐τ in the popPK model was derived by dose/clearance and not by integration, only Cmax and Ctrough were compared in Table 2.
Figure 1.
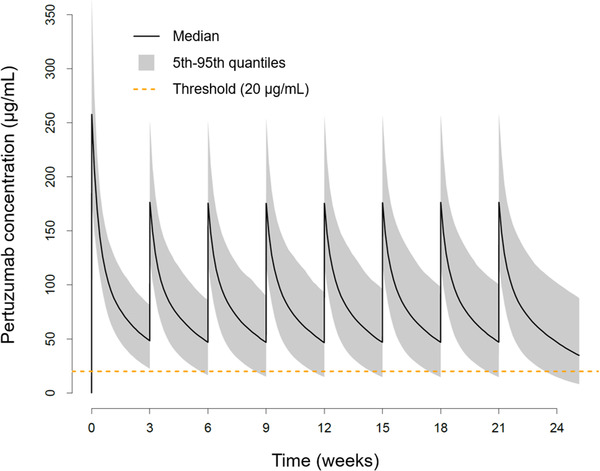
Concentration–time profiles of approved 840 mg/420 mg every 3 weeks (base case) PERJETA IV dosing regimen PK summary statistics in 1000 virtual patients, cycles 1‐8. Threshold represents the Ctrough target (20 µg/mL). Ctrough, lowest concentration before the next dose is given; IV, intravenous; PK, pharmacokinetic.
Table 1.
Approved 840 mg/420 mg Every 3 Weeks (Base Case) Pertuzumab IV Dosing Regimen PK Summary Statistics in 1000 Virtual Patients, Cycles 1‐4
| Cycle | Dose, mg | AUC0‐τ, µg • d/mL | Cmax, µg/mL | Ctrough, µg/mL | % Above Target |
|---|---|---|---|---|---|
| 1 | 840 | 1910 (1320‐2680) | 258 (177‐363) | 50.2 (24.1‐83.5) | 97 |
| 2 | 420 | 1640 (922‐2570) | 176 (122‐251) | 48.6 (17.7‐87.7) | 93 |
| 3 | 420 | 1630 (860‐2620) | 176 (119‐251) | 48.4 (16.2‐92.3) | 91 |
| 4 | 420 | 1640 (854‐2720) | 176 (118‐253) | 48.3 (15.9‐95.3) | 91 |
% above target, percentage of patients with Ctrough above target Ctrough (20 µg/mL); AUC0‐τ, area under the plasma concentration–time curve from time 0 to the last measurable concentration; Cmax, maximum pertuzumab concentration; Ctrough, lowest concentration before the next dose is given; IV, intravenous; PK, pharmacokinetic.
AUC0‐τ, Cmax, and Ctrough shown as median (5th‐95th percentile).
Table 2.
Model Comparisons for the R Shiny App (In‐House Server) Compared to the Garg Model Results
| Model | Cmax | Ctrough |
|---|---|---|
| R Shiny App | 185 (123‐259) | 52.1 (16‐97) |
| Garg model9 | 185 (124‐260) | 52.1 (16‐97) |
Cmax, maximum concentration; Ctrough, lowest concentration before the next dose is given.
Presented as median (5th‐95th percentile). Exposure parameters shown are at cycle 6 of the pertuzumab 840 mg/420 mg every 3 weeks dosing regimen.
Effects of Dose Delays on Pertuzumab Pharmacokinetics
The effects of 4‐, 6‐, and 9‐week dose delays on pertuzumab PK are shown in Figure 2 and Table 3. Assuming patients have taken at least 3 scheduled doses of treatment, the typical patient's (median) Ctrough after the third dose will decrease by 27% compared with base case steady‐state Ctrough following a 4‐week dose delay, and 21% of patients will have a Ctrough that falls below target Ctrough (20 µg/mL). Following a 4‐week dose delay, if a patient is resumed on the 420‐mg dose, the Ctrough (median, 40.3 µg/mL, 5th‐95th percentiles, 13‐85.3 µg/mL) will be within 15% of base case steady‐state Ctrough, and, overall, 87% of patients’ Ctrough will return to target Ctrough (>20 µg/mL) after 1 dose.
Figure 2.
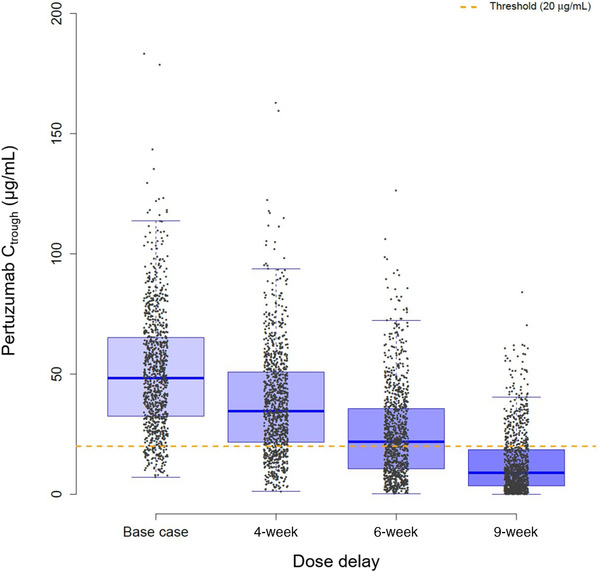
Box plot of cycle 3 Ctrough immediately following 4‐, 6‐, and 9‐week delays in dosing in 1000 virtual patients. Patients were given 3 cycles (840 mg, 420 mg, 420 mg) as scheduled. The third cycle was prolonged for a 4‐, 6‐, and 9‐week delay before the next cycle (fourth) was administered. Threshold represents the Ctrough target (20 µg/mL). Ctrough, lowest concentration before the next dose is given.
Table 3.
Impact of 4‐, 5‐, 6‐, and 9‐Week Dose Delays on Pertuzumab Ctrough and % Above Target in 1000 Virtual Patients
| Dose, mg | Dose Scenario | Ctrough, µg/mL | % Ctrough Diff From Base | % Above Target |
|---|---|---|---|---|
| Cycle 3 | ||||
| 420 | Base case | 48.4 (16.2‐92.3) | 91 | |
| 420 | 4‐week | 34.6 (8.51‐75.8) | −26.7 (−84.5 to 147) | 79 |
| 420 | 6‐week | 21.8 (2.83‐62.5) | −55.3 (−94 to 73) | 54 |
| 420 | 9‐week | 8.99 (0.646‐39.3) | −81.3 (−98.4 to 0.931) | 22 |
| Cycle 4 | ||||
| 420 | Base case | 48.3 (15.9‐95.3) | 91 | |
| 420 | 4‐week | 40.3 (13‐85.3) | −13.6 (−77.2 to 185) | 87 |
| 420 | 6‐week | 36.2 (12.6‐80.2) | −25.8 (−76.8 to 152) | 83 |
| 840 | 6‐week | 61.1 (25.9‐113) | 24.9 (−52.1 to 305) | 99 |
| 420 | 9‐week | 30.1 (13‐63) | −34.2 (−76 to 87.3) | 79 |
| 840 | 9‐week | 54.1 (25.9‐101) | 16.8 (−58.1 to 273) | 98 |
% above target, percentage of patients with Ctrough above target Ctrough (20 µg/mL); Ctrough, lowest concentration before the next dose is given.
Ctrough shown as median (5th‐95th percentile). Patients were given 3 cycles (at steady state) of treatment (840 mg, 420 mg, 420 mg) as scheduled, and received the next (fourth) cycle 4, 5, 6, and 9 weeks from the last administered dose (cycle 3).
Alternatively, the typical patient's cycle 3 Ctrough will decrease by 55% and 81% compared with base case steady‐state Ctrough following a 6‐ and 9‐week dose delay, respectively, while 46% and 78% of patients will have a cycle 3 Ctrough that falls below the target Ctrough due to the delayed fourth dose. After a ≥6‐week dose delay, if the patient is resumed on therapy with a 420‐mg dose, the cycle 4 Ctrough would be >20% lower than base case steady‐state Ctrough after receiving 1 (420‐mg) dose. Following a 6‐ and 9‐week dose delay, only 83% and 79% of patients, respectively, will achieve cycle 4 Ctrough above target after one 420‐mg dose is given. Comparatively, if the patient receives an 840‐mg reload dose following a ≥6‐week dose delay, >90% of patients would be above the target Ctrough, and the typical patient's Ctrough will return to steady‐state Ctrough after a single dose.
Effects of Alternative Dosage Regimen on Pertuzumab PK
The model‐predicted 840 mg/420 mg every 4 weeks and 840 mg every 6 weeks flexible dosing strategies compared to the every 3 weeks base case are shown in Figure 3 and Table 4. In the every 3 weeks, every 4 weeks, and every 6 weeks dosing simulations, the first dose was 840 mg. Since the same dose was given for all 3 dosing schedules at cycle 1, the weekly AUC0‐τ and Ctrough at cycle 1 are lower for the every 4 weeks and every 6 weeks regimens compared with the base case. The cycle 1 Cmax is similar for all 3 dosing schedules. The median cycle 1 Ctrough decreases to 37.1 and 21.9 µg/mL for the every 4 weeks and every 6 weeks dosing regimens compared with the base case (50.2 µg/mL). At steady state, the every 4 weeks regimen has a median Cmax, weekly AUC0‐τ, Ctrough of 15 µg/mL, 404 µg • d/mL, and 29 µg/mL, respectively. Alternatively, the every 6 weeks regimen has a Cmax, weekly AUC0‐τ, Ctrough of 289 µg/mL, 559 µg • d/mL, and 27.5 µg/mL, respectively. The steady‐state Cmax increases by 67% and decreases by 11% in the every 6 weeks and every 4 weeks regimens, respectively, compared with the base case. The steady‐state weekly AUC0‐τ is similar in the every 6 weeks regimen, but decreases by 27% in the every 4 weeks regimen, compared with the base case. Alternatively, the steady‐state Ctrough decreases by 39% and 42% in the every 4 weeks and every 6 weeks regimens, respectively, compared with the base case. The percentage of patients with a steady‐state Ctrough >20 µg/mL at steady state would decrease to 71% and 67% for the every 4 weeks and every 6 weeks regimens, respectively, compared with 90% of patients receiving the base case (Figure 4).
Figure 3.
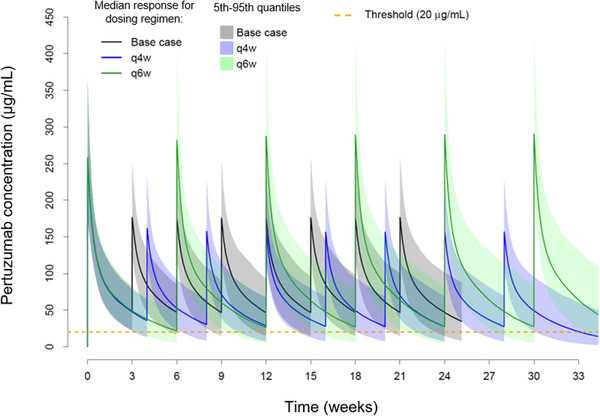
Concentration–time profiles of 840 mg/420 mg every 3 weeks (base case), 840 mg/420 mg every 4 weeks (q4w), and 840 mg every 6 weeks (q6w) pertuzumab IV dosing regimens in 1000 virtual patients. Threshold represents the Ctrough target (20 µg/mL). Ctrough, lowest concentration before the next dose is given; IV, intravenous.
Table 4.
Cycle 1 and Steady‐State PK Summary of “Alternative” 840 mg/420 mg Every 4 Weeks and 840 mg Every 6 Weeks Pertuzumab IV Dosing Regimens in 1000 Virtual Patients
| Cycle | Dose, mg | Dose Scenario | Weekly AUC, µg • d/mL | % Weekly AUC Diff From Base | Cmax, µg/mL | % Weekly Cmax Diff From Base | Ctrough, µg/mL | % Ctrough Diff From Base | % Above Target |
|---|---|---|---|---|---|---|---|---|---|
| 1 | 840 | Base case | 637 (438‐894) | 258 (177‐363) | 50.2 (24.1‐83.5) | 97.2 | |||
| 1 | 840 | Every 4 weeks | 546 (359‐782) | −13.3 (−46.3 to 36.3) | 254 (180‐360) | 0.127 (−33.6 to 52.2) | 37.1 (14.1‐66.4) | −25.6 (−72.8 to 67.4) | 87.5 |
| 1 | 840 | Every 6 weeks | 448 (280‐671) | −29.9 (−57.4 to 11.1) | 257 (184‐369) | 2.43 (−31.4 to 51.4) | 21.9 (5.18‐47.8) | −56 (−89.7 to 9.58) | 56.7 |
| 4 | 420 | Base case | 545 (285‐907) | 176 (118‐253) | 48.3 (15.9‐95.3) | 90.8 | |||
| 4 | 420 | Every 4 weeks | 404 (213‐693) | −25.1 (−64.7 to 58.4) | 157 (109‐227) | −10 (−43.5 to 44.6) | 29 (8.15‐69) | −38.9 (−84.8 to 118) | 69.9 |
| 4 | 840 | Every 6 weeks | 559 (304‐992) | 4.34 (−49.3 to 114) | 289 (204‐419) | 67.2 (10.1 to 154) | 27.5 (5.34‐82) | −42.1 (−88.8 to 144) | 67 |
AUC0‐τ, area under the plasma concentration–time curve from time 0 to the last measurable concentration; Cmax, maximum pertuzumab concentration; Ctrough, lowest concentration before the next dose is given; IV, intravenous; PK, pharmacokinetic.
% above Ctrough target, percentage of patients with Ctrough above target Ctrough (20 µg/mL); AUC0‐τ, Cmax, and Ctrough shown as median (5th‐95th percentile). All dosing regimens receive 840 mg at cycle 1. Steady‐state exposure PK parameters taken at cycle 4. Weekly AUC0–τ, AUC0‐tau divided by number of weeks in treatment cycle.
Figure 4.
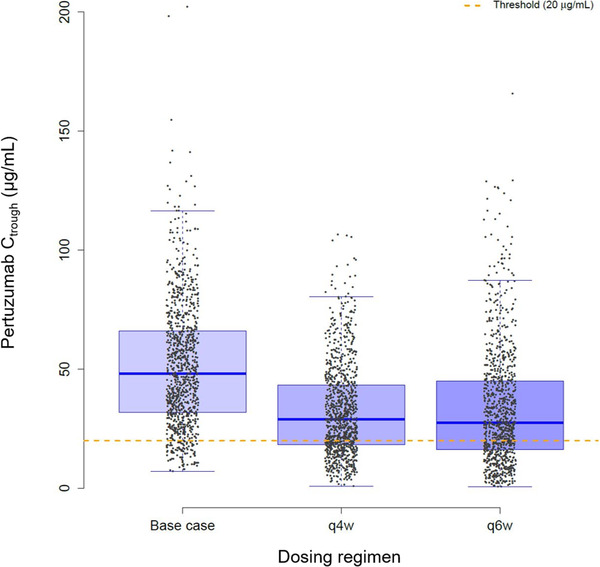
Box plot of steady‐state (cycle 4) Ctrough for 840 mg/420 mg every 3 weeks (base case), 840 mg/420 mg every 4 weeks (q4w), and 840 mg every 6 weeks (q6w) dosing regimens in 1000 virtual patients. Threshold represents the Ctrough target (20 µg/mL). Ctrough, lowest concentration before the next dose is given.
Discussion
To our knowledge, this work is the first to characterize the effects of (1) dose delays and (2) flexible dosage regimens on pertuzumab IV PK based on modeling and simulation. While dose delays can always have a potentially significant impact on patient outcomes, during the current COVID‐19 pandemic, it is of particular importance to understand whether flexible dosage regimens can be an option for patients, as infusion centers and health care systems may be limiting direct patient care and hours of operation.
Since the efficacy of many monoclonal antibodies, including pertuzumab,6 is expected to be driven by maintaining minimum drug concentration above target receptor occupancy saturation, steady‐state Ctrough was the major exposure parameter considered for evaluation. However, there are known limitations of preclinical experiments, and relying on tumor growth inhibition models to determine a clinical target threshold. For pertuzumab, preclinical xenograft efficacy models were used to inform and later justify the clinical dose. While the translatability of preclinical models to patients is not always successful, in the case of pertuzumab, when targeting a particular steady‐state Ctrough in 90% of patients in clinical trials, clinical efficacy was confirmed, which supports the translatability.10, 12 The Ctrough reflects target saturation, and therefore, ensuring that serum levels of pertuzumab remain above the target Ctrough, efficacy will be maintained in patients across indications and routes of administration.
The simulations support a dose reload (840 mg) following a dose delay of ≥6 weeks, which aligns with the US package insert.1 Patients would return to steady‐state Ctrough following a single reload dose (840 mg). Alternatively, if the patient resumes on the 420 mg dose, it would take at least 3 doses after a ≥6‐week dose delay to return to steady‐state Ctrough. For dose delays <6 weeks, patients should receive a 420‐mg maintenance dose as soon as possible. Following this single maintenance dose, patients would return to steady‐state Ctrough.
Alternative dosage regimens with longer time between treatments are appealing, especially for drugs administered intravenously by a health care provider, and it is of particular interest in light of the global COVID‐19 pandemic, as infusion centers and health care systems may be limiting direct patient care and hours of operation. Therefore, simulations of pertuzumab PK following every 4 weeks and every 6 weeks schedules were explored. The alternative dosage regimens of 840 mg every 6 weeks and an 840‐mg loading dose followed by 420 mg every 4 weeks did not show comparable exposure to the approved 840‐mg loading dose and 420‐mg every 3 weeks regimen. In fact, fewer patients were predicted to be above the target Ctrough for the every 4 weeks and every 6 weeks regimens (71% and 67%, respectively) and median steady‐state Ctrough was ≈40% lower in both the every 4 weeks and every 6 weeks regimens compared with the approved 840 mg/420 mg every 3 weeks regimen. While the modeling and simulation approach is based on the PK property, pharmacologic activity and previously established clinical experience of pertuzumab,4, 5, 6, 7, 8, 10, 11, 12 a recognized potential limitation of the current analysis is the lack of clinical data at the dosing scenarios explored. However, based on our analyses, the potential for underexposure and the subsequent compromise to efficacy is considered too great a risk to patients to warrant such clinical investigations.
Since PERJETA is coadministered with Herceptin in the treatment of HER2‐positive breast cancer, it is important to interpret these findings along with the recommendations for Herceptin. The effects of dose delays on trastuzumab PK has been reported previously.19 While it is recommended for pertuzumab to be reloaded with 840 mg following a ≥6‐week dose delay, Herceptin IV (when given as anti‐HER2 monotherapy) is recommended to be reloaded with 8 mg/kg following a ≥4‐week dose delay. It is believed that when 2 HER2‐targeting antibodies are administered, the dose delays and reloading schedules can be more lenient, as it has been well established that pertuzumab in combination with trastuzumab inhibits tumor cell growth more than each does as a single agent.20 Therefore, the schedule of administration defaults to the ≥6 weeks for both antibodies when given in combination. Additionally, PERJETA is efficacious only when coadministered with Herceptin, thereby leading to clear guidance when a treatment setting calls for both antibodies (ie, HER2‐positive breast cancer) vs just one antibody, ie, Herceptin in HER2‐positive gastric cancer. Furthermore, the recommendations for dose delays and reloading for both antibodies are supported by clinical trial experience throughout PERJETA's development.
The analyses presented in this article were conducted for the IV formulation of PERJETA; however, the same principles apply to the SC formulation. The popPK model for SC/IV pertuzumab changed slightly from the IV model with the addition of the Asian region as a covariate. The dose of pertuzumab within the SC fixed‐dose combination product, PHESGO, was selected on the basis of PK (ie, Ctrough) noninferiority to IV pertuzumab.21 The maintenance dose of pertuzumab within PHESGO is 600 mg SC every 3 weeks, and this follows a 1200‐mg SC loading dose.15 If a delay of ≥6 weeks occurs, PHESGO must be reloaded with 1200 mg of pertuzumab SC. As for PERJETA IV studies (CLEOPATRA, NeoSphere, APHINITY, etc), SC PHESGO, evaluated in the global phase 3 trial FeDeriCa, a reloading dose occurred if there was a treatment delay of ≥6 weeks.21
Though treatment flexibility for PERJETA and PHESGO cannot be achieved through alternative dosing regimens from a PK (and thereby efficacy) standpoint, the availability of choice between different routes of administration (SC vs IV) provides a reasonable alternative for flexibility depending on a patient's and treating physician's needs. For instance, the approval of PHESGO in the US has led to an unprecedented outpatient option (that must be administered by a health care professional) for HER2‐targeted therapies in select patients.17 PHESGO is continuing to be evaluated in this setting via an expanded access treatment protocol in the US. The study, where a home health nursing provider administers PHESGO, aims to help continuity of care during the COVID‐19 pandemic for certain patients with HER2‐positive breast cancer who have completed chemotherapy in combination with PERJETA and Herceptin intravenously and are currently receiving or will be receiving maintenance PERJETA and Herceptin alone (regardless of remaining treatment cycles).22
This will undoubtedly free up valuable hospital resources being used to treat patients with COVID‐19 and will keep patients with HER2‐positive breast cancer safer at home by not increasing their risk of exposure. For those patients who are receiving the IV combination of PERJETA and Herceptin, the crossover design of the PhranceSCa study supports the switching to PHESGO in the middle of their treatment course, providing another opportunity for patients to receive a more optimized therapy during the COVID‐19 pandemic.23
In conclusion, our PK modeling and simulations show the impact of 4‐, 6‐, and 9‐week dose delays and alternative 840 mg/420 mg every 4 weeks and 840 mg every 6 weeks dosing regimens on pertuzumab IV PK. The simulations were conducted using the validated popPK model developed for pertuzumab IV.11 The simulations indicate that dose delays >6 weeks decrease the median steady‐state Ctrough to 50% lower than what is observed clinically, and approximately half of the patients would also be below the target Ctrough. Additionally, the simulations show that pertuzumab IV alternative dosage regimens (840 mg/420 mg every 4 weeks and 840 mg every 6 weeks) have 40% lower steady‐state Ctrough compared with the approved 840 mg/420 mg every 3 weeks dosing regimen, and only 60% to 70% of patients would have steady‐state Ctrough levels above the Ctrough target, compared with 90% of patients in the approved 840 mg/420 mg every 3 weeks dosing regimen. Both alternative dosing regimen scenarios pose a risk to patients not achieving adequate and efficacious drug exposures compared with the 840 mg/420 mg every 3 weeks approved dosing regimen and, therefore, potentially compromising clinical outcomes. Thus, it is recommended for PERJETA IV (and SC as PHESGO) to be reloaded following a dose delay of ≥6 weeks, as currently approved, and the alternative 840 mg/420 mg every 4 weeks and 840 mg every 6 weeks dosing regimens are not advised.
Conflicts of Interest
All authors received support for third‐party editing assistance from F. Hoffmann‐La Roche Ltd. S.N.L., T.L., J.Y.J., C.L., F.M., and W.P.K. are employees of Genentech, Inc. and own stock in Roche Holding Ltd. T.B.C., Z.M., and E.R. are employees of F. Hoffmann‐La Roche Ltd and own stock in Roche Holding Ltd.
S.G. is an employee of Gilead and has no other conflicts of interest to disclose.
Funding
This work was funded by F. Hoffmann‐La Roche Ltd.
Data Sharing
Qualified researchers may request access of the dosing simulations from the corresponding author.
Acknowledgments
The authors thank all the patients and investigators for their participation in the clinical studies. Support for third‐party editing assistance for this manuscript, furnished by Alison McGonagle, PhD, of Health Interactions, was provided by F. Hoffmann‐La Roche Ltd.
References
- 1.Perjeta [package insert]. South San Francisco, CA: Genentech, Inc.; 2012. [Google Scholar]
- 2.Phesgo [package insert]. South San Francisco, CA: Genentech, Inc.; 2020. [Google Scholar]
- 3.Wolff AC, Hammond ME, Hicks DG, et al. Recommendations for human epidermal growth factor receptor 2 testing in breast cancer: American Society of Clinical Oncology/College of American Pathologists clinical practice guideline update. J Clin Oncol. 2013;31(31):3997‐4013. [DOI] [PubMed] [Google Scholar]
- 4.Gianni L, Pienkowski T, Im YH, et al. Efficacy and safety of neoadjuvant pertuzumab and trastuzumab in women with locally advanced, inflammatory, or early HER2‐positive breast cancer (NeoSphere): a randomised multicentre, open‐label, phase 2 trial. Lancet Oncol. 2012;13(1):25‐32. [DOI] [PubMed] [Google Scholar]
- 5.Gianni L, Pienkowski T, Im YH, et al. 5‐year analysis of neoadjuvant pertuzumab and trastuzumab in patients with locally advanced, inflammatory, or early‐stage HER2‐positive breast cancer (NeoSphere): a multicentre, open‐label, phase 2 randomised trial. Lancet Oncol. 2016;17(6):791‐800 [DOI] [PubMed] [Google Scholar]
- 6.von Minckwitz G, Procter M, de Azambuja E, et al. Adjuvant pertuzumab and trastuzumab in early HER2‐positive breast cancer [published correction appears in N Engl J Med. 2017 Aug 17;377(7):702] [published correction appears in N Engl J Med. 2018 Oct 18;379(16):1585]. N Engl J Med. 2017;377(2):122‐131. [DOI] [PMC free article] [PubMed] [Google Scholar]
- 7.Baselga J, Cortés J, Kim SB, et al. Pertuzumab plus trastuzumab plus docetaxel for metastatic breast cancer. N Engl J Med. 2012;366(2):109‐119. [DOI] [PMC free article] [PubMed] [Google Scholar]
- 8.Swain SM, Baselga J, Kim SB, et al. Pertuzumab, trastuzumab, and docetaxel in HER2‐positive metastatic breast cancer. N Engl J Med. 2015;372(8):724‐734. [DOI] [PMC free article] [PubMed] [Google Scholar]
- 9.Cortés J, Swain SM, Kudaba I, et al. Absence of pharmacokinetic drug‐drug interaction of pertuzumab with trastuzumab and docetaxel. Anticancer Drugs. 2013;24(10):1084‐1092. [DOI] [PubMed] [Google Scholar]
- 10.Kirschbrown WP, Kågedal M, Wang B, et al. Pharmacokinetic and exploratory exposure‐response analysis of pertuzumab in patients with operable HER2‐positive early breast cancer in the APHINITY study. Cancer Chemother Pharmacol. 2019;83(6):1147‐1158. [DOI] [PMC free article] [PubMed] [Google Scholar]
- 11.Garg A, Quartino A, Li J, et al. Population pharmacokinetic and covariate analysis of pertuzumab, a HER2‐targeted monoclonal antibody, and evaluation of a fixed, non‐weight‐based dose in patients with a variety of solid tumors. Cancer Chemother Pharmacol. 2014;74(4):819‐829. [DOI] [PubMed] [Google Scholar]
- 12.Quartino AL, Li H, Jin JY, et al. Pharmacokinetic and exposure‐response analyses of pertuzumab in combination with trastuzumab and docetaxel during neoadjuvant treatment of HER2‐positive early breast cancer. Cancer Chemother Pharmacol. 2017;79(2):353‐361. [DOI] [PMC free article] [PubMed] [Google Scholar]
- 13.Malik MA, Totpal K, Balter I, et al. Dose response studies of recombinant humanized monoclonal antibody 2C4 in tumor xenograft models. Proc Am Assoc Cancer Res. 2003;44:150. [Google Scholar]
- 14.Agus DB, Gordon MS, Taylor C, et al. Phase I clinical study of pertuzumab, a novel HER dimerization inhibitor, in patients with advanced cancer. J Clin Oncol. 2005;23(11):2534‐2543. [DOI] [PubMed] [Google Scholar]
- 15.Kirschbrown WP, Wynne C, Kågedal M, et al. Development of a subcutaneous fixed‐dose combination of pertuzumab and trastuzumab: results from the phase Ib dose‐finding study. J Clin Pharmacol. 2019;59(5):702‐716. [DOI] [PMC free article] [PubMed] [Google Scholar]
- 16.Kamath AV. Translational pharmacokinetics and pharmacodynamics of monoclonal antibodies. Drug Discov Today Technol. 2016;21‐22:75‐83. [DOI] [PubMed] [Google Scholar]
- 17.FDA approves breast cancer treatment that can be administered at home by health care professional. FDA press release. https://www.fda.gov/news‐events/press‐announcements/fda‐approves‐breast‐cancer‐treatment‐can‐be‐administered‐home‐health‐care‐professional#:~:text=Phesgo%20is%20initially%20used%20in,and%20pertuzumab%20at%20infusion%20centers. Published 2019. Accessed July 14, 2020.
- 18.Baron KT.mrgsolve: Simulate from ODE‐based models. R package version 0.10.1. https://CRAN.R‐project.org/package=mrgsolve. Accessed August 28, 2020.
- 19.Quartino AL, Li H, Kirschbrown WP, et al. Population pharmacokinetic and covariate analyses of intravenous trastuzumab (Herceptin®), a HER2‐targeted monoclonal antibody, in patients with a variety of solid tumors. Cancer Chemother Pharmacol. 2019;83(2):329‐340. [DOI] [PMC free article] [PubMed] [Google Scholar]
- 20.Yamashita‐Kashima Y, Iijima S, Yorozu K, et al. Pertuzumab in combination with trastuzumab shows significantly enhanced antitumor activity in HER2‐positive human gastric cancer xenograft models. Clin Cancer Res. 2011;17(15):5060‐5070. [DOI] [PubMed] [Google Scholar]
- 21.Tan AR, Im S‐A, Mattar A, et al. Fixed‐dose combination of pertuzumab and trastuzumab for subcutaneous injection plus chemotherapy in HER2‐positive early breast cancer (FeDeriCa): a randomised, open‐label, multicentre, non‐inferiority, phase 3 study. Lancet Oncol. 2021;22(1):85‐97. [DOI] [PubMed] [Google Scholar]
- 22.Genentech. An expanded access study to provide at home subcutaneous administration of pertuzumab and trastuzumab fixed‐dose combination (PH FDC SC) for patients with HER2‐positive breast cancer during the COVID‐19 pandemic. https://clinicaltrials.gov/ct2/show/NCT04395508. Accessed September 14, 2020.
- 23.O'Shaughnessy J, Sousa SP, Cruz J, et al. Patient (pt) preference and satisfaction with the subcutaneous fixed‐dose combination of pertuzumab (P) and trastuzumab (H) in pts with HER2‐positive early breast cancer (HER2‐positive eBC): Interim analysis of the open‐label, randomised cross‐over PHranceSCa study. Abstract 80O presented at ESMO Breast Cancer Virtual; May 23‐24, 2020.