

Abstract
Background and Aims
Manual histological assessment is currently the accepted standard for diagnosing and monitoring disease progression in NASH, but is limited by variability in interpretation and insensitivity to change. Thus, there is a critical need for improved tools to assess liver pathology in order to risk stratify NASH patients and monitor treatment response.
Approach and Results
Here, we describe a machine learning (ML)‐based approach to liver histology assessment, which accurately characterizes disease severity and heterogeneity, and sensitively quantifies treatment response in NASH. We use samples from three randomized controlled trials to build and then validate deep convolutional neural networks to measure key histological features in NASH, including steatosis, inflammation, hepatocellular ballooning, and fibrosis. The ML‐based predictions showed strong correlations with expert pathologists and were prognostic of progression to cirrhosis and liver‐related clinical events. We developed a heterogeneity‐sensitive metric of fibrosis response, the Deep Learning Treatment Assessment Liver Fibrosis score, which measured antifibrotic treatment effects that went undetected by manual pathological staging and was concordant with histological disease progression.
Conclusions
Our ML method has shown reproducibility and sensitivity and was prognostic for disease progression, demonstrating the power of ML to advance our understanding of disease heterogeneity in NASH, risk stratify affected patients, and facilitate the development of therapies.
Abbreviations
- CILO
cilofexor
- CNN
convolutional neural networks
- CP
central pathologist
- DELTA
Deep Learning Treatment Assessment
- ELF
Enhanced Liver Fibrosis
- FDR
false discovery rate
- FIR
firsocostat
- HB
hepatocellular ballooning
- LT
liver transplantation
- MELD
Model for End‐Stage Liver Disease
- ML
machine learning
- NAS
NAFLD Activity Score
- NASH CRN
NASH Clinical Research Network
- SEL
selonsertib
- WSI
whole‐slide image
Global prevalence of NAFLD is rising rapidly.( 1, 2 ) NAFLD represents a continuum of disease of varying severity, with milder forms consisting of simple steatosis, whereas the progressive form, NASH, can progress to cirrhosis and end‐stage liver disease. NASH‐related cirrhosis is now the fastest growing indication for liver transplantation (LT) in the USA.( 3 )
Histopathological assessment of liver biopsies is the reference standard for the diagnosis and staging of NASH, both clinically and in the context of clinical trials. Classification of NASH severity is based on ordinal staging systems, including those developed by the NASH Clinical Research Network (NASH CRN), which includes fibrosis stages 0‐4, and the NAFLD Activity Score (NAS), a composite ordinal scoring system comprising steatosis, lobular inflammation, and hepatocellular ballooning (HB).( 4 ) Ordinal classification systems have limited value when describing a disease that is driven by a continuum of cellular and stromal injury, and limited sensitivity to reflect changes in disease severity over time. Moreover, existing scoring systems have only moderate‐to‐fair reproducibility, even among expert hepatopathologists.( 4, 5, 6 ) Despite these limitations, the current regulatory framework for approval of NASH therapies relies on manual pathological scoring.( 7 )
In comparison to other diseases like cancer, where image‐based analysis is also central to diagnostic accuracy, development of a therapeutic for NASH has been constrained by diagnostic irreproducibility.( 8 ) Furthermore, a high rate of apparent histological response observed in placebo‐treated patients impacts the powering of clinical trials that include histological endpoints.( 8, 9, 10, 11 ) Adoption of computerized analysis, based on machine learning (ML) algorithms, improved the performance of pathologists and clinical experts in detection and diagnosis of cancer, retinopathy, and skin lesions.( 12, 13 ) Initial efforts to apply ML to NASH histology have demonstrated the feasibility of this approach in small cohorts.( 14, 15, 16, 17 ) Here, we hypothesized that leveraging deep convolutional neural networks (CNNs) for quantitative tissue characterization would improve upon human pathological evaluation by increasing reproducibility, identifying features associated with clinical outcomes, and providing a platform for rigorous and consistent assessment of disease regression following treatment.
To this end, we applied our approach to the assessment of liver histology using biopsies from multiple randomized controlled trials of therapies in patients with advanced fibrosis attributable to NASH. Our models recapitulated the key histological features of NASH, as assessed by the central pathologist (CP) who provided slide‐level scores in the context of the clinical trials, and demonstrated comparable agreement with consensus scores from readings from three expert pathologists conducted as part of the current study. Features associated with disease progression were also identified, demonstrating the potential utility of ML‐based approaches for risk stratification.
Finally, these models revealed, and were used to characterize, the heterogeneity of fibrosis that exists within a given biopsy. When applied to serial biopsy samples, this approach tracked changes in fibrosis phenotypes over time with greater granularity than achieved with using ordinal scoring systems. Our results highlight the potential to integrate this ML‐based approach into routine patient care and adapt for use as endpoints in NASH clinical trials.
Materials and Methods
Clinical Trial Information
This study used liver biopsy samples from three randomized controlled trials of therapies for patients with advanced fibrosis attributable to NASH (STELLAR‐3 [NCT03053050], STELLAR‐4 [NCT03053063], and ATLAS [NCT03449446]). The designs, eligibility criteria, and results of these trials have been reported elsewhere.( 18, 19 ) Written informed consent was obtained from each patient prior to the initiation of study activities. The study protocols conformed to the ethical guidelines of the 1975 Declaration of Helsinki and were approved by all participating institutional review boards or ethics committees. In brief, the phase 3 STELLAR studies enrolled adult patients with a histological diagnosis of NASH (defined as the presence of grade ≥1 steatosis, HB, and lobular inflammation according to the NAS) and either bridging (F3) fibrosis (STELLAR‐3) or compensated cirrhosis, stage F4 (STELLAR‐4). Both studies were terminated after a preplanned efficacy analysis at week 48 demonstrated that the study drug, selonsertib (SEL), was ineffective compared with placebo. Similarly, in the phase 2b ATLAS study, adult patients with advanced fibrosis (F3‐F4) attributable to NASH were randomized to treatment with SEL, firsocostat (FIR), or cilofexor (CILO), alone or in two‐drug combinations, for 48 weeks.( 19 ) The SEL monotherapy arm was discontinued following reporting of the negative STELLAR studies.( 18 ) In these studies, patients were deemed to have a clinical event if they had adjudication‐confirmed evidence of hepatic decompensation (e.g., ascites, grade ≥2 HE, or gastrointestinal bleeding secondary to portal hypertension), LT, qualification for transplantation (Model for End‐Stage Liver Disease score [MELD] ≥15), or histological progression to cirrhosis (in STELLAR‐3 and ATLAS).
Liver Biopsy Slides
Throughout all three trials, core‐needle liver biopsies were performed at baseline and week 48. These were evaluated by a single CP (Z.G.) who generated slide‐level scores according to the NASH CRN and Ishak fibrosis classifications and NAS. The primary endpoint for each study was fibrosis improvement, defined as a ≥1‐stage improvement in fibrosis according to the NASH CRN classification without worsening of NASH (defined as any increase in lobular inflammation or ballooning according to the NAS) from baseline to week 48.
Digitized liver biopsy slides from these trials, including screened and/or enrolled patients, were separated into training, validation, and test sets for the purpose of model parameter estimation, model performance evaluation, and model generalization evaluation, respectively. Patients were first binned by both NAS and NASH CRN fibrosis stage, and bins were used to randomly assign patients to training and validation or test sets in a 0.187/0.813 ratio. The training and validation slide data set included 753 slides from 388 patients in STELLAR‐3 and 502 slides from 256 patients in STELLAR‐4. The test set included 2,194 slides from 1,282 patients in STELLAR‐3, 2,027 slides from 1,120 patients in STELLAR‐4, and 918 slides from 616 patients in ATLAS. Slides from the ATLAS study were used exclusively in model testing.
To train ML models, board‐certified pathologists specializing in hepatobiliary pathology from the PathAI network of expert pathologists provided pixel‐level annotations designating regions of tissue within a whole‐slide image (WSI) as exhibiting specific morphologies. Specifically, using a digital platform (PathAI, Boston, MA), polygons were created to indicate areas of specified morphologies. In total, >65,424 annotations (45,081 on images of HE‐stained slides and 20,343 on images of trichrome‐stained slides) of key histological parameters were used for supervised model training. For details of annotation statistics by morphology, see Supporting Table S1.
After model training, we recruited three experienced board‐certified hepatobiliary pathologists (U.K., R.N., and R.T.), distinct from the pathologists who generated training and validation annotations, to generate a consensus score for comparison of ML scoring with pathologist assessment. These pathologists were presented with a WSI and asked to enter a numerical score for the pathological feature in question. Pathologists evaluated each slide in duplicate, inter‐rater consensus was calculated across these pathologists, and intrarater consensus was computed across duplicate reads (Supporting Table S2). The median interval between biopsy rereads was 16 weeks (range, 9‐20).
Slide Background and Artifact Exclusion
Most pixels in an WSI of a core needle biopsy contain background rather than liver tissue, and tissue‐containing regions may suffer from sample preparation and imaging artifacts, including debris, tissue folds, and areas of poor focus. We excluded both these background and artifact‐containing regions from our analysis using an additional CNN trained to classify pixels as either background, tissue with artifact, or usable tissue. All other models and features were then evaluated only in the areas classified as usable tissue.
Training and Testing an ML System for Quantification of NAS Features
Pathologist‐derived annotations of HE WSIs (as described above) were grouped into classes as appropriate and then used to generate training sets of image patches on the order of 500,000 samples. These patches were used to train a deep CNN with stochastic minibatch gradient descent, using the ADAM optimizer( 20 ) to produce pixel‐level predictions of NAS components (steatosis, lobular inflammation, and HB; Fig. 1A). Models are comprised of 8‐12 blocks of compound layers with a topology inspired by residual networks and inception networks with a softmax loss.( 21, 22 ) Model training was monitored and hyperparameters adjusted based on performance of the model on pathologist annotations from the held‐out validation set, until convergence was achieved.
FIG. 1.
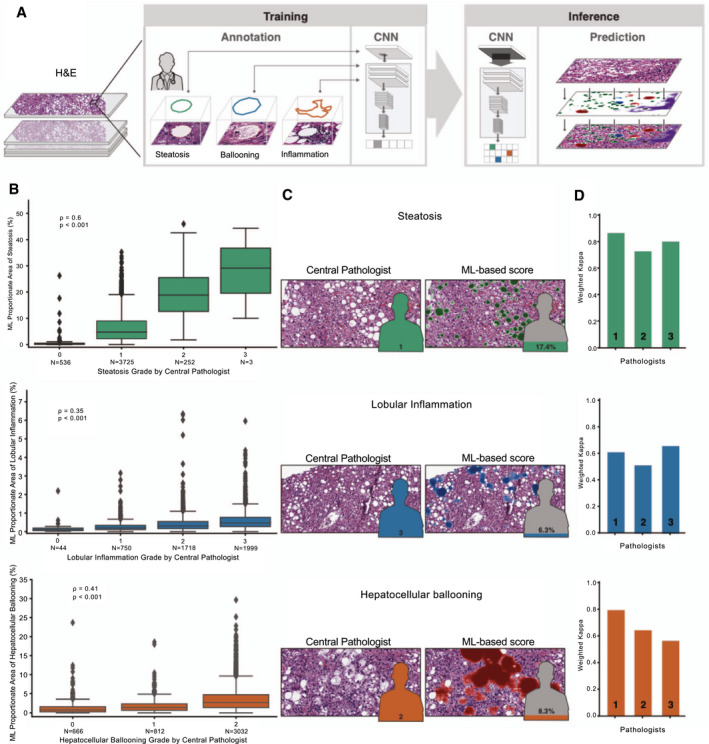
ML system for quantification of NAS features. (A) ML process for training and deploying models for the NAS. Example pathologist annotations are shown in the middle panel (bounding boxes). These annotations are used for model training to generate pixel‐resolution heatmaps (left panel), which segment the tissue into corresponding regions. (B) Box‐and‐whisker plots showing comparison of ordinal score based on evaluation by the CP (x‐axis) and ML‐based model measurement (y‐axis). Model values describe the proportion of tissue area predicted to be the substance in question (steatosis, lobular inflammation, or HB). Values shown are Spearman correlation coefficients (rho) and corresponding P values. Boxes show the interquartile range (IQR), and whiskers show 1.5× the limit of the IQR. Points show values beyond this range. (C) Example pathological images (left) and corresponding ML heatmaps (right). Figures represent pathologist label (left) and model predictions (right). Heatmaps represent model predictions: Green regions are predicted to be steatosis (top), blue regions are predicted to be lobular inflammation (middle), and red regions are predicted to be HB (bottom). (D) Intrapathologist reproducibility for scoring of NAS parameters. Values shown are weighted Cohen’s kappa computed for the repeated grading of the same slides (N = 166).
Training and Testing an ML System for Quantification of Fibrosis
The ML Ishak and NASH CRN fibrosis scoring models were supervised with the slide‐level label generated during the clinical trials by the CP (Z.G.). After label assignment, the training process was similar to that described above for NAS features. Model predictions were restricted to regions identified as bile duct or fibrosis. Using the fibrosis stage assigned by the CP, an “end‐to‐end” (E2E) model was developed that predicted fibrosis stage (NASH CRN or Ishak) within fibrotic regions in the tissue directly from images of trichrome‐stained slides without calculation of specific histological features. Specifically, the model was used to predict a fibrosis stage for each pixel of fibrotic tissue within each slide. Slide‐level scores were generated by summing all pixels predicted to be each grade of fibrosis and normalized by total area of fibrosis. These features measure the fraction of tissue consistent with each NASH CRN or Ishak fibrosis stage in each slide. To compute the weighted average score, we multiplied each of these fractions by the corresponding stage value and summed over the stages.
We also used these scores to compute the patient DELTA Liver Fibrosis score measuring change in fibrosis, treating each patient’s fraction of stage of fibrosis as a distribution over the possible stages at baseline and week 48 and computing the Wasserstein distance between these distributions. Finally, we multiplied this distance by the change in average weighted score (week 48 to baseline) to achieve the DELTA Liver Fibrosis score. Specifically, the score is the first Wasserstein distance (or earth mover’s distance( 23 )) between the distribution of fibrosis stages at baseline and following treatment multiplied by the overall shift in mean score between time points. The Wasserstein distance measures the amount of “work” required to turn one distribution into another; in this case, the magnitude of change in the composition of predicted NASH CRN fibrosis stages between baseline and week 48. The Wasserstein distance is symmetric and unitless (i.e., the amount of work is the same regardless of direction); therefore, we scaled by the mean to give the DELTA score a sign and an interpretable magnitude. Finally, we multiplied this distance by the change in average weighted score (week 48 to baseline) to achieve the DELTA Liver Fibrosis score.
Model Predictions of Tissue Histological Features
Cloud‐computing infrastructure allowed massively parallel patch‐wise inference to be efficiently performed exhaustively on every tissue‐containing region of an WSI, with a spatial precision of four to eight pixels. The resulting “heatmaps” represent model predictions at each point in the WSI. These were then used to calculate specific features summarizing these heatmaps at the patient level. In total, 198 features ranging from simple area proportions (e.g., the fraction of tissue area predicted to be fibrotic) to higher‐order features, such as bile duct/proximal fibrosis, were calculated. Accuracy of the models for classification of individual features compared with the pathologists’ slide‐level assessments is reported in Supporting Figs. S1‐S5.
Associations Between Pathological Features and Clinical Outcomes
The 198 patient‐level feature vectors provide a rich characterization of patients’ liver pathology. To assess associations between these features with clinical outcomes, we used Cox’s proportional hazards regression models and calculated the c‐statistic to assess model discrimination of these features for these outcomes. The outcome measures of interest were histological progression to cirrhosis in patients with bridging (F3) fibrosis at baseline and adjudicated liver‐related clinical events in those with cirrhosis (F4). Liver‐related clinical events were ascites, grade ≥2 HE, gastrointestinal bleeding attributable to portal hypertension, LT, qualification for transplantation (MELD ≥15), and death and were observed in 22 patients.
Statistical Analysis
Computed multiple associations between our feature vectors and clinical outcomes created a multiple comparisons problem. However, typical methods for control of false discovery rate (FDR) were not appropriate because of the high correlation between features (Supporting Fig. S6). To address this challenge, feature reduction by clustering was performed and then cluster‐wise significance was computed and corrected to control the FDR. To cluster features, a feature‐by‐feature distance matrix was calculated using the absolute value of the Spearman correlation. Next, hierarchical clustering was performed using Ward’s method to produce a dendrogram of features. We chose a cut in tree and produced flattened clusters using the elbow method. We performed this clustering procedure using the combined data from all three data sets to enforce consistent clusters throughout the analyses. To compute the significance value of each cluster, P values of the features in each cluster were combined using the empirical Brown’s method (EBM).( 24 ) After combining P values, we assumed that each cluster’s association with an outcome would represent an approximately independent hypothesis and applied Storey’s method to calculate FDR‐corrected q values.( 25 )
Results
ML‐Quantified Liver Histological Features
To develop a reproducible and quantitative measure of NASH histology, deep CNN models were trained to predict the NAS components of steatosis, lobular inflammation, and HB using pathologists’ annotations of HE slide images (Fig. 1A). Notably, confusion of the model was greatest for features that pathologists normally find difficult to distinguish (e.g., normal hepatocytes [normal liver] vs. hepatocellular swelling vs. HB), highlighting the difficulty in evaluating models using subjective labels where expert human pathologists may disagree. We evaluated the relevance of our model‐based slide annotations by comparing the proportion of tissue area assigned to each NAS component in the test set with the ordinal grade as determined by the CP (Fig. 1B). Model predictions were significantly correlated with ordinal grades for all three NAS components across all test‐set slides (steatosis, ρ = 0.60; P < 0.001; lobular inflammation, ρ = 0.35; P < 0.001; and HB, ρ = 0.41; P < 0.001), with similar concordance in the individual trials (Supporting Fig. S2). Model features were significantly concordant with scoring by the CP in the clinical trials on slides from the ATLAS trial, despite its exclusion from the training data set. To visualize the output of the models, we created heatmaps representing the ML‐based prediction of each NAS component and visualized the predictions on images of HE‐stained slides (Fig. 1C).
Next, to examine the reliability and reproducibility of manual pathology‐based scoring of NASH features, three expert liver pathologists (U.K., R.N., and R.T.) independently graded the NAS components on 166 slides in duplicate (Materials and Methods; Supporting Table S2). We found that pathologist scoring of NAS features showed substantial intraobserver reproducibility. Specifically, weighted Cohen kappa values( 26 ) were 0.797 for steatosis (range, 0.726‐0.864), 0.593 for lobular inflammation (0.513‐0.659), and 0.666 for ballooning (0.562‐0.793; Fig. 1D; Supporting Table S3). However, rates of discordance between pathologists for ordinal grading of NAS features ranged from 22% to 47%. Consensus NAS grades by the three pathologists were significantly correlated with the ML model’s scores (steatosis, ρ = 0.66; p < 0.001; HB, ρ = 0.62; P < 0.001; lobular inflammation, ρ = 0.54; P < 0.001).
Fibrosis Scoring by ML Models
An E2E model was developed to predict fibrosis stage directly from a trichrome‐stained slide image without calculating any intermediate histological features (Fig. 2A; Materials and Methods). This model generates slide‐level scores that capture both the severity and heterogeneity of fibrosis (NASH CRN and Ishak) within the slide (Fig. 2B). On test‐set slides, these scores were significantly correlated with fibrosis as staged by the CP (Fig. 2C and Supporting Fig. S4A; NASH CRN fibrosis stage, Spearman ρ = 0.56; P < 0.001 and Ishak fibrosis stage, ρ = 0.71; P < 0.001). Concordance of ML fibrosis scores with fibrosis stage was consistent in the test set in each trial, demonstrating model generalization across varying sources of slides (Supporting Fig. S4B). Manual staging of fibrosis demonstrated substantial inter‐rater agreement (Supporting Table S2); intrarater kappa values( 26 ) were 0.865 (range, 0.815‐0.911) for the Ishak classification and 0.797 (range, 0.754‐0.833) for the NASH CRN classification (Fig. 2D; Supporting Table S3). However, rates of discordance between fibrosis stages assigned by the same pathologist on biopsy rereads ranged from 29% to 45%.
FIG. 2.
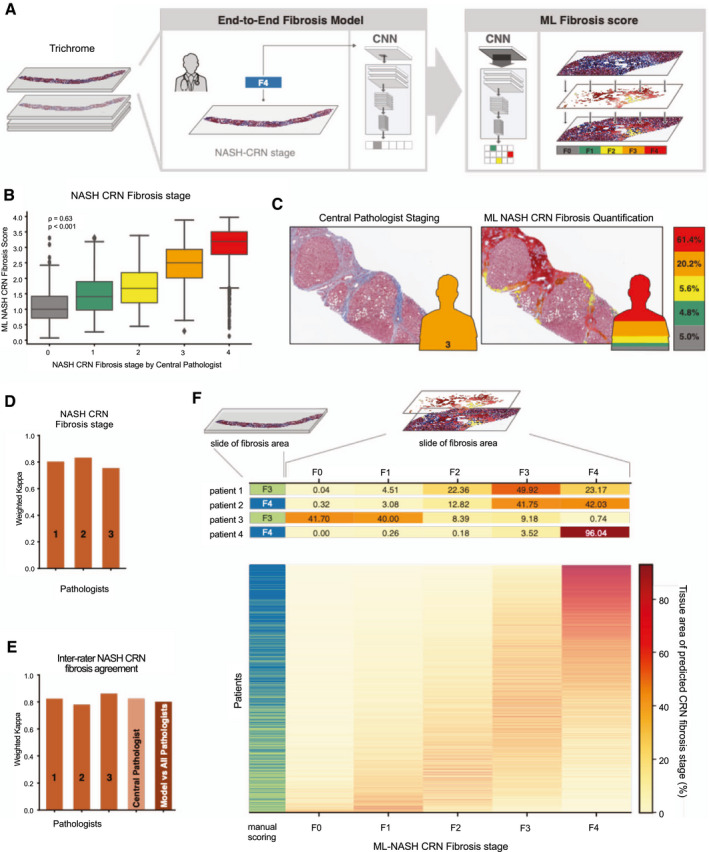
ML system for staging of fibrosis. (A) ML process for training and deploying models for fibrosis staging. Model is trained using the CP’s ordinal fibrosis stage (NASH CRN 0‐4 and Ishak 0‐6, middle panel). The model performs pixel‐wise prediction, and these predictions are pooled over the entire slide to yield a per‐slide prediction and distribution of fibrosis stages (left panel). (B) Box‐and‐whisker plots showing comparison of ordinal stage based on evaluation by the CP (x‐axis) and ML‐based model measurement (y‐axis). The ML‐based measurement is the weighted average NASH CRN fibrosis stage based on model predictions (Materials and Methods). Spearman correlation coefficients (rho) and corresponding P values are inset. Boxes show the IQR, and whiskers show 1.5× the limit of the IQR. Points show values beyond this range. (C) Example pathological image with and without ML‐based heatmap and stacked bar chart. Pixel‐wise predictions of NASH CRN fibrosis stage are shown on the left (gray = 0, green = 1, yellow = 2, orange = 3, and red = 4). Height of bar chart represents percentage of tissue classified as each fibrosis stage. (D) Intrapathologist reproducibility for NASH CRN fibrosis stage. Values shown are weighted Cohen’s kappa computed for repeated staging of the same slides (N = 166). (E) Pathologist and model inter‐rater agreement for staging of fibrosis. Bar charts show the weighted Cohen’s kappa for each pathologist’s score and the model’s score against the consensus of pathologists. (F) Heterogeneity of fibrosis within patients with advanced fibrosis (F3‐F4) attributable to NASH. Leftmost column represents the CP’s single ordinal stage (green = F3 and blue = F4). Middle panel shows a heatmap where each row is a patient and each column is an ML NASH CRN predicted stage. The color of each box represents the percentage of that patient’s biopsy, which is predicted to be consistent with each NASH CRN fibrosis stage (0‐4).
We also evaluated model performance versus a consensus of pathologists’ staging (N = 161 slides; Fig. 2E; Supporting Table S4). The model’s agreement with the consensus staging of pathologists, assessed by weighted Cohen’s kappa, was 0.801 for the NASH CRN and 0.817 for the Ishak classifications. This level of agreement is within the range of agreement between individual pathologists and the consensus (N = 3; 0.780‐0.862), indicating that the model performed within the range of expert review, while at the same time enabling a level of reproducibility superior to what could be achieved by expert review.
In addition to an accurate reproduction of fibrosis staging by human pathologists, the model predicts the overall NASH CRN and Ishak fibrosis scores for each pixel within the image, which enables computation of continuous measures of disease severity summarizing their disease state (Fig. 2F; Materials and Methods). These measures illuminated heterogeneity in fibrosis within each sample that is not captured by a single ordinal stage provided by traditional staging using either the NASH CRN or Ishak classification systems.
ML Parameters Predict Clinical Outcomes
During a median follow‐up of 15.9 months (range, 0.06‐26.20), 113 patients with bridging (F3) fibrosis in the STELLAR‐3 trial progressed to cirrhosis, and liver‐related clinical events were observed in 22 patients with cirrhosis in STELLAR‐4 during a median follow‐up of 15.7 months (range, 0.26‐25.00; Supporting Table S5). Among the 198 ML‐based histological features, 99 and 61 predicted (with nominal statistical significance) progression to cirrhosis and liver‐related clinical events, respectively.
For all NAS features and each Ishak fibrosis stage, we compared the prognostic value of the ML‐based parameters with scores of the CP based on the c‐statistic. NASH CRN fibrosis stage was not examined given that it is part of the outcome measure in F3 patients and because it cannot worsen in F4 patients. Overall, both the ML‐predicted features and parameters from CP review were moderately predictive. However, the ML‐predicted features were nominally as prognostic, or more prognostic, than the parameters from CP review (Table 1). The ML‐based assessment of steatosis was the most nominally differential prognostic feature (c‐statistics in STELLAR‐3, ML 0.57 vs. CP 0.51; in STELLAR‐4, ML 0.67 vs. CP 0.52).
TABLE 1.
Concordance Index (C‐index) for Univariate Cox Model Using Each of the ML‐Based Features, Features Scored by the CP
| Patient Population | Features | C‐index [95% CI] (Cox Proportional Hazards Model) | |
|---|---|---|---|
| ML | CP | ||
| STELLAR 3; N = 113 (patients with progression to cirrhosis) | Inflammation | 0.55 [0.49‐0.55] | 0.52 [0.49‐0.55] |
| Steatosis | 0.57 [0.52‐0.62] | 0.51 [0.50‐0.54] | |
| Ballooning | 0.55 [0.51‐0.60] | 0.53 [0.50‐0.56] | |
| Ishak | 0.62 [0.57‐0.67] | 0.58 [0.54‐0.61] | |
| STELLAR 4; N = 22 (patients with adjudicated clinical events) | Inflammation | 0.57 [0.48‐0.73] | 0.57 [0.49‐0.65] |
| Steatosis | 0.67 [0.55‐0.77] | 0.52 [0.50‐0.58] | |
| Ballooning | 0.64 [0.52‐0.75] | 0.53 [0.50‐0.60] | |
| Ishak | 0.73 [0.63‐0.81] | 0.65 [0.59‐0.71] | |
The C‐index is a generalization of the AUC and measures the discriminatory ability of the model for survival times. ML features include inflammation, steatosis, ballooning, and Ishak score.
ML models also enabled the quantification of more complex features, such as ratios of NAS features (e.g., ratio of area of steatosis to HB) and features not included in the NAS (e.g., portal inflammation; summarized in Supporting Table S5). We used these features to identify histological parameters associated with disease progression. Overall, we found 13 feature clusters (derived from the features in Supporting Table S5) that were significantly (q < 0.05) associated with progression to cirrhosis in STELLAR‐3 and seven clusters associated with liver‐related clinical events in STELLAR‐4 (Supporting Table S6; Supporting Fig. S6A‐D; Materials and Methods). Clusters containing features describing the proportionate area of fibrosis stage (NASH CRN and Ishak) were associated with clinical disease progression in both trials (Fig. 3A). The most significant cluster of NAS features in STELLAR‐4, which was also significant in STELLAR‐3, includes the ratio of steatosis to HB. Specifically, patients with more HB and less steatosis at baseline were significantly more likely to experience a clinical event (STELLAR‐4: log‐rank test by tertile, P = 0.003; Fig. 3B; HR, 0.35; 95% CI, 0.182, 0.672). The most significant cluster in STELLAR‐3, which was also significant in STELLAR‐4, included portal inflammation (q = 0.011). Patients with high levels of portal inflammation in STELLAR‐3 were significantly more likely to progress to cirrhosis during follow‐up (STELLAR‐3: log‐rank test by tertile, P = 0.033; Fig. 3C; HR, 1.372; 95% CI, 1.079, 1.743).
FIG. 3.
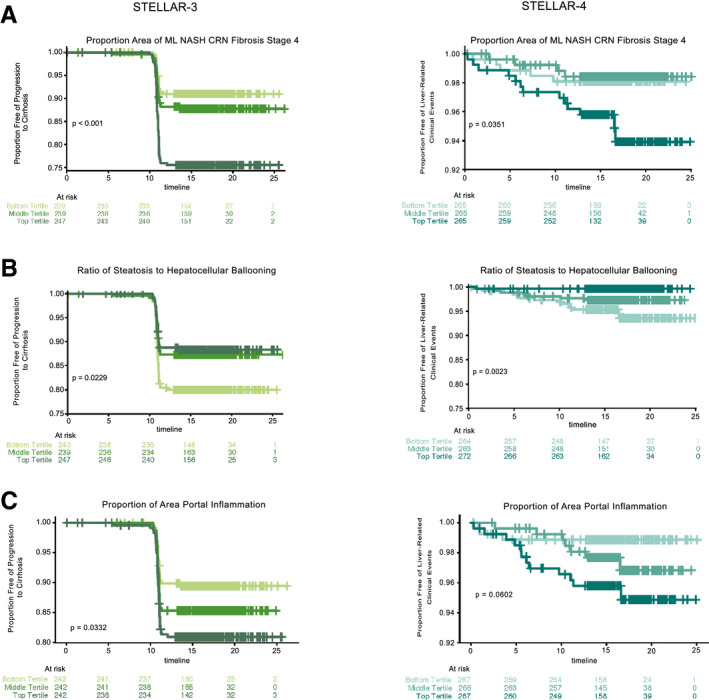
Application of ML features for assessing prognosis and monitoring responses to treatment and disease progression. Kaplan‐Meier curves showing proportions of patients with bridging fibrosis (F3) without progression to cirrhosis (left panel, STELLAR‐3) or patients with cirrhosis (F4) without liver‐related clinical events (right panel, STELLAR‐4) over time. Patients are categorized into subgroups by tertile of (A) percentage of area predicted to be NASH CRN stage 4, (B) ratio of steatosis to HB, and (C) percent area of portal inflammation based on ML predictions. Tertiles are shown by shades of green (STELLAR‐3) and blue (STELLAR‐4), with the lightest shades indicating the bottom tertile and darkest shades the top tertile. P values were computed using the log‐rank test.
ML‐Based Score Captures Fibrosis Heterogeneity and Progression
Beyond use for subject inclusion, pathology plays a critical role in NASH clinical trials for the assessment of changes in pathological phenotypes in response to treatment.( 9 ) Whereas traditional staging by the NASH CRN or Ishak fibrosis classifications include only a single integer measurement of fibrosis, the ML method enables quantification of a distribution of heterogenous fibrosis patterns (Fig. 4A). We hypothesized that considering the change in the full distribution of fibrosis patterns within a patient’s liver biopsy may provide a more sensitive measure of biological change following treatment with an effective therapy. To evaluate this, we developed a metric based on the Wasserstein probability distribution metric,( 23, 27, 28, 29 ) termed the Deep Learning Treatment Assessment (DELTA) Liver Fibrosis score, that captures the change in fibrosis patterns from before to after treatment (Fig. 4A). To evaluate the clinical relevance of this metric, we assessed its association with histological progression to cirrhosis among patients with bridging (F3) fibrosis in STELLAR‐3. This showed that patients who progressed to cirrhosis had a greater DELTA Liver Fibrosis score from baseline to week 48 compared with patients who did not progress to cirrhosis (P < 0.001; Fig. 4B). We were unable to assess the clinical relevance of the DELTA Liver Fibrosis score to progression to clinical events in STELLAR‐4 because in this case patients who experienced a clinical event before week 48 did not undergo the second biopsy required to calculate the DELTA Liver Fibrosis score.
FIG. 4.
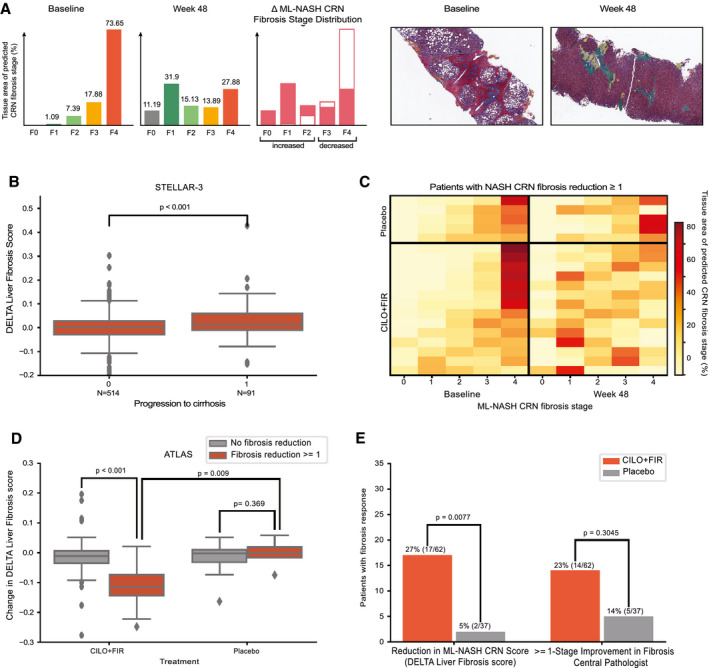
(A) Example quantification of changes in fibrosis from advanced (F3‐F4) to less‐advanced (≤F2) fibrosis stage patterns for a patient treated with the CILO + FIR in the ATLAS trial. Sample regions with heatmaps are shown at baseline and week 48 below. (B) Box‐and‐whisker plot showing the difference in DELTA Liver Fibrosis score for patients who did and did not progress to cirrhosis at week 48 in STELLAR‐3. (C) Heatmap showing the change in percentage of each fibrosis stage pattern between baseline and week 48 in biopsies from patients in the placebo (top) and CILO + FIR (bottom) arms of the ATLAS trial. Each row represents a patient, all of whom were determined by the CP to have had a ≥1‐stage improvement in NASH CRN fibrosis stage. Each column is an ML NASH CRN predicted fibrosis stage. The color of each box represents the percentage of that patient’s biopsy, which is predicted to be consistent with each NASH CRN fibrosis stage (0‐4) at baseline (left) and at week 48 (right). (D) Box‐and‐whisker plot showing the DELTA Liver Fibrosis score for patients in the placebo and CILO + FIR arms of the ATLAS trial according to achievement of a ≥1‐stage improvement in fibrosis according to the CP. (B,D) P values for comparisons of change in DELTA Liver Fibrosis score between groups was computed using the Mann‐Whitney U test. Boxes show the interquartile range (IQR), and whiskers show 1.5× the limit of the IQR. (E) Bar chart showing the proportion of patients in the placebo (gray) and CILO + FIR arms (red) of the ATLAS study with a reduction in fibrosis as assessed by the DELTA Liver Fibrosis score and according to the CP using the NASH CRN classification. P values computed using Fisher’s exact test.
DELTA Liver Fibrosis score Measures Treatment Response
Utility of the DELTA Liver Fibrosis score for monitoring treatment responses in the ATLAS study was also evaluated. As reported, the combination of CILO and FIR (CILO + FIR) led to improvement in histological and noninvasive measures of fibrosis and liver injury compared with placebo over the 48‐week study period.( 19 ) However, the difference between CILO + FIR and placebo for the primary endpoint (fibrosis improvement without worsening of NASH) was not statistically significant, potentially attributable to insensitivity of manual pathological review. To investigate this, we evaluated concordance between the DELTA Liver Fibrosis score and standard pathological staging of fibrosis. We assessed whether patients treated with CILO + FIR who achieved a ≥1‐stage improvement in fibrosis by the NASH CRN classification according to CP review showed a significant decrease in the DELTA Liver Fibrosis score. CILO + FIR–treated patients with a fibrosis response had a greater reduction in DELTA Liver Fibrosis score compared to fibrosis nonresponders (P < 0.001; Fig. 4C,D).
If the DELTA Liver Fibrosis score is more sensitive than manual pathological staging for the identification of treatment effects, we would expect to identify a greater reduction among CILO + FIR–treated patients versus those on placebo who had a fibrosis response because the latter may be more likely to be attributable to sampling variability of biopsy. Among patients deemed to have a fibrosis response by manual pathological staging, those treated with CILO + FIR had significantly greater reductions in DELTA Liver Fibrosis score compared to placebo‐treated patients (P = 0.009) where responders and nonresponders had similar scores (P = 0.369; Fig. 4D). Similarly, among patients treated with SEL + FIR, those with a pathologist‐defined fibrosis response had a significantly greater reduction in DELTA Liver Fibrosis score than nonresponders (P < 0.001; Supporting Fig. S7A).
To validate this differential in DELTA Liver Fibrosis score by nonhistological measures, we compared changes in scores between patients with and without reductions of the noninvasive fibrosis markers, Enhanced Liver Fibrosis (ELF) score (Siemens, Tarrytown, NY) and liver stiffness by transient elastography (FibroScan; Echosens, Paris, France), between baseline and week 48 (>0.5‐unit and >25% reductions, respectively).( 30, 31 ) In patients with advanced fibrosis attributable to NASH, changes of this magnitude have been associated with a reduced risk of clinical disease progression.( 21, 32 ) In ATLAS, CILO + FIR–treated patients with reductions in both measures had significantly lower DELTA Liver Fibrosis scores than nonresponders (ELF score, P = 0.008; liver stiffness, P = 0.029), confirming the relevance of this metric for monitoring disease severity (Supporting Fig. S7B,C).
Finally, we aimed to define a threshold of the DELTA Liver Fibrosis score to classify patients as fibrosis responders or nonresponders. In randomized controlled trials of NASH therapies, ~20% of patients treated with placebo achieve a ≥1‐stage improvement in fibrosis.( 5, 6, 7 ) This high placebo response is a challenge for adequately powering clinical trials, particularly smaller phase 2 studies. To create a stringent threshold, we identified the 10th percentile of DELTA Liver Fibrosis score in all patients from the STELLAR trials( 6, 7, 8 ) and applied this value (–0.08) to data from the ATLAS study to classify patients as responders or nonresponders. Using this threshold, 17 of 63 patients (27%) treated with CILO + FIR were classified as responders compared to only 2 of 37 patients (5%) treated with placebo (Fisher’s exact test, P = 0.008). In contrast, using manual pathological staging, the proportion of patients with a ≥1‐stage improvement in fibrosis was not statistically different between CILO + FIR– and placebo‐treated patients (22% [14 of 63] vs. 14% [5 of 37]; P = 0.30; Fig. 4E). We repeated this analysis for the other treatment groups in the ATLAS study. Although no other therapy was associated with a statistically significant increase in fibrosis response rate versus placebo based on this DELTA Liver Fibrosis threshold, patients treated with FIR monotherapy (P = 0.0709) or FIR in combination with SEL (P = 0.0802) tended to have a higher response rate than placebo‐treated patients (Supporting Fig. S8).
Importantly, this approach enables rigorous control of the placebo response rate by threshold selection. For example, by selecting a less‐stringent threshold at the 25th percentile from the STELLAR studies (–0.03) for defining response, the response rates in placebo and CILO + FIR–treated patients in ATLAS were 24% (9 of 37) and 40% (25 of 62), respectively. Given the modest sample size, this difference is not statistically significant (P = 0.13), demonstrating the impact of response criteria stringency on the power to detect statistically significant differences between treatment arms.
Discussion
This study aimed to validate an ML‐based approach to automate, standardize, and quantify the key histological features of NASH, explore histological features associated with disease progression, and develop a sensitive and quantitative method for assessing treatment response. To this end, we used 5,139 images of liver biopsy slides from 3,018 patients with NASH from the phase 3 STELLAR trials and phase 2 ATLAS trial, and the key findings are outlined below.
First, we demonstrated a high degree of concordance between NASH‐related histological parameters estimated by the ML model and an experienced pathologist for steatosis (ρ = 0.59) and fibrosis (ρ = 0.63), whereas concordance for HB (ρ = 0.39) and lobular inflammation (ρ = 0.34) was lower. Notably, high intraobserver variability in pathological assessment of ballooning and lobular inflammation has been reported( 33 ) and was found in 22%‐47% of three pathologists’ repeat analyses of the same images. Inconsistency of the reference standard against which these ML models were derived and compared to—the imperfect gold‐standard bias—highlights challenges inherent in developing alternative approaches to the evaluation of liver histology in NASH. Using a consensus score derived from multiple expert pathologists’ scores as the gold standard may improve scoring consistency, but poses logistical challenges and would still be less reliable than an ML‐based approach.( 11 ) However, before ML‐model–predicted histology can advance to the clinic, proof of superiority over traditional pathology will need to be established.
Second, we developed continuous measurements of NAS components and fibrosis that, though correlated with the current scoring systems, highlight the variability in individual values within each category of these classifications. The ordinal nature of current classification systems limits their dynamic range for the evaluation of change, which may be overcome by continuous ML parameters. For liver fibrosis specifically, we demonstrated the heterogeneity of fibrosis within the same patient and across patients with the same fibrosis stage (e.g., cirrhosis). This level of granularity is not possible with conventional staging and supports the potential utility of these measures as endpoints in clinical trials (e.g., reductions in overall fibrosis score or a shift from more‐advanced to less‐advanced fibrosis patterns).
In this regard, we created an ML‐derived metric termed the DELTA Liver Fibrosis score to measure changes in the intrasample distribution of fibrosis attributable to disease progression or therapy. Application to ATLAS study results showed that this measure increases in patients with bridging fibrosis (F3) who progress to cirrhosis (F4) and identifies an antifibrotic effect of CILO + FIR not observed with placebo in patients with no fibrosis regression by standard histological staging. DELTA Liver Fibrosis score was also consistent with changes in validated, noninvasive markers of fibrosis (ELF and liver stiffness by transient elastography), demonstrating the potential for his approach to identify true treatment effects beyond what can be achieved with manual staging.
The high placebo response rate in NASH randomized controlled trials presents a challenge to their successful execution.( 5, 6, 7 ) Here, we show that a stringent DELTA Liver Fibrosis score threshold can minimize the reported placebo response in a large data set of patients treated with placebo or an ineffective therapy in the STELLAR trials. When applied to the ATLAS trial, this threshold revealed a significant antifibrotic effect of CILO + FIR compared to placebo that was not statistically significant with conventional pathological staging, showing that the DELTA Liver Fibrosis score represents a more sensitive and reproducible method for assessing histological response to NASH treatments. These results are based on relatively small numbers of patients in the phase 2 ATLAS study and warrant confirmation in additional randomized trials with prespecified analyses of cohorts. If validated, implementation of DELTA Liver Fibrosis score as an endpoint in clinical trials for NASH therapeutics could immediately benefit pharmaceutical companies—and ultimately to patients with NASH—because such endpoints would be clear, interpretable, and medically relevant benchmarks of treatment success (or failure).
Finally, we demonstrated that ML‐derived histological features have superior prognostic utility compared with manual pathological features for routinely scored components of the NAS and fibrosis. Beyond these conventional parameters, we also demonstrated the potential of deep CNN models to identify feature clusters associated with disease progression (e.g., the ratio of steatosis to HB). Taken together, these data show that ML‐derived models may be more accurate for risk stratification of patients with NASH.
Using the expert pathologist assessments for training results in ML models that can identify the morphological signatures of each NAS feature and quantify fibrosis with a performance approximating that of multiple expert pathologists. Thus, we believe that ML‐based pathological assessment is a powerful tool for measuring disease severity, risk stratification, and monitoring treatment response in patients with NASH. A significant advantage of this ML‐based approach to liver pathology over human assessment is that once the model is trained, the system is perfectly reproducible; multiple applications of the same model on the same image produce identical scores enabling improved prediction of clinical outcomes and evaluation of treatment response. Our models hold promise for addressing a critical unmet medical need to support the clinical development of safe and effective therapies for patients with NASH.
Author Contributions
A.H.B., A.K., A.T.W., H.E., M.C.M., I.W., G.M.S., and R.P.M. planned the experiments. A.T.W., C.S., H.E., H.P., and K.P. wrote code and performed analyses. A.H.B., A.T.W., C.S., H.E., H.P., I.W., R.P.M., and M.R. planned and prepared the figures. Z.G.D. performed central pathological review. U.K., R.N., and R.T. performed poststudy pathological review. M.R. performed annotation quality control. A.H.B., A.K., I.W., C.C., G.M.S., R.P.M., and Z.M.Y. conceived of the study. All authors contributed to preparation of the manuscript.
Supporting information
Fig S1‐S8
Table S1
Table S2
Table S3
Table S4
Table S5
Table S6
Supported by PathAI and funded by Gilead Sciences, Inc.
Potential conflict of interest: Dr. Taylor‐Weiner is employed by and owns stock in PathAI. Dr. Pokkalla is employed by and owns stock in PathAI. He owns stock in Gilead. Dr. Han is employed by and owns stock in Gilead. Dr. Jia is employed by and owns stock in Gilead. Dr. Huss is employed by and owns stock in Gilead. Dr. Chung is employed by Gilead. Dr. Elliott is employed by and owns stock in PathAI. Dr. Glass is employed by and owns stock in PathAI. Dr. Pethia is employed by and owns stock in PathAI. Dr. Shukla is employed by and owns stock in PathAI. Dr. Najarian owns stock in Gilead, Intercept, and Viking. Dr. Taliano consults for PathAI. Dr. Myers is employed by and owns stock in Gilead. Dr. Wapinski is employed by and owns stock in PathAI. Dr. Khosla is employed by and owns stock in PathAI. Dr. Resnick is employed by and owns stock in PathAI. Dr. Montalto is employed by and owns stock in PathAI. Dr. Anstee consults for, is on the speakers’ bureau for, has active research collaborations with, and received grants from Allergan/Tobira. He consults for, has active research collaborations with, and received grants from AstraZeneca, Novartis, and Pfizer. He consults for, is on the speakers’ bureau for, and has active research collaborations with Bristol‐Myers Squibb and Genfit. He consults for and is on the speakers’ bureau for Abbott and Gilead. He consults for and has active research collaborations with Eli Lilly, HistoIndex, Intercept, and Novo Nordisk. He has active research collaborations with and received grants from AbbVie, GlaxoSmithKline, and Glympse Bio. He consults for 89Bio, Acuitas, Altimmune, Axcella, Blade, BNN Cardio, Celgene, Cirius, CymaBay, EcoR1, E3Bio, Galmed, Genentech, Grunthal, Indalo, Imperial Innovations, Inventiva, IQVIA, Janssen, Madrigal, Medimmune, Metacrine, NewGene, NGMBio, North Sea, Poxel, ProSciento, Raptor, Servier, Terns, and Viking. He has active research collaborations with Antaros, Boehringer Ingelheim, Echosens, Ellegaard Gottingen Minipigs AS, Exalenz, iXscient, Nordic Bioscience, One Way Liver Genomics, Perspectum, Resoundant, Sanofi‐Aventis, SomaLogic, and Takeda. He is on the speakers’ bureau for Clinical Care Options, Falk, Fishawack, Integritas, Kenes, and MedScape. He received grants from Vertex. He received royalties from Elsevier. Dr. Wong consults for and received grants from Gilead. He consults for 3V‐Bio, AbbVie, Allergan, Boehringer Ingelheim, Center for Outcomes Research in Liver Diseases, Echosens, Hanmi, Intercept, Merck, Novartis, Novo Nordisk, Perspectum, Pfizer, ProSciento, Sagimet, TARGET, and Terns. Dr. Trauner consults for, is on the speakers’ bureau for, and received grants from Falk, Gilead, Intercept, and MSD. He consults for and received grants from Albireo. He is on the speakers’ bureau for and received grants from Roche. He consults for Biomx, Boehringer Ingelheim, Genfit, Novartis, Phenex, and Regulus. He received grants from CymaBay and Takeda. Dr. Lawitz received grants from 89Bio, Allergan, Akero, AstraZeneca, Axcella, Bristol‐Myers Squibb, Boehringer Ingelheim, Celgene, Durect, Eli Lilly, Elobix, Enanta, Enyo, Galmed, Genfit, Gilead, Hanmi, Intercept, Madrigal, Merck, Metacrine, Novartis, Novo Nordisk, Poxel, Roche, Viking, and Zydus. Dr. Harrison consults for, advises for, received grants from, and owns stock in Cirius, Galectin, Genfit, Madrigal, NGM, and NorthSea. He consults for, advises for, and received grants from Axcella, Civi, CymaBay, Galmed, Gilead, Hepion, High Tide, Intercept, Novartis, Novo Nordisk, Sagimet, and Viking. He consults for, advises for, and owns stock in Akero, HistoIndex, and Metacrine. He consults for and advises AltImmune, Blade, CLDF, Echosens, Foresite Labs, Gelesis, Indalo, Innovate, Medpace, Merck, Perspectum, Poxel, Prometic, Ridgeline, and Terns. He consults for and received grants from Enyo. He consults for BVF Partners, Fortress, Inipharm, Kowa, and Silverback. He advises for Arrowhead. He received grants from Bristol‐Myers Squibb, Conatus, Genentech, Immuron, Pfizer, Second Genome, and Tobira/Allergan. Dr. Romero‐Gomez consults for and received grants from Gilead and Intercept. He consults for Zydus. Dr. Goodman received grants from Gilead, Intercept, Novartis, Bristol‐Myers Squibb, Allergan, NGM, and Merck. Dr. Loomba consults for, advises for, and received grants from Boehringer Ingelheim, Bristol‐Myers Squibb, Cirius, Eli Lilly, Galmed, Gilead, Intercept, Janssen, Merck, NGM, Pfizer, Prometheus, and Siemens. He consults for Ingelheim, Celgene, CohBar, Conatus, Gemphire, Glympse bio, GNI, GRI Bio, Inipharm, Ionis, Metacrine, Inc., Novartis, Novo Nordisk, Promethera, Sanofi, Siemens, and Viking Therapeutics. He received grants from Allergan, Galectin Therapeutics, GE, Genfit, Grail, Madrigal Pharmaceuticals, NuSirt, and pH Pharma. He is also cofounder of Liponexus, Inc. Dr. Beck is employed by and owns stock in PathAI.
References
- 1.Estes C, Razavi H, Loomba R, Younossi Z, Sanyal AJ. Modeling the epidemic of nonalcoholic fatty liver disease demonstrates an exponential increase in burden of disease. Hepatology 2018;67:123‐133. [DOI] [PMC free article] [PubMed] [Google Scholar]
- 2.Estes C, Anstee QM, Arias‐Loste MT, Bantel H, Bellentani S, Caballeria J, et al. Modeling NAFLD disease burden in China, France, Germany, Italy, Japan, Spain, United Kingdom, and United States for the period 2016‐2030. J Hepatol 2018;69:896‐904. [DOI] [PubMed] [Google Scholar]
- 3.Younossi Z, Stepanova M, Ong JP, Jacobson IM, Bugianesi E, Duseja A, et al. Nonalcoholic steatohepatitis is the fastest growing cause of hepatocellular carcinoma in liver transplant candidates. Clin Gastroenterol Hepatol 2019;17:748‐755.e3. [DOI] [PubMed] [Google Scholar]
- 4.Kleiner DE, Brunt EM, Van Natta M, Behling C, Contos MJ, Cummings OW, et al. Design and validation of a histological scoring system for nonalcoholic fatty liver disease. Hepatology 2005;41:1313‐1321. [DOI] [PubMed] [Google Scholar]
- 5.Merriman RB, Ferrell LD, Patti MG, Weston SR, Pabst MS, Aouizerat BE, et al. Correlation of paired liver biopsies in morbidly obese patients with suspected nonalcoholic fatty liver disease. Hepatology 2006;44:874‐880. [DOI] [PubMed] [Google Scholar]
- 6.Juluri R, Vuppalanchi R, Olson J, Unalp A, Van Natta ML, Cummings OW, et al. Generalizability of the nonalcoholic steatohepatitis clinical research network histologic scoring system for nonalcoholic fatty liver disease. J Clin Gastroenterol 2011;45:55‐58. [DOI] [PMC free article] [PubMed] [Google Scholar]
- 7.FDA . Noncirrhotic Nonalcoholic Steatohepatitis With Liver Fibrosis: Developing Drugs for Treatment. December 2018. www.fda.gov/regulatory‐information/search‐fda‐guidance‐documents/noncirrhotic‐nonalcoholic‐steatohepatitis‐liver‐fibrosis‐developing‐drugs‐treatment. Accessed July 16, 2020. [Google Scholar]
- 8.Ajmera V, Loomba R. Refining sample‐size estimations based upon placebo response in trials of agents for nonalcoholic fatty liver disease. Clin Gastroenterol Hepatol 2019;17:607‐609. [DOI] [PubMed] [Google Scholar]
- 9.Loomba R, Wesley R, Pucino F, Liang TJ, Kleiner DE, Lavine JE. Placebo in nonalcoholic steatohepatitis: insight into natural history and implications for future clinical trials. Clin Gastroenterol Hepatol 2008;6:1243‐1248. [DOI] [PMC free article] [PubMed] [Google Scholar]
- 10.Han MAT, Altayar O, Hamdeh S, Takyar V, Rotman Y, Etzion O, et al. Rates of and factors associated with placebo response in trials of pharmacotherapies for nonalcoholic steatohepatitis: systematic review and meta‐analysis. Clin Gastroenterol Hepatol 2019;17:616‐629.e26. [DOI] [PubMed] [Google Scholar]
- 11.Davison BA, Harrison SA, Cotter G, Alkhouri N, Sanyal A, Edwards C, et al. Suboptimal reliability of liver biopsy evaluation has implications for randomized clinical trials. J Hepatol 2020;73:1322‐1332. [DOI] [PubMed] [Google Scholar]
- 12.Acs B, Rantalainen M, Hartman J. Artificial intelligence as the next step towards precision pathology. J Intern Med 2020;288:62‐81. [DOI] [PubMed] [Google Scholar]
- 13.Bera K, Schalper KA, Rimm D, Velcheti V, Madabhushi A. Artificial intelligence in digital pathology—new tools for diagnosis and precision oncology. Nat Rev Clin Oncol 2019;16:703‐715. [DOI] [PMC free article] [PubMed] [Google Scholar]
- 14.Vanderbeck S, Bockhorst J, Komorowski R, Kleiner DE, Gawrieh S. Automatic classification of white regions in liver biopsies by supervised machine learning. Hum Pathol 2014;45:785‐792. [DOI] [PMC free article] [PubMed] [Google Scholar]
- 15.Vanderbeck S, Brockhorst J, Kleiner D, Komorowski R, Chalasani N, Gawrieh S. Automatic quantification of lobular inflammation and hepatocyte ballooning in nonalcoholic fatty liver disease liver biopsies. Hum Pathol 2015;46:767‐775. [DOI] [PMC free article] [PubMed] [Google Scholar]
- 16.Forlano R, Mullish BH, Giannakeas N, Maurice JB, Angkathunyakul N, Lloyd J, et al. High‐throughput, machine learning‐based quantification of steatosis, inflammation, ballooning, and fibrosis in biopsies from patients with nonalcoholic fatty liver disease. Clin Gastroenterol Hepatol 2020;18:2081‐2090.e9. [DOI] [PMC free article] [PubMed] [Google Scholar]
- 17.Liu F, Goh GBB, Tiniakos D, Wee A, Leow WQ, Zhao JM, et al. qFIBS: a novel automated technique for quantitative evaluation of fibrosis, inflammation, ballooning, and steatosis in patients with nonalcoholic steatohepatitis. Hepatology 2020;71:1953‐1966. [DOI] [PubMed] [Google Scholar]
- 18.Harrison SA, Wong VWS, Okanoue T, Bzowej N, Vuppalanchi R, Younes Z, et al. Selonsertib for patients with bridging fibrosis or compensated cirrhosis due to NASH: results from randomized phase III STELLAR trials. J Hepatol 2020;73:26‐39. [DOI] [PubMed] [Google Scholar]
- 19.Gilead Sciences, Inc . Gilead Announces Topline Results From Phase 2 ATLAS Study in Patients With Bridging Fibrosis (F3) and Compensated Cirrhosis (F4) Due to Nonalcoholic Steatohepatitis (NASH). 2020. www.gilead.com/news‐and‐press/press‐room/press‐releases/2019/12/gilead‐announces‐topline‐results‐from‐phase‐2‐atlas‐study‐in‐patients‐with‐bridging‐fibrosis‐f3‐and‐compensated‐cirrhosis‐f4‐due‐to‐nonalcoholic‐s. Accessed July 16, 2020. [Google Scholar]
- 20.Kingma DP, Lei Ba J. ADAM: a method for stochastic optimization. arXiv 2014;arXiv:1412.6980. [Google Scholar]
- 21.Krizhevsky A, Sutskever I, Hinton GE, ImageNet Classification with Deep Convolutional Neural Networks . Part of Advances in Neural Information Processing Systems 25 (NIPS); 2012. papers.nips.cc/paper/4824‐imagenet‐classification‐with‐deep‐convolutional‐neural‐networks. Accessed July 27, 2020. [Google Scholar]
- 22.He K, Zhang X, Ren S, Sun J. Deep residual learning for image recognition. arXiv 2015;arXiv:1512.03385. [Google Scholar]
- 23.Levina E, Bickel P. The Earth Mover’s distance is the Mallows distance: some insights from statistics. Proc IEEE Int Conf Comput Vis 2001;2:251‐256. [Google Scholar]
- 24.Poole W, Gibbs DL, Shmulevich I, Bernard B, Knijnenburg TA. Combining dependent P‐values with an empirical adaptation of Brown’s method. Bioinformatics 2016;32:i430‐i436. [DOI] [PMC free article] [PubMed] [Google Scholar]
- 25.Storey JD, Tibshirani R. Statistical significance for genome wide studies. Proc Natl Acad Sci U S A 2003;100:9440‐9445. [DOI] [PMC free article] [PubMed] [Google Scholar]
- 26.McHugh ML. Interrater reliability: the kappa statistic. Biochem Med (Zagreb) 2012;22:276‐282. [PMC free article] [PubMed] [Google Scholar]
- 27.Panaretos VM, Zemel Y. Statistical aspects of Wasserstein distances. Annu Rev Stat Its Appl 2019;6:405‐431. [Google Scholar]
- 28.Olkin I, Pukelsheim F. The distance between two random vectors with given dispersion matrices. Linear Algebra Appl 1982;48:257‐263. [Google Scholar]
- 29.Frohmader A, Volkmer H. 1‐Wasserstein Distance on the Standard Simplex. arXiv 2019;arXiv:1912.04945. [Google Scholar]
- 30.Brener S. Transient elastography for assessment of liver fibrosis and steatosis: an evidence‐based analysis. Ont Health Technol Assess Ser 2015;15:1‐45. [PMC free article] [PubMed] [Google Scholar]
- 31.Lichtinghagen R, Pietsch D, Bantel H, Manns MP, Brand K, Bahr MJ. The Enhanced Liver Fibrosis (ELF) score: normal values, influence factors and proposed cut‐off values. J Hepatol 2013;59:236‐242. [DOI] [PubMed] [Google Scholar]
- 32.Sanyal AJ, Harrison SA, Ratziu V, Abdelmalek MF, Diehl AM, Caldwell S, et al. The natural history of advanced fibrosis due to nonalcoholic steatohepatitis: data from the simtuzumab trials. Hepatology 2019;70:1913‐1927. [DOI] [PubMed] [Google Scholar]
- 33.Goodman ZD. Grading and staging systems for inflammation and fibrosis in chronic liver diseases. J Hepatol 2007;47:598‐607. [DOI] [PubMed] [Google Scholar]
Associated Data
This section collects any data citations, data availability statements, or supplementary materials included in this article.
Supplementary Materials
Fig S1‐S8
Table S1
Table S2
Table S3
Table S4
Table S5
Table S6