Abstract
Purpose
Contrast‐free visualization of microvascular blood flow (MBF) using ultrasound can play a valuable role in diagnosis and detection of diseases. In this study, we demonstrate the importance of quantifying ensemble coherence for robust MBF imaging. We propose a novel approach to quantify ensemble coherence by estimating the local spatiotemporal correlation (LSTC) image, and evaluate its efficacy through simulation and in vivo studies.
Methods
The in vivo patient studies included three volunteers with a suspicious breast tumor, 15 volunteers with a suspicious thyroid tumor, and two healthy volunteers for renal MBF imaging. The breast data displayed negligible prior motion and were used for simulation analysis involving synthetically induced motion, to assess its impact on ensemble coherency and motion artifacts in MBF images. The in vivo thyroid data involved complex physiological motion due to its proximity to the pulsating carotid artery, which was used to assess the in vivo efficacy of the proposed technique. Further, in vivo renal MBF images demonstrated the feasibility of using the proposed ensemble coherence metric for curved array‐based MBF imaging involving phase conversion. All ultrasound data were acquired at high imaging frame rates and the tissue signal was suppressed using spatiotemporal clutter filtering. Thyroid tissue motion was estimated using two‐dimensional normalized cross correlation‐based speckle tracking, which was subsequently used for ensemble motion correction. The coherence of the MBF image was quantified based on Casorati correlation of the Doppler ensemble.
Results
The simulation results demonstrated that an increase in ensemble motion corresponded with a decrease in ensemble coherency, which reciprocally degraded the MBF images. Further the data acquired from breast tumors demonstrated higher ensemble coherency than that from thyroid tumors. Motion correction improved the coherence of the thyroid MBF images, which substantially improved its visualization. The proposed coherence metrics were also useful in assessing the ensemble coherence for renal MBF imaging. The results also demonstrated that the proposed coherence metric can be reliably estimated from downsampled ensembles (by up to 90), thus allowing improved computational efficiency for potential applications in real‐time MBF imaging.
Conclusions
This pilot study demonstrates the importance of assessing ensemble coherency in contrast‐free MBF imaging. The proposed LSTC image quantified coherence of the Doppler ensemble for robust MBF imaging. The results obtained from this pilot study are promising, and warrant further development and in vivo validation.
Keywords: contrast free microvascular imaging, ensemble coherence, motion tracking and correction, power Doppler imaging, quality metric, ultrafast imaging
1. INTRODUCTION
Imaging of vascular pathways can provide vital information towards diagnosis of various diseases.1, 2 Quantitative assessment of vascular morphological features (vessel diameter, tortuosity, vascular density, branch points) can serve as an important biomarker for understanding disease progression and its response to treatment. Several researchers have investigated the scope of quantifying these morphological parameters;3, 4 however, they are highly sensitive to tissue motion.5 Conventionally, noninvasive ultrasound is the first choice in the clinic for blood flow imaging, however, due to challenges associated with tissue motion and low framerate of imaging, its detection sensitivity is limited to relatively large vessels.6, 7
Recent developments in ultrasound imaging with respect to ultrafast frame rate combined with spatiotemporal tissue clutter filtering have substantially improved its sensitivity in detecting microvascular blood flow (MBF), without the aid of contrast agents.8 However, the impact of tissue motion on ensemble coherency is a major limitation in robust contrast‐free ultrasound microvascular imaging.5, 9, 10, 11, 12, 13 Specifically, ultrasound backscatter signals reflected from blood flow in small vessels are typically of low intensity, and are enhanced by co‐registered temporal integration of the Doppler ensemble.8, 14, 15 However, tissue motion diminishes ensemble coherency, which deters co‐registered temporal integration of the blood flow signal. Since tissue motion can be practically unavoidable in MBF imaging, quantitative analysis of ensemble coherency may be valuable in understanding its impact on MBF visualization.
An important question in the context of the current study is the potential consequence of performing MBF imaging in the clinic without assessing ensemble coherency. (a) Motion can lead to a misleading diagnosis without any forewarning or indication. This can result in underestimation of vessel density, limiting visualization to larger vessels. However, under certain circumstances, it can also lead to overestimation of vascular density due to appearance of spatially replicated shadow vessels arising from motion‐induced frame misregistration.5, 9, 10, 11, 12 Further, in the absence of real‐time feedback on ensemble coherence, motion can inadvertently lead to poor reproducibility and repeatability of MBF imaging, limiting its scope and accuracy in the clinic. (b) Our previous studies5, 9, 10 demonstrated that motion tracking and correction can considerably improve the performance of MBF imaging. Specifically, inter frame axial and lateral displacements estimated using speckle tracking were used for temporal registration of the clutter‐filtered Doppler frames, prior to power Doppler integration of the ensemble. Methods for quantifying ensemble coherency can be useful in assessing the efficacy of motion correction, and allow optimization of parameters for motion tracking. Currently, there are no metrics that directly quantifies ensemble coherence in ultrasound MBF imaging.
In this paper, we propose to address this issue by computing the local spatiotemporal correlation (LSTC) image from the Doppler ensemble, prior to tissue clutter filtering. The LSTC image can be valuable for assessing the coherence of the acquired data for robust MBF imaging. The magnitude of the complex normalized Pearson's correlation coefficient will be used as the similarity metric for quantifying the local spatiotemporal correlation across the imaging plane. This choice is consistent with prior studies that have used normalized cross correlation‐based speckle tracking as the gold standard for high‐quality motion estimation in ultrasound imaging,16 with applications varying from blood flow imaging,17 elastography imaging,18, 19, 20 temperature imaging,21 phase aberration correction,22 etc. Further, the magnitude of the complex normalized correlation coefficients are bounded between 0 and 1, which makes it simple to understand and easy to interpret. The motivation for developing this metric is three pronged: (a) To detect if the MBF image derived from the Doppler ensemble is trustworthy or corrupted with motion artifacts. Currently, there are no quantitative metrics that can address this issue. (b) This will be a crucial feature in translating MBF imaging to the clinic, to ensure the ensemble acquired can produce reliable and reproducible results from the standpoint of impact of motion on estimation of MBF signal. (c) This metric will serve as an important performance descriptor for motion correction algorithms, indicating spatial regions that may or may not have addressed issues with respect to ensemble motion. Availability of this metric will allow optimization of motion tracking techniques and in comparing results across different speckle tracking approaches.
The hypothesis of this study is that the local spatiotemporal correlation image will serve as a quantitative indicator of MBF image quality with respect to co‐registered temporal integration of the Doppler ensemble. Further, we anticipate that the proposed coherence metric can be effectively estimated from a substantially reduced ensemble, owing to the ensemble redundancy associated with the high frame rate of imaging. We tested the hypothesis by conducting simulation and in vivo studies using linear and curvilinear probes. For the simulation study, breast data were analyzed with synthetically induced motion. In vivo imaging of thyroid nodules were performed to visualize the impact of complex physiological motion on the ensemble coherency, and to evaluate the efficacy of motion correction in addressing it. In vivo imaging of renal microvasculature was performed to determine the feasibility of applying the proposed coherence analysis on ultrasound data curved array transducers requiring image scan conversion, and for MBF imaging of deep‐seated organs.
2. MATERIALS AND METHODS
The proceeding subsections describe the methods used for in vivo data acquisition, processing and analysis.
2.1. Data acquisition
The ultrasound data for the in vivo studies were acquired in in‐phase and quadrature (IQ) format, using an Alpinion ECube 12R ultrasound scanner (Alpinion Medical Systems Co., Seoul, South Korea). The ultrasound system was equipped with two probes: L12‐3H linear array operating at 11 MHz for imaging of breast and thyroid tumors, and SC1‐4H curvilinear array operating at 3.5‐MHz center frequency for renal MBF imaging. High frame rate imaging was performed using in‐system plane wave imaging implementation that automatically calculated the delay for angular steering of the transmitted plane waves, with a maximum angle of and a step size of .23, 24, 25, 26 For the curvilinear probe, the radius of the curvature of the aperture was accounted for in plane wave delay calculations.27 The ultrasound transmit and receive sequences involved 128 and 64 probe elements, respectively. The receive sequence was repeated twice for each half of the transducer to emulate a 128 element receive aperture. The transmit signal had two excitation cycles, and a sampling frequency of 40 MHz was used to digitize the received signal. The plane wave ultrasound data (also referred to as the Doppler ensemble) were acquired for 3 s, at frame rate (FR) and pulse repetition frequency (PRF) determined based on depth of imaging. The beamforming delays were computed based on tissue speed‐of‐sound assumption of 1540 . Further, beamformed ultrasound data corresponding to the curved array probe were scan converted in to Cartesian coordinates using a spline‐based interpolation. The axial and lateral size of each pixel in the beamformed image of the linear array transducer data were 38.5 200 , respectively. Correspondingly, for the curvilinear array, the pixels of the pre‐scan converted images varied in dimension across the image, whereas the scan converted image had square pixels of length 96 .
2.2. Patient study
This pilot study involved 15 patients with suspicious thyroid tumors, and three patients with suspicious breast tumors. The thyroid and breast tumors were candidates to biopsy for conclusively determine its pathology. For the renal imaging study, two healthy volunteers were recruited. The ultrasound data for all in vivo MBF imaging were acquired by an experienced sonographer. To minimize motion artifacts due to breathing, subjects were asked to hold their breath for the 3 s duration of data acquisition. These studies were performed in accordance with the relevant guidelines and regulations of the Mayo Clinic Institutional Review Board and an approved, written informed consent was obtained from the subjects prior to their participation. Thyroid and breast scans were performed using the L12‐3H linear array, whereas the renal scans were performed using the SC1‐4H curvilinear array. This allowed evaluation of the proposed metrics for both aperture types, and for imaging microvessels at superficial (thyroid and breast) and deeper (kidney) tissues.
2.3. Simulation of synthetic ensemble motion
The primary goal of the simulation study was to develop understanding of the proposed novel metrics in succinctly quantifying the overall impact of tissue motion on ensemble coherency and the estimated MBF image. Accordingly, a simple and uniform motion profile of linearly increasing amplitude was applied to sub‐clusters of ensemble frames and its impact on the LSTC were evaluated. Understanding the impact of this basic linear motion profile on the proposed metrics will aid in comprehending the impact of complex motion patterns observed in vivo (e.g., thyroid) that may include compounded motion from carotid pulsation, sonographer hand motion and potential patient’s body motion. Motion was simulated in an ensemble of in vivo breast ultrasound data that incurred negligible prior motion. Four examples of synthetic motion were considered in this study. Simulated motion was induced using a spline‐based interpolator, similar to that used in motion correction.5, 9, 10 Particularly, the simulated motion was specifically applied to clutter‐filtered ensembles to ensure tissue signal suppression was optimal and uniform across all simulated examples. Accordingly, any changes in the MBF was specifically due to poor power Doppler signal integration, without any confounding effects of clutter filtering. Since the proposed coherence metrics are estimated based on correlation of the tissue signal, a second instance of identical motion was applied to the original IQ data that were used specifically for the estimation of LSTC metric, as outlined in [Fig. 1(a)]. The simulation study includes four examples (Cases 1‐4). In each example, the reference Doppler ensemble of 2000 frames is split into sub‐ensembles that incur fixed motion in both axial and lateral direction, with constituent frames maintaining their relative spatial alignment with each other. Specifically, in Case 1, the Doppler ensemble was split into two sub‐ensembles of frames 1–1000 at rest, and frames 1001–2000 that incurred identical motion of 2 pixels in the same direction; all frames maintained relative spatial alignment with other constituent frames of the sub‐ensemble. Similarly, in Case 2, frames 1‐2000 were sub‐divided into four sub‐ensembles. Accordingly, frames 1–500 were at rest, whereas, constituent frames of subsequent sub‐ensembles 501–1000, 1001–1500, and 1501–2000 incurred identical motion of 2, 4, and 6 pixels, respectively. In Case 3, the Doppler ensemble of 2000 frames was sub‐divided into eight sub‐ensembles. Accordingly, the constituent frames of each sub‐ensemble 1–250, 251–500, 501–750, 751–1000, 1001–1250, 1251–1500, 1501–1750, and 1751–2000 were subjected to identical motion of 0, 2, 4, 6, 8, 10, 12, and 14 pixels, respectively. Similarly, in Case 4, constituent frames of sub‐ensembles 1–100, 101–200, 201–300, 301–400, 401–500, 501–600, 601–700, 701–800, 801–900, and 901–1000 incurred identical motion of 0, 2, 4, 6, 8, 10, 12, 14, 16, and 18 pixels, respectively.
Fig. 1.
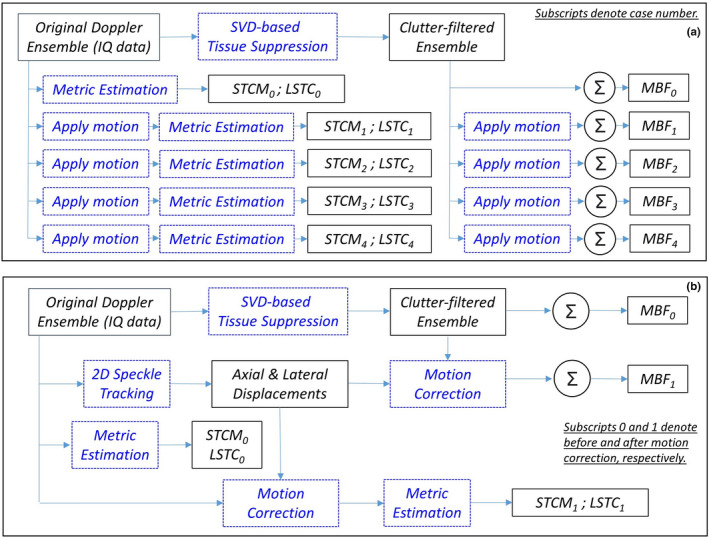
Algorithmic workflow of (a) simulation studies and (b) in vivo data analysis.
2.4. Local Spatiotemporal correlation (LSTC) image
The acquired Doppler ensemble was denoted by E(x,z,t) , where , , corresponded to axial, lateral, and temporal coordinates, respectively, and , , corresponded to axial, lateral, and temporal dimensions of E, respectively. Ensemble coherency was estimated based on local spatiotemporal correlation, denoted as LSTC (0,1) , as outlined in Fig. 2. The LSTC image was computed across locally overlapping kernels C , with center denoted by , , as highlighted in blue in (a,b). The data corresponding to the 3D kernel (b) were correlated temporally to estimate the spatiotemporal correlation matrix (STCM) (d), as generalized for local kernel centered at :
| (1) |
where denotes complex conjugate and denotes the two‐dimensional (2D) mean of the local image kernel . The correlation coefficients of (0,1) . Each matrix entry quantifies the local similarity between any two ensemble frames . Since correlation values are independent of pair‐ordering, STCMs are symmetric, and the diagonal elements are unity due to self‐correlation. In the absence of motion: Since ultrasound speckle is deterministic, identical image kernels will lead to an STCM with all unity entries, under the hypothetical assumption of no noise. However, since noise is unavoidable, the respective correlation value will always be 1, except in the diagonal entries which represent a self‐correlation value of unity. Reciprocally, in the presence of large motion, it is expected that the STCM be reduced to an identity matrix, with zero non‐diagonal entries. Additionally, the above formalism can also be applied for estimation of global STCM, corresponding to pixels in the lesion ROI in the Doppler ensemble. The global STCM would visualize the overall ensemble coherence characteristics temporally with respect to the pixels in the lesion area. To compute the LSTC image, local STCMs were estimated and averaged locally at all coordinates of the imaging plane:
| (2) |
Fig. 2.

Estimation of spatiotemporal correlation matrix (STCM) and local spatiotemporal correlation (LSTC) image from Doppler ensemble. (a) Acquired Doppler ensemble, (b) local kernel indicated in blue in (a), (c) STCM of the local kernel in (b), (d) LSTC image represents the mean of the STCM, estimated by the moving the kernel across the entire imaging plane. The size of the representative 3D kernel is purposefully exaggerated for better visualization.
The diagonal entries of STCM were discarded from the computation of the LSTC image to ensure that the mean of STCM was normalized between 0 and 1. Specifically, even though the unity diagonal entries will not affect the maximum bound of 1, it would, however, prevent the minimum bound from being zero, which would therefore vary depending on the size of the ensemble (number of diagonal entries). Since the unity diagonal entries of the STCM represent self‐correlation of ensemble frames (unaffected by motion or noise characteristics), it can be safely considered redundant from the standpoint of quantifying ensemble coherence. This ensures that only STCM entries that correspond to ensemble coherence contribute to the estimation of the LSTC image. Reliable visualization of blood flow signal depends highly on co‐registered temporal integration of the Doppler ensemble, which can be quantitatively evaluated by estimating the LSTC image. It can depict regions of high or low confidence, for robust MBF imaging. For the LSTC images computed in this paper, we used spatial kernels of dimension , with an overlapping step size of 1 pixel in both directions. An overall algorithmic workflow is outlined in Fig. 1(b).
2.4.1. Impact of ensemble size on LSTC and STCM estimation
High imaging frame rate can lead to acquisition of a large ensembles of Doppler data with high similarity neighboring frames. Reducing temporal redundancy can be useful in efficiently computing the LSTC image, without degrading image quality. Two downsampling approaches that are at common disposal are uniform and random downsampling. In the presence of periodic motion from physiological sources (carotid pulsations, heartbeat, etc.), uniform sampling can potentially lead to bias, especially if both motion and sampling frequencies are comparable. In the contrary, random downsampling can allow unbiased sampling of the ensemble, assuming enough samples are included. Accordingly, the local kernel will be randomly downsampled to , where . To evaluate the feasibility of reliably estimating the LSTC image from randomly downsampled ensembles, we will conduct experiments with reduced frame counts from to , in steps of . We will compare the LSTC values obtained from the downsampled ensemble with that of the full ensemble to evaluate its accuracy. In the same context, we will determine the efficacy of estimating the STCM for downsampled spatial kernels. Specifically, if the ROI pixels correspond to , where is the total numbers of spatial pixels in the selected lesion ROI and are the total number of ensemble frames. Accordingly, will be randomly downsampled to , where . To evaluate the feasibility of reliably estimating the global STCM from randomly downsampled ensembles, we will conduct experiments with reduced spatial pixels from to , in steps of . We will compare the STCM obtained from the downsampled ensemble with that of the full ensemble to evaluate its accuracy.
2.5. Estimation of microvascular blood flow
Estimation of microvascular blood flow signal from the acquired ultrafast Doppler ensemble involves two important steps: (a) suppression of tissue clutter in the Doppler frames, which reveals the low‐intensity blood flow signal and random noise, and (b) subsequently, the temporal integration of the squared‐magnitude of the constituent clutter‐filtered Doppler ensemble frames to boost the intensity of the blood flow signal in the final MBF image.5, 9, 10 In the absence of tissue motion, perfect spatial registration exists across all Doppler frames resulting in highly co‐registered power Doppler signal integration. On the other hand, in the presence of tissue motion, lack of spatial registration leads to overlap of blood flow signal and noise at different temporal instances, resulting in weak temporal integration of the power Doppler signal. In our previous papers,5, 9, 10 we proposed motion correction to address this issue, which improves the coherency of the Doppler ensemble for an optimal power Doppler integration. In this paper, we propose spatiotemporal correlation‐based metrics to assess the impact of motion on co‐registered integration of the power Doppler signal and the respective quality of the resultant MBF image.
2.5.1. Spatiotemporal tissue clutter filtering using singular value decomposition
The Doppler frames of the acquired ensemble E(x,z,t) were rearranged in to a Casorati matrix , where and denoted spatial and temporal coordinates, and the tissue clutter signal was suppressed using singular value decomposition8 as follows:
| (3) |
The matrices and represented pre‐ and postclutter‐filtered Doppler ensemble. Subsequently, was transformed back to 3D Cartesian form . The matrices and consist left and right singular orthonormal vectors, respectively. The corresponding singular values and their orders are denoted by and , respectively, and represents conjugate transpose. Specifically, the lower and higher singular orders predominantly corresponded to tissue and flow signal, respectively. A global SV threshold () was used for separating tissue clutter from blood flow signal, determined based on the decay of the double derivative of the SV orders (i.e., when the double derivative approached zero).28 The logic behind this approach is to determine the sharp decay in the gradient of the singular value decay that corresponds with tissue clutter separation from blood and noise.
2.5.2. Displacement estimation and motion correction
Tissue motion was estimated using 2D normalized cross correlation‐based speckle tracking. Specifically, motion was estimated between consecutive ultrasound frames in terms of axial and lateral displacements. A 2D kernel of dimension (0.2 mm 0.8 mm) was used to estimate displacement which overlapped by 90 in both coordinates. Sub‐pixel motion was estimated using a 2D spline interpolator. Further, to improve the efficacy of the tracking algorithm, ultrasound images were interpolated in the axial and lateral directions by a factor of 3 and 10, respectively, thereby increasing the spatial density of correlation functions.29, 30, 31 The tracking algorithm was implemented on a Titan XP GPU (Nvidia Corp., CA, US) to achieve enhanced computational efficiency. Subsequently, the estimated axial and lateral displacements maps were transformed from Eulerian to Lagrangian coordinates, with respect to the first frame of the Doppler ensemble. However, although tissue motion was tracked prior to clutter filtering, motion correction was applied on clutter‐filtered ultrasound data. Specifically, motion correction was used to re‐register each Doppler frame with the first frame of the ensemble. The mean axial and lateral displacements obtained from the lesion area of each frame were used to globally shifting the rows and columns of each clutter‐filtered Doppler frame using a spline‐based interpolater.
2.5.3. Power Doppler integration
Contrast‐free MBF images were estimated through temporal integration of the clutter‐filtered Doppler ensemble as follows:
| (4) |
where denotes the microvascular blood flow image obtained from integration of the motion‐corrected Doppler ensemble . Integration of the Doppler ensemble is important for reliable visualization of the MBF signal. The background noise bias associated with MBF imaging was suppressed using the adaptive technique proposed in our recent paper.32 The technique requires at least 250 frames of high coherence (low motion) to estimate the background noise bias. In cases with high motion, such as thyroid examples, we used the global STCM to determine ensemble frames with correlation 0.9. This criteria of identifying at least 250 frames with 0.9 correlation was successfully met across all examples, and background noise bias was successfully suppressed, even in the presence of motion.32
2.6. Data analysis
Quantitative assessment of MBF image quality was performed by estimating the signal to noise ratio (SNR) and contrast to noise ratio (CNR):
| (5) |
| (6) |
where and denotes the mean and the standard deviation of the signal, respectively. Further, the subscripts and corresponds to signal obtained from the vessel and background regions, respectively. A constant offset of 10 dB was added to all estimated CNR values to display a positive estimate, specifically, in the absence of motion correction. The selection of vessel and background regions for estimation of SNR and CNR was performed as described in our previous work.5, 9 Further, the mean and 1 standard deviation of LSTC image was estimated from the pixels corresponding to the tumor area, identified in the corresponding sonographic image.
3. RESULTS
Figure 3 corresponds to simulation of synthetic motion in in vivo breast data with negligible prior motion. Row 1: (a) displays the sonogram of the hypoechoic breast lesion. The STCM in (b) is estimated from the pixels in the lesion area. Specifically, the STCM visualizes the correlation between the ensemble frames with respect to the lesion area. The high correlation between frame pairs imply negligible motion in the ensemble. The LSTC image in (c) is estimated from local spatiotemporal correlation matrices in kernels translated across the imaging plane. The breast MBF image (d) displayed a dense network of microvessels. Rows 2–4 display the impact of simulated motion on the STCMs (e‐h), LSTC images (i‐l), and the MBF (m‐p) images, respectively; Columns 1–4 correspond to simulation Cases 1‐4, respectively. The results show that inducing motion in the ensemble degraded its coherence, which was quantified in the respective LSTC images. Specifically, increase in the amplitude of motion, and the number of frames incurring it led to degradation of ensemble coherence, and an increased corruption of the MBF images. The STCM accurately visualized the relative coherence of the frames in the ensemble with respect to the different patterns of synthesized motion. In Cases 1‐4, the ensemble motion of 2 pixels was induced every 1000, 500, 250, and 100 frames, respectively, which was succinctly depicted in the corresponding STCM images (e‐h). The mean of the STCM decreased from 0.97 in (b), to (0.749, 0.50,0.30,0.24) in (e‐h), respectively. The decay in coherence in the STCM was consistent with the observation of decreased in LSTC values in (i‐l). As the simulated motion was applied uniformly across the imaging plane, the respective loss of ensemble coherence in the LSTC image was global in nature.
Fig. 3.
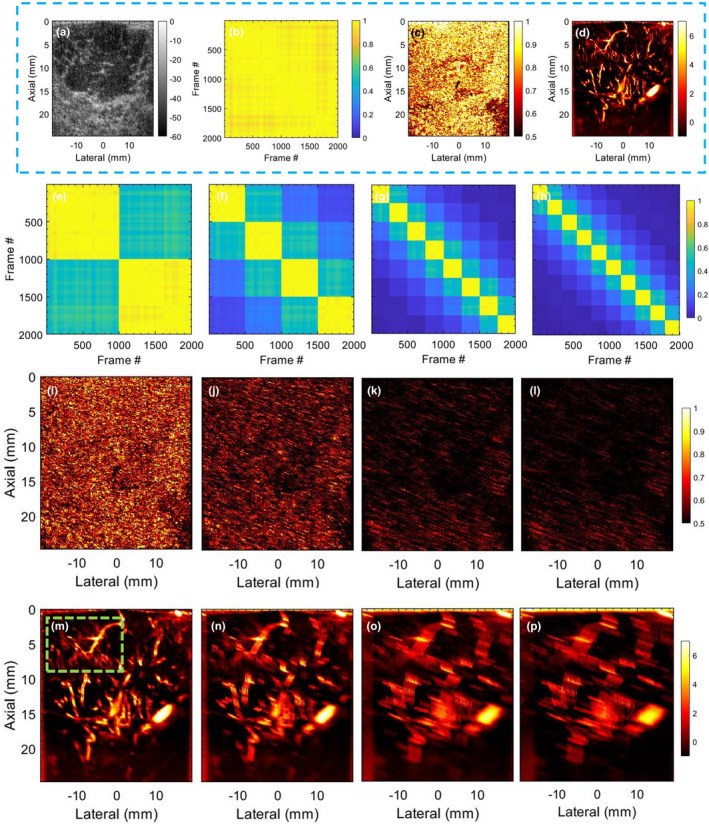
Results of motion simulation study, performed using breast ultrasound data with no prior motion. (a) displays sonogram of the breast lesion. (b,c) display the corresponding spatiotemporal correlation matrix (STCM) and local spatiotemporal correlation (LSTC) image, respectively. (d) displays the respective contrast‐free microvascular blood flow (MBF) image of the breast lesion. The STCMs (e‐h), LSTC images (i‐l), and MBF images (m‐p) correspond to simulated Cases 1‐4, respectively. The green box in (w) indicates the ROI chosen for analysis in Fig. 4.
Figures 4(a)–4(d) displays zoomed insets of the MBF images in Figures 3(d), 3(n)–3(p), respectively. In (a), the zoomed inset corresponding to the reference image displayed a rich vascular network of blood vessels, with no motion artifacts. However, with the increase in ensemble motion, the MBF images were visibly corrupted with motion blurring and other artifacts. Specifically, visualization of blood flow in small vessels, which highly depends on co‐registered integration of the Doppler ensemble, disappeared in (c,d), whereas in large vessels, shadow artifacts visibly distorted its morphological identity. The color bar of (a‐d) are same as in the parent Fig. 3.
Fig. 4.
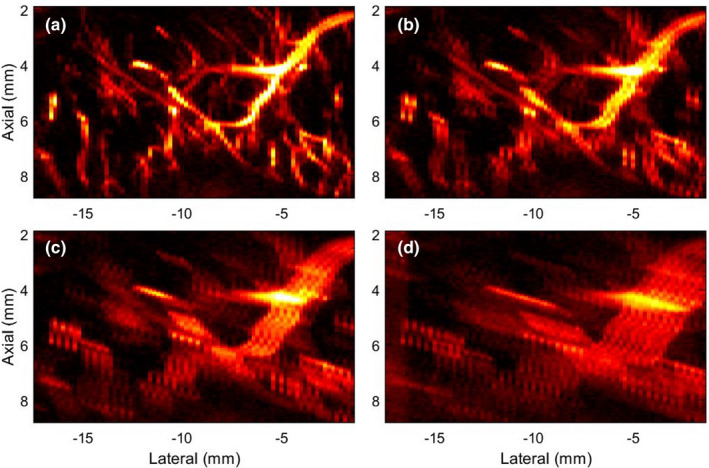
Zoomed inset of microvascular blood flow (MBF) images in Fig. 3, corresponding to the green ROI in Fig. 3(m). (a) corresponds to the original MBF image of the breast lesion with no prior motion. (b‐d) corresponds to the MBF images associated with motion simulated Cases 1‐3, respectively. The color bar of (a‐d) are same as in the parent Fig. 3.
Figure 5 displays quantitative results of the simulation study, across Cases 0‐4. Specifically, Case 0 represents the original breast data, with no simulated or prior motion. (a) quantifies the coherence of the Doppler ensemble in terms of mean and 1 standard deviation of the LSTC images in the lesion area. (b,c) quantifies the SNR and CNR of the MBF images in Fig. 3, respectively. These quantitative results show that an increase in tissue motion decreased ensemble coherency, which was associated with increased presence of motion artifacts. Overall, the quantitative results were consistent with the visual assessment of the LSTC, STCM and MBF images, across all simulated cases. Particularly, the image with least motion (i.e., Case 0) displayed the highest ensemble correlation and the best image quality, both qualitatively and quantitatively.
Fig. 5.

Quantitative results of the simulation study. (a) quantifies the mean and standard deviation of local spatiotemporal correlation images corresponding to the lesion region. (b,c) quantify the SNR and CNR of microvascular blood flow images. Case 0 corresponds to the original breast data with no prior or simulated motion.
MBF imaging of thyroid nodules is typically impacted by motion due to pulsations of the carotid artery. Figures 6 and 7 display two examples of thyroid MBF imaging and its respective LSTC images. (a) displays the sonogram of the thyroid nodules that were observably hypoechoic across all examples. (b) displays the motion corrupted MBF image, as evident from the corresponding STCM (d) and LSTC image (f), estimated prior to any motion correction. (c) displays the motion‐corrected MBF image, which is accompanied by an increase in ensemble coherence as observed in the corresponding STCM (e) and LSTC (g) image. Further, the presence of motion in the Doppler ensemble was also confirmed based on 2D speckle tracking (h‐k). The global STCMs are estimated corresponding to the pixels in the lesion area, demarcated by an experienced sonographer. Presence of tissue motion was evident in the STCMs, and its impact on ensemble coherence was visible in the LSTC image. Particularly, the LSTC images displayed that the superficial tissue incurred high coherence and were unaffected by the carotid pulsations, whereas correlation in the nodule area were visibly low. The corresponding MBF images (b) displayed visible signal degradation in the nodule area due to ensemble motion. (h,i) display the average axial and lateral displacements associated with the nodule area, corresponding to each consecutive frame‐pair. (j,k) display the axial and lateral displacements in (h,i) cumulated with reference to the first frame. The periodic pulsations in the displacement estimates were consistent with the pattern of correlation visible in respective the STCM. The cumulated displacement estimates in (j,k) were used for motion correction of the acquired Doppler ensemble. The STCMs associated with motion‐corrected Doppler ensemble depicting relatively increased frame similarity. Correspondingly, the motion‐corrected LSTC images displayed an increase in ensemble coherence, especially in the nodule region that was selected for motion correction. The resultant MBF image estimated from the motion‐corrected Doppler ensemble displayed a noticeable improvement in the visualization of the blood vessels, consistent with an increase in ensemble coherence observed in the corresponding LSTC images. Further, the bright superficial layers typically observed in the power Doppler MBF images (d,k) are due to inadequate tissue signal suppression with SVD‐based spatiotemporal clutter filtering. However, since the STCM and LSTC images are estimated prior to tissue signal suppression (Figs. 1 and 2), it is unaffected by the performance or type of tissue clutter filtering.
Fig. 6.
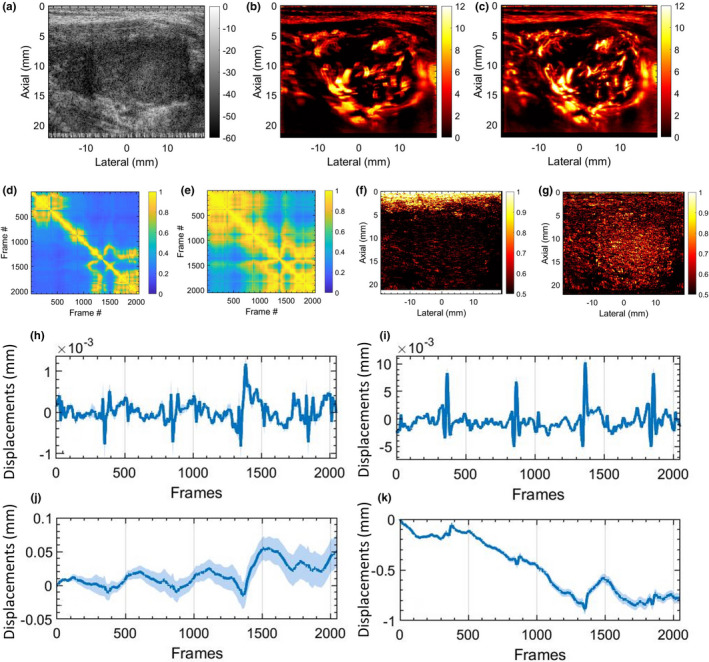
In vivo thyroid results with motion correction. (a) displays the thyroid sonogram. (b) displays the corresponding microvascular blood flow (MBF) image, corrupted with motion artifacts. (c) displays the motion‐corrected MBF image with reduced motion artifacts. (d,e) display the corresponding spatiotemporal correlation matrix, before and after motion correction, respectively. (f,g) displays the corresponding local spatiotemporal correlation images, before and after motion correction, respectively. (h,i) display the mean axial and lateral displacements estimated in the lesion area, between consecutive frame pairs. (j,k) display the accumulated axial and lateral displacement estimates, with respect to the first ensemble frame. The continuous error bars in (h‐k) correspond to 1 standard deviation of the displacement estimates in the lesion area.
Fig. 7.
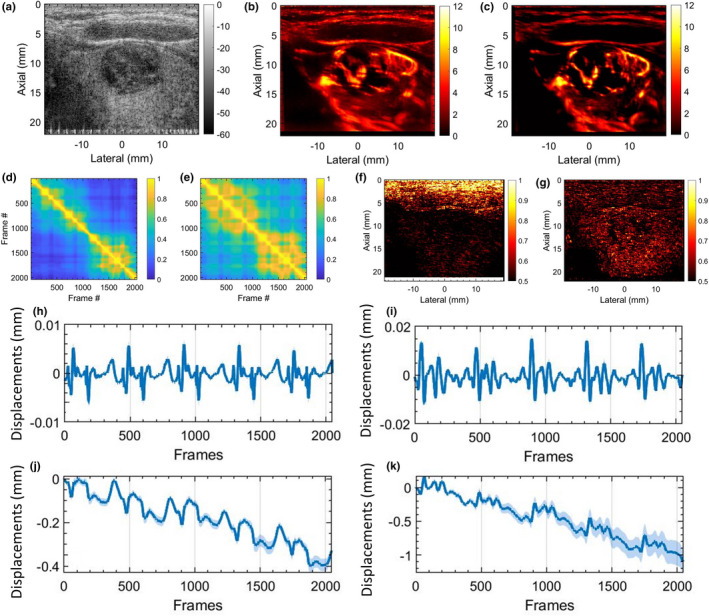
In vivo thyroid results with motion correction. (a) displays the thyroid sonogram. (b) displays the corresponding microvascular blood flow (MBF) image, corrupted with motion artifacts. (c) displays the motion‐corrected MBF image with reduced motion artifacts. (d,e) display the corresponding spatiotemporal correlation matrix, before and after motion correction, respectively. (f,g) displays the corresponding local spatiotemporal correlation images, before and after motion correction, respectively. (h,i) display the mean axial and lateral displacements estimated in the lesion area, between consecutive frame pairs. (j,k) display the accumulated axial and lateral displacement estimates, with respect to the first ensemble frame. The continuous error bars in (h‐k) correspond to 1 standard deviation of the displacement estimates in the lesion area.
Figure 8 displays additional examples of thyroid MBF imaging. Examples 1–3 are displayed in Rows 1–3, respectively. Column 1 displays the thyroid sonogram with both hyperechoic and hypoechoic lesions. Columns 2 and 3 display the corresponding LSTC images depicting ensemble coherence without and with motion correction, respectively. Columns 4 and 5 display the corresponding MBF images, without and with motion correction. The presence of motion is evident in the thyroid MBF images (d,i,n,s,x) that are visibly corrupted with motion artifacts. The corresponding LSTC images (b,g,l,q,v) displayed low ensemble coherence, especially in the thyroid region. However, the motion‐corrected LSTC images displayed higher ensemble coherence in the lesion area that was consistent with improvement in the MBF image visualization. These results are quantitatively summarized in Fig. 11.
Fig. 8.
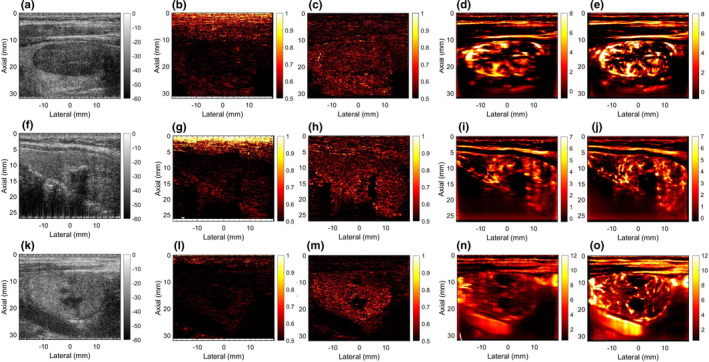
Rows 1–3 display five examples of thyroid microvascular blood flow (MBF) imaging, respectively. Column 1 displays the sonogram. Column 2 and 3 display the local spatiotemporal correlation images estimated without and with motion correction, respectively. Columns 4 and 5 display the MBF images estimated without and with motion correction, respectively.
Fig. 11.
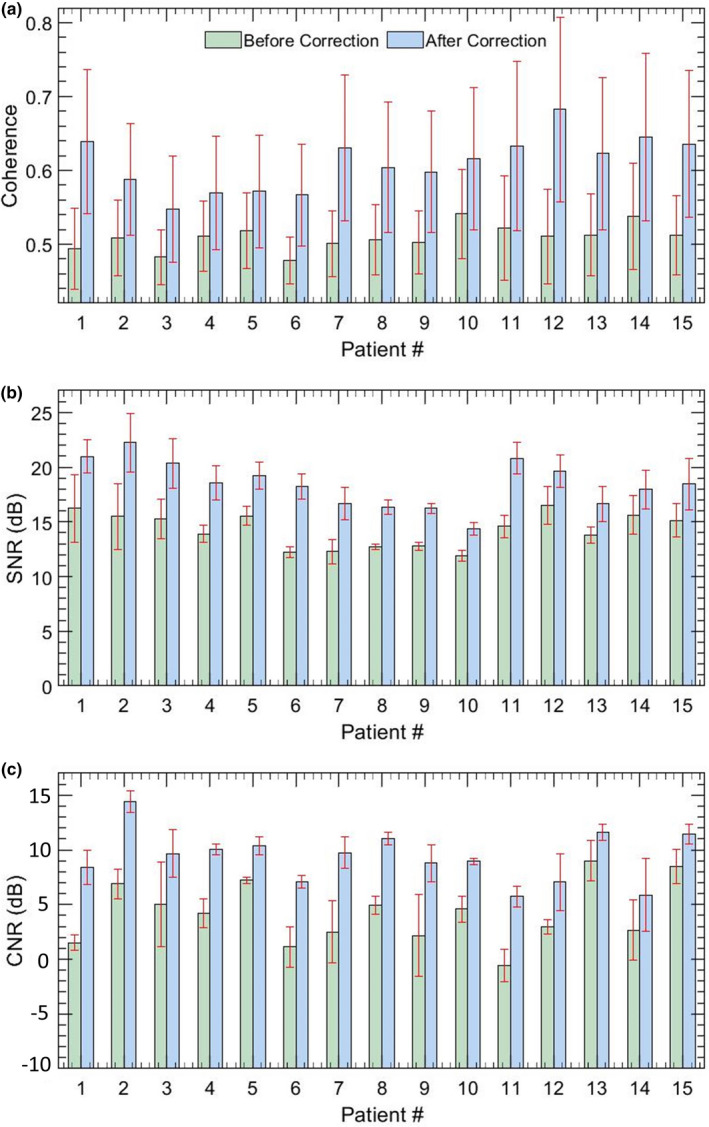
Quantitative estimates of microvascular blood flow image quality for 15 in vivo thyroid patients. Barplots (a,b) display the mean and 1 standard deviation of SNR and CNR measured without and with motion correction.
Figure 9 displays two representative examples of MBF imaging for breast lesions. Rows 1 (a–d) and 2 (e–h) correspond to lesions 1 and 2, respectively. (a,e) display the sonograms, (b,f) display the STCM corresponding to the breast lesion. (c,g) display the LSTC images with high spatial correlation. (d,h) display the MBF images that display a rich vascular network of blood vessels and no visible motion artifacts. The LSTC images displayed a relatively high ensemble coherence, consistent with the respective STCMs that detected negligible prior motion. Further, comparison between the two instances of breast data indicated that the one with the lowest impact of motion (f) corresponded with the highest measures of LSTC values (g).
Fig. 9.
Two representative examples of breast microvascular blood flow (MBF) imaging are displays in Rows 1 and 2, respectively. (a,e) display the breast sonograms. (b,f) display the spatiotemporal correlation matrix (STCM) images quantifying temporal coherency of the Doppler ensemble with respect to the lesion area. (c,g) display the STCM images quantifying spatial coherency of the Doppler ensemble across the entire imaging plane. (d,h) display the respective MBF images.
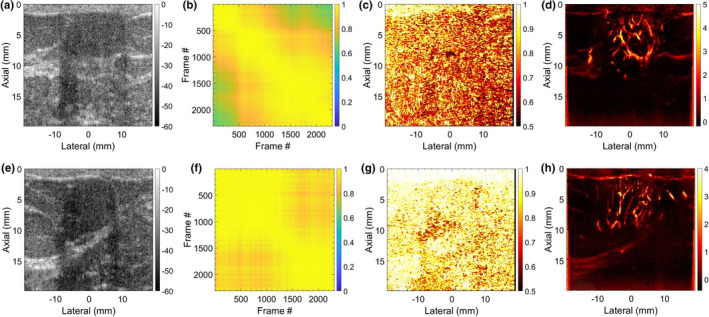
Figure 10 shows two representative examples of renal MBF imaging, displayed in Rows 1(a–d) and 2(e–h), respectively. Unlike the previous in vivo examples of superficial tumors in thyroid and breast at depths 4 cm, the renal blood vessels are located at increased depths of up to 8 cm, and are imaged using a low frequency curved array. (a,e) display the scan converted sonograms; (b,f) display the STCMs associated renal ROI identified in corresponding sonograms (a,e); (c,g) display the corresponding scan converted LSTC images, and (d,h) display the corresponding scan converted MBF images. The LSTC image in (c) displays a relatively higher ensemble coherence in the region of interest, compared to (g). This is consistent with the evidence of frame decorrelation in the STCM of (f), relative to (b). Specifically, frames 1–235 and 236–1024 display high inter frame but low intra frame correlation in the STCM (f), suggesting presence of motion. (i,j) display the corresponding MBF images obtained using frames 236–1024 and 1–235, respectively; (j) displays low blood flow intensity relative to (i), which is expected due to the lower count of coherent frames. The misregistration of the ensemble frames can be identified in (i,j) with respect to the blue‐outline that is estimated from (i) and overlaid on both (i,j).
Fig. 10.
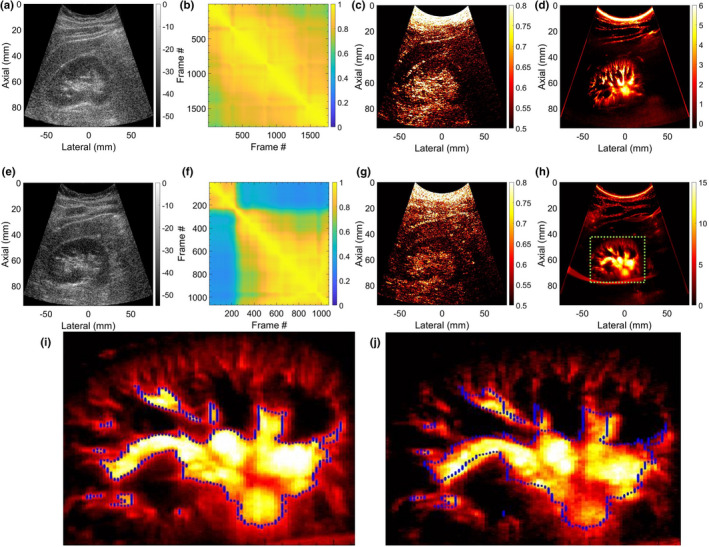
Two representative examples of scan converted renal microvascular blood flow (MBF) imaging using a curved array probe are displayed in Rows 1 and 2, respectively. (a,e) display the scan converted sonograms of the kidney. (b,f) display the spatiotemporal correlation matrix images quantifying temporal coherency of the Doppler ensemble with respect to the pixels corresponding to the renal area. (c,g) display the scan converted local spatiotemporal correlation images quantifying spatial coherency of the Doppler ensemble across the entire imaging plane. (d,h) display the respective scan converted renal microvascular blood flow (MBF) images. (i,j) correspond to MBF images of the second renal example (e‐h), estimated by integrating frames (236‐2064,1‐235) of the clutter‐filtered Doppler ensemble, respectively. The blue outline display the lack of registration between the MBF images (i,j), even though estimated from the same ensemble.
Figure 11 quantifies the ensemble coherence (a) and the quality of the MBF images (b,c) for the 15 in vivo thyroid nodules imaged in this pilot study. (a) The barplots display the mean and 1 standard deviation of the LSTC images estimated in the lesion area, without (green) and with (blue) motion correction. A distinct improvement in the ensemble coherence was observed with respect to motion correction in(a), for all thyroid cases. Correspondingly, the SNR (b) and CNR (c) barplots displayed substantial improvement in image quality upon motion correction. The SNR and CNR metrics were estimated from three ROI selected from the MBF image.5
Figure 12 displays the feasibly of estimating the LSTC image from a temporally downsampled ensemble. The two thyroid nodules considered for this analysis (a‐h) and (i‐p) correspond to those in Figs. 6 and 7, respectively. Sub‐figures (a,c‐e,i,k‐m) and (b,f‐h,j,n‐p) correspond to LSTC images obtained without and with motion correction, respectively. LSTC images were estimated from the ensemble temporally downsampled from 100 to 10. In example 1 (a–h): (a,b) display the mean and 1 standard deviation of the LSTC images derived from reduced ensembles; the error bars correspond to variation in mean across 10 instances of random sampling. Specifically, (c,d,e) and (f,g,h) display the representative LSTC images corresponding to (10,50,100) of ensemble frames. Similarly, in example 2 (i‐p): (i,j) display the mean and 1 standard deviation of the LSTC images derived from reduced ensembles. (c,d,e) and (f,g,h) display representative LSTC images estimated using (10,50,100) of ensemble frames.
Fig. 12.
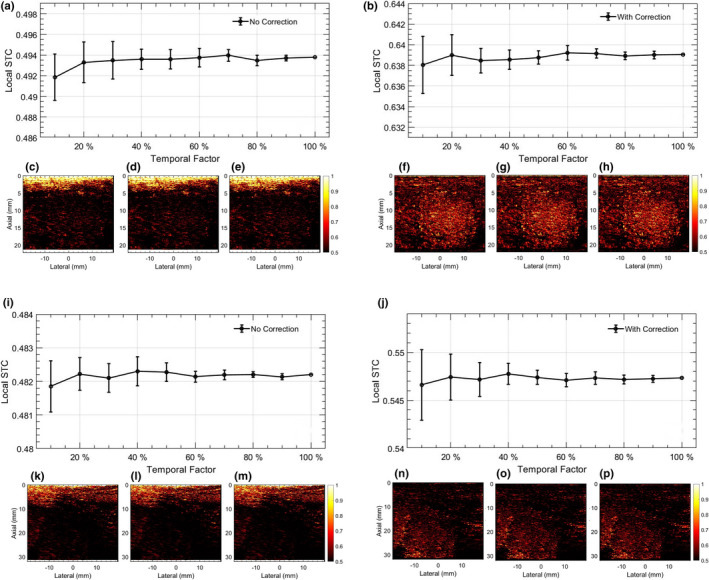
Impact of estimating local spatiotemporal correlation (LSTC) image from temporally downsampled Doppler ensemble. (a‐h) and (i‐p) corresponds to two examples of in vivo thyroid microvascular blood flow imaging, displayed in Figs. 6 and 7, respectively. Left and right columns of each thyroid example correspond to the Doppler ensemble without and with motion correction, respectively. The line‐plots (a,b,i,j) display the mean LSTC estimated from a temporally downsampled ensemble, with 10–100 of Doppler frames. Error bars are estimated across 10 random sampling of temporal frames from the Doppler ensemble. (c,f,k,n), (d,g,l,o), and (e,h,m,p) display representative LSTC images obtained with 10, 50, and 100 of ensemble frames. Color bar for (c‐h) and (k‐p) are uniform.
Analogous to Figs. 12 and 13 displays the feasibility of estimating the STCM from a spatially downsampled ROI. Specifically, STCM is estimated from fewer lesion ROI pixels that were indexed randomly. The spatial downsampling factor was varied from 100 to 10 of the ROI pixels. The two thyroid nodules considered in this analysis (a‐h) and (i‐p) correspond to those in Figs. 6 and 7, respectively. Subplots (a,c‐e,i,k‐m) and (b,f‐h,j,n‐p) correspond to MM estimated without and with motion correction, respectively. In example 1 (a‐h): (a,b) display mean of the STCM estimated from downsampled ROI; the error bars correspond to variation in mean across 10 random samplings. Images in (c,d,e) and (f,g,h) display representative STCMs corresponding to (10,50,100) of ROI pixels. Similarly, in example 2 (i‐p): (i,j) display the mean of the STCM derived from downsampled ROI; the error bars correspond to variation in mean across three random samplings of the ROI pixels. Images in (c,d,e) and (f,g,h) display representative STCMs corresponding to (10,50,100) of ROI pixels.
Fig. 13.
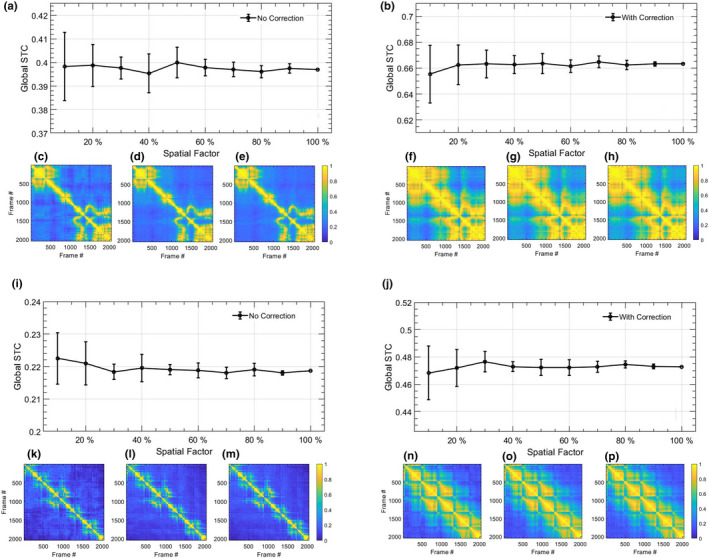
Impact of estimating spatiotemporal correlation matrix (STCM) from spatially downsampled Doppler ensemble. (a‐h) and (i‐p) corresponds to two examples of in vivo thyroid microvascular blood flow imaging, displayed in Figs. 6 and 7, respectively. Left and right columns of each thyroid example correspond to the Doppler ensemble without and with motion correction, respectively. The line‐plots (a,b,i,j) display the mean STCM estimated from a downsampled lesion ROI, with 10–100 of pixel density. Error bars are estimated across 10 random sampling of the ROI data points. (c,f,k,n), (d,g,l,o), and (e,h,m,p) display representative STCM images obtained with 10, 50, and 100 of ROI pixels. Color bar for (c‐h) and (k‐p) are uniform.
Qualitatively, the LSTC images and STCMs obtained from randomly down‐sampled ensembles in Figs. 12 and 13 displayed negligible differences with respect to that obtained using the full ensemble (c‐h,l‐p). Quantitatively, plots (a,b,i,j) displayed a relative increase in the standard deviation with reduction in ensemble samples, although the mean LSTC and STCM values were comparable. The results obtained from downsampled ensembles demonstrate that even with 10 frames (205/2048), the proposed metric can be reliably estimated with reference to that obtained with full ensembles. Accordingly, the proposed technique can be expected to work reliably in estimating ensemble coherence associated with smaller ensembles, which could be due to low imaging frame rate or small image acquisition buffer, etc.
4. DISCUSSION
Quantitative assessment of ensemble coherency can be useful in evaluating the impact of tissue motion on the MBF signal visualization and reliability of MBF images. In this paper, we hypothesize that the local spatiotemporal correlation image will serve as a quantitative indicator of MBF image quality with respect to co‐registered temporal integration of the Doppler ensemble.
The in vivo breast data displayed negligible prior motion [Fig. 3(b)], which corresponded with high ensemble coherence as visualized in the LSTC image [Fig. 3(c)]. The respective MBF image [Fig. 3(a)] was free of motion related artifacts, and thus displayed a dense network of small vessels. These observations were consistent with other examples of breast lesion imaging [Fig. 9], that is, lack of tissue motion, as depicted in the STCM [Figs. 9(b) and 9(f)] corresponded with high ensemble coherence [Figs. 9(c) and 9(g)]. Further, of the two breast examples in (Fig. 9), the one with the lowest ensemble motion (f) demonstrated the highest ensemble coherence (g).
The simulation analysis performed on the in vivo breast data specifically demonstrated the impact of motion of different magnitudes on: (a) the coherence of the Doppler ensemble, and (b) the quality of MBF images (Figs. 3 and 5). Increases in tissue motion [Figs. 3(e)–3(h)] degraded the coherency of the Doppler ensemble, which was visible in the respective LSTC images [Figs. 3(i)–3(l)]. The corresponding MBF images [Figs. 3(m)–3(p)] estimated from incoherent Doppler ensembles were substantially corrupted with motion artifacts, as noted in comparison with the original MBF image [Fig. 3(d)]. Further, the simulation study also demonstrates the sensitivity of the STCM in detecting motion in the Doppler ensemble, which was applied locally to generate the LSTC image. The qualitative assessment of the impact of motion on ensemble coherency and MBF image quality was consistent with the quantitative results; increased ensemble motion reduced mean LSTC from 0.81 to 0.47 [Figs. 5(a) and 5(b)], and correspondingly degraded image SNR from 9.37 to 1 dB and CNR from 5.43 to −8.16 dB [Figs. 5(c) and 5(d)].
Motion correction served as an effective approach in improving ensemble coherence. However, lack of a method to quantify ensemble coherency in MBF imaging limited our assessment of the effectiveness of motion correction and the determination of the optimum tracking parameters. The LSTC images associated with in vivo thyroid examples (Figs. 6 and 7) demonstrated low ensemble coherence (b), prior to motion correction. The loss in coherence was attributable to the presence of ensemble motion as evident in (e‐h) and the respective STCMs (b). Correction of ensemble motion substantially improved the coherence of the Doppler ensemble (j), which led to higher quality MBF images (k). Particularly, the LSTC images (j) show a visible improvement in the nodule area. The value of motion correction in thyroid MBF imaging can be further appreciated in Fig. 8. In all the thyroid examples, visualization of the MBF images improved with increased coherence of the Doppler ensemble. This observation was consistent with the quantitative results in Fig. 11. However, due to rigid body‐based global motion correction, the improvement in the LSTC image was specifically observed in the lesion area, which was the region of interest for MBF imaging. The extent of increase in ensemble coherence upon motion correction varied across the instances of thyroid data (Figs. 6, 7, 8). For example, the improvement in LSTC upon motion correction was visibly higher in Fig. 6 compared to Fig. 7, as also observed in Fig. 11(a) for patients 1 and 2, respectively; such an assessment was not possible in previous studies.5, 9 It is important to note that LSTC may serve as an effective indicator of ensemble coherence for robust MBF imaging, however, the extent of improvement in ensemble coherence upon motion correction [Fig. 11(a)] will depend on (a) the efficacy of the ultrasound speckle‐tracking technique in estimating in‐plane motion, and (b) the presence of elevational out‐of‐plane motion.9 Further, the STCM metric can identify frames that were not successfully motion corrected, which could be due to elevational motion, poor choice of motion tracking parameters or speckle decorrelation. This will enable rejection of frames that were not successfully motion corrected, therefore improving the accuracy of the blood flow measurement. Additionally, the proposed quantitative metric will enable optimization of motion tracking and correction parameters for high‐quality blood flow imaging.
In contrast to tracking of ensemble motion and its correction, imaging at high frame rates can be a straight‐forward solution for estimating MBF images from highly coherent ensembles. Plane wave transmissions are typically used for ultrafast imaging,23 as was the case in this study. However, with the need to compound multiple plane wave images to improve image quality, safety‐related limitations with respect to tissue heating and factors corresponding to imaging depth (location, orientation, and size of lesion) can adversely impact imaging frame rates.23, 33 Further, the capability of high frame rate imaging is limited to high‐end ultrasound machines. In the current study, all thyroid lesions were imaged at frame rates of 600–700 Hz, nonetheless, the impact of carotid motion on the acquired Doppler ensemble coherence and MBF imaging was substantial. The source of motion is not limited to physiological and anatomical factors and can also be due to the sonographer's hand or patient's body motion. This can be observed in examples of in vivo renal MBF imaging [Fig. 10]. Example 1 demonstrated a highly coherent ensemble [Fig. 10(c)], with negligible tissue motion [Fig. 10(b)], indicating [Fig. 10(d)] to be a reliable renal MBF image with no motion artifacts. However, the LSTC image of example 2 demonstrated relatively lower coherence, since it was impacted by the sonographer's hand motion at around frame‐count 235 [Fig. 10(f)]. The misregistration of Doppler frames is also evident in the respective sub‐ensemble MBF images in [Figs. 10(i) and 10(j)], which if combined together can lead to inaccurate assessment of the vessel diameter.
Quantitative evaluation of MBF vascular morphology estimated from coherent Doppler ensembles will be less impacted by tissue motion and thus can be expected to be highly reproducible. For example, the results associated with kidney 1 can be repeatedly reproduced due to its high ensemble coherence, however, such a prediction cannot be made for example 2, owing to the impact of tissue motion on ensemble coherence. Further, since LSTC is normalized between 0 and 1, the coherence estimates can be compared across different tumors, glands and organs (breast, thyroid, kidney). For example, the results of in vivo studies reveal that thyroid MBF images can be less reproducible, given the impact of carotid motion on its ensemble coherence (Figs. 6, 7, 8, 11).9, 34, 35 Comparatively, breast lesions demonstrated higher coherence, which can be associated with better reproducibility (Fig. 9). Further, the proposed quantitative metric can be valuable in large‐scale patient studies in addressing discrepancies arising from ensemble motion, and in assessing the reproducibility of the results from the stand‐point of coherence of the acquired Doppler ensemble. Quantifying ensemble coherency using LSTC can be useful for imaging of both superficial and deep‐seated organs (Figs. 6, 7, 8, 9, 10). The choice of using the Pearson correlation coefficient as the metric to quantify ensemble coherence is consistent with its well‐reported applications in high‐quality motion tracking of ultrasound frames. However, this choice of similarity metric for computing the motion matrix is not limited to the correlation coefficient and can be chosen from a variety of metrics.10, 36 The scope of using LSTC as a performance descriptor for motion correction is independent of the choice of the speckle tracking technique, and can be readily used in comparing performance across different techniques. Further, it is feasible to use a 1D motion tracking technique, however, given the large component of lateral motion in thyroid lesions due to carotid pulsations, a 2D motion tracking technique would be necessary for effectively improving ensemble coherency.
Temporal misregistration of the Doppler frames owing to tissue motion diminishes ensemble coherency, which leads to weak integration of the flow signal. This leads to sub‐optimal estimation of the power Doppler signal that can result in misleading MBF images without any forewarning or indication; therefore, it is important to assess ensemble coherence. Further, in the current framework of 2D ultrasound imaging, it is imperative to detect and reject ensemble frames incurring out‐of‐plane motion, which would otherwise lead to sub‐optimal MBF imaging, without any indication or forewarning. The proposed ensemble coherence metric—estimated using correlation analysis of tissue speckle—is sensitive to phase mismatch of the ultrasound speckle signal, regardless of its type (i.e., due to in‐plane or out‐of‐plane motion). Specifically, in case of in‐plane motion, the phase mismatch can be accurately tracked in local kernels and motion corrected. However, in the case of out‐of‐plane motion, the phase mismatch cannot be addressed using motion tracking and correction due to lack of sufficient information in the third dimension. Accordingly, estimation of the proposed coherence metric subsequent to motion correction can be helpful in identifying frames that failed motion correction, which could typically be due to out‐of‐plane motion or poor ultrasound signal‐to‐noise ratio. In our previous study,10 we used an SVD‐based singular value decay rate approach to indirectly assess the impact of motion on ensemble coherence and its corresponding change with respect to motion correction. In comparison, the novel metric proposed in this study directly quantifies ensemble coherency in terms of a normalized correlation in the scale 0–1 or 0–100, spatially across the imaging plane. High and low ensemble coherency indicates if the MBF image will be free of or corrupted with motion artifacts, respectively. In this context, an important question is: What is the impact of poor tissue clutter filtering on the proposed coherence metric? Specifically, since the proposed metric is estimated prior to tissue clutter filtering [as outlined in Fig. 1(b)], its estimation is independent of tissue‐clutter filtering. Therefore, sub‐optimal tissue clutter filtering will have no impact on its outcome. However, it is true that poor tissue clutter filtering will hamper the quality of MBF images, and additional metrics are needed to quantify its impact on MBF imaging.
With an increase in ensemble coherency, a correlated increase in standard image quality metrics is expected [Figs. 5 and 11]. However, even though the LSTC metric is determined primarily based on ensemble motion, the CNR and SNR values depend on microvascular morphology and flow characteristics. For example, large vessels with increased flow will correspond to a higher intensity Doppler signal, thus depicting high SNR and CNR values, whereas smaller vessels will demonstrate the opposite trend. Further, changes in CNR and SNR values with respect to ensemble coherence will also vary with respect to vessel characteristics. For example, high‐intensity vessels that are less impacted by motion would show smaller improvement in CNR and SNR metrics with motion correction, compared to low‐intensity vessels that are heavily dependent on co‐registered temporal integration of the Doppler signal. Accordingly, even for the same ensemble, the LSTC metric could map to several variations in CNR and SNR values, which limits the scope of performing a meaningful correlation analysis.
Figure 12 demonstrates the impact of ensemble size on estimation of the LSTC image. The analysis performed using thyroid examples reveals that the LSTC image can be reliably estimated from randomly downsampled ensembles, with even 10 of acquired Doppler frames. For coherent ensembles with low rank and higher ensemble redundancy (e.g., breast), we expect that the LSTC image can be estimated with even fewer frames. This finding has two important implications: (a) the scope of using LSTC as an ensemble coherence estimator for MBF imaging is not limited to instances of large ensembles, but can also be effectively used in coherence assessment of smaller ensembles (a,b,i,j). The need and relevance for estimating MBF from small ensembles may vary depending on constraints on imaging frame rate, acquisition time, or due to frame rejection in event of out‐of‐plane motion. (b) The computational efficiency of estimating the LSTC image, specifically for large ensembles, can be improved without a trade‐off in signal quality (c‐e,f‐h,k‐m,n‐p). Similarly, Fig. 13 demonstrates the feasibility of estimating STCM, which was used for detection of ensemble motion from randomly downsampled ROI pixels.
The proposed metric has an important role in translating MBF imaging for clinical diagnosis, with respect to assessing ensemble coherency: (i) Motion can lead to a misleading diagnosis without any forewarning or indication. This can result in underestimation of vascular density due to relatively easy degradation of small vessel signals, limiting visualization to larger vessels. However, under certain circumstances, it can also lead to overestimation of vascular density due the appearance of spatially replicated shadow vessels arising from motion‐induced frame misregistration. (ii) In the absence of real‐time feedback on ensemble coherence, motion can inadvertently lead to poor reproducibility and repeatability of MBF imaging, limiting its scope in the clinic. (iii) Our previous studies demonstrated that motion tracking and correction can considerably improve the performance of MBF imaging. Specifically, inter frame axial and lateral displacements estimated using speckle tracking were used for temporal registration of the clutter‐filtered Doppler frames to allow co‐registered integration of the ensemble. Methods for quantifying ensemble coherency can be useful in assessing the efficacy of motion correction, and lead to optimizing parameters for motion tracking. Currently there are no other metrics that directly quantify ensemble coherence in ultrasound MBF imaging.
A limitation of the current study is that although the axial and lateral displacements were estimated locally across the entire imaging plane; however, motion correction was performed with respect to the lesion with assumptions of rigid body translation. Since the variance of the averaged frame‐to‐frame displacements in the lesion ROI were low [Figs. 6(e) and 6(f), 7(e) and 7(f)] such an approach could be reliably used in this preliminary investigation.11, 12 However, it is important to note that the current displacement tracking and motion correction approach may not be optimal as the LSTC values for the motion‐corrected thyroid data was still considerably lower than the breast data [Fig. 11]. In future studies, we will use the ensemble coherence metric to optimize the displacement tracking technique, particularly with regards to (a) the choice of reference frame for motion correction, (b) dynamic frame‐pairing to effectively estimate motion in high frame rate ensembles, and (c) rejection of frames incurring out‐of‐plane motion to improve the coherence and visualization of MBF imaging. Further, we will develop the capability for local motion correction involving smaller, overlapping kernels that can be reasonably assumed to incur uniform displacements.
5. CONCLUSION
Ensemble coherency is an important factor that governs the performance of contrast‐free MBF imaging. The results of this pilot study demonstrated that the local spatiotemporal correlation image can quantify ensemble coherence for robust MBF imaging. We conclude that the proposed metric for estimating ensemble coherence performs sufficiently well to warrant further development and more in vivo validation.
CONFLICT OF INTEREST
The authors have no financial conflict of interest to disclose related to the content of this article.
ACKNOWLEDGMENTS
This study was supported by National Institutes of Health (NIH) grants, R01HL148664, R01CA239548, R01EB17213 and R01CA195527. The content is solely the responsibility of the authors and does not necessarily represent the official views of NIH. The authors are grateful to Dr. Sonia Watson, PhD for her editorial help
DATA AVAILABILITY STATEMENT
The data that support the findings of this study are available from the corresponding author upon reasonable request.
REFERENCES
- 1.Martinoli C, Derchi L, Rizzatto G, Solbiati L. Power Doppler sonography: general principles, clinical applications, and future prospects. Eur Radiol. 1998;8:1224–1235. [DOI] [PubMed] [Google Scholar]
- 2.Vaupel P, Kallinowski F, Okunieff P. Blood flow, oxygen and nutrient supply, and metabolic microenvironment of human tumors: a review. Cancer Res. 1989;49:6449–6465. [PubMed] [Google Scholar]
- 3.Demené C, Pernot M, Biran V, Alison M, Fink M, Baud O, Tanter M. Ultrafast Doppler reveals the mapping of cerebral vascular resistivity in neonates. J Cerebral Blood Flow Metabol. 2014;34:1009–1017. [DOI] [PMC free article] [PubMed] [Google Scholar]
- 4.Ghavami S, Bayat M, Fatemi M, Alizad A. Quantification of morphological features in non‐contrast‐enhanced ultrasound microvasculature imaging. IEEE Acc. 2020;8:18925–18937. [DOI] [PMC free article] [PubMed] [Google Scholar]
- 5.Nayak R, Kumar V, Webb J, Gregory A, Fatemi M, Alizad A. Non‐contrast agent based small vessel imaging of human thyroid using motion corrected power Doppler imaging. Sci Rep. 2018;8:15318. [DOI] [PMC free article] [PubMed] [Google Scholar]
- 6.Alfred C, Lovstakken L. Eigen‐based clutter filter design for ultrasound color flow imaging: a review, IEEE Trans Ultrason Ferroelectr Freq Control. 2010;57:1096–1111. [DOI] [PubMed] [Google Scholar]
- 7.Bjaerum S, Torp H, Kristoffersen K. Clutter filter design for ultrasound color flow imaging. IEEE Trans Ultrason Ferroelectr Freq Control. 2002;49:204–216. [DOI] [PubMed] [Google Scholar]
- 8.Demené C, Deffieux T, Pernot M, et al. Spatiotemporal clutter filtering of ultrafast ultrasound data highly increases Doppler and fUltrasound sensitivity. IEEE Trans Med Imaging. 2015;34:2271–2285. [DOI] [PubMed] [Google Scholar]
- 9.Nayak R, Nawar N, Webb J, Fatemi M, Alizad A. Impact of imaging cross‐section on visualization of thyroid microvessels using ultrasound: Pilot study. Sci Rep. 2020;10:1–9. [DOI] [PMC free article] [PubMed] [Google Scholar]
- 10.Nayak R, Kumar V, Webb J, Fatemi M, Alizad A. Non‐invasive Small vessel imaging of human thyroid using motion‐corrected spatiotemporal clutter filtering. Ultrasound Med Biol. 2019;45:1010–1018. [DOI] [PMC free article] [PubMed] [Google Scholar]
- 11.Hingot V, Errico C, Tanter M, Couture O. Subwavelength motion‐correction for ultrafast ultrasound localization microscopy. Ultrasonics. 2017;77:17–21. [DOI] [PubMed] [Google Scholar]
- 12.Foiret J, Zhang H, Ilovitsh T, Mahakian L, Tam S, Ferrara KW. Ultrasound localization microscopy to image and assess microvasculature in a rat kidney. Sci Rep. 2017;7:13662. [DOI] [PMC free article] [PubMed] [Google Scholar]
- 13.Tierney J, Coolbaugh C, Towse T, Byram B. Adaptive clutter demodulation for non‐contrast ultrasound perfusion imaging. IEEE Trans Med Imaging. 2017;36:1979–1991. [DOI] [PMC free article] [PubMed] [Google Scholar]
- 14.Bude RO, Rubin JM. Power Doppler sonography. Radiology. 1996;200:21–23. [DOI] [PubMed] [Google Scholar]
- 15.Mace E, Montaldo G, Osmanski B‐F, Cohen I, Fink M, Tanter M. Functional ultrasound imaging of the brain: theory and basic principles. IEEE Trans Ultrason Ferroelectr Freq Control. 2013;60:492–506. [DOI] [PubMed] [Google Scholar]
- 16.Viola F, Walker WF. A comparison of the performance of time‐delay estimators in medical ultrasound. IEEE Trans Ultrason Ferroelectr Freq Control. 2003;50:392–401. [DOI] [PubMed] [Google Scholar]
- 17.Trahey GE, Allison JW, Von Ramm OT. Angle independent ultrasonic detection of blood flow. IEEE Trans Biomed Eng. 1987:965–967. [DOI] [PubMed] [Google Scholar]
- 18.Ophir J, Alam SK, Garra B, et al. Elastography: imaging the elastic properties of soft tissues with ultrasound. J Med Ultrason. 2002;29:155. [DOI] [PubMed] [Google Scholar]
- 19.Greenleaf JF, Fatemi M, Insana M. Selected methods for imaging elastic properties of biological tissues. Ann Rev Biomed Eng. 2003;5:57–78. [DOI] [PubMed] [Google Scholar]
- 20.Parker KJ, Doyley MM, Rubens DJ. Imaging the elastic properties of tissue: the 20 year perspective. Phys Med Biol. 2010;56:R1. [DOI] [PubMed] [Google Scholar]
- 21.Varghese T, Zagzebski J, Lee F. Elastographic imaging of thermal lesions in the liver in vivo following radiofrequency ablation: preliminary results. Ultrasound Med Biol. 2002;28:1467–1473. [DOI] [PubMed] [Google Scholar]
- 22.Ng GC, Worrell SS, Freiburger PD, Trahey GE. A comparative evaluation of several algorithms for phase aberration correction. IEEE Trans Ultrason Ferroelectr Freq Control. 1994;41:631–643. [Google Scholar]
- 23.Montaldo G, Tanter M, Bercoff J, Benech N, Fink M. Coherent plane‐wave compounding for very high frame rate ultrasonography and transient elastography. IEEE Trans Ultrason Ferroelectr Freq Control. 2009;56:489–506. [DOI] [PubMed] [Google Scholar]
- 24.Denarie B, Tangen TA, Ekroll IK, Rolim N, Torp H, Bjåstad T, Lovstakken L. Coherent plane wave compounding for very high frame rate ultrasonography of rapidly moving targets. IEEE Trans Med Imaging. 2013;32:1265–76. [DOI] [PubMed] [Google Scholar]
- 25.Nayak R, Schifitto G, Doyley MM. Noninvasive carotid artery elastography using multielement synthetic aperture imaging: Phantom and in vivo evaluation. Med Phys. 2017;44:4068–4082. [DOI] [PubMed] [Google Scholar]
- 26.Korukonda S, Nayak R, Carson N, Schifitto G, Dogra V, Doyley MM. Noninvasive vascular elastography using plane‐wave and sparse‐array imaging. IEEE Trans Ultrason Ferroelectr Freq Control. 2013;60:332–342. [DOI] [PubMed] [Google Scholar]
- 27.Go D, Kang J, Song I, Yoo Y. Efficient transmit delay calculation in ultrasound coherent plane‐wave compound imaging for curved array transducers. Appl Sci. 2019;9:2752. [Google Scholar]
- 28.Bayat M, Fatemi M, Alizad A. Background removal and vessel filtering of noncontrast ultrasound images of microvasculature. IEEE Trans Biomed Eng. 2018;66:831–842. [DOI] [PMC free article] [PubMed] [Google Scholar]
- 29.Parker JA, Kenyon RV, Troxel DE. Comparison of interpolating methods for image resampling. IEEE Trans Med Imaging. 1983;2:31–39. [DOI] [PubMed] [Google Scholar]
- 30.Konofagou E, Ophir J. A new elastographic method for estimation and imaging of lateral displacements, lateral strains, corrected axial strains and Poisson's ratios in tissues. Ultrasound Med Biol. 1998;24:1183–1199. [DOI] [PubMed] [Google Scholar]
- 31.Huntzicker S, Nayak R, Doyley MM. Quantitative sparse array vascular elastography: the impact of tissue attenuation and modulus contrast on performance. J Med Imaging. 2014;1: [DOI] [PMC free article] [PubMed] [Google Scholar]
- 32.Nayak R, Fatemi M, Alizad A. Adaptive background noise bias suppression in contrast‐free ultrasound microvascular imaging. Phys Med Biol. 2019;64:245015. [DOI] [PMC free article] [PubMed] [Google Scholar]
- 33.Demene C, Baranger J, Bernal M, et al. Functional ultrasound imaging of brain activity in human newborns. Sci Translat Med. 2017;9:eaah6756. [DOI] [PubMed] [Google Scholar]
- 34.Nayak R, Huntzicker S, Ohayon J, et al. Principal strain vascular elastography: simulation and preliminary clinical evaluation. Ultrasound Med Biol. 2017;43:682–699. [DOI] [PMC free article] [PubMed] [Google Scholar]
- 35.Nayak R, Schifitto G, Doyley MM. Visualizing angle‐independent principal strains in the longitudinal view of the carotid artery: phantom and in vivo evaluation. Ultrasound Med Biol. 2018;44:1379–1391. [DOI] [PMC free article] [PubMed] [Google Scholar]
- 36.Goshtasby AA. Similarity and Dissimilarity Measures, Image Registration. Berlin: Springer. 2012;7–66. [Google Scholar]
Associated Data
This section collects any data citations, data availability statements, or supplementary materials included in this article.
Data Availability Statement
The data that support the findings of this study are available from the corresponding author upon reasonable request.


