

Abstract
Epigenetic programming of cells requires methylation of deoxycytidines (dC) to 5‐methyl‐dC (mdC) followed by oxidation to 5‐hydroxymethyl‐dC (hmdC), 5‐formyl‐dC (fdC), and 5‐carboxy‐dC (cadC). Subsequent transformation of fdC and cadC back to dC by various pathways establishes a chemical intra‐genetic control circle. One of the discussed pathways involves the Tdg‐independent deformylation of fdC directly to dC. Here we report the synthesis of a fluorinated fdC feeding probe (F‐fdC) to study direct deformylation to F‐dC. The synthesis was performed along a novel pathway that circumvents any F‐dC as a reaction intermediate to avoid contamination interference. Feeding of F‐fdC and observation of F‐dC formation in vivo allowed us to gain insights into the Tdg‐independent removal process. While deformylation was shown to occur in stem cells, we here provide data that prove deformylation also in different somatic cell types. We also investigated active demethylation in a non‐dividing neurogenin‐inducible system of iPS cells that differentiate into bipolar neurons.
Keywords: active demethylation, C−C bond cleavage, deformylation, epigenetics, formylcytidine
Investigation of deformylation rates in different cell types and developmental states using a novel synthesis route towards 2′‐F‐fdC shows that deformylation is a wide spread process that is inversely correlated with cell division.

Methylation of dC to 5‐methyl‐dC (mdC) by Dnmt enzymes in higher vertebrates is a means to control the transcriptional activity of genes.[1, 2, 3, 4] Reversing the methylation requires oxidation of mdC to hmdC, fdC, and cadC.[5, 6, 7, 8, 9] These oxidized bases either block maintenance methylation (hmdC), which leads to global replication‐dependent demethylation, or they are removed as nucleosides by the action of the thymine DNA glycosylase (Tdg) repair enzyme (fdC and cadC).[10, 11, 12, 13, 14, 15, 16] Alternatively, a direct deformylation and decarboxylation of fdC and cadC to dC may occur.[17, 18, 19] The advantage of a direct mechanism, in contrast to the Tdg‐repair process, is that it proceeds without the formation of DNA strand breaks.[20, 21] These are known to cause genome instability.[22] We could recently show that fdC is deformylated to dC in stem cells.[17] We have also shown that the nucleophilic attack at the C6 position of fdC is necessary to cleave the C−C bond in a deformylation reaction.[18] Today, it is however still unclear to what extent the deformylation reaction occurs in various cell types. It is also unknown whether this process is influenced by replication. In order to investigate these questions, we performed a series of metabolic feeding studies using a 2′‐fluorinated fdC derivative obtained by a synthetic pathway that circumvents F‐dC as an intermediate. This probe molecule was used to label genomes in different somatic cell types originating from healthy and cancer tissue. For further investigation of active demethylation upon cell differentiation and its dependence on cell replication, additional studies in an iPS cell line system were established.
In order to trace the incorporated fdC probe as well as its deformylation product and to recognize it in front of the background of the abundant genomic dC, a chemical modification of the probe molecule is needed. This can be achieved by incorporating stable isotope labels (13C, 15N, 2H) into the fdC ribose or the fdC heterocycle (not the cleaved‐off formyl group). Another elegant way to achieve the labeling of the nucleoside is to tag the ribose with a 2′‐F atom, which has the additional advantage that the base of this modified nucleoside cannot be removed by base excision repair.[23, 24] In addition, the 2′‐fluorinated dC‐derivatives are recognized by Dnmt and Tet‐enzymes, which means that they can be epigenetically modified (methylated, oxidized, and demethylated). Thus, a feeding probe such as 2′‐F‐fdC (1) is an ideal tool molecule to study active demethylation of mdC. We proved this principle in an in vivo cell system using Tdg knockout mESCs and the respective wildtype line. While the natural genomic fdC levels increase dramatically in the absence of Tdg, the 2′‐fluorinated nucleoside values stay the same in wt and KO (Figure SI‐6) cells, showing that Tdg is unable to remove 2′‐F‐fdC as expected. We also investigated the digestion efficiency of DNA strands containing 2′‐fluorinated nucleosides and found only a small difference compared to non‐fluorinated nucleosides under our conditions.[23, 24]
Since 2′‐fluorinated nucleosides do not undergo Tdg‐mediated repair, feeding of 2′‐F‐fdC (1) to different cell lines gives higher levels of incorporation into the respective genomes (Figure 1 A). Upon deformylation of 2′‐F‐fdC (1), 2′‐F‐dC (2) is formed. This compound can be easily distinguished from genomic dC using an extremely sensitive, non‐high resolution UHPLC‐MS/MS system (Figure 1 B) because of the different retention times, the difference in molecular weight (+18 amu), and a specific fragmentation pattern.
Figure 1.
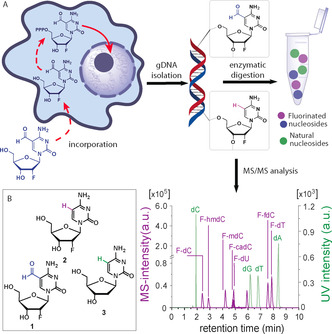
A) Experimental setup and intra‐genomic 2′‐F‐fdC deformylation reaction. The nucleoside is fed to the cells, where it undergoes subsequent phosphorylation in the cytosol, followed by incorporation into gDNA. The extracted gDNA contains the incorporated 2′‐F‐fdC as well as the possible deformylation product 2′‐F‐dC. MS/MS analysis was performed after enzymatic digestion of the gDNA. UHPLC‐MS/MS chromatogram of all nucleosides present in gDNA. Green peaks show the UV intensity of the compounds, while purple signals represent MS‐intensity values. B) The structures of the probe molecules: 2′‐F‐fdC (1), 2′‐F‐dC (2), and natural dC (3).
For feeding experiments, it is essential to synthesize 2′‐F‐fdC (1) via a pathway that avoids 2′‐F‐dC (2) as a synthesis intermediate. Even the smallest contamination of 2′‐F‐fdC (1) with 2′‐F‐dC (2) can lead to false‐positive results. 2′‐F‐dC (2) is taken up by cells as well and incorporated into the genome far more efficiently compared to 2′‐F‐fdC (1).[17] This leads to a strong enrichment of any 2′‐F‐dC (2) impurity and hence potentially to its accumulation during cell division. Therefore, we developed a novel synthesis pathway towards 2′‐F‐fdC (1) exclusively via 2′‐F‐dU intermediates thereby excluding undesired cytidine‐based contaminations (Scheme 1). The synthesis starts with commercially available 2′‐F‐dU (4), which was first TBS‐protected (TBS‐Cl, imidazole), followed by regioselective iodination at C5 to 5 with iodine and (NH4)2[Ce(NO3)6] as the oxidant. A subsequent Pd‐catalyzed Stille‐type formylation (CO, HSnBu3) furnished the 2′‐F‐fdU compound 6. Acetal protection of the formyl group (propanediol, TSA) was followed by amination at C4 to generate the acetal‐protected 2′‐F‐fdC derivative 7. Full deprotection of 7 with 1 m HCl followed by treatment with HF/pyridine to cleave the TBS protection groups furnished the 2′‐F‐dC‐free target compound 1. Subsequent HPLC purification provided 2′‐F‐fdC (1) in a highly pure form. In order to substantiate that the prepared 2′‐F‐fdC (1) is 2′‐F‐dC (2)‐free, we performed a highly sensitive UHPLC‐MS/MS experiment (Scheme 1, inset).
Scheme 1.

Synthesis of 2′‐F‐fdC (1) probe molecule and UHPLC experimental data showing the high purity of 1. a) TBSCl, imidazole, pyridine, rt, 16 h, 91 %. b) I2, (NH4)2[Ce(NO3)6], MeCN, 60 °C, 1 h, 81 %. c) HSnBu3, Pd2(dba)3⋅CHCl3, PPh3, 3.5 bar CO, 60 °C, 18 h, 85 %. d) 1,3‐propanediol, CH(OEt)3, p‐TSA, CH2Cl2, rt, 60 %. e) NaH, 2,4,6‐triisopropylbenzolsulfonylchloride, THF, 0 °C→rt, 16 h, 60 %. f) NH4OH, 1,4‐dioxane, rt, 16 h, 68 %. g) 1 m HCl, H2O/MeCN, rt, 18 h. h) HF/pyridine, EtOAc, rt, 16 h, reversed‐phase HPLC 70 %.
The analysis of the synthetized 2′‐F‐fdC (1) was performed using the highest‐sensitive triple quadrupole MS detector. Under conditions previously developed in our group, it is able to detect 2 in the low fmol range (Table SI‐1).[17] The analysis of the synthesized 2′‐F‐fdC (1) provided no signal between 2.1 and 2.8 min (retention time of potential 2′‐F‐dC 2.3 min), which confirmed the high purity of the synthesized compound. Most importantly, this new synthesis route fully excludes any contamination of 1 with 2′‐FdC (2).
To investigate the deformylation rates in various somatic cell lines and to compare them to mouse embryonic stem cells (mESCs) that we had studied before, respective cultures were grown in the presence of 2′‐F‐fdC (1) at a final concentration of 350 μm (Figure 2). The treatment continued for 3 days in order to allow all cell lines, having different doubling rates, to incorporate the fed compound. The cells were subsequently harvested, DNA was isolated and fully digested using an optimized protocol for the chemically modified nucleosides (see SI).[25] The obtained nucleoside mixture was subsequently analyzed by UHPLC‐MS/MS. Quantification of the 2′‐F‐fdC (1) and 2′‐F‐dC (2) levels as well as of the remethylated species 2′‐F‐mdC (9) was performed using the previously published isotope dilution mass spectrometry technique (Figure SI‐9).[17, 26] First, we noted that the 2′‐F‐fdC probe molecule was incorporated into all tested cells and detectable at levels between 2.1×10⁻⁷ and 5.2×10⁻⁷ molecules per dN (Figure SI‐1).
Figure 2.

Feeding data of 2′‐F‐fdC (1). The right upper part shows the graph with the amounts of fluorinated nucleosides in gDNA after feeding 2′‐F‐fdC (1) to the J1 cell line. The bottom graph shows the different deformylation efficiencies in different cell lines normalized to the lowest deformylating cell line J1. The error bars represent propagated error based on the standard deviation of all biological triplicates.
As noted earlier, beside the fed compound 1 we also found 2′‐F‐dC (2) and, importantly, 2′‐F‐mdC (9) in all cells (Figure 2).[17] We conclude that the deformylation occurred in all investigated cells and that the newly formed 2′‐F‐dC (2) was subsequently re‐methylated by the action of Dnmt enzymes, forming 2′‐F‐mdC (9, Figure 2). This indicates the presence of the chemical genomic cycle dC→mdC→oxdC→dC→mdC in all investigated cell types. Unfortunately, we are not yet able to show the methylation of 2 in the CpG context, as the incorporation of 1 is assumably random. However, the level of methylation of 2′‐F‐dC (2) to 2′‐F‐mdC (9) is with 2–5 % within the expected range (Figure SI‐8B).[27]
Investigation of the deformylation reaction (turnover of 2′‐F‐fdC (1) to 2′‐F‐dC (2)) in different cell lines showed a major variation of this activity (Figure 2). Most interesting is the observation that the previously studied stem cells J1, despite their high proliferation rate, showed the lowest deformylation activity. In order to analyze all the data, we therefore normalized the 2′‐F‐fdC (1) deformylation level of each cell line to J1 mES cells. When analyzing the rates of deformylation, we noticed that they inversely correlate (R 2=0.83) with the rates of cell division (Figure SI‐2A). In general, the cells that divide the fastest are the mESCs. In contrast, R1, J1, and K3 (between 17 and 19 h doubling time) show the lowest deformylation rates, while the cancer‐originating somatic cell lines (with doubling times between 25 and 45 hours) show more efficient deformylation activity. This observation is interesting, as this inverse correlation with cell division could indicate that deformylation is an active process that occurs to a larger extent within resting cells.
We could not correlate the deformylation levels with the activity of Tet enzymes (R 2=0.0005, based on the levels of genomic natural hmdC, Figure SI‐2B). In conclusion, the combined data show that deformylation of 2′‐F‐fdC (1) is abundant in a broad spectrum of cell types. The rate of this process strongly depends on the type of the cell. The observed deformylation process is less efficient in stem cells, while it occurs to high extent in human cancer cell lines that in this study are derived from colon and breast cancer tissue.
We performed a control experiment to evaluate the stability of the fed 2′‐F‐fdC (1) material in the cytosolic nucleoside fraction of the cell and hence under conditions as natural as possible. To this end, the probe 1 was added to the cell culture to achieve its uptake into the cells. Next, after 72 h, we isolated the cytosol containing the soluble nucleosides, extracted the nucleosides and analyzed them by UHPLC‐MS/MS to look for the presence of 1 and the deformylated putative product 2 (Figure SI‐3A). This experiment allowed us to estimate the stability of 1 and to exclude the possibility that the deformylation reaction occurs in the cytosol. If 2 had formed in the cytosol, it would have been able to incorporate into the DNA, obscuring all discussion of intragenomic deformylation. To our delight, we were unable to detect any 2 in the cytosol, which indicates that 1 is stable and that deformylation does not happen outside the genome. This is true within the limit of detection for 2′‐F‐dC (2), which is, however, as low as 3.0 fmol (Table SI‐2). The data together, therefore, again suggest that 2′‐F‐fdC (1) is deformylated after its incorporation into the genome.
Because we detected basic 2′‐F‐fdC (1) levels of 2–5×10⁻⁷/dN in all investigated cellular systems, we sought to find out if these levels can be reduced to zero when replication ceases. To achieve this aim, we conducted an experiment with iPS cells, which stop replication during differentiation towards neurons. This system allows us to study deformylation independently from replication. For the experiment we used the small molecule‐inducible Neurogenin iPS cell line (iNGN cells), which is able to differentiate from the pluripotent state in specific culture conditions (see SI) to cells showing a bipolar neuron‐like morphology after only 4 days. Like other neurons, they stop DNA replication and cell division upon maturation, which enables the study of a dynamic process like deformylation without interference from replication‐dependent incorporation of fresh material. First, the stability of 1 was again examined analogously to the soluble pool extraction experiment with J1 mESCs. Similar to the previous data we found 1 but no traces of 2 after 72 h in the soluble pool of iNGNs, again showing that 1 is not deformylated under our conditions in the active cell extracts (Figure SI‐3B).
To monitor cell division, the cells were fed with a final concentration of 0.5 μm of isotopically labeled dT (13C10‐15N2‐dT, 10). The incorporation of 10 was then traced over time. After initial decrease of the amount of 10 through cell division, we detected stable levels of 10 in the genome of these cells from 48 h post‐induction. This result allows us to conclude that the cells terminate their replication under our conditions after two days from the start of differentiation (Figure SI‐4).
We next performed a double feeding experiment with 2′‐F‐fdC (1) and simultaneously with 13C10‐15N2‐dT (10) as depicted in Figure 3 in order to monitor cell division‐dependent wash‐out of 10. This experiment allows us to check how deformylation progresses upon cessation of cell replication. Quantification of genome‐integrated modified nucleosides and their metabolites within DNA was performed by UHPLC‐MS/MS using the isotope dilution technique (Table SI‐3). The deformylation (a rate of change of 2′‐F‐fdC (1) to 2′‐F‐dC (2) relative to dN) was monitored by pulse feeding the cells at 350 μm final concentration of 1 up to 48 h post‐induction (start of differentiation) and chasing of the values every 4 hours, from 48 h onwards. The data show that the decrease of 2′‐F‐fdC (1) content within the gDNA (Figure SI‐5) continues to a small extent even beyond termination of cell division. We can see that while the levels of 10 in the genome stay constant for the duration of the experiment, the ratios between 2 and 1 increase. Because the total levels of 2 in comparison to 1 are at least 10‐fold higher due to the efficiency of turnover, post 48 hours it is not possible to see a clear rise in 2′‐F‐dC/dN levels. With the knowledge that the deformylation reaction is efficient and occurs already after one hour after incorporation of 1 into the genome, we can assume that the majority of incorporated 2′‐F‐fdC (1) by the 48th hour has already turned over to 2 and 9 (Figure SI‐5).[17] Also, the levels of 2′‐F‐fdC/dN stay constant after 52 h, which further supports the idea that some portion of fdC resides as a (semi)permanent base in the genome. This 2′‐F‐fdC (1) stays hidden in the genome. It seems not accessible for enzymatic processes, potentially because it is situated in condensed chromatin structures.[10, 28, 29, 30, 31, 32, 33] Following these findings, we decided to perform an in vitro experiment to investigate if histones, with their many amine side chains, could be triggering the deformylation process of fdC.[28] This study, however, was negative, which indicates that more is needed than just the presence of lysine side chains to achieve C−C bond cleavage (Figure SI‐7). There is certainly a need for active nucleophiles that are able to attack the C6‐position of 2′‐F‐fdC (1) to promote the reaction.[18]
Figure 3.

Double feeding experiment of 1 and 10 in iNGN cells, which allow the investigation of the deformylation process depending on cell division. Deformylation data and amounts of incorporated 10 at different time points are shown normalized per dN. The error bars represent propagated error based on standard deviation of each measured technical triplicate.
The herein reported data show that the synthesis pathway towards the probe molecule of 2′‐F‐fdC (1) using only 2′‐F‐dU intermediates ensures the best possible purity of the compound for biological feeding experiments. Feeding of the newly synthesized compound shows that deformylation of 2′‐F‐fdC (1) to 2′‐F‐dC (2) occurs inside the genome and that it is a common process in a variety of cell lines that is inversely correlated with the speed of replication. Within differentiating neurons, we were able to show that the vast majority of deformylation occurs before the 48 hour timepoint, which is the moment when the cells stop replicating. Post‐replication, we see stable levels of 2′‐F‐fdC (1) that may be epigenetically relevant, for example, by helping chromatin condensation via Schiff‐base formation with the histones.[10, 28]
Conflict of interest
The authors declare no conflict of interest.
Supporting information
As a service to our authors and readers, this journal provides supporting information supplied by the authors. Such materials are peer reviewed and may be re‐organized for online delivery, but are not copy‐edited or typeset. Technical support issues arising from supporting information (other than missing files) should be addressed to the authors.
Supplementary
Acknowledgements
We thank the people who contributed to the success of this project: Dr. Angie Kirchner, Dr. Katharina Iwan, Dr. Leander Runtsch, and Kerstin Kurz. We thank the Deutsche Forschungsgemeinschaft (DFG, German Research Foundation) for financial support via SFB 1309 (PID 325871075) and SFB 1361 (PID 393547839). This project has received funding from the European Research Council (ERC) under the European Union's Horizon 2020 research and innovation programme (grant agreement n° EPiR 741912). Additional funding was provided by the Volkswagen Foundation (EvoRib). Open access funding enabled and organized by Projekt DEAL.
E. Korytiaková, E. Kamińska, M. Müller, T. Carell, Angew. Chem. Int. Ed. 2021, 60, 16869.
Contributor Information
M. Sc. Eva Korytiaková, http://www.carellgroup.de.
Prof. Dr. Thomas Carell, Email: Thomas.Carell@lmu.de.
References
- 1.Chen C. C., Wang K. Y., Shen C. K., J. Biol. Chem. 2013, 288, 9084–9091. [DOI] [PMC free article] [PubMed] [Google Scholar]
- 2.Okano M., Bell D. W., Haber D. A., Li E., Cell 1999, 99, 247–257. [DOI] [PubMed] [Google Scholar]
- 3.Li E., Bestor T. H., Jaenisch R., Cell 1992, 69, 915–926. [DOI] [PubMed] [Google Scholar]
- 4.Smith Z. D., Chan M. M., Mikkelsen T. S., Gu H., Gnirke A., Regev A., Meissner A., Nature 2012, 484, 339–344. [DOI] [PMC free article] [PubMed] [Google Scholar]
- 5.Liu S., Wang J., Su Y., Guerrero C., Zeng Y., Mitra D., Brooks P. J., Fisher D. E., Song H., Wang Y., Nucleic Acids Res. 2013, 41, 6421–6429. [DOI] [PMC free article] [PubMed] [Google Scholar]
- 6.Mulholland C. B., Traube F. R., Ugur E., Parsa E., Eckl E. M., Schönung M., Modic M., Bartoschek M. D., Stolz P., Ryan J., Carell T., Leonhardt H., Bultmann S., Sci. Rep. 2020, 10, 12066. [DOI] [PMC free article] [PubMed] [Google Scholar]
- 7.Wagner M., Steinbacher J., Kraus T. F., Michalakis S., Hackner B., Pfaffeneder T., Perera A., Müller M., Giese A., Kretzschmar H. A., Carell T., Angew. Chem. Int. Ed. 2015, 54, 12511–12514; [DOI] [PMC free article] [PubMed] [Google Scholar]; Angew. Chem. 2015, 127, 12691–12695. [Google Scholar]
- 8.Pfaffeneder T., Hackner B., Truß M., Münzel M., Müller M., Deiml C. A., Hagemeier C., Carell T., Angew. Chem. Int. Ed. 2011, 50, 7008–7012; [DOI] [PubMed] [Google Scholar]; Angew. Chem. 2011, 123, 7146–7150. [Google Scholar]
- 9.Ito S., Shen L., Dai Q., Wu S. C., Collins L. B., Swenberg J. A., He C., Zhang Y., Science 2011, 333, 1300–1303. [DOI] [PMC free article] [PubMed] [Google Scholar]
- 10.Bachman M., Uribe-Lewis S., Yang X., Burgess H. E., Iurlaro M., Reik W., Murrell A., Balasubramanian S., Nat. Chem. Biol. 2015, 11, 555–557. [DOI] [PMC free article] [PubMed] [Google Scholar]
- 11.Valinluck V., Sowers L. C., Cancer Res. 2007, 67, 946–950. [DOI] [PubMed] [Google Scholar]
- 12.Shi D.-Q., Ali I., Tang J., Yang W.-C., Front. Genet. 2017, 8, 100. [DOI] [PMC free article] [PubMed] [Google Scholar]
- 13.Münzel M., Globisch D., Carell T., Angew. Chem. Int. Ed. 2011, 50, 6460–6468; [DOI] [PubMed] [Google Scholar]; Angew. Chem. 2011, 123, 6588–6596. [Google Scholar]
- 14.Spruijt C. G., Gnerlich F., Smits A. H., Pfaffeneder T., Jansen P. W., Bauer C., Münzel M., Wagner M., Müller M., Khan F., Eberl H. C., Mensinga A., Brinkman A. B., Lephikov K., Müller U., Walter J., Boelens R., van Ingen H., Leonhardt H., Carell T., Vermeulen M., Cell 2013, 152, 1146–1159. [DOI] [PubMed] [Google Scholar]
- 15.Rahimoff R., Kosmatchev O., Kirchner A., Pfaffeneder T., Spada F., Brantl V., Müller M., Carell T., J. Am. Chem. Soc. 2017, 139, 10359–10364. [DOI] [PubMed] [Google Scholar]
- 16.Fu T., Liu L., Yang Q. L., Wang Y., Xu P., Zhang L., Liu S., Dai Q., Ji Q., Xu G. L., He C., Luo C., Zhang L., Chem. Sci. 2019, 10, 7407–7417. [DOI] [PMC free article] [PubMed] [Google Scholar]
- 17.Iwan K., Rahimoff R., Kirchner A., Spada F., Schröder A. S., Kosmatchev O., Ferizaj S., Steinbacher J., Parsa E., Müller M., Carell T., Nat. Chem. Biol. 2018, 14, 72–78. [DOI] [PubMed] [Google Scholar]
- 18.Schön A., Kamińska E., Schelter F., Ponkkonen E., Korytiaková E., Schiffers S., Carell T., Angew. Chem. Int. Ed. 2020, 59, 5591–5594; [DOI] [PMC free article] [PubMed] [Google Scholar]; Angew. Chem. 2020, 132, 5639–5643. [Google Scholar]
- 19.Schiesser S., Pfaffeneder T., Sadeghian K., Hackner B., Steigenberger B., Schröder A. S., Steinbacher J., Kashiwazaki G., Höfner G., Wanner K. T., Ochsenfeld C., Carell T., J. Am. Chem. Soc. 2013, 135, 14593–14599. [DOI] [PubMed] [Google Scholar]
- 20.Kunz C., Focke F., Saito Y., Schuermann D., Lettieri T., Selfridge J., Schär P., PLoS Biol. 2009, 7, e1000091. [DOI] [PMC free article] [PubMed] [Google Scholar]
- 21.Wu S. C., Zhang Y., Nat. Rev. Mol. Cell. Biol. 2010, 11, 607–620. [DOI] [PMC free article] [PubMed] [Google Scholar]
- 22.Caldecott K. W., Nat. Rev. Genet. 2008, 9, 619–631. [DOI] [PubMed] [Google Scholar]
- 23.Schröder A. S., Parsa E., Iwan K., Wallner M., Serdjukow S., Carell T., Chem. Commun. 2016, 52, 14361–14364. [DOI] [PubMed] [Google Scholar]
- 24.Schröder A. S., Kotljarova O., Parsa E., Iwan K., Raddaoui N., Carell T., Org. Lett. 2016, 18, 4368–4371. [DOI] [PubMed] [Google Scholar]
- 25.Yuan F., Bi Y., Zhang J.-Y., Zhou Y.-L., Zhang X.-X., Song C.-X., RSC Adv. 2019, 9, 29010–29014. [DOI] [PMC free article] [PubMed] [Google Scholar]
- 26.Traube F. R., Schiffers S., Iwan K., Kellner S., Spada F., Müller M., Carell T., Nat. Protoc. 2019, 14, 283–312. [DOI] [PubMed] [Google Scholar]
- 27.Meissner A., Mikkelsen T. S., Gu H., Wernig M., Hanna J., Sivachenko A., Zhang X., Bernstein B. E., Nusbaum C., Jaffe D. B., Gnirke A., Jaenisch R., Lander E. S., Nature 2008, 454, 766–770. [DOI] [PMC free article] [PubMed] [Google Scholar]
- 28.Raiber E. A., Portella G., Martínez Cuesta S., Hardisty R., Murat P., Li Z., Iurlaro M., Dean W., Spindel J., Beraldi D., Liu Z., Dawson M. A., Reik W., Balasubramanian S., Nat. Chem. 2018, 10, 1258–1266. [DOI] [PubMed] [Google Scholar]
- 29.Su M., Kirchner A., Stazzoni S., Müller M., Wagner M., Schröder A., Carell T., Angew. Chem. Int. Ed. 2016, 55, 11797–11800; [DOI] [PubMed] [Google Scholar]; Angew. Chem. 2016, 128, 11974–11978. [Google Scholar]
- 30.Song C. X., Szulwach K. E., Dai Q., Fu Y., Mao S. Q., Lin L., Street C., Li Y., Poidevin M., Wu H., Gao J., Liu P., Li L., Xu G. L., Jin P., He C., Cell 2013, 153, 678–691. [DOI] [PMC free article] [PubMed] [Google Scholar]
- 31.Neri F., Incarnato D., Krepelova A., Rapelli S., Anselmi F., Parlato C., Medana C., Dal Bello F., Oliviero S., Cell Rep. 2015, 10, 674–683. [DOI] [PubMed] [Google Scholar]
- 32.Raiber E.-A., Murat P., Chirgadze D. Y., Beraldi D., Luisi B. F., Balasubramanian S., Nat. Struct. Mol. Biol. 2015, 22, 44–49. [DOI] [PMC free article] [PubMed] [Google Scholar]
- 33.Kellinger M. W., Song C. X., Chong J., Lu X. Y., He C., Wang D., Nat. Struct. Mol. Biol. 2012, 19, 831–833. [DOI] [PMC free article] [PubMed] [Google Scholar]
Associated Data
This section collects any data citations, data availability statements, or supplementary materials included in this article.
Supplementary Materials
As a service to our authors and readers, this journal provides supporting information supplied by the authors. Such materials are peer reviewed and may be re‐organized for online delivery, but are not copy‐edited or typeset. Technical support issues arising from supporting information (other than missing files) should be addressed to the authors.
Supplementary