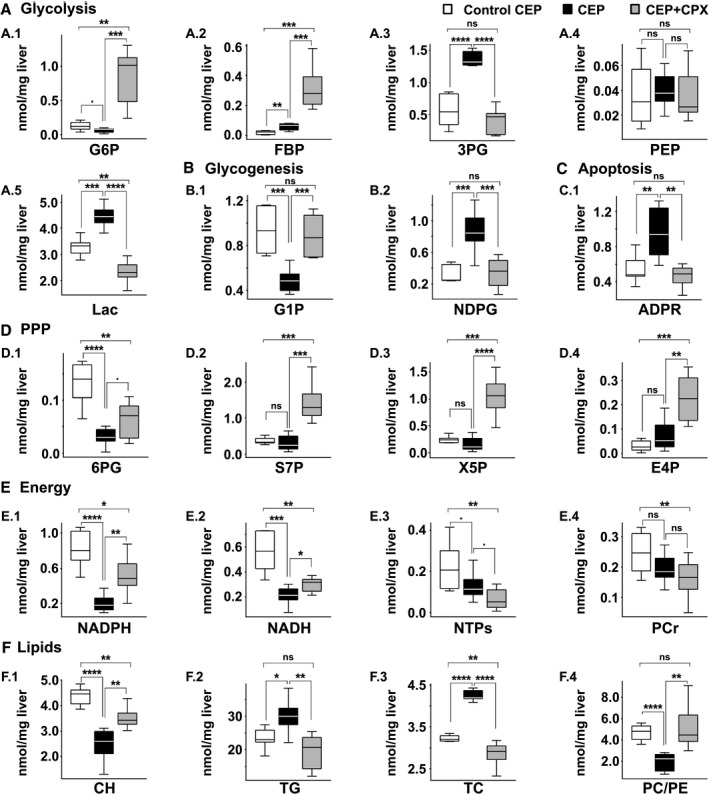
FIG. 5.

Metabolite quantification for the CEP model. Comparison of quantified metabolites (nmol/mg liver) between control CEP (white bars; n = 6), CEP (black bars; n = 7) and CEP treated with CPX (gray bars, n = 7). (A) Glycolysis, (B) Glycogenesis, (C) Apoptosis, (D) Pentose phosphate pathway, (E) Energy, (F) Lipids. P values of < 0.1, 0.05, 0.01, 0.001 and 0.0001 are represented by ·, *, **, *** and ****, respectively.
