

Abstract
A lipid named DCPA was synthesized under microwave‐assisted heating. DCPA possesses a pyridine betaine, hydrophilic group that can be complexed with water through hydrogen bonding (DCPA‐H2O). DCPA‐H2O liposomes became protonated relatively fast already at pH<6.8, due to the high HOMO binding energy of DCPA‐H2O. In murine models, DCPA‐H2O liposomes had longer blood circulation times than natural DPPC or cationic DCPM liposomes, while after tail‐vein injection DCPA‐H2O liposomes targeted faster to solid tumors and intra‐abdominal infectious biofilms. Therapeutic efficacy in a murine, infected wound‐healing model of tail‐vein injected ciprofloxacin‐loaded DCPA‐H2O liposomes exceeded the ones of clinically applied ciprofloxacin as well as of ciprofloxacin‐loaded DPPC or DCPM liposomes.
Keywords: hydrogen bonding, pH-responsive, pyridine betaine, self-targeting, zwitterionic lipids
A new lipid, DCPA, was prepared, possessing a hydrophilic, pyridine betaine group that can be hydrogen‐bonded with water yielding DCPA‐H2O. Self‐assembled DCPA‐H2O liposomes become rapidly protonated at relatively high pH (<7.0) due to the high HOMO binding energy of DCPA‐H2O. As a result, DCPA‐H2O liposomes target faster to solid tumors and infectious biofilms than natural DPPC or cationic DCPM liposomes.
Introduction
Self‐targeting, drug‐loaded nanocarriers are considered to provide a welcome extension to the currently available armamentarium of clinicians for treating tumors or bacterial infections.[1] A wide variety of smart, drug‐loaded nanocarriers has been described in the literature that are equipped with pH‐responsive groups to self‐target the nanocarrier to the acidic environment of a tumor[2] or infectious biofilm[3] through electrostatic double‐layer attraction with negatively charged cells.[4] Smart nanocarriers can be distinguished based on their pH‐responsive, functional groups including: 1) weakly alkaline (mainly primary amines)[5] or acidic (carboxylic, sulfonic or phosphonic acid)[5] groups, 2) zwitterionic groups containing weak alkaline and acidic groups,[6] and 3) quaternary ammonium salts and carboxylic acids.[6] Although these functional groups all yield charge reversal from negative at physiological pH[7] to positive in an acidic tumor or infection site, this usually occurs well below pH 6.5 and requires a relatively long exposure time to a low pH environment.[8] Moreover, the pH value near a tumor or infection site decreases only gradually towards its depth.[9] Therefore, the relatively low point of zero charge of these functional groups may be considered a disadvantage that is neglected in current designs of pH‐responsive nanocarriers.
Most liposomal drug‐loaded nanocarriers possess a number of unique features, that include long circulation times in the blood without reticulo‐endothelial rejection[10] and easy entry into tumor cells or infectious bacteria by fusion with the cell membrane.[11] Equipping lipid nanocarriers with pH‐responsive functionalities to make them self‐targeting to an acidic environment is not trivial however. pH‐responsive, liposomal drug carriers have been made using weakly alkaline or zwitterionic lipids[12] with amino and carboxyl as functional groups, but they all have points of zero charge below pH 6.5 and their charge properties only respond to a pH change after several tens of minutes.[8] Moreover, their biocompatibility can raise problems, such as blood coagulation[13] or cytotoxicity.[14] Here, we designed a new zwitterionic lipid 2‐(4‐((1,5‐bis(octadecyloxy)‐1,5‐dioxopentan‐2‐yl) carbamoyl) pyridin‐1‐ium‐1‐yl) acetate, abbreviated DCPA) for making liposomal drug nanocarriers with water as a pH‐responsive functional group (Scheme 1). Water is highly biocompatible and its protonation occurs gradually towards acidic pH, but with relatively fast response times.[15]
Scheme 1.
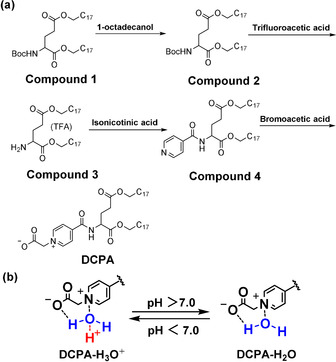
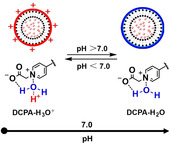
a) Synthesis route of zwitterionic lipid 2‐(4‐((1,5‐bis(octadecyloxy)‐1,5‐dioxopentan‐2‐yl) carbamoyl) pyridin‐1‐ium‐1‐yl) acetate, (DCPA). Compound 1 (Boc‐L‐glutamic acid) was coupled with 1‐octadecanol to obtain compound 2. After removal of the Boc‐protection from compound 2 using 50 % trifluoroacetic acid (TFA) in dichloromethane (DCM) at 0 °C, the terminal amino group of compound 2 was exposed to yield compound 3. Then, the terminal amino group of compound 3 was coupled with the carboxyl group of isonicotinic acid to obtain compound 4. Finally, the nitrogen atom in the pyridine ring of compound 4 was quaternized at elevated temperature with bromoacetic acid to obtain DCPA. b) The resulting hydrophilic, pyridine betaine head‐group of DCPA can complex with water (DCPA‐H2O) to become positively charged (DCPA‐H3O+) in a low pH environment.
Results and Discussion
Synthesis of DCPA started with commercially purchased Boc‐L‐glutamic acid (compound 1). First, dioctadecyl (tert‐butoxycarbonyl) glutamate (compound 2) was synthesized to provide compound 1 with hydrophobic tail groups.[16] To this end, 1‐octadecanol was allowed to react with compound 1 and purified using column chromatography.[28]
Next, the Boc‐protection was removed from compound 2 using 50 % TFA in DCM to expose the terminal amino group (compound 3) that was subsequently coupled with the carboxyl group of isonicotinic acid to obtain compound 4.[29]
Subsequently, (2‐(4‐((1,5‐bis(octadecyloxy)‐1,5‐dioxopentan ‐2‐yl) carbamoyl) pyridin‐1‐ium‐1‐yl) acetate (DCPA) was made by quaternization of the nitrogen atom in the pyridine ring of compound 4 with bromoacetic acid to obtain DCPA with a hydrophilic, pyridine betaine head‐group. Quaternization of pyridine required elevated temperatures[17] and was done by conventional heating in a thermostatic oil bath during 24 h at 81 °C.[30]
The final quaternization of pyridine was also carried out in a microwave‐generated electromagnetic field, suggested to enhance molecular vibrations to increase internal energy generation and exposure of active sites, thus decreasing the reaction time.[18] Hence, quaternization yields were compared under microwave‐assisted heating and heating by conventional heating. Based on a comparison of 1H NMR spectra (Figure 1 a,b, respectively), microwave‐assisted heating demonstrated not only faster, but also more extensive quaternization under microwave‐assisted heating (Figure 1 c). Therefore, the remainder of this study is based on DCPA obtained using microwave‐assisted heating.
Figure 1.
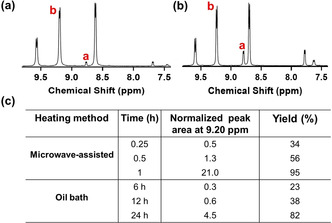
Comparison of the quaternization reaction under microwave‐assisted heating and by conventional heating in an oil bath to obtain DCPA. a) 1H NMR spectrum of DCPA after quaternization of the nitrogen atom in the pyridine ring with bromoacetic acid under microwave‐assisted heating self‐adjusting its power to maintain a temperature of 65 °C. b) Same as panel (a), now carrying out the quaternization reaction under heating by conventional heating in a thermostatic oil bath (24 h at 81 °C). Note that full spectra for both quaternization conditions and reaction times are compared in Figure S6. c) Normalized areas of the b peaks at 9.20 ppm representative of quaternized nitrogen in amphiphilic, zwitterionic DCPA. Peaks were normalized with respect to the peak area at 8.82 ppm representing its source nitrogen. Data pertain to microwave‐assisted and conventional, high temperature quaternization conditions. The percentage yield is calculated as ×100 %.
Frontier molecular orbitals in DCPA were subsequently calculated in order to explain the pH responsiveness of water complexed with DCPA. HOMO (highest occupied molecular orbital) analysis (Figure 2 a) indicates that electron‐donating sites are clearly confined to the pyridine betaine head groups of DCPA. Zooming in on the pyridine betaine head group of DCPA (Figure 2 b), shows that electron‐donating, that is, hydrogen‐accepting sites in DCPA are located at the negatively charged oxygen of the carboxylate connected to the pyridine ring. Electron‐accepting sites in DCPA are located at the positively charged nitrogen in the pyridine ring (see Scheme 1 a). Subsequently, the Alpha MOS routine in GaussView was employed to calculate the electron binding energies of the HOMO and LUMO (lowest unoccupied molecular orbital)[19] in DCPA (Figure 2 b) and pyridine betaine (Figure 2 c). As can be seen in Figure 2 d, electron binding energies in the LUMO of DCPA and pyridine betaine are similar. HOMO electron binding energy of DCPA had increased because conjugation of the pyridine ring through amide groups with the carboxylate in DCPA increased the electron cloud density of terminal oxygen in carboxylate. Consequently, the energy gap between HOMO and LUMO binding energies is larger in DCPA than in pyridine betaine. Accordingly, DCPA possesses a larger ability to donate an electron than pyridine betaine, that is, DCPA complexes more easily with water through hydrogen bonding at the negative‐charged oxygen of the carboxylate and the nitrogen in pyridine ring than pyridine betaine.
Figure 2.
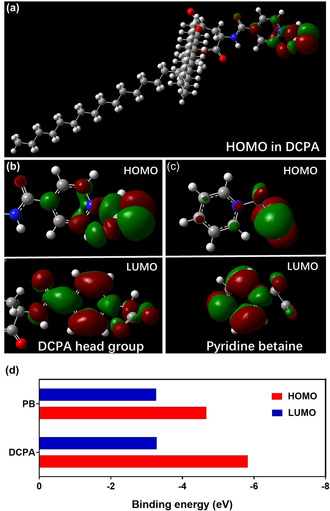
Frontier molecular orbitals and their binding energies in DCPA and pyridine betaine. a) HOMO charge distribution in DCPA, calculated using GaussView 6.0.16 (Gaussian Inc, Carnegie Mellon University, Pittsburg, USA), showing the molecular electrostatic potential in artificial colors (−1=blue > green > yellow > orange > red=+1). Accordingly, chemical reactive sites indicated in blue are electrophilic attack centers while sites indicated in red are possible nucleophilic attack centers. b) HOMO and LUMO of the hydrophilic, pyridine betaine head group of DCPA. c) HOMO and LUMO in pyridine betaine. d) HOMO and LUMO binding energies in DCPA and pyridine betaine (PB), showing a larger energy gap (HOMO minus LUMO binding energy) in DCPA than in pyridine betaine due to a more negative HOMO binding energy. The binding energy gap between HOMO and LUMO were calculated using the Alpha MOS routine in GaussView.
Next, DCPA‐H2O liposomes were self‐assembled and their pH‐adaptiveness was compared with the one of slightly anionic, natural dipalmitoylphosphatidyl choline (DPPC) and cationic 4‐((1,5‐bis(octadecyloxy)‐1,5‐dioxopentan‐2‐yl) carbamoyl)‐1‐methylpyridin‐1‐ium) (DCPM) lipids (see Figure 3 a).
Figure 3.
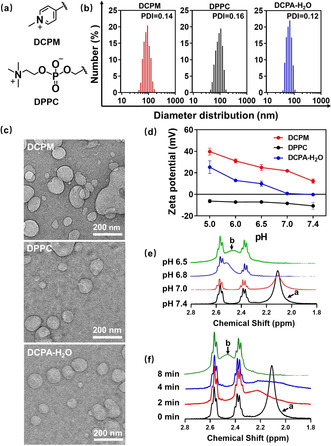
Comparison of the pH responsiveness of water‐functionalized DCPA‐H2O liposomes with the pH responsiveness of DCPM and DPPC liposomes. a) Chemical structures of the pH‐responsive groups in DCPM and DPPC. b) Diameter distributions of the different liposomes suspended in water obtained using dynamic light scattering (DLS), together with their polydispersity indices (PDI). c) Cryogenic electron micrographs of DCPM, DPPC and DCPA‐H2O liposomes. d) Zeta potentials of DCPM, DPPC and water‐functionalized DCPA‐H2O liposomes as a function of pH in a phosphate buffer (5 mM NaH2PO4 and 5 mM Na2HPO4). pH was adjusted with HCl or NaOH. Zeta potentials were measured 2 min after exposure to a functional pH. Error bars denote the standard deviations over triplicate measurements with separately prepared liposome suspensions. e) 1H NMR spectra of water‐functionalized DCPA‐H2O liposomes over the chemical shift range 2.8 to 1.8 ppm (for full spectra see Figure S7) after 15 min exposure to deionized water with different pH between 6.5 and 7.4. After exposure, the liposome suspension was lyophilized and the resulting lyophilized powder was dissolved in CDCl3. The peak shift from a (2.10 ppm) to b (2.48 ppm) indicates protonation of the complexed water in water‐functionalized DCPA. f) 1H NMR spectra of water‐functionalized DCPA‐H2O liposomes over the chemical shift range 2.8 to 1.8 ppm (for full spectra see Figure S8) after different exposure times to deionized water at pH 6.5.
All liposomes had a diameter of around 100 nm albeit with low polydispersity indices (Figure 3 b), regardless of the lipid used. Diameters and spherically shaped morphologies were confirmed using cryogenic electron microscopy (Figure 3 c). DCPA‐H2O liposomes showed a variation in zeta potential ranging from −0.2 mV at pH 7.4 to +25.2 mV at pH 5.0. Cationic DCPM liposomes were pH responsive but remained to possess a positive zeta potential at physiological pH,[7] while DPPC liposomes consisting of natural lipids were negatively charged over the entire pH range from 7.4 to 5.0 (Figure 3 d). Charge transition of DCPA‐H2O liposomes upon protonation of complexed water furthermore showed from a comparison of 1H NMR spectra taken after exposure to pH 7.4 and pH 6.5. 1H NMR spectra on the hydrogen in water exposed to different pH values decreasing from pH 7.4 to pH 6.5, demonstrated gradual broadening and disappearance of the peak occurring at 2.10 ppm at pH 7.4 (peak a) and the appearance of a broad new peak (peak b) at 2.48 ppm (Figure 3 e). Exposure to pH 6.5 as a function of time showed full disappearance of peak a at 2.10 ppm due to protonation of complexed water within 8 min (Figure 3 f).
After establishing stability of DCPA‐H2O liposomes in blood plasma (Figure S9) and their ability to become loaded with a therapeutic cargo (Table S1) and release of an antibiotic or chemotherapeutic payload in an in vitro, acidic environment (Figure S10c,d), merits of DCPA‐H2O liposomes were evaluated in murine models and compared with those of DCPM and DPPC liposomes. In a first series of experiments, possible adverse effects and blood circulation times up to 48 h were determined after tail‐vein injection of rhodamine‐loaded liposomes in rats. To this end, a rat model was preferred because the blood circulation contains a larger volume of blood than mice. Neither injection with phosphate buffered saline (PBS) nor any of the three types of liposomes had any adverse effect on the body weight of the rats and the average body weight increased slightly over the course of the study (Figure 4 a). Similar to natural DPPC liposomes, DCPA‐H2O liposomes did not increase IgM levels in blood, whereas cationic DCPM liposomes increased IgM levels to almost 300 % of the PBS control (Figure 4 b). Both natural DPPC as well as cationic DCPM liposomes were cleared more rapidly from the blood circulation than DCPA‐H2O liposomes (Figure 4 c), possessing a significantly longer blood circulation half‐life time of around 39 h (Figure 4 d). This is significantly longer than reported for example, for stealth, gold nanocarriers with a polyethylene glycol (PEG) coating (t 1/2=9 h),[13] stealth, PEG‐modified micelles (t 1/2=10 h)[20] or hyaluronan‐decorated nanoparticles (t 1/2=8 h).[21] Blood analysis at sacrifice demonstrated no significant differences between rats injected with PBS or any of the three types of liposomes (Table 1). Thus, DCPA‐H2O liposomes can be considered fully blood compatible with superior blood circulation times, as compared with natural DPPC and cationic DCPM liposomes and other self‐targeting drug‐nanocarriers.
Figure 4.
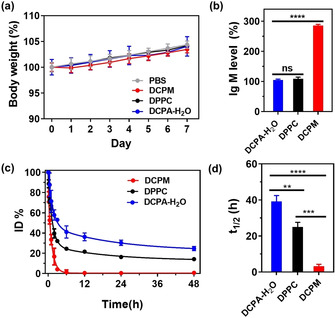
Evaluation of possible adverse effects and blood circulation times of DCPA‐H2O liposomes after tail‐vein injection in rats (dose: 1.0 mg per kg body weight). a) Percentage body weight as a function of time after tail‐vein injection of liposomes at t=0. Percentage body weight was expressed relative to the body weight of rats at t=0 (average body weight at t=0 equals 310±8 g over all groups). b) Percentage IgM levels in blood at day 5 after tail‐vein injection of liposomes. IgM percentages were expressed with respect to IgM levels after injection of PBS (0.42±0.04 mg mL−1). c) Percentage of red‐fluorescent rhodamine‐loaded liposomes as a function of time after tail‐vein injection of liposomes, expressed as a percentage of the injected dose (ID%). d) Blood circulation half‐life times of liposomes, calculated from the data in panel (c). All data are given as means ± SD over three different rats per group. Significance levels (Students’ t‐test) for the comparisons are indicated by asterisks: ** P<0.01; *** P<0.001 and **** P<0.0001, ns indicates not significant.
Table 1.
Hematology parameters of blood taken at sacrifice: day 7 after tail‐vein injection of different liposomes in rats.[a]
|
Injection of |
RBC [×1012 L−1] |
HGB [g L−1] |
HCT [%] |
PLT [×109 L−1] |
WBC [×109 L−1] |
|---|---|---|---|---|---|
|
PBS |
8.0±0.5 |
171±5 |
46±5 |
727±68 |
9±2 |
|
DCPM |
7.8±0.1 |
166±3 |
47±9 |
739±32 |
10±2 |
|
DPPC |
8.0±0.5 |
169±4 |
46±2 |
726±58 |
9±3 |
|
DCPA‐H2O |
7.9±0.1 |
167±4 |
47±4 |
732±37 |
9±3 |
[a] All data are given as means ± SD over three different rats per group. There are no significant differences in any of the hematology parameters, regardless of whether injected with PBS or any of the three types of liposomes (Students’ t‐test, P>0.5). RBC=red blood cell count, HGB=hemoglobin concentration, HCT=hematocrit percentage, PLT=platelet, WBC=white blood cell count.
Next self‐targeting of DCPA‐H2O liposomes to an infectious biofilm of green‐fluorescent Staphylococcus aureus ATCC12600GFP underneath an abdominal imaging window was monitored in situ after tail‐vein injection of red‐fluorescent, rhodamine‐loaded liposomes in mice (Figure 5 a and 5b). Rapid self‐targeting is clinically important as it avoids de‐activation of antimicrobials during blood circulation and reduces the risk upon reticulo‐endothelial rejection. Mice were preferred above rats because they are more susceptible to infection than rats. Real‐time intra‐vital imaging[22] in living mice showed no accumulation of natural DPPC liposomes (Supporting Movie 1) and very minor accumulation of cationic DCPM liposomes (Supporting Movie 2) in an intra‐abdominal infection site. DCPA‐H2O liposomes (Supporting Movie 3) on the other hand, became clearly visible in the infection site within a targeting time of 10 min after tail‐vein injection (see Figure 5 c). Quantitative analysis of the red‐fluorescence as a function of time after tail‐vein injection, demonstrated significantly more rapid and extensive self‐targeting of DCPA‐H2O liposomes into the infectious biofilm than cationic DCPM or natural DPPC liposomes (Figure 5 d).
Figure 5.
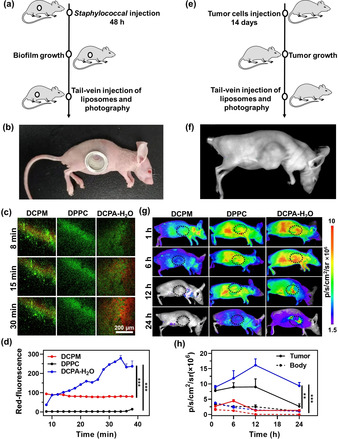
Self‐targeting of DCPA‐H2O liposomes to the acidic environment of an infectious biofilm or tumor site in mice. a) The intravital imaging of self‐targeting of tail‐vein injected red‐fluorescent rhodamine‐loaded liposomes into a green‐fluorescent S. aureus ATCC12600GFP biofilm underneath an Abdominal Imaging Window (AIW). b) Mouse with an AIW implanted in its flank. c) Snap‐shots from movies (Supporting Information, Movies 1–3) taken at different times after tail‐vein injection of liposomes, with red‐fluorescence representing liposomes self‐targeting into the biofilms. d) Self‐targeting of rhodamine‐loaded liposomes into the biofilms as a function of time after tail‐vein injection of liposomes, expressed as a red‐fluorescent intensity. e) Self‐targeting of tail‐vein injected red‐fluorescent rhodamine‐loaded liposomes into a solid tumor using fluorescence imaging. f) Mouse with a HepG2 tumor in the right chest. g) Fluorescence images taken at different times after tail‐vein injection of liposomes, with red‐fluorescence representing liposomes self‐targeting into the tumor. Fluorescence intensity is expressed in total photons per second per square centimeter (p s−1 cm−2/sr) on an artificial color scale. h) Self‐targeting of rhodamine‐loaded liposomes into the tumors as a function of time after tail‐vein injection of liposomes, expressed as total photons per second per square centimeter (p s cm−2/sr). For comparison, fluorescence over the body of a mouse, excluding the tumor area, is given as well. Error bars denote SD over three mice. Asterisks indicate statistical significance at ** p<0.01 and *** p<0.001 (Students’ t‐test) between natural DPPC, cationic DCPM and DCPA‐H2O liposomes.
The kinetics of self‐targeting in vitro is greatly dependent on the experimental design used and cannot be compared with targeting times observed in vivo. In vivo indirect, gamma scintigraphy demonstrated accumulation in subcutaneous Mycobacterium tuberculosis biofilms in the thigh of mice of radio‐actively labeled, molecular imaging agents within 4 h after tail‐vein injection of the imaging agents.[23] Direct observation of pH‐driven self‐targeting of antimicrobial nanoparticles to an infection site in vivo has, to the best of our knowledge, only been made possible through the use of intra‐vital imaging,[24] as applied here. Using this technique, we have recently shown that it takes pH‐responsive zwitterionic micelles composed of poly(ethylene glycol) and poly(ϵ‐caprolactone) block co‐polymers at least 20 min to reach an intra‐abdominal infection site after tail‐vein injection.[25] Collectively, and within the limitations of different infection sites, infecting bacterial strains and probing molecules and particles, these comparisons points to the superiority of water as a pH‐responsive functionality on nanocarriers for self‐targeting to an infection site.
Similarly, self‐targeting of DCPA‐H2O liposomes into a solid tumor was investigated after tail‐vein injection of rhodamine loaded liposomes in mice (Figure 5 e, f). Neither natural DPPC nor cationic DCPM liposomes demonstrated targeting into the tumor site, while particularly natural DPPC spread across the entire body of a mouse. DCPA‐H2O liposomes initially showed similar spreading across the entire body of a mouse, but at the same time self‐targeting to the acidic tumor site became evident within 6 h after tail‐vein injection (Figure 5 g). Quantitative analysis of the photon flux arising from the tumor site revealed rapid self‐targeting of DCPA‐H2O liposomes, demonstrating maximal accumulation in the tumor after 12 h (Figure 5 h). Accumulation in the tumor was on average 11‐fold higher than whole body accumulation, as calculated from the photon fluxes over the tumor site and the whole body of the mice (Figure 5 g). Other in vivo studies also report on kinetics of tumor targeting of fluorescent liposomes within 5–8 h in similar models, but these were done at 400× higher liposome concentrations yielding only 2‐fold higher accumulation compared with whole body accumulation.[11] Thus water as a pH‐responsive functionality is not only superior to other drug‐nanocarriers to self‐target an infection site, but also for self‐targeting a tumor site. Superior self‐targeting of DCPA‐H2O liposomes was accompanied by better therapeutic efficacy in a murine, infected wound‐healing model. Tail‐vein injection of a suspension of ciprofloxacin‐loaded DCPA‐H2O liposomes in PBS yielded significantly better eradication of S. aureus from infected wounds than tail‐vein injection of clinically applied ciprofloxacin in solution or suspensions of ciprofloxacin‐loaded DPPC or DCPM liposomes (Figure S11).
Interestingly, self‐targeting of DCPA‐H2O liposomes to an infectious biofilm proceeded on a time‐scale of minutes, while self‐targeting into a tumor site proceeded on a time‐scale of several hours. Whereas this may be due to size differences in tumor and infection sites, we consider it likely that different target‐times are due to the higher acidity of infectious biofilms, ranging from pH 6.5 to 4.5,[26] as compared with tumor sites, ranging in pH between 6.9 and 6.5.[27] Thus pH‐adaptive carriers will be more conducive to charge reversal when approaching an infectious biofilm than upon approach of a tumor site.
Conclusion
We have successfully prepared a novel lipid, DCPA. DCPA can be made in high yields using microwave‐assisted heating and can be complexed with water as a pH‐responsive functionality. DCPA‐H2O can self‐assemble into liposomes, providing exceptionally long blood circulation times, and rapid self‐targeting to the acidic environment of an infectious biofilm or solid tumor. When ciprofloxacin‐loaded, DCPA‐H2O liposomes had better therapeutic efficacy in mice than ciprofloxacin or ciprofloxacin‐loaded DPPC or DCPM liposomes.
Conflict of interest
H.J.B. is also director of a consulting company SASA BV. The authors declare no potential conflicts of interest with respect to authorship and/or publication of this article. Opinions and assertions contained herein are those of the authors and are not construed as necessarily representing views of the funding organization or their respective employer(s).
Supporting information
As a service to our authors and readers, this journal provides supporting information supplied by the authors. Such materials are peer reviewed and may be re‐organized for online delivery, but are not copy‐edited or typeset. Technical support issues arising from supporting information (other than missing files) should be addressed to the authors.
Supporting Information
Acknowledgements
This work was financially supported by the National Natural Science Foundation of China (21620102005, 51933006). The author thanks to the Dr. Feng Liu of School of Pharmacy, Shanghai Jiaotong University for her guidance and help in animal experiments.
D.-Y. Wang, G. Yang, H. C. van der Mei, Y. Ren, H. J. Busscher, L. Shi, Angew. Chem. Int. Ed. 2021, 60, 17714.
Contributor Information
Prof. Henny C. van der Mei, Email: h.c.van.der.mei@umcg.nl.
Prof. Henk J. Busscher, Email: h.j.busscher@umcg.nl.
Prof. Linqi Shi, Email: shilinqi@nankai.edu.cn.
References
- 1.
- 1a.Cabral H., Matsumoto Y., Mizuno K., Chen Q., Murakami M., Kimura M., Terada Y., Kano M. R., Miyazono K., Uesaka M., Nishiyama N., Kataoka K., Nat. Nanotechnol. 2011, 6, 815–823; [DOI] [PubMed] [Google Scholar]
- 1b.Gupta A., Mumtaz S., Li C.-H., Hussain I., Rotello V. M., Chem. Soc. Rev. 2019, 48, 415–427. [DOI] [PMC free article] [PubMed] [Google Scholar]
- 2.Sun C.-Y., Liu Y., Du J.-Z., Cao Z.-T., Xu C.-F., Wang J., Angew. Chem. Int. Ed. 2016, 55, 1010–1014; [DOI] [PubMed] [Google Scholar]; Angew. Chem. 2016, 128, 1022–1026. [Google Scholar]
- 3.Liu Y., Shi L., Su L., van der Mei H. C., Jutte P. C., Ren Y., Busscher H. J., Chem. Soc. Rev. 2019, 48, 428–446. [DOI] [PubMed] [Google Scholar]
- 4.Tan J., Tay J., Hedrick J., Yang Y. Y., Biomaterials 2020, 252, 120078. [DOI] [PubMed] [Google Scholar]
- 5.Kocak G. K., Tuncer C., Butun V., Polym. Chem. 2016, 7, 144–176. [Google Scholar]
- 6.Blackman L. D., Gunatillake P. A., Cass P., Locock K. E. S., Chem. Soc. Rev. 2019, 48, 757–770. [DOI] [PubMed] [Google Scholar]
- 7.Lu Y., Aimetti A. A., Langer R., Gu Z., Nat. Rev. Mater. 2017, 2, 16075. [Google Scholar]
- 8.Wang Y., Zhou K., Huang G., Huang X., Ma X., Zhao T., Gao J., Hensley C., DeBerardinis R. J., Sumer B. D., Nat. Mater. 2014, 13, 204–212. [DOI] [PMC free article] [PubMed] [Google Scholar]
- 9.
- 9a.Fulaz S., Hiebner D., Barros C. H. N., Devlin H., Vitale S., Quinn L., Casey E., ACS Appl. Mater. Interfaces 2019, 11, 32679–32688; [DOI] [PubMed] [Google Scholar]
- 9b.Gerweck L. E., Seetharaman K., Cancer Res. 1996, 56, 1194–1198; [PubMed] [Google Scholar]
- 9c.Webb B. A., Chimenti M., Jacobson M. P., Barber D. L., Nat. Rev. Cancer 2011, 11, 671–677. [DOI] [PubMed] [Google Scholar]
- 10.Wang Y., Wang Z., Xu C., Tian H., Chen X., Biomaterials 2019, 197, 284–293. [DOI] [PubMed] [Google Scholar]
- 11.Li S., Wang F., Li X., Chen J., Zhang X., Wang Y., Liu J., ACS Appl. Mater. Interfaces 2017, 9, 17736–17744. [DOI] [PubMed] [Google Scholar]
- 12.Yuba E., J. Mater. Chem. B 2020, 8, 1093–1107. [DOI] [PubMed] [Google Scholar]
- 13.Yang W., Liu S., Bai T., Keefe A. J., Zhang L., Ella-Menye J.-R., Li Y., Jiang S., Nano Today 2014, 9, 10–16. [Google Scholar]
- 14.Nederberg F., Zhang Y., Tan J. P. K., Xu K., Wang H., Yang C., Gao S., Guo X. D., Fukushima K., Li L., Hedrick J. L., Yang Y.-Y., Nat. Chem. 2011, 3, 409–414. [DOI] [PubMed] [Google Scholar]
- 15.Relph R. A., Guasco T. L., Elliott B. M., Kamrath M. Z., McCoy A. B., Steele R. P., Schofield D. P., Jordan K. D., Viggiano A. A., Ferguson E. E., Johnson M. A., Science 2010, 327, 308–312. [DOI] [PubMed] [Google Scholar]
- 16.Kohli A. G., Walsh C. L., Szoka F. C., Chem. Phys. Lipids 2012, 165, 252–259. [DOI] [PMC free article] [PubMed] [Google Scholar]
- 17.Triggle D. J., Belleau B., Can. J. Chem. 1962, 40, 1201–1215. [Google Scholar]
- 18.Cherif M., Horchani M., Al-Ghamdi Y. O., Almalki S. G., Alqurashi Y. E., Ben Jannet H., Romdhane A., J. Mol. Struct. 2020, 1220, 128685. [Google Scholar]
- 19.Rouhani M., Comput. Theor. Chem. 2021, 1195, 113096. [Google Scholar]
- 20.Ou H., Cheng T., Zhang Y., Liu J., Ding Y., Zhen J., Shen W., Xu Y., Yang W., Niu P., Liu J., An Y., Liu Y., Shi L., Acta Biomater. 2018, 65, 339–348. [DOI] [PubMed] [Google Scholar]
- 21.Cong Z., Zhang L., Ma S.-Q., Lam K. S., Yang F.-F., Liao Y.-H., ACS Nano 2020, 14, 1958–1970. [DOI] [PubMed] [Google Scholar]
- 22.
- 22a.Naik S., Piwnica-Worms D., Proc. Natl. Acad. Sci. USA 2007, 104, 17465–17174; [DOI] [PMC free article] [PubMed] [Google Scholar]
- 22b.Kedrin D., Gligorijevic B., Wyckoff J., Verkhusha V. V., Condeelis J., Segall J. E., van Rheenen J., Nat. Methods 2008, 5, 1019–1021. [DOI] [PMC free article] [PubMed] [Google Scholar]
- 23.Hazari P. P., Chuttani K., Kumar N., Mathur R., Sharma R., Singh B., Mishra A. K., Open Nucl. Med. J. 2009, 1, 33–42. [Google Scholar]
- 24.Ritsma L., Steller E. J. A., Ellenbroek S. I. J., Kranenburg O., Borel Rinkes I. H. M., van Rheenen J., Nat. Protoc. 2013, 8, 583–594. [DOI] [PubMed] [Google Scholar]
- 25.Tian S., Su L., Liu Y., Cao J., Yang G., Ren Y., Huang F., Liu J., An Y., van der Mei H. C., Busscher H. J., Shi L., Sci. Adv. 2020, 6, eabb1112. [DOI] [PMC free article] [PubMed] [Google Scholar]
- 26.
- 26a.Gupta A., Das R., Yesilbag Tonga G., Mizuhara T., Rotello V. M., ACS Nano 2018, 12, 89–94; [DOI] [PMC free article] [PubMed] [Google Scholar]
- 26b.Benoit D. S. W., Koo H., Nanomedicine 2016, 11, 873–879. [DOI] [PubMed] [Google Scholar]
- 27.
- 27a.Zhang X., Lin Y., Gillies R. J., J. Nucl. Med. 2010, 51, 1167–1170; [DOI] [PMC free article] [PubMed] [Google Scholar]
- 27b.Zhang A., Yao L., An M., Chem. Commun. 2017, 53, 12826–12829. [DOI] [PubMed] [Google Scholar]
- 28.NMR data compound 2: 1H NMR (400 MHz, CDCl3) δ=5.10 (d, J=7.4, 1 H), 4.31 (dd, J=5.1, 1 H), 4.12 (t, J=6.7, 2 H), 4.06 (t, J=6.8, 2 H), 2.44–2.33 (m, 2 H), 2.21–2.13 (m, 1 H), 1.96–1.89 (m, 1 H), 1.61 (s, 6 H), 1.44 (s, 9 H), 1.25 (s, 58 H), 0.88 (t, J=6.7, 6 H) (Figure S1).
- 29.NMR data compound 4: 1H NMR (400 MHz, CDCl3) δ=8.77 (d, J=4.8, 2 H), 7.69 (d, J=5.3, 2 H), 7.42 (d, J=6.9, 1 H), 4.76 (dd, J=12.1, 7.4, 1 H), 4.18 (t, J=6.7, 2 H), 4.06 (t, J=6.6, 2 H), 2.57–2.43 (m, 2 H), 2.35–2.27 (m, 1 H), 2.22–2.23 (m, 1 H), 1.69–1.56 (m, 4 H), 1.25 (s, 60 H), 0.88 (t, J=6.7, 6 H), (Figure S2); 13C NMR (100 MHz, CDCl3) δ=173.67, 171.51, 165.01, 150.38, 140.97, 121.04, 66.07, 65.32, 52.78, 31.91, 30.49, 29.69, 29.64, 29.57, 29.49, 29.34, 29.23, 29.19, 28.54, 28.52, 26.76, 25.86, 25.81, 22.67, 14.08 (Figure S3). ESI-HRMS m/z 757.6458 [M+H]+, calculated for C47H84N2O5, 757.6453.
- 30.NMR data DCPA: 1H NMR (400 MHz, CDCl3) δ=9.49 (d, J=7.2, 1 H), 9.22 (d, J=6.3, 2 H), 8.71 (d, J=6.3, 2 H), 4.69–4.67 (m, 1 H) 4.65 (s, 2 H), 4.13 (t, J=6.8, 2 H), 4.05 (t, J=6.8, 2 H), 2.60–2.55 (m, 2 H), 2.45–2.36 (m, 2 H), 1.69–1.57 (m, 4 H), 1.25 (s, 60 H), 0.87 (t, J=6.7, 6 H), (Figure S4). 13C NMR (100 MHz, CDCl3) δ=197.61, 172.89, 171.57, 162.16, 147.67, 146.23, 126.82, 65.99, 65.03, 53.50, 49.32, 31.94, 30.95, 29.74, 29.69, 29.60, 29.39, 29.34, 28.59, 28.53, 25.93, 25.90, 22.71, 14.15 (Figure S5). ESI-HRMS m/z 771.6611 [M+H−COOH]+, calculated for C49H87N2O7, 771.6610.
Associated Data
This section collects any data citations, data availability statements, or supplementary materials included in this article.
Supplementary Materials
As a service to our authors and readers, this journal provides supporting information supplied by the authors. Such materials are peer reviewed and may be re‐organized for online delivery, but are not copy‐edited or typeset. Technical support issues arising from supporting information (other than missing files) should be addressed to the authors.
Supporting Information