

Abstract
Background
Aboriginal and Torres Strait Islander people are disproportionately affected by hepatitis B virus (HBV) infection. A proposed mismatch between standard vaccines and the HBV/C4 sub‐genotype prevalent in Aboriginal people in the Northern Territory (NT) may reduce vaccine effectiveness.
Aims
To determine HBV prevalence in the NT by Indigenous status and to explore patterns of immunity following implementation of universal vaccination, using a large longitudinal diagnostic dataset.
Methods
A retrospective analysis of all available HBV serology results in the NT from 1991 to 2011 was conducted, with HBV prevalence and vaccination status analysed according to adigenous status, age and sex using individuals' patterns of HBsAg, anti‐HBs and anti‐HBc serology over repeated tests.
Results
100 790 individuals were tested (33.4% Indigenous) between 1991 and 2011 (26.1% of the 2011 NT population), with a total of 211 802 tests performed. In 2011, the proportion of HBV positive individuals in the NT was 3.17% (5.22% in Indigenous populations) compared to previous 2011 estimates of 1.70% (3.70% in Indigenous populations). The vaccine failure rate was lower than expected with only one presumed vaccinated person subsequently developing HBsAg positivity (0.02%). Evidence of suboptimal vaccine efficacy by breakthrough anti‐HBc positivity in vaccinated individuals was demonstrated in 3.1% of the vaccinated cohort, of which 86.4% identified as Indigenous (HR 1.17). No difference in HBeAg positivity or seroconversion was observed between Indigenous and non‐Indigenous individuals living with CHB.
Conclusions
The burden of CHB in Indigenous people in the NT has previously been underestimated. A higher HBV prevalence in the NT than described in previous cross‐sectional studies was found, including a higher prevalence in Indigenous people. Evidence of suboptimal vaccine efficacy was demonstrated predominantly in Indigenous individuals.
Keywords: hepatitis B virus, chronic hepatitis B, Aboriginal and Torres Strait islander peoples, vaccine efficacy, infant vaccination
Abbreviations
- anti‐HBc
antibody to hepatitis B core antigen
- anti‐HBe
antibody to hepatitis B e antigen
- anti‐HBs
antibody to hepatitis B surface antigen
- CHB
chronic hepatitis B
- CI
confidence interval
- HBeAg
hepatitis B e antigen
- HBsAg
hepatitis B surface antigen
- HBV
hepatitis B virus
- HBV/C4
hepatitis B virus, sub‐genotype C4
- HCC
hepatocellular cirrhosis
- HR
hazard ratio
- Indigenous
Australian Aboriginal and/or Torres Strait Islander person
- IQR
interquartile range
- NT
Northern Territory
- OR
odds ratio
Introduction
An estimated 250 million people live with chronic hepatitis B virus (HBV) infection worldwide,1 and of these, over 880 000 people die every year due to the consequences of HBV infection,2 primarily hepatocellular carcinoma (HCC) and cirrhosis.3 Chronic hepatitis B (CHB) is estimated to affect 0.95% of Australians, with an estimated population prevalence of 1.90% in the Northern Territory (NT) – the highest CHB prevalence in Australia.4 Indigenous Australian1 communities experience higher CHB prevalence than the non‐Indigenous population, with estimates ranging from 2.50% to 3.50%.4, 5 CHB prevalence has been reported to be even higher in Indigenous communities living in the NT, with a prevalence of 6.08% and a fourfold higher risk of HBsAg positivity.6 Further, Indigenous individuals experience significantly higher rates of long‐term CHB complications compared to non‐Indigenous Australians.7
In 2011, the CHB prevalence for Indigenous individuals living in the NT was estimated to be 3.70%.8 The vast majority of HBV prevalence studies for Indigenous peoples have utilised cross‐sectional serosurveys, primarily in pregnant women.5, 9, 10 These studies may not accurately reflect secular trends in the NT population, population‐level changes in vaccination status over time, prevalence in Indigenous men and the dynamic flux in stages of CHB infection. Given Indigenous Australians comprise 30.3% of the NT population,11 identifying trends in HBV infection and vaccination within the NT may help address the health disparities between Indigenous and non‐Indigenous Australians living with CHB.
Infant HBV vaccination was introduced in the NT for Indigenous children in 1988 and for all infants in 1990, with a school catch‐up programme for students aged between 6 and 16 years conducted in 1998.6 Potential issues with the early implementation of these programmes have been identified, including the use of plasma‐derived vaccines until 1991, which may have a decreased immunogenic response in infants,12 and breaches of the cold chain, including freezing of vaccines during transport,13, 14 making it possible that fully vaccinated infants in the NT have decreased HBV immunity. Indeed, a handful of studies have suggested decreased HBV vaccine efficacy in fully vaccinated Indigenous children in the NT.15, 16, 17
An additional challenge to HBV vaccination in the NT is the role of serotype mismatch and suboptimal vaccine efficacy. A unique HBV sub‐genotype, HBV/C4, has been identified exclusively in northern Aboriginal communities.18, 19 The current vaccine is based upon sub‐genotype A2, serotype adw2,20 whilst HBV/C4 is serotype ayw3.18, 19 A study of Aboriginal individuals vaccinated at birth in the NT found a 67.0% vaccine efficacy against any HBV infection, with breakthrough anti‐HBc positivity.16 Similar results have been noted in fully vaccinated individuals where a genotype and serotype mismatch exists.21, 22, 23, 24, 25, 26, 27
The present study aimed to use existing HBV serology test data to assess the prevalence of HBV in the NT and compare these to existing estimates, to compare the CHB trajectory and testing patterns between Indigenous and non‐Indigenous individuals and to assess HBV vaccine efficacy in a region of known serotype mismatch.
Methods
This study was a retrospective longitudinal analysis of all available HBV laboratory test data carried out for any reason in the NT between January 1991 and December 2011, including HBsAg, anti‐HBs, anti‐HBc, HBeAg, anti‐HBe and viral load. Data were sourced from three pathology providers, which are responsible for 97.9% of all HBV notifications, and linked as previously described.6
Ethical approval for this study was obtained from the Menzies School of Health Research (HREC‐12‐1745) and the Central Australian Human Research Ethics Committee (HREC‐14‐244). The decision to use existing diagnostic test data was made at the specific request of Aboriginal communities in the NT to elucidate as much information as possible with currently available data before requesting any new blood samples.
HBV status coding
Participants were classified by their HBV status per testing episode in this dataset to allow changes in disease progression and vaccination status to be captured. For each individual, their HBV status was assumed to remain consistent until a subsequent test proved otherwise. For each testing episode, participants were classified as: no markers present (susceptible); vaccinated; immune through past exposure; immune with unspecified mechanism; HBV positive, isolated anti‐HBc positive; or unknown (Table 1). HBV positive individuals (HBsAg positive) were further stratified into: HBeAg positive, HBeAg negative, or unspecified.
Table 1.
Hepatitis B virus (HBV) status classification based on serology results for individual testing episodes
| Phase | HBsAg | HBsAb | HBcAb | HBeAg | HBeAb |
|---|---|---|---|---|---|
| No markers present | Negative | Negative | Negative | Negative | Negative |
| Not tested | Not tested | ||||
| Vaccinated | Negative | Positive | Negative | Negative | Negative |
| Not tested | Not tested | ||||
| Immune by past exposure | Negative | Positive | Positive | Negative | Negative |
| Not tested | Not tested | ||||
| Unspecified immunity | Negative | Positive | Not tested | Negative | Negative |
| Not tested | Not tested | ||||
| Isolated core positive | Negative | Negative | Positive | Negative | Negative |
| Not tested | Not tested | ||||
| HBV positive | Positive | Negative | Negative | Negative | Negative |
| Positive | Positive | Positive | |||
| Not tested | Not tested | Not tested | |||
| eAg positive | Positive | Negative | Positive | Positive | Negative |
| Positive | |||||
| Not tested | |||||
| eAg negative | Positive | Negative | Positive | Negative | Positive |
| Unknown | Not tested | Negative | Not tested | Negative | Negative |
| Positive | Positive | Positive | |||
| Not tested | Not tested | Not tested |
eAg, e antigen; HBcAb, hepatitis B core antibody; HBeAb, hepatitis B e antibody; HBeAg, hepatitis B e antigen; HBsAb, hepatitis B surface antibody; HBsAg, hepatitis B surface antigen.
Serological markers were not provided in quantitative format, and anti‐HBs titres were not available for analysis. Each serological marker was reported as either: detected; not detected; or not tested. Individual anti‐HBc IgM and anti‐HBc IgG results were not provided, thus all anti‐HBc test results were assumed to be total anti‐HBc. Vaccination records were not available so simultaneously positive anti‐HBs and negative anti‐HBc was assumed to represent vaccine‐induced immunity.
Only 25% of individual testing episodes in this dataset included reporting of all three of HBsAg, anti‐HBs and anti‐HBc, resulting in a large number of episodes where no clear HBV status could be allocated. For participants with an underdetermined status who underwent multiple testing episodes, previous and subsequent test data were used to establish HBV status at these unknown points. Participants that had HBV positive serology were subsequently classified as remaining HBV positive unless later testing demonstrated evidence of HBsAg clearance. Individuals with vaccination serology continued to be classified as vaccinated on later testing episodes, even if they subsequently returned an undetectable anti‐HBs, so long as they had one initial test demonstrating anti‐HBs positivity and remained anti‐HBc negative, given immunity to HBV persists even as anti‐HBs titres wane over time.28, 29, 30 This longitudinal approach to serology allowed 10 392 unclear test results to be reclassified more accurately, resulting in the clarification of HBV status for 4647 participants.
Yearly HBV prevalence
Prevalence in the cohort was calculated annually based on each individual's HBV status on December 31 of each year. Participants were included in prevalence calculations from the date of their first test and censored at their last recorded interaction with a NT government health service during the study period. HBV prevalence was calculated as the number of people who tested HBsAg positive, with the denominator as the total number of individuals with testing data available for that year, including those with an unknown HBV status. For prevalence calculations where participants were stratified by vaccine eligibility, years 1991 to 1997 were excluded as an insufficient number of tests was conducted.
Vaccination eligibility
Eligibility for standardised vaccination programmes was determined by participants' year of birth. Individuals born from 1982 to 1992 were classified as eligible for school‐based vaccination.31 Indigenous individuals born from 1988 and non‐Indigenous individuals born from 1990 were classified as eligible for infant vaccination.
Data analysis
Data were analysed in Stata 15.1 (StataCorp, College Station, TX, USA). For descriptive analysis of non‐normally distributed data, median and interquartile range (IQR) were used. Differences between groups were assessed using Chi‐squared tests for categorical variables and Mann–Whitney U‐tests for continuous variables, with two‐way tests of proportions used for differences within and across groups. Logistic regression was used for multivariable analysis of HBV positivity and demographic variables, including Indigenous status, sex and age. Survival analysis using Cox proportional hazard models was performed to analyse time‐to‐event data for HBeAg loss in HBeAg positive individuals, anti‐HBc acquisition in vaccinated individuals and anti‐HBs loss in vaccinated individuals.
Results
Demographics
There were 100 970 individuals tested for HBV between January 1991 and December 2011, with a total of 211 802 unique testing episodes (Supporting Information Fig. S1). 33.4% of individuals identified as Indigenous, and 58% of individuals were female (Table 2). The median age at first test was 30.2 years (IQR 23.0–40.2), with 21.9% eligible for standardised vaccination programmes and a median follow‐up time of 7.94 years (IQR 3.97–12.5). 51.7% of non‐Indigenous individuals had a residential address in an outer regional area (Darwin and suburbs), while the majority (63.4%) of Indigenous individuals were recorded as living in a remote or very remote area (the remainder of the NT).
Table 2.
Demographic data of people in the Northern Territory who were tested for HBV once or more between January 1991 and December 2011
| Indigenous† | Non‐Indigenous | P‐value | |
|---|---|---|---|
| Number of people tested, n (%)‡ | 33 658 (33.4) | 64 835 (64.3) | <0.0005 |
| Females | 18 562 (55.1) | 38 575 (59.5) | <0.0005 |
| Males | 15 032 (44.7) | 26 183 (40.4) | <0.0005 |
| Age at time of first test (years)§ | 30.2 (23, 40.2) | ||
| Median (IQR) | 26.9 (19.2, 39.4) | 31.2 (25, 40.6) | 0.0001 |
| Age at time of most recent test (years)§ | 33.2 (25.9, 43.2) | ||
| Median (IQR) | 33.2 (24, 44.4) | 33.3 (26.6, 42.8) | 0.0001 |
| ASGC Remoteness Area, n (%) | <0.0005 | ||
| Outer regional | 3387 (10.1) | 33 543 (51.7) | <0.0005 |
| Remote or very remote | 21 326 (63.4) | 17 040 (26.3) | <0.0005 |
| Not recorded | 8945 (26.6) | 14 252 (22.0) | <0.0005 |
| People eligible for vaccination programs, n (%)§ | 10 565 (31.4) | 11 047 (17.0) | <0.0005 |
| School catch‐up vaccination | 8.847 (83.7) | 10 174 (92.1) | <0.0005 |
| Universal birth vaccination¶ | 5295 (50.1) | 2090 (18.9) | <0.0005 |
| Total number of tests for these individuals, n (%) | 99 512 (47.0) | 108 822 (51.4) | |
| Median per person (IQR) | 2 (1, 4) | 1 (1, 2) | 0.0001 |
| Time between subsequent tests (days) | 545 (202, 1121) | ||
| Median (IQR) | 518 (188, 1088) | 582 (231, 1179) | 0.0001 |
| Total follow‐up time (years) | 7.94 (3.97, 12.5) | ||
| Median (IQR) | 9.10 (5.15, 13.3) | 7.36 (3.54, 12.0) | 0.0001 |
| HBV status able to be determined on first test, n (%)‡ | 14 628 (43.5) | 15 032 (23.2) | <0.0005 |
| Females | 12 910 (22.1) | <0.0005 | |
| Males | 17 210 (40.8) | ||
| HBV status on first test, n (%) | <0.0005 | ||
| No markers | 3391 (10.1) | 7336 (11.3) | <0.0005 |
| Vaccinated | 2014 (5.98) | 4191 (6.51) | <0.0005 |
| Immunity by past exposure | 5690 (16.9) | 2024 (3.12) | <0.0005 |
| Unspecified immunity | 1364 (4.05) | 6102 (9.41) | <0.0005 |
| HBV positive | 2054 (6.10) | 861 (1.33) | <0.0005 |
| Isolated anti‐HBc | 1479 (4.39) | 620 (0.96) | <0.0005 |
| Unknown | 17 666 (52.5) | 43 701 (67.4) | <0.0005 |
ASGC, Australian Standard Geographical Classification; HBc, hepatitis B core antigen; HBV, hepatitis B virus; IQR, interquartile range.
2297 people did not have their Indigenous status recorded in the dataset.
156 people (64 Indigenous, 77 non‐Indigenous, 15 unknown) did not have their sex recorded in the dataset.
388 people (165 Indigenous, 116 non‐Indigenous, 107 unknown) did not have their age recorded in the dataset.
4818 people (3577 Indigenous, 1217 non‐Indigenous, 24 unknown) were eligible for both vaccination programmes based on their year of birth.
Most participants (53.8%) were only tested once in this study, although Indigenous people had a median of two tests per person (IQR 1–4, P < 0.0005). For individuals who were tested multiple times, the median time between tests was 545 days (IQR 202‐1121), with a median of 518 days (IQR 188‐1088) for Indigenous individuals (P < 0.0005). The majority of participants (62.3%) did not have enough serological markers tested to identify their HBV status on their first testing episode. A significantly higher proportion of Indigenous individuals were able to be classified compared to non‐Indigenous people (43.5% and 23.2% respectively, P < 0.0005), and a higher proportion of males were able to be classified than females (40.8% vs 22.1%, P < 0.0005). A higher proportion of Indigenous people had serology indicating immunity through past exposure (16.9%, P < 0.0005) or HBV infection (6.10%, P < 0.0005) compared to non‐Indigenous participants (3.12% and 1.33% respectively). 55 252 individuals had valid serology results in 2011, representing 26.1% of the total NT population in 2011.32
HBV prevalence
HBV prevalence was highest in the first year of test results (4.04%), and subsequently fluctuated between 3.03% and 4.04% before reaching its lowest point of 2.81% in 2010 (Fig. 1A). HBV prevalence in Indigenous people peaked in 1999 (8.12%) and continued to decline each year, reaching its lowest point in 2011 (5.22%). For non‐Indigenous Australians, HBV prevalence remained between 1.31% and 1.79% for the entirety of the study period. Odds ratios for HBV positivity were 4.59 (4.35–4.84 95% CI, P < 0.0005) for Indigenous individuals compared to non‐Indigenous Australians, 0.57 (0.55–0.6 95% CI, P < 0.0005) for females compared to males and 0.98 (0.97–0.99 95% CI, P < 0.0005) for people living in an outer regional area compared to a remote or very remote area.
Figure 1.
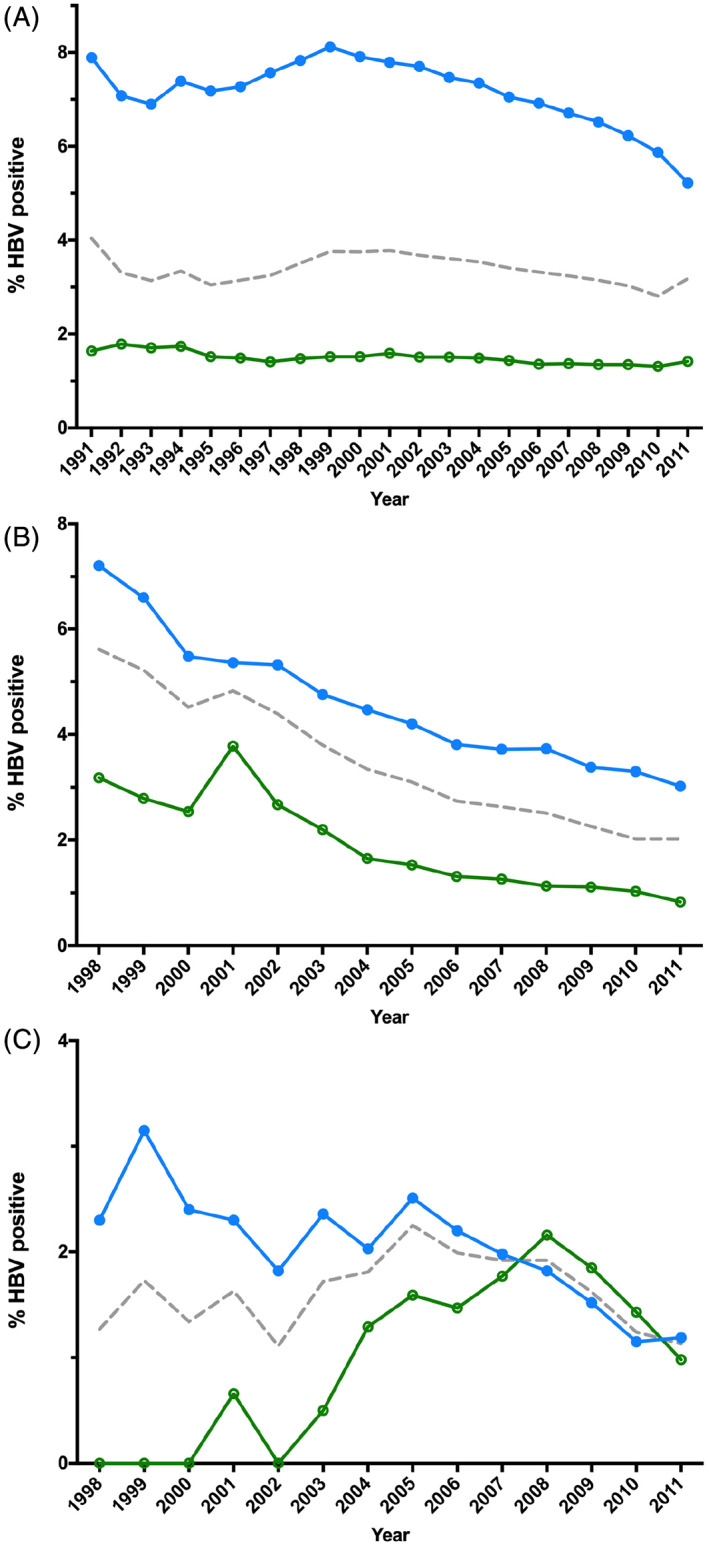
Yearly HBV prevalence in people tested for HBV for any reason in the NT between January 1991 and December 2011, stratified by Indigenous status. (A) Prevalence for all people tested. (B) Prevalence within people eligible for school‐based vaccination in 1998. (C) Prevalence within people eligible for universal infant vaccination. ( ), Indigenous; (
 ), non‐Indigenous; (
 ), total.
For people who were eligible for the school catch‐up vaccination programme, HBV prevalence steadily decreased over each year of testing, from 5.61% in 1998 to 2.02% in 2010 and 2011 (Fig. 1B). HBV prevalence remained higher in Indigenous Australians compared to non‐Indigenous Australians, with an odds ratio of 2.81 (2.42–3.27 95% CI, P < 0.0005) for Indigenous people.
For individuals who were eligible to be vaccinated at birth, HBV prevalence fluctuated between 1.11% and 1.81% until reaching its highest in 2005 (2.25%), and subsequently declined each year to 1.13% in 2011 (Fig. 1C). HBV prevalence remained higher in Indigenous individuals until 2007, at which point HBV prevalence became higher in non‐Indigenous Australians, although this was not statistically significant, with an overall odds ratio of 1.23 (0.88–1.72 95% CI, P = 0.228) for Indigenous people.
HBV diagnoses
A total of 3202 people tested HBsAg positive, with 71.1% of these individuals identifying as Indigenous (P < 0.0005) (Table S1). The majority of people (57.8%) who tested HBV positive were male, with a median age of 34.7 years (IQR 24.6–46.9) at the time of their first HBsAg positive test in the study timeframe. A higher proportion of Indigenous Australians who tested HBsAg positive lived in a remote or rural area (68.3%) compared to non‐Indigenous Australians (26.9%, P < 0.0005). 15.4% of people with HBV were eligible for standardised vaccination programmes, with a greater number of Indigenous people eligible for school‐based vaccination (P = 0.02). Indigenous people underwent repeat testing slightly more than non‐Indigenous individuals, with a median of three tests per person (IQR 2–6, P < 0.0005). Indigenous Australians were also tested or engaged in care with a NT government health service for longer periods of time than non‐Indigenous Australians, with a median of 10.6 years (IQR 6.67–14.3) compared to 8.82 years (IQR 4.35–13.1, P < 0.0005).
The majority of people (61.5%) with an HBV positive test were HBeAg negative on their first HBV positive test, with no difference in HBeAg status on the first HBV positive test between Indigenous and non‐Indigenous individuals, regardless of age (Fig. 2A, Table S2). There was no overall difference in the rate of HBeAg seroconversion between Indigenous and non‐Indigenous people, even when stratified by age group (Fig. 2B).
Figure 2.
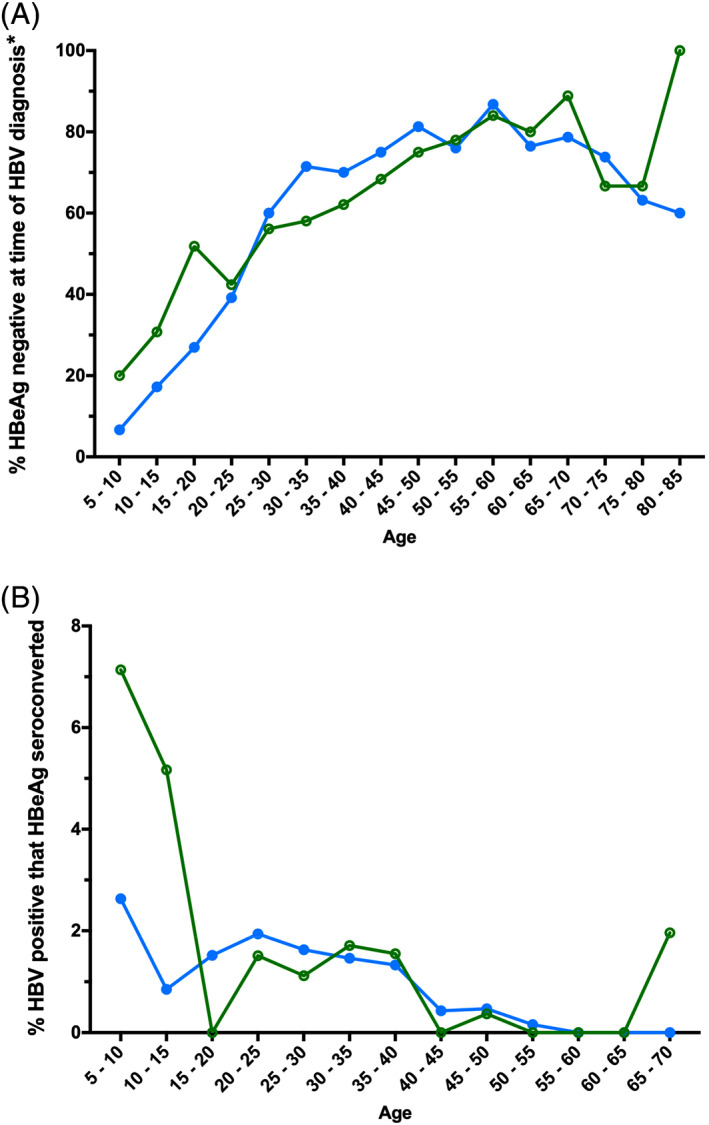
HBeAg serology stratified by Indigenous status and age group at the time of testing. (A) Percentage of individuals who tested HBeAg negative on their first HBV positive test during the study period, by age at the time of their first HBV positive test and by Indigenous status. *‘HBV diagnosis’ refers to an individual's first positive HBV test in our dataset, although they may have been diagnosed before 1991. (B) Percentage of individuals that HBeAg seroconverted (on their first HBV positive test also tested HBeAg positive, then subsequently tested HBeAg negative), by age at the time of confirmed HBeAg loss and Indigenous status. ( ), Indigenous; (
 ), non‐Indigenous. HBeAg, hepatitis B e antigen; HBV, hepatitis B virus.
Test results of people eligible for standardised vaccination
A total of 22 040 individuals (21.4%) was eligible to be included in vaccination programmes based on their date of birth, with 47.9% of these individuals identifying as Indigenous (Table S2). Of these, only 9384 people (42.6%) had enough serological markers in one testing episode tested during the study period to determine their HBV status without further information or access to clinical records (Table S2). As a result, individuals who were categorised as immune with an unspecified mechanism or as unknown were excluded from further analysis.
Within the cohort of all individuals eligible for any vaccination programmme (infant or school‐based) with a known immunity status (n = 9264), Indigenous people had a higher proportion of HBsAg positivity on their most recent test (5.39% vs 3.34%, P < 0.0005), as well as a lower proportion of vaccination‐derived immunity (32.2% compared to 41.5%, P < 0.0005), a higher proportion of immunity through past exposure (29.7% vs 7.57%, P < 0.0005) and a higher proportion of isolated anti‐HBc positivity than non‐Indigenous people (4.22% and 2.44% respectively, P < 0.0005) (Fig. 3A).
Figure 3.
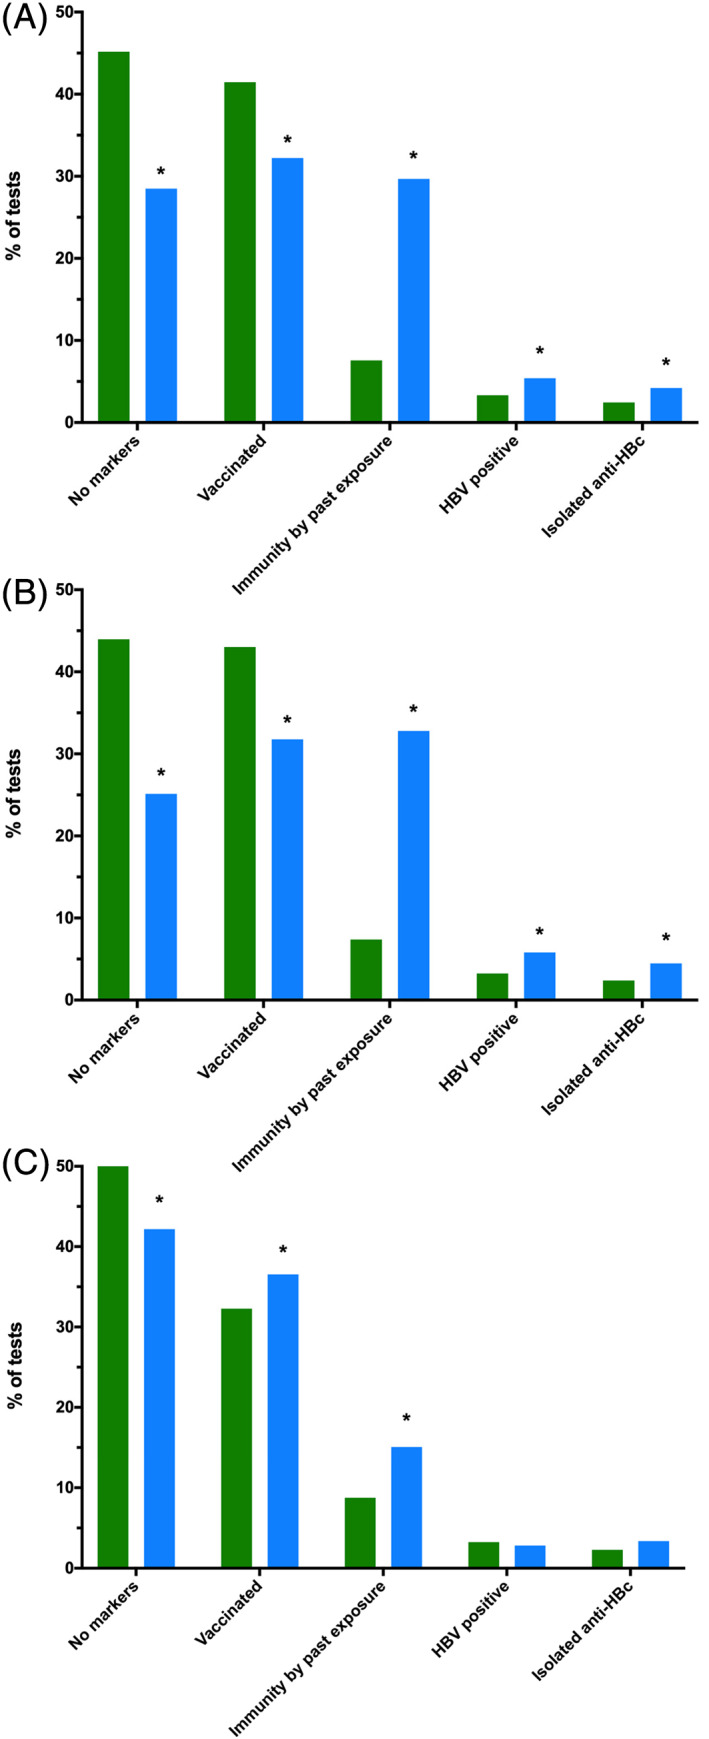
Individuals' most recent hepatitis B virus (HBV) serology results stratified by Indigenous status and eligibility for standardised vaccination, with unknown or inconclusive serology excluded. (A) Individuals eligible for any standardised vaccination programme (n = 9264). (B) Individuals eligible for school‐based catch‐up vaccination (n = 8057). (C) Individuals eligible for universal birth vaccination (n = 3386). ( ), Indigenous; (
 ), non‐Indigenous. *P < 0.0005. anti‐HBc, antibody to hepatitis B core antigen.
The pattern of serology results for people eligible for vaccination at school (n = 8057) was similar to the overall cohort of all eligible for standardised vaccination programmes. A larger proportion of Indigenous individuals were HBsAg positive on their most recent test (5.81% vs 3.25%, P < 0.0005), fewer with markers of vaccination‐derived immunity (31.8% vs 43.0%, P < 0.0005), a greater proportion with immunity through past exposure (32.8% compared to 7.38%, P < 0.0005) and a higher number of isolated anti‐HBc positivity than non‐Indigenous people (4.48% and 2.38% respectively, P < 0.0005) (Fig. 3B).
For individuals eligible for infant vaccination (n = 3386), a higher proportion of Indigenous people had vaccine‐derived immunity than non‐Indigenous people (36.6% vs 32.3%, P < 0.0005), and a greater proportion of people with immunity through past infection (15.1% compared to 8.76%, P < 0.0005) (Fig. 3C). A statistically significant difference was not seen between Indigenous and non‐Indigenous individuals in HBsAg positivity or isolated anti‐HBc.
Vaccination efficacy
Changes in immunity status were evaluated over time in the cohort of people who had serology indicative of vaccination on their first HBV test (n = 6473) (Table 3). 31.1% of these individuals identified as Indigenous, and 51.1% were female. Individuals in this subgroup had a median age of 29.5 years (IQR 22.9–40.2) on their first HBV testing episode, and a median follow‐up time of 4.57 years (IQR 1.95–8.65).
Table 3.
Testing patterns of people who had serology indicating vaccination on their first HBV test, and indicators of vaccine efficacy
| Indigenous†(n = 33 658) | Non‐Indigenous (n = 64 835) | P value | |
|---|---|---|---|
| Demographics | |||
| Number of individuals, n (%)‡ | 2014 (5.98) | 4191 (6.46) | <0.0005 |
| Female | 859 (42.8) | 2448 (58.5) | <0.0005 |
| Male | 1146 (57.2) | 1735 (41.5) | <0.0005 |
| Age at time of first HBV test in the study period (years) | 29.6 (23.1, 40.2) | ||
| Females | 29.6 (23.5, 41.2) | 0.008 | |
| Males | 29.5 (22.4, 39.3) | ||
| Median (IQR) | 25.7 (18.8, 40.1) | 30.5 (25.1, 40.3) | <0.0005 |
| People eligible for vaccination programmes, n (%)§ | 897 (44.5) | 1119 (26.7) | <0.0005 |
| School catch‐up vaccination | 690 (76.9) | 999 (89.3) | <0.0005 |
| Universal birth vaccination¶ | 547 (61.0) | 235 (21.0) | <0.0005 |
| Time between subsequent tests (days) | 400 (157, 943) | ||
| Median (IQR) | 386 (166, 879) | 413.5 (146, 985) | 0.14 |
| Total number of tests for these individuals, n (%) | 2 (1, 4) | ||
| Median per person (IQR) | 3 (2, 6) | 2 (1, 3) | <0.0005 |
| Total follow‐up time (years) | 4.57 (1.95, 8.65) | ||
| Median (IQR) | 5.52 (2.85, 9.65) | 4.31 (1.59, 8.07) | <0.0005 |
| Vaccine failure | |||
| Number of people that subsequently became HBsAg positive n (%) | 1 (0.05) | 0 | |
| Breakthrough HBV infection (anti‐HBc appearance) | |||
| Number of people that subsequently became anti‐HBc positive, n (%) | 171 (8.49) | 26 (0.62) | <0.0005 |
| Females | 76 (44.4) | 9 (34.6) | 0.40 |
| Males | 95 (55.6) | 17 (65.4) | |
| Age when anti‐HBc was detected (years) | 38.4 (30.4, 48.2) | ||
| Median (IQR) | 38.8 (30.9, 49.5) | 34.5 (25.9, 45.7) | 0.17 |
| Time to anti‐HBc positivity (years) | 5.59 (2.51, 9.21) | ||
| Median (IQR) | 5.98 (2.57, 9.44) | 3.96 (2.29, 7.55) | 0.16 |
| Number of tests for these individuals, n (%) | 5 (3, 8) | ||
| Median per person (IQR) | 5 (4, 9) | 4.5 (3, 6) | 0.03 |
| People eligible for vaccination programs, n (%) | 22 (12.9) | 4 (15.4) | 0.38 |
| School catch‐up vaccination | 22 (100) | 4 (100) | |
| Universal birth vaccination | 6 (27.3) | 0 | |
| Total follow‐up time (years) | 11.9 (8.37, 15.4) | ||
| Median (IQR) | 11.9 (8.45, 15.4) | 11.4 (7.04, 14.2) | 0.51 |
| Undetectable anti‐HBs titre | |||
| Number of people that subsequently had an undetectable anti‐HBs titre, n (%) | 151 (7.50) | 137 (3.27) | <0.0005 |
| Females | 54 (35.8) | 86 (62.8) | <0.0005 |
| Males | 97 (64.2) | 51 (37.2) | |
| Age when anti‐HBs was not detected (years) | 33.2 (25.4, 43.7) | ||
| Median (IQR) | 30.6 (21.4, 42.5) | 34.5 (28.2, 45.0) | 0.002 |
| Time to undetectable anti‐HBs (days) | 1142.5 (511, 2360) | ||
| Median (IQR) | 1318 (524, 2568) | 1087 (501, 2185) | 0.27 |
| Number of tests for these individuals, n (%) | 4 (3, 5) | ||
| Median per person (IQR) | 4 (3, 6) | 3 (2, 4) | <0.0005 |
| People eligible for vaccination programmes, n (%) | 54 (35.8) | 18 (13.1) | <0.0005 |
| School catch‐up vaccination | 44 (81.5) | 18 (100) | 0.001 |
| Universal birth vaccination | 25 (46.3) | 5 (27.8) | 0.001 |
| Total follow‐up time (years) | 5.70 (2.91, 8.97) | ||
| Median (IQR) | 6.41 (3.31, 9.96) | 5.05 (2.28, 7.81) | 0.12 |
112 people without their Indigenous status recorded in the dataset demonstrated vaccination serology on their first test.
18 people (9 Indigenous, 1 non‐Indigenous, 1 unknown) without their sex recorded in the dataset demonstrated vaccination serology on their first test.
13 people (7 Indigenous, 9 non‐Indigenous) did not have their age recorded in the dataset.
455 people (340 Indigenous, 115 non‐Indigenous) were eligible for both vaccination programmes based on their year of birth. anti‐HBc, antibody to hepatitis B core antigen; anti‐HBs, antibody to hepatitis B surface antigen; HBsAg, hepatitis B surface antigen; HBV, hepatitis B virus; IQR, interquartile range.
Of these individuals, one Indigenous person subsequently became HBsAg positive (0.02%). A further 198 people subsequently tested anti‐HBc positive (3.06%), of which 86.4% were Indigenous (HR 1.29, 1.16–1.43 95% CI, P < 0.0005). 42.9% of these people were female (HR 0.55, 0.42–0.73 95% CI, P < 0.0005), and 13.1% were eligible for standardised vaccination (HR 0.57, 0.35–0.93 95% CI, P < 0.0005). This group that became anti‐HBc positive had a median age of 38.4 years old at the time of anti‐HBc appearance (IQR 30.4–48.2), and a median follow‐up time of 11.9 years (IQR 8.37–15.4), with no significant differences observed between Indigenous and non‐Indigenous Australians.
Of the presumed vaccinated cohort, 290 individuals (4.48%) subsequently returned a not detected anti‐HBs titre result indicating a waning anti‐HBs titre but did not develop HBsAg positivity. 52.1% of these individuals identified as Indigenous (HR 1.06, 0.96–1.14 95% CI, P = 0.32), 48.3% of these people were female (HR 0.87, 0.69–1.09 95% CI, P = 0.21), and 24.8% were eligible for standardised vaccination (HR 0.57, 0.44–0.74 95% CI, P < 0.0005). Indigenous individuals demonstrated an undetectable anti‐HBs at a younger median age than non‐Indigenous people (P = 0.002), and the median follow‐up time was 5.70 years (IQR 2.91–8.97), with no difference seen between Indigenous and non‐Indigenous individuals.
Discussion
HBV prevalence in the NT
This large longitudinal study has demonstrated a higher proportion of HBV positivity in 2011 across the general NT population (3.17%) and in Indigenous populations (5.22%) compared to previous 2011 estimates of 1.70% (3.70% in Indigenous populations).8 HBV prevalence estimates for the NT and for Indigenous peoples have previously been calculated almost exclusively using cross‐sectional serosurveys, national notifications data and diagnostic testing results.4, 5, 6, 10 By calculating prevalence through multiple test results over time, this study decreased the proportion of individuals with an unclear HBV status by 12.7%. This approach has allowed for the determination of HBV status for individuals where clinicians have only ordered serological markers informed by their patients' past medical history, and enabled changes in HBV status over time to be tracked. While the prevalence of CHB in those referred for HBV testing is likely to be higher than prevalence in the general population (due to referral bias), testing for Indigenous peoples in the NT is often performed for screening rather than for clinical suspicion as part of an Indigenous adult health check and thus we believe these results are likely to be more accurate than previous estimates, many of which have been based on antenatal screening tests,6 and may underestimate the prevalence of HBV in men. Due to the nature of antenatal screening whereby pregnant women in the NT were only routinely tested for HBsAg positivity until 2015,33 a higher proportion of males were able to have their HBV status determined than females, decreasing the likelihood that we have underestimated the prevalence of HBV in men living in the NT.
HBV prevalence declined from 4.04% to a low of 2.81% over the study period; however, HBV prevalence remained significantly higher in Indigenous Australians than non‐Indigenous people (OR 4.59), and significantly lower in women compared to men (OR 0.57). Standardised vaccination programmes resulted in a narrowing of the disparity between Indigenous and non‐Indigenous individuals, with an OR of 2.81 for Indigenous people eligible for school‐based vaccination, and an OR of 1.23 for Indigenous people eligible for universal infant vaccination. Despite HBV prevalence decreasing prior to standardised vaccination being implemented in the NT,6, 34 it is clear that vaccination has played a role in reducing the burden of CHB in Indigenous communities. Whilst there are several factors driving this decrease, the increase in the proportion of individuals vaccinated on their most recent test from the general population (23.2%), to those eligible for school‐based vaccination (31.5%), to those eligible for universal vaccination (31.8%), and the corresponding decrease in serologic evidence of past exposure (25.6% to 23.0% to 13.5%) suggests that vaccination is playing a role in the prevention of HBV infection. However, the prevalence in those eligible for infant vaccination did not decrease below the national average, which may in part be due to the failure of immunoprophylaxis of children born to HBV positive mothers with high viral loads.35 While these estimates should be interpreted with caution due to the relatively small numbers of people tested who were born after 1982, this shows that vaccination programmes have had an impact in reducing the burden of CHB in younger NT residents.
From 2007, HBV prevalence in non‐Indigenous people born since the introduction of universal infant vaccination in the NT eclipsed that of Indigenous individuals. This is likely due to the effects of migration of individuals born in high prevalence areas between 1996 and 2011 to the NT, including from Cambodia, China, and the Philippines.6, 36 This dataset did not include country of birth information so there is a limited ability to analyse this further.
HBV vaccine efficacy
The present study reports new insights into the role of suboptimal vaccine efficacy in CHB prevention. Of those individuals with serology indicating vaccine‐derived immunity on their first test in the dataset, only one (0.02%) person subsequently became HBsAg positive. It is possible that this person's first test returned a falsely negative HBsAg or falsely positive anti‐HBs, that this person was incompletely vaccinated, or that this is in fact a true vaccine failure. Regardless, this is substantially lower than expected given the known issues with maintenance of the cold chain and the administration of plasma‐derived vaccines in the early years of infant vaccination in the NT.
A small subsection (3.06%) of the presumed vaccinated cohort subsequently developed anti‐HBc positivity, of which 86.4% identified as Indigenous (HR 1.17). One potential explanation for this result is that serotype mismatch plays a role in vaccine efficacy. Aboriginal communities in northern Australia have been observed to be exclusively infected with HBV/C4, serotype ayw3, whilst the current vaccine is genotype A2‐based, serotype adw2.18, 19 Several NT‐based studies have found high proportions of Aboriginal adolescents who were vaccinated with no detectable immunity,15, 17 with evidence of acute infection through anti‐HBc positivity16 and with HBsAg positivity.15 A further study from The Gambia, where a serotype mismatch also exists, reported breakthrough anti‐HBc positivity in 27.4% of their fully vaccinated cohort after 20 years.21 These studies, in combination with the present data, suggest that the current HBV vaccine is sufficient to protect against chronic infection (and possibly symptomatic acute infection, as demonstrated in a study of Alaska Native people28), but not against acute infection in populations with a serotype mismatch, although a study of vaccinated Indigenous individuals living in Western Australia found a small number of people who developed CHB.37 A recent data linkage study found that 94.1% of people born after 1990 in five NT Indigenous communities received a full vaccination course,38 further suggesting that implementation issues are unlikely to explain the decrease in vaccine efficacy observed.
Anti‐HBc breakthrough may have occurred in some participants due to the decreased efficacy of HBV vaccination in adults over the age of 40 years,39, 40 although the median age of individuals with vaccination serology on their first test was 29.6 years old. It is possible that some of these individuals may have been exposed to HBV before being vaccinated and therefore had a false negative on their first anti‐HBc test. However, there is evidence to suggest that acute infection can occur after developing an appropriate response to the vaccine – a previous study found that 58.7% of a fully vaccinated cohort with breakthrough anti‐HBc positivity detected at ages 19–21 had been anti‐HBs positive and anti‐HBc negative at age 10–11, indicating that they had been exposed to HBV well after developing an appropriate anti‐HBs response to the vaccine.41
The presence of anti‐HBc in patients who were presumed fully vaccinated presents consequences for individuals who may in the future require immunosuppression. Aboriginal people have higher rates of chronic kidney disease,42 liver cancer43 and autoimmune conditions, such as systemic lupus erythematosus44 and it is important to screen prior to initiating immunosuppressive therapy.45
HBV trajectory and the role of HBV/C4
Genotype C HBV is an independent risk factor for the development of HCC and has been described as an aggressive genotype of HBV,46, 47, 48, 49 while HBV/C4 has been associated with delayed HBeAg seroconversion, and a more rapid progression to cirrhosis and HCC.50 A previous study of Indigenous Australians with HBV/C4 demonstrated a higher than expected proportion of individuals over the age of 40 years that remained HBeAg positive.18 In the present study, 61.5% of HBV positive individuals tested HBeAg negative on their first test within the dataset, with no difference observed between Indigenous Australians and non‐Indigenous Australians. Further, no difference was observed in the rates of HBeAg seroconversion by age between Indigenous and non‐Indigenous participants. However, given the increasing numbers of migrants from high prevalence areas to the NT, it is likely that the trajectory of HBV/C4 has been compared to other genotype C variants in this study. Without further clinical or demographic information, this cannot be analysed further.
Limitations
The present study did not include access to detailed demographic data, vaccination history and further clinical information that could stratify individuals living with CHB into the four HBV phases according to disease activity. Without anti‐HBs serological titres or vaccination records, it is likely that the number of individuals with vaccination‐derived immunity has been underestimated given anti‐HBs titres can decrease over time but still offer protection against HBV.28, 51, 52, 53 As clinical guidelines in the NT did not recommend completing a full serological panel when testing for HBV until 2015,33 a substantial number of individuals did not have enough data available to be serocoded. Country of birth was not available for non‐Indigenous people in the infant vaccine eligible cohort and the higher prevalence in later years suggests they may have been born outside the NT.
Conclusion
This analysis has demonstrated a higher HBV prevalence in the NT than described in previous cross‐sectional studies, including a higher prevalence in Indigenous people. HBV prevalence and exposure has decreased with the implementation of standardised vaccination programmes, substantially decreasing the disparity in HBV burden that young Indigenous Australians face. Despite known challenges in implementing HBV vaccination in the NT, the failure rate of the vaccine in preventing HBsAg positive infection was low. Evidence of suboptimal vaccine efficacy as determined by breakthrough anti‐HBc positivity in vaccinated individuals was demonstrated predominantly in Indigenous individuals, which may be attributable to vaccine serotype mismatch and may have significant clinical implications for Indigenous patients requiring immunosuppressive therapy. No difference in HBeAg positivity or seroconversion was observed between Indigenous and non‐Indigenous individuals living with CHB.
A more complete analysis of HBV status in Indigenous people in the NT is currently underway54 which will include clinical data allowing for the exploration of the natural history of CHB in Indigenous people in a way that serological analyses alone cannot. However, this study shows that while the burden of CHB in Indigenous people in the NT is well known, it has previously been underestimated. While ongoing vaccination of infants against HBV is a crucial element of controlling CHB in the NT and Australia, increased efforts to provide care to the substantial number of people living with CHB in the NT, particularly Indigenous people who represent the majority of those affected by CHB, are of fundamental public health importance.
Supporting information
Figure S1 Flow diagram detailing data sources, final dataset creation and total individuals and testing episodes included in this study.
Table S1 Demographic data, testing patterns and first test serology of people who tested positive for HBV during the study period.
Table S2 Demographic data, testing patterns and most recent test serology of people who were eligible for standardised vaccination programs based on their year of birth.
Acknowledgements
We acknowledge the traditional custodians of the lands where this research was undertaken. We thank the patients whose data contributed to this work. We also thank Dr Margaret Littlejohn and Professor Peter Revill for their insights relating to anti‐HBc positivity in vaccinated individuals.
Throughout this journal article, 'Indigenous' refers to Australian Aboriginal and Torres Strait Islander peoples. It is understood that there is no single Australian Aboriginal or Torres Strait Islander culture or group. Aboriginal and Torres Strait peoples are the first peoples of Australia and have a strong and resilient history.
Funding: None.
Conflict of interest: None.
Disclosure: The authors declare no conflicts of interest in the data collection, analysis and manuscript preparation. J. S. Davis and J. Davies received an unrestricted educational grant from Gilead for a separate hepatitis B‐related project. J. S. Davis and J. Davies received salary support from the Australian National Health and Medical Research Council (NHMRC). J. Davies is a NHMRC Early Career Fellow, and J. S. Davis is a NHMRC Career Development Fellow. The funders had no role in the study design, data collection and analysis, decision to publish or preparation of the manuscript. There was no other specific funding for this project.
References
- 1.Schweitzer A, Horn J, Mikolajczyk RT, Krause G, Ott JJ. Estimations of worldwide prevalence of chronic hepatitis B virus infection: a systematic review of data published between 1965 and 2013. Lancet 2015; 386: 1546–55. [DOI] [PubMed] [Google Scholar]
- 2.Stanaway JD, Flaxman AD, Naghavi M, Fitzmaurice C, Vos T, Abubakar Iet al. The global burden of viral hepatitis from 1990 to 2013: findings from the global burden of disease study 2013. Lancet 2016; 388: 1081–8. [DOI] [PMC free article] [PubMed] [Google Scholar]
- 3.Pan CQ, Zhang JX. Natural history and clinical consequences of hepatitis B virus infection. Int J Med Sci 2005; 2: 36–40. [DOI] [PMC free article] [PubMed] [Google Scholar]
- 4.MacLachlan J, Thomas L, Cowie B. Viral Hepatitis Mapping Project: National Report 2017. Sydney: Australasian Society for HIV, Viral Hepatitis and Sexual Health Medicine (ASHM); 2019. http://ashm.org.au/products/product/Viral-Hepatitis-Mapping-Project-2017. [Google Scholar]
- 5.Graham S, MacLachlan JH, Gunaratnam P, Cowie BC. Chronic hepatitis B prevalence in Australian Aboriginal and Torres Strait islander people before and after implementing a universal vaccination program: a systematic review and meta‐analysis. Sex Health 2019; 16: 201–11. [DOI] [PubMed] [Google Scholar]
- 6.Davies J, Li SQ, Tong SY, Baird RW, Beaman M, Higgins Get al. Establishing contemporary trends in hepatitis B sero‐epidemiology in an Indigenous population. PLoS One 2017; 12: e0184082. [DOI] [PMC free article] [PubMed] [Google Scholar]
- 7.Parker C, Tong SYC, Dempsey K, Condon J, Sharma SK, Chen JWCet al. Hepatocellular carcinoma in Australia's Northern Territory: high incidence and poor outcome. Med J Aust 2014; 201: 470–4. [DOI] [PubMed] [Google Scholar]
- 8.MacLachlan J, Cowie BC. Hepatitis B mapping project: estimates of chronic hepatitis B prevalence and cultural and linguistic diversity by medicare local, 2011—National Report. Sydney: Australasian Society for HIV, Viral Hepatitis and Sexual Health Medicine; 2013.
- 9.MacLachlan JH, Allard N, Towell V, Cowie BC. The burden of chronic hepatitis B virus infection in Australia, 2011. Aust N Z J Public Health 2013; 37: 416–22. [DOI] [PubMed] [Google Scholar]
- 10.Graham S, Guy RJ, Cowie B, Wand HC, Donovan B, Akre SPet al. Chronic hepatitis B prevalence among Aboriginal and Torres Strait islander Australians since universal vaccination: a systematic review and meta‐analysis. BMC Infect Dis 2013; 13: 403. [DOI] [PMC free article] [PubMed] [Google Scholar]
- 11.Australian Bureau of Statistics (ABS) . 3238.0.55.001–Estimates of Aboriginal and Torres Strait Islander Australians. Canberra: ABS; 2018. [cited 2019 Sep 17]. Available from URL: https://www.abs.gov.au/AUSSTATS/abs@.nsf/Lookup/3238.0.55.001Main+Features
- 12.Petersen KM, Bulkow LR, McMahon BJet al. Duration of hepatitis B immunity in low risk children receiving hepatitis B vaccinations from birth. Pediatr Infect Dis J 2004; 23: 650–5. [DOI] [PubMed] [Google Scholar]
- 13.Nayda C, Miller NC, Kempe A, Department of Health and Aged Care, Immunise Australia Program . Immunisation Keep It Cool: The Vaccine Cold Chain: Guidelines for Immunisation Providers on Maintaining the Cold Chain. Commonwealth Department of Health and Aged Care; 2001. [cited 2019 Nov 7]. Available from URL: https://catalogue.nla.gov.au/Record/2717907
- 14.Miller NC, Harris MF. Are childhood immunization programmes in Australia at risk? Investigation of the cold chain in the Northern Territory. Bull World Health Organ 1994; 72: 401–8. [PMC free article] [PubMed] [Google Scholar]
- 15.Dent E, Selvey CE, Bell A, Davis J, McDonald MI. Incomplete protection against hepatitis B among remote Aboriginal adolescents despite full vaccination in infancy. Commun Dis Intell Q Rep 2010; 34: 435–9 [cited 2019 Jul 12]. [DOI] [PubMed] [Google Scholar]
- 16.Cheah BC, Davies J, Singh GR, Wood N, Jackson K, Littlejohn Met al. Sub‐optimal protection against past hepatitis B virus infection where subtype mismatch exists between vaccine and circulating viral genotype in northern Australia. Vaccine 2018; 36: 3533–40. [DOI] [PubMed] [Google Scholar]
- 17.Hanna JN, Sexton WL, Faoagali JL, Buda PJ, Kennett ML, Brussen KA. Immunity to hepatitis B, poliomyelitis and measles in fully vaccinated Aboriginal and Torres Strait Island children. J Paediatr Child Health 1995; 31: 345–9. [DOI] [PubMed] [Google Scholar]
- 18.Davies J, Littlejohn M, Locarnini SA, Whiting S, Hajkowicz K, Cowie BCet al. The molecular epidemiology of hepatitis B in the Indigenous people of northern Australia. J Gastroenterol Hepatol 2013; 28: 1234–41. 10.1111/jgh.12177. [DOI] [PubMed] [Google Scholar]
- 19.Littlejohn M, Davies J, Yuen L, Edwards R, Sozzi T, Jackson Ket al. Molecular virology of hepatitis B virus, sub‐genotype C4 in northern Australian Indigenous populations. J Med Virol 2014; 86: 695–706. [DOI] [PubMed] [Google Scholar]
- 20.Cassidy A, Mossman S, Olivieri A, De RM, Leroux‐Roels G. Hepatitis B vaccine effectiveness in the face of global HBV genotype diversity. Expert Rev Vaccines 2011; 10: 1709–15. [DOI] [PubMed] [Google Scholar]
- 21.Viviani S, Carrieri P, Bah E, Hall AJ, Kirk GD, Mendy Met al. 20years into The Gambia hepatitis intervention study: assessment of initial hypotheses and prospects for evaluation of protective effectiveness against liver cancer. Cancer Epidemiol Biomarkers Prev 2008; 17: 3216–23. [DOI] [PubMed] [Google Scholar]
- 22.Tacke F, Amini‐Bavil‐Olyaee S, Heim A, Luedde T, Manns MP, Trautwein C. Acute hepatitis B virus infection by genotype F despite successful vaccination in an immune‐competent German patient. J Clin Virol 2007; 38: 353–7. [DOI] [PubMed] [Google Scholar]
- 23.Lin AW, Wong K. Long‐term protection of neonatal hepatitis B vaccination in a 30‐year cohort in Hong Kong. J Hepatol 2013; 59: 1363–4. [DOI] [PubMed] [Google Scholar]
- 24.O'Halloran JA, De Gascun CF, Dunford Let al. Hepatitis B virus vaccine failure resulting in chronic hepatitis B infection. J Clin Virol 2011; 52: 151–4. [DOI] [PubMed] [Google Scholar]
- 25.Huang M‐L, Liao W‐L, Ho M‐S. HBV serological markers of vaccinated children in remote areas of Taiwan: emphasis on factors contributing to vaccine failure. Vaccine 2007; 25: 6326–33. [DOI] [PubMed] [Google Scholar]
- 26.Wen W‐H, Chen H‐L, Ni Y‐H, Hsu HY, Kao JH, Hu FCet al. Secular trend of the viral genotype distribution in children with chronic hepatitis B virus infection after universal infant immunization. Hepatology 2011; 53: 429–36. [DOI] [PubMed] [Google Scholar]
- 27.Stramer SL, Wend U, Candotti D, Foster GA, Hollinger FB, Dodd RYet al. Nucleic acid testing to detect HBV infection in blood donors. N Engl J Med 2011; 364: 236–47. [DOI] [PubMed] [Google Scholar]
- 28.McMahon BJ, Dentinger CM, Bruden Det al. Antibody levels and protection after hepatitis B vaccine: results of a 22‐year follow‐up study and response to a booster dose. J Infect Dis 2009; 200: 1390–6. [DOI] [PubMed] [Google Scholar]
- 29.But DY‐K, Lai C‐L, Lim W‐L, Fung J, Wong DK‐H, Yuen M‐F. Twenty‐two years follow‐up of a prospective randomized trial of hepatitis B vaccines without booster dose in children: final report. Vaccine 2008; 26: 6587–91. [DOI] [PubMed] [Google Scholar]
- 30.Greub G, Zysset F, Genton B, Spertini F, Frei PC. Absence of anti‐hepatitis B surface antibody after vaccination does not necessarily mean absence of immune response. Med Microbiol Immunol 2001; 189: 165–8. [DOI] [PubMed] [Google Scholar]
- 31.Ward K, Quinn H, Menzies R, McIntyre P. A history of adolescent school based vaccination in Australia. Commun Dis Intell Q Rep 2013; 37: E168–74. [DOI] [PubMed] [Google Scholar]
- 32.Australian Bureau of Statistics (ABS) . 2016. Census: Northern Territory. Canberra: ABS; 2017.
- 33.Centre for Disease Control (CDC) . Northern Territory hepatitis B vaccination and public health guidelines. Darwin: CDC; 2013.
- 34.Liu B, Guthridge S, Li SQ, Markey P, Krause V, McIntyre Pet al. The end of the Australia antigen? An ecological study of the impact of universal newborn hepatitis B vaccination two decades on. Vaccine 2012; 30: 7309–14. [DOI] [PubMed] [Google Scholar]
- 35.Zhang L, Gui X, Wang B, Ji H, Yisilafu R, Li Fet al. A study of immunoprophylaxis failure and risk factors of hepatitis B virus mother‐to‐infant transmission. Eur J Pediatr 2014; 173: 1161–8. [DOI] [PubMed] [Google Scholar]
- 36.Australian Bureau of Statistics . 3412.0 – Migration, Australia, 2013–14. Canberra: Commonwealth of Australia; 2015. [cited 2019 Nov 7]. Available from URL: https://www.abs.gov.au/AUSSTATS/abs@.nsf/Previousproducts/3412.0MainFeatures52013-14
- 37.Griffiths E, Reeve C, Marley JV. Hepatitis B notifications in a vaccinated cohort of Aboriginal people in the Kimberley region. Med J Aust 2014; 201: 343–6. [DOI] [PubMed] [Google Scholar]
- 38.Hosking K, Stewart G, Mobsby M, Skov S, Zhao Y, Su JYet al. Data linkage and computerised algorithmic coding to enhance individual clinical care for Aboriginal people living with chronic hepatitis B in the Northern Territory of Australia – is it feasible? PLoS One 2020; 15: e0232207. [DOI] [PMC free article] [PubMed] [Google Scholar]
- 39.Gara N, Abdalla A, Rivera E, Zhao X, Werner JM, Liang TJet al. Durability of antibody response against hepatitis B virus in healthcare workers vaccinated as adults. Clin Infect Dis 2015; 60: 505–13. [DOI] [PMC free article] [PubMed] [Google Scholar]
- 40.Yang S, Tian G, Cui Y, Ding C, Deng M, Yu Cet al. Factors influencing immunologic response to hepatitis B vaccine in adults. Sci Rep 2016; 6: 27251. [DOI] [PMC free article] [PubMed] [Google Scholar]
- 41.Xu B, Hu D‐C, Rosenberg DMet al. Chronic hepatitis B: a long‐term retrospective cohort study of disease progression in Shanghai, China. J Gastroenterol Hepatol 2003; 18: 1345–52. [DOI] [PubMed] [Google Scholar]
- 42.Lawton PD, McDonald SP, Snelling PL, Hughes J, Cass A. Organ transplantation in Australia. Transplantation 2017; 101: e345–6. [DOI] [PubMed] [Google Scholar]
- 43.Condon JR, Armstrong BK, Barnes A, Cunningham J. Cancer in Indigenous Australians: a review. Cancer Causes Control 2003; 14: 109–21. [DOI] [PubMed] [Google Scholar]
- 44.Nikpour M, Bridge JA, Richter S. A systematic review of prevalence, disease characteristics and management of systemic lupus erythematosus in Australia: identifying areas of unmet need. Intern Med J 2014; 44: 1170–9. [DOI] [PubMed] [Google Scholar]
- 45.Doyle J, Raggatt M, Slavin M, McLachlan SA, Strasser SI, Sasadeusz JJet al. Hepatitis B management during immunosuppression for haematological and solid organ malignancies: an Australian consensus statement. Med J Aust 2019; 210: 462–8. [DOI] [PubMed] [Google Scholar]
- 46.Yin J‐H, Zhao J, Zhang H‐W, Xie JX, Li WP, Xu GZet al. HBV genotype C is independently associated with cirrhosis in community‐based population. World J Gastroenterol 2010; 16: 379–83. [DOI] [PMC free article] [PubMed] [Google Scholar]
- 47.Yang H‐I, Yeh S‐H, Chen P‐J, Iloeje UH, Jen CL, Su Jet al. How WC LHS. JNCI J Natl Cancer Inst 2008; 100: 1134–43. [DOI] [PMC free article] [PubMed] [Google Scholar]
- 48.Chen Q‐Y, Harrison TJ, Sabin CA, Li GJ, Huang GM, Yang JYet al. The effect of HBV genotype C on the development of HCC differs between wild‐type viruses and those with BCP double mutations (T1762A1764). Hepat Mon 2014; 14: e16214. [DOI] [PMC free article] [PubMed] [Google Scholar]
- 49.Pujol FH, Navas M‐C, Hainaut P, Chemin I. Worldwide genetic diversity of HBV genotypes and risk of hepatocellular carcinoma. Cancer Lett 2009; 286: 80–8. [DOI] [PubMed] [Google Scholar]
- 50.Davies J, Smith EL, Littlejohn M, Edwards R, Sozzi V, Jackson Ket al. Towards genotype specific care for chronic hepatitis B: the first six years follow up from the CHARM cohort study. Open Forum Infect Dis 2019; 6: ofz469. [DOI] [PMC free article] [PubMed] [Google Scholar]
- 51.Bruce MG, Bruden D, Hurlburt D, Zanis C, Thompson G, Rea Let al. Antibody levels and protection after hepatitis B vaccine: results of a 30‐year follow‐up study and response to a booster dose. J Infect Dis 2016; 214: 16–22. [DOI] [PubMed] [Google Scholar]
- 52.Ni Y‐H, Chang M‐H, Wu J‐F, Hsu H‐Y, Chen H‐L, Chen D‐S. Minimization of hepatitis B infection by a 25‐year universal vaccination program. J Hepatol 2012; 57: 730–5. [DOI] [PubMed] [Google Scholar]
- 53.Poovorawan Y, Chongsrisawat V, Theamboonlers A, Leroux‐Roels G, Crasta PD, Hardt K. Persistence and immune memory to hepatitis B vaccine 20years after primary vaccination of Thai infants, born to HBsAg and HBeAg positive mothers. Hum Vaccin Immunother 2012; 8: 896–904. [DOI] [PMC free article] [PubMed] [Google Scholar]
- 54.Menzies School of Health Research . Chronic hepatitis B elimination partnership launched. Darwin; 2018. [cited 2019 Jun 02]. Available from URL: https://www.menzies.edu.au/icms_docs/293374_Chronic_hepatitis_B_elimination_partnership_launched.pdf
Associated Data
This section collects any data citations, data availability statements, or supplementary materials included in this article.
Supplementary Materials
Figure S1 Flow diagram detailing data sources, final dataset creation and total individuals and testing episodes included in this study.
Table S1 Demographic data, testing patterns and first test serology of people who tested positive for HBV during the study period.
Table S2 Demographic data, testing patterns and most recent test serology of people who were eligible for standardised vaccination programs based on their year of birth.