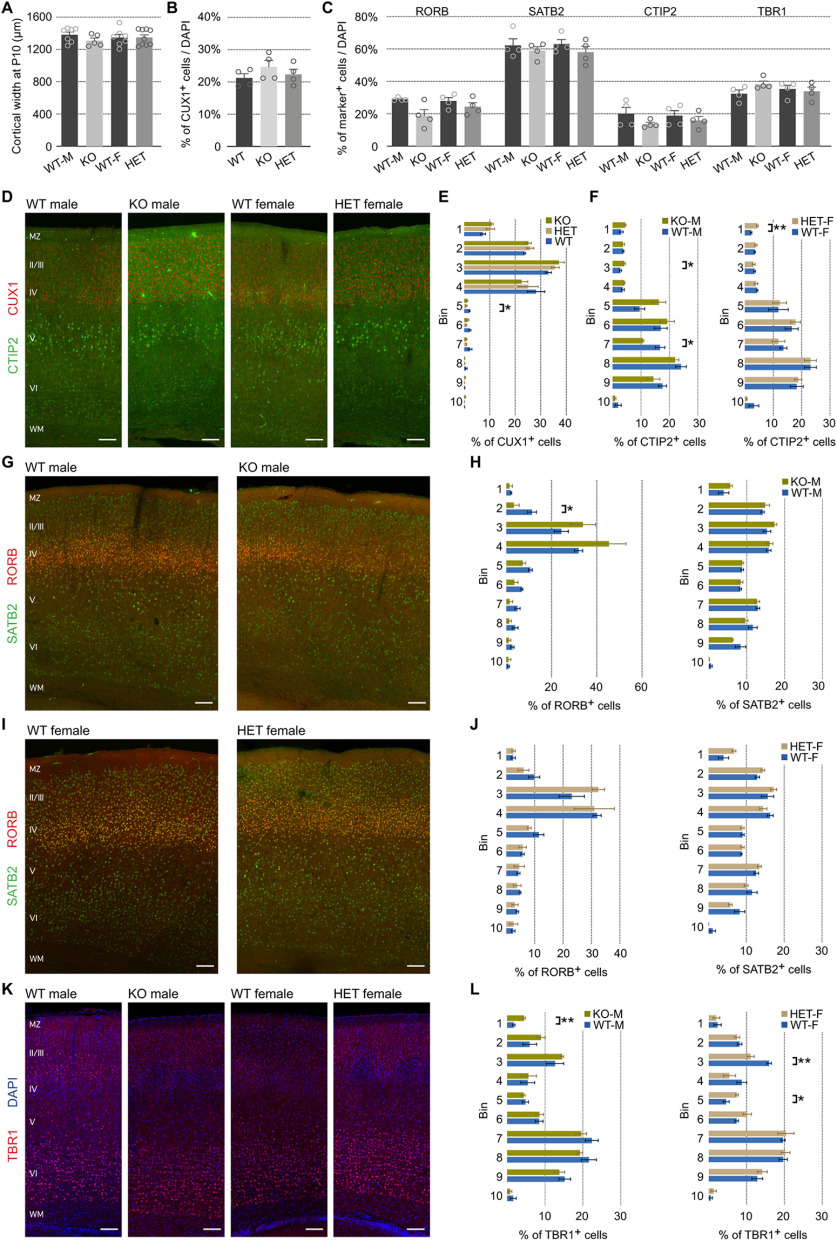
Figure 3.
Subtle, but significant, changes in the distribution of cortical excitatory neurons in Pcdh19 mutant animals. A, Quantification of cortical width at P10 in Pcdh19 WT and mutant animals, separated by sex. B, Relative percentage of CUX1+ cells examined with respect to total DAPI+ cells in Pcdh19 WT, HET, and KO animals. C, Relative percentages of the different cortical markers examined with respect to total DAPI+ cells. Analysis performed separately for males and females. D, Representative confocal micrographs of immunohistochemistry with anti-CUX1 (red) and anti-CTIP2 (green) antibodies on WT male, KO male, WT female, and HET female tissue. E, Quantification of the percentage of CUX+ cells in each of 10 equal bins spanning the cortical wall. F, Distribution of CTIP2+ cells in each of 10 equal bins spanning the cortical wall, shown as a percentage, for males (left) and females (right). G, I, Representative confocal micrographs of immunohistochemistry with anti-RORB (red) and anti-SATB2 (green) antibodies on WT and KO male tissue (G) and WT and HET female tissue (I). H, J, Quantification of the percentage of RORB+ (left) and SATB2+ (right) cells in each of 10 equal bins spanning the cortical wall. K, Representative confocal micrographs of immunohistochemistry with anti-TBR1 (red) antibodies in WT male, KO male, WT female, and HET female tissue. Nuclei are counterstained with DAPI (blue). L, Distribution of TBR1+ cells in each of 10 equal bins spanning the cortical wall, shown as a percentage for males (left) and females (right). All results are indicated as the mean ± SEM. A minimum of three images per brain, obtained from four animals originating from three different litters were analyzed for each condition. *p < 0.05; **p < 0.01. Scale bars, 200 μm.

