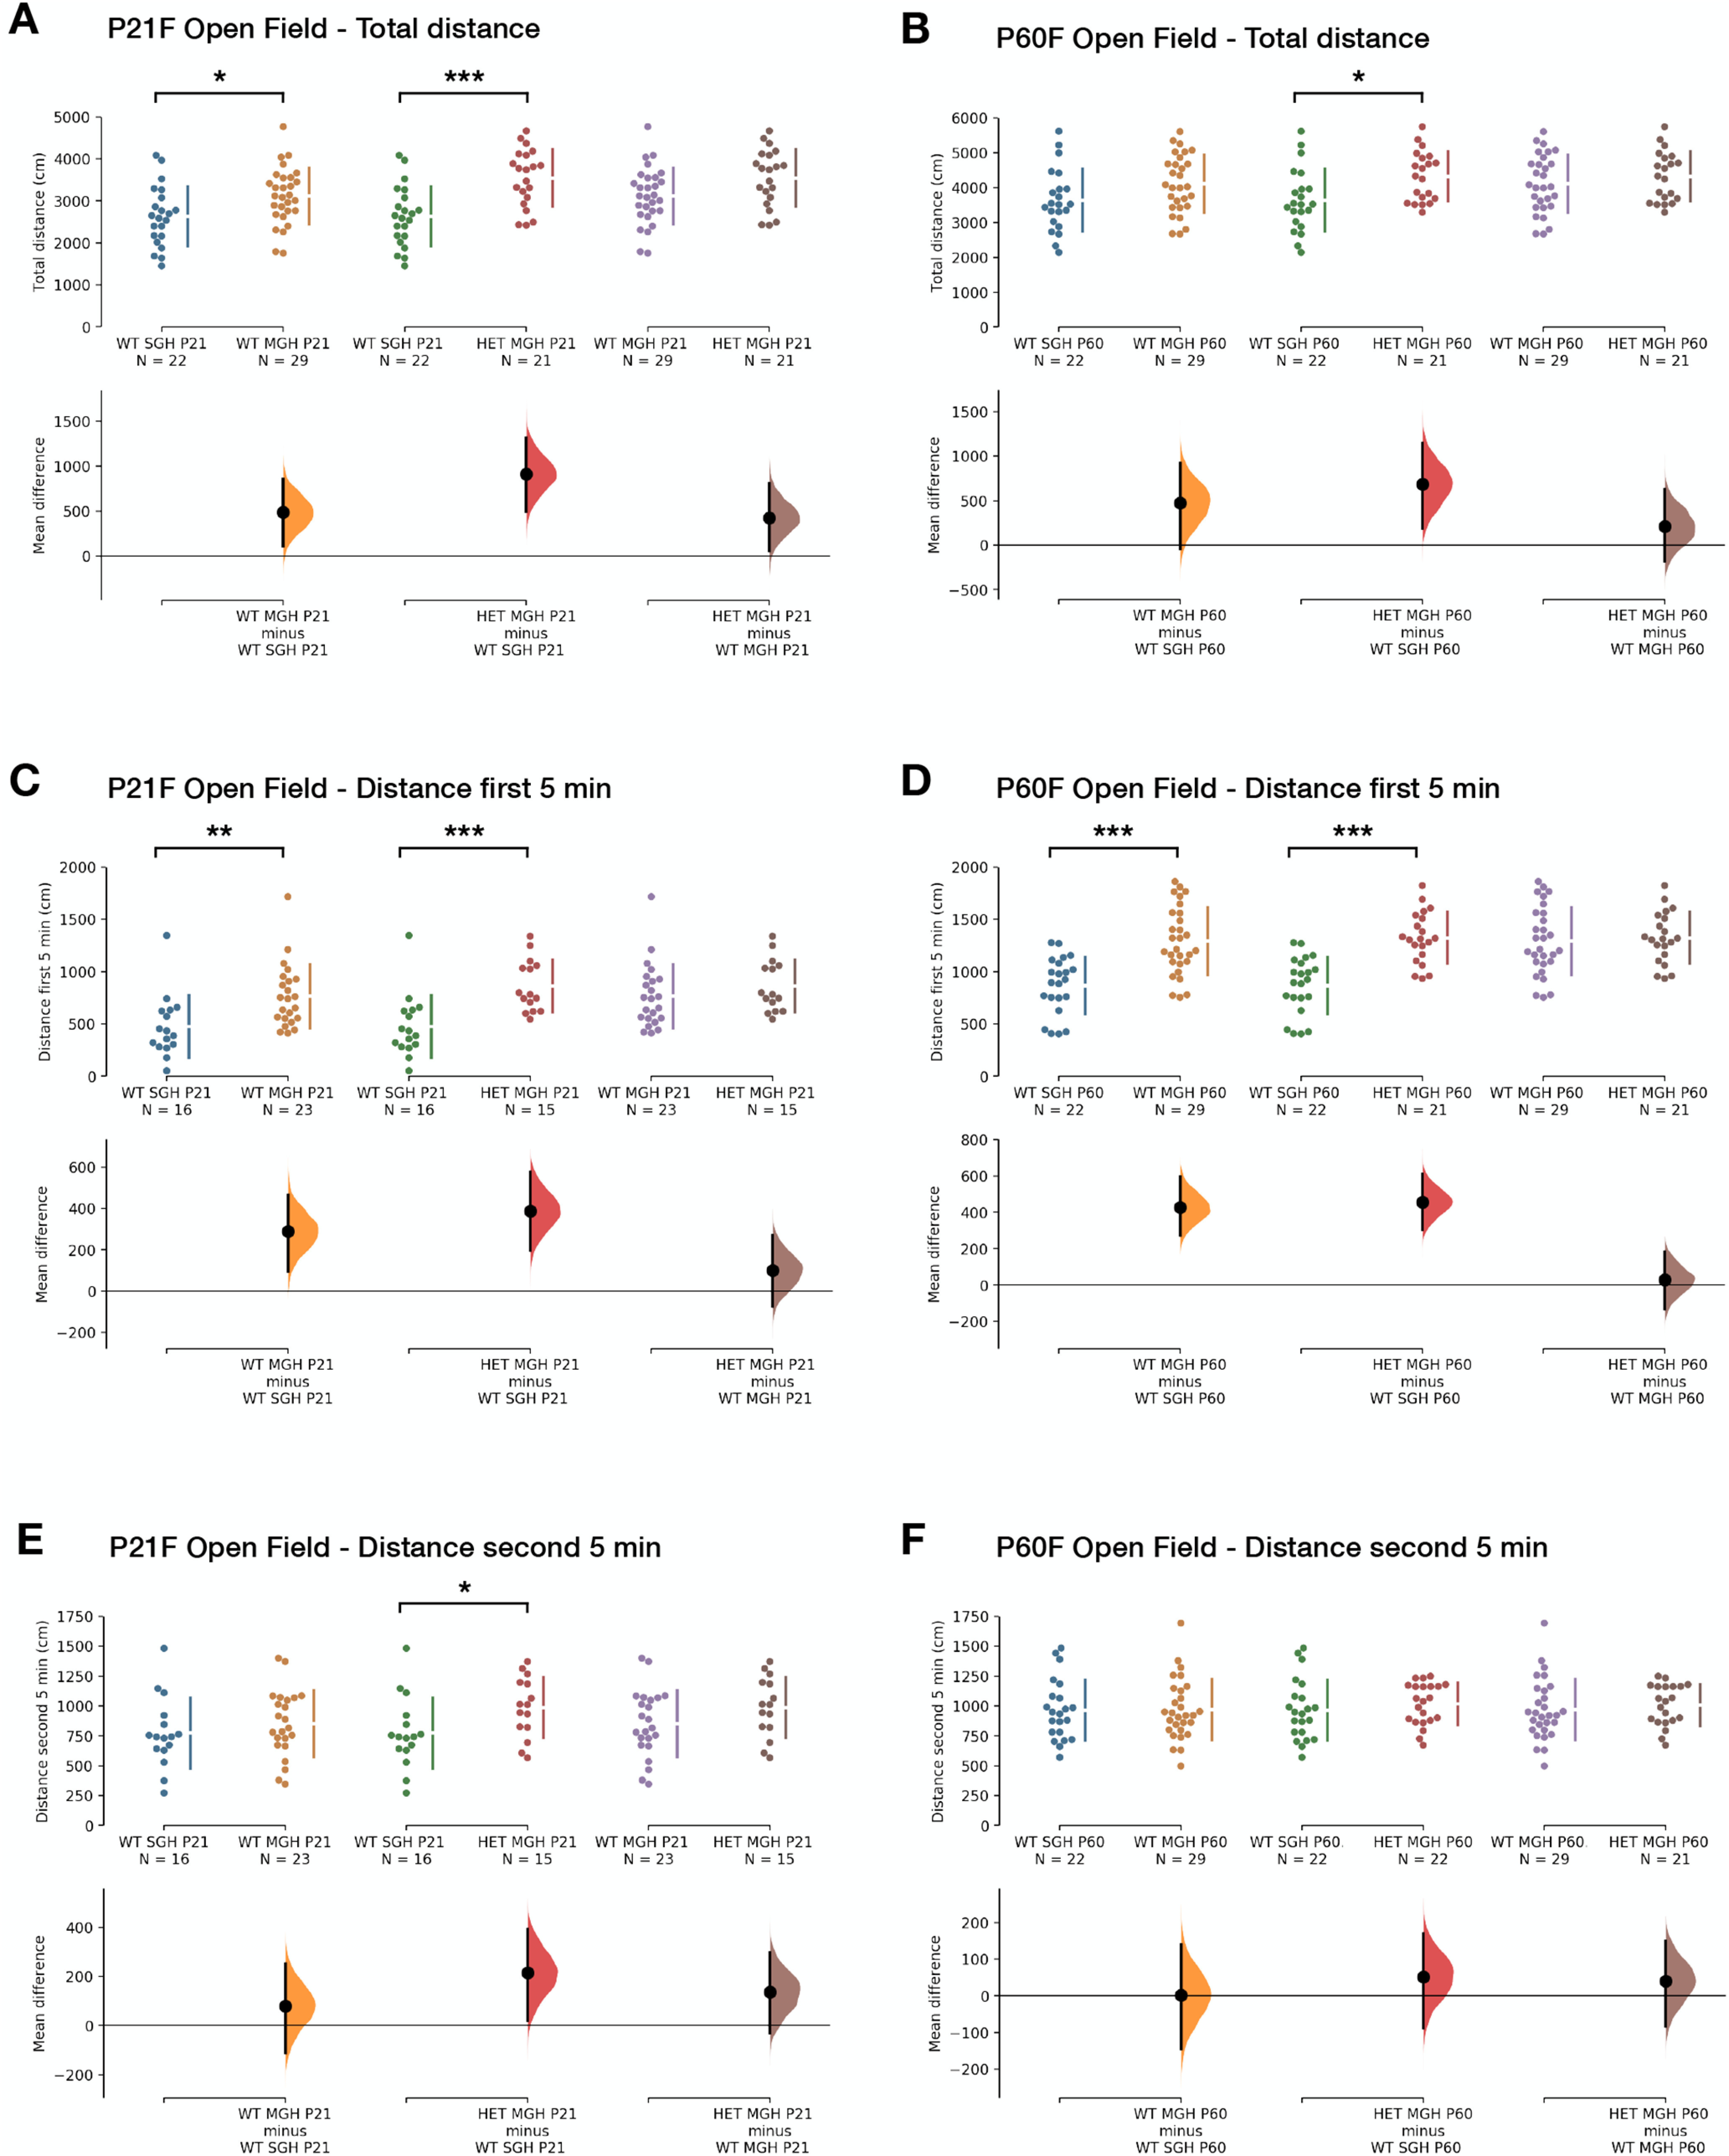
Figure 7.

Behavioral alterations in the open field test in Pcdh19 HET females and their WT littermates. A, B, Total distance traveled by females during the 20 min of the open field test at P21 (A) and P60 (B). C, D, Distance traveled by females during the first 5 min of the open field test at P21 (C) and P60 (D). E, F, Distance traveled by females during the second 5 min of the open field test at P21 (E) and P60 (F). Results correspond to the second day of testing at each age. For all panels, the top axis shows the raw data points for each group. To their right, the gap in the line indicates the mean, and the lines extending vertically represent the SD. The group and group sizes are indicated at the bottom. Note that each group appears twice in every graph, but with two different colors. The mean difference for each comparison is plotted in the lower axis as a bootstrap sampling distribution. The black dot represents the mean, and the vertical bar represents the 95% confidence interval. At the top of each graph the significance scores of the one-way ANOVA or Kruskal–Wallis test and their post hoc test are indicated. *p < 0.05; **p < 0.01; ***p < 0.001. Test results with female animals for the open field and 24 h activity that did not reach significance are presented in Extended Data Figure 7-1.
