

Abstract
Objective:
Images demonstrating a prescription drug’s efficacy are often included in direct-to-consumer television advertisements. The current research assessed whether exaggerated efficacy images can mislead individuals, and whether providing accurate quantitative information can reduce these misperceptions.
Methods:
We conducted two experimental studies with internet panelists 60 years and older testing drug efficacy images in television ads for wet age-related macular degeneration (N=901) and plaque psoriasis (N=902). In each study, participants viewed one of six ads that varied in the efficacy images included (no image, accurate image, exaggerated image) and the presentation of quantitative information (absent, present). Measures included recall, perceptions, and numeracy.
Results:
In both studies, participants who saw exaggerated images were more likely than those who saw no image or accurate images to overestimate efficacy. Presenting quantitative information increased participants’ gist and verbatim recall of drug efficacy, and in some cases, led participants to have more accurate perceptions of the drug’s efficacy even in the presence of exaggerated images. Higher numeracy was associated with better gist and verbatim recall.
Conclusions:
These results support visual persuasion theory. Moreover, they show that exaggerating benefits visually can mislead viewers.
Practice Implications:
Stakeholders should ensure that images in direct-to-consumer promotion are accurate and non-misleading.
Keywords: prescription drug, advertising, television, DTCA, quantitative
1. Introduction
Direct-to-consumer (DTC) prescription drug advertising is a pervasive [1] and influential [2–6] communication tool that conveys prescription drug information to consumers. These ads often contain images demonstrating drug effectiveness, such as showing patients before and after taking a drug to demonstrate improvement. A content analysis of 106 DTC television ads found that 33% included a before-and-after presentation, 20% demonstrated product results, and 4% demonstrated progress [7]. Another content analysis of 38 DTC television ads found that 85% included images and claims that demonstrated patients regaining control of a function or ability (e.g., sleeping, eating, socializing) because of product use [8]. While FDA regulations require prescription drug advertising to be accurate and non-misleading [9], agency warning letters indicate that not all ads are compliant with these regulations [10].
In a review of health communication literature, Houts and colleagues [11] found that images designed to help people understand health information can increase attention, comprehension, recall, and behavioral intentions. For instance, they found 216 articles that demonstrated that individuals recall more information when they are presented with images and text rather than just text alone. Although these findings suggest that images can be powerful, they do not address circumstances when images may be misleading.
Visual persuasion, in the form of manipulated or idealized images, is often used in advertising [12]. Visual persuasion theory posits that images can draw upon implicit associations that could not be overtly stated in text [13]. In particular, consumers can interpret images as “proof” that supports an implied or explicit claim [14]. Thus, there is a potential for images that show the magnitude of drug efficacy to overstate the drug’s efficacy and mislead consumers [15]. Indeed, research has shown that charts and graphs that exaggerate the size of an effect are misleading [16]. On the other hand, research suggests that the power of images can also be harnessed to correct misperceptions [17,18]. These images may affect both gist memory, which involves an interpretation of an event, and verbatim memory, which records the details of an event [19,20]. We hypothesized that exaggerated images of disease improvement related to drug treatment in a DTC television ad will lead to less accurate gist recall (Hypothesis 1) and less accurate verbatim recall (Hypothesis 2) of drug benefits as well as higher drug efficacy perceptions (Hypothesis 3) when compared with accurate images of improvement or no images of improvement.
One potential method to correct misperceptions caused by exaggerated images may be to include accurate quantitative information in text and audio (Hypothesis 4). Previous research suggests that DTC television ad claims that explain how well a drug works using quantitative information can improve gist [21] and verbatim recall for drug benefits [21,22]. Thus, including quantitative information may moderate the effect of images by helping consumers accurately understand how well a drug works, even if the ad includes images that overstate the drug’s efficacy. We also expected to replicate past findings for quantitative information, such that including quantitative information leads to more accurate gist recall (Hypothesis 5) and verbatim recall of drug benefits (Hypothesis 6) as well as higher drug efficacy perceptions (Hypothesis 7). Finally, the literature on numeracy suggests that adding quantitative information may be more useful for people who are better at using numbers [23]. Therefore, we explored whether numeracy moderated the effects of the quantitative information.
To test these hypotheses, we conducted two studies assessing images of improvement in two different medical conditions: wet age-related macular degeneration (AMD) and plaque psoriasis. Conducting this research across two different medical conditions allowed us to examine the potential replication of results across different images of improvement and different quantitative information.
2. Methods
2.1. Design
Both studies had a 3 (presentation of images of improvement: no image, accurate image, exaggerated image) by 2 (quantitative information for benefits: absent, present) factorial design (Figures 1 and 2). In both studies, we created six versions of a television ad for a fictitious prescription drug. (Study 1: Vistasin, indicated to treat wet AMD, a medical condition that can lead to blind spots; Study 2: Xeravast, indicated to treat plaque psoriasis, a medical condition that creates red patches on the skin). The no images of improvement (no images) ad did not contain any images of blind spots in Study 1 or plaque psoriasis in Study 2 (Figures 1 and 2).
Figure 1.

Study 1 design with quantitative claims and example screenshots of the image conditions.
Figure 2.
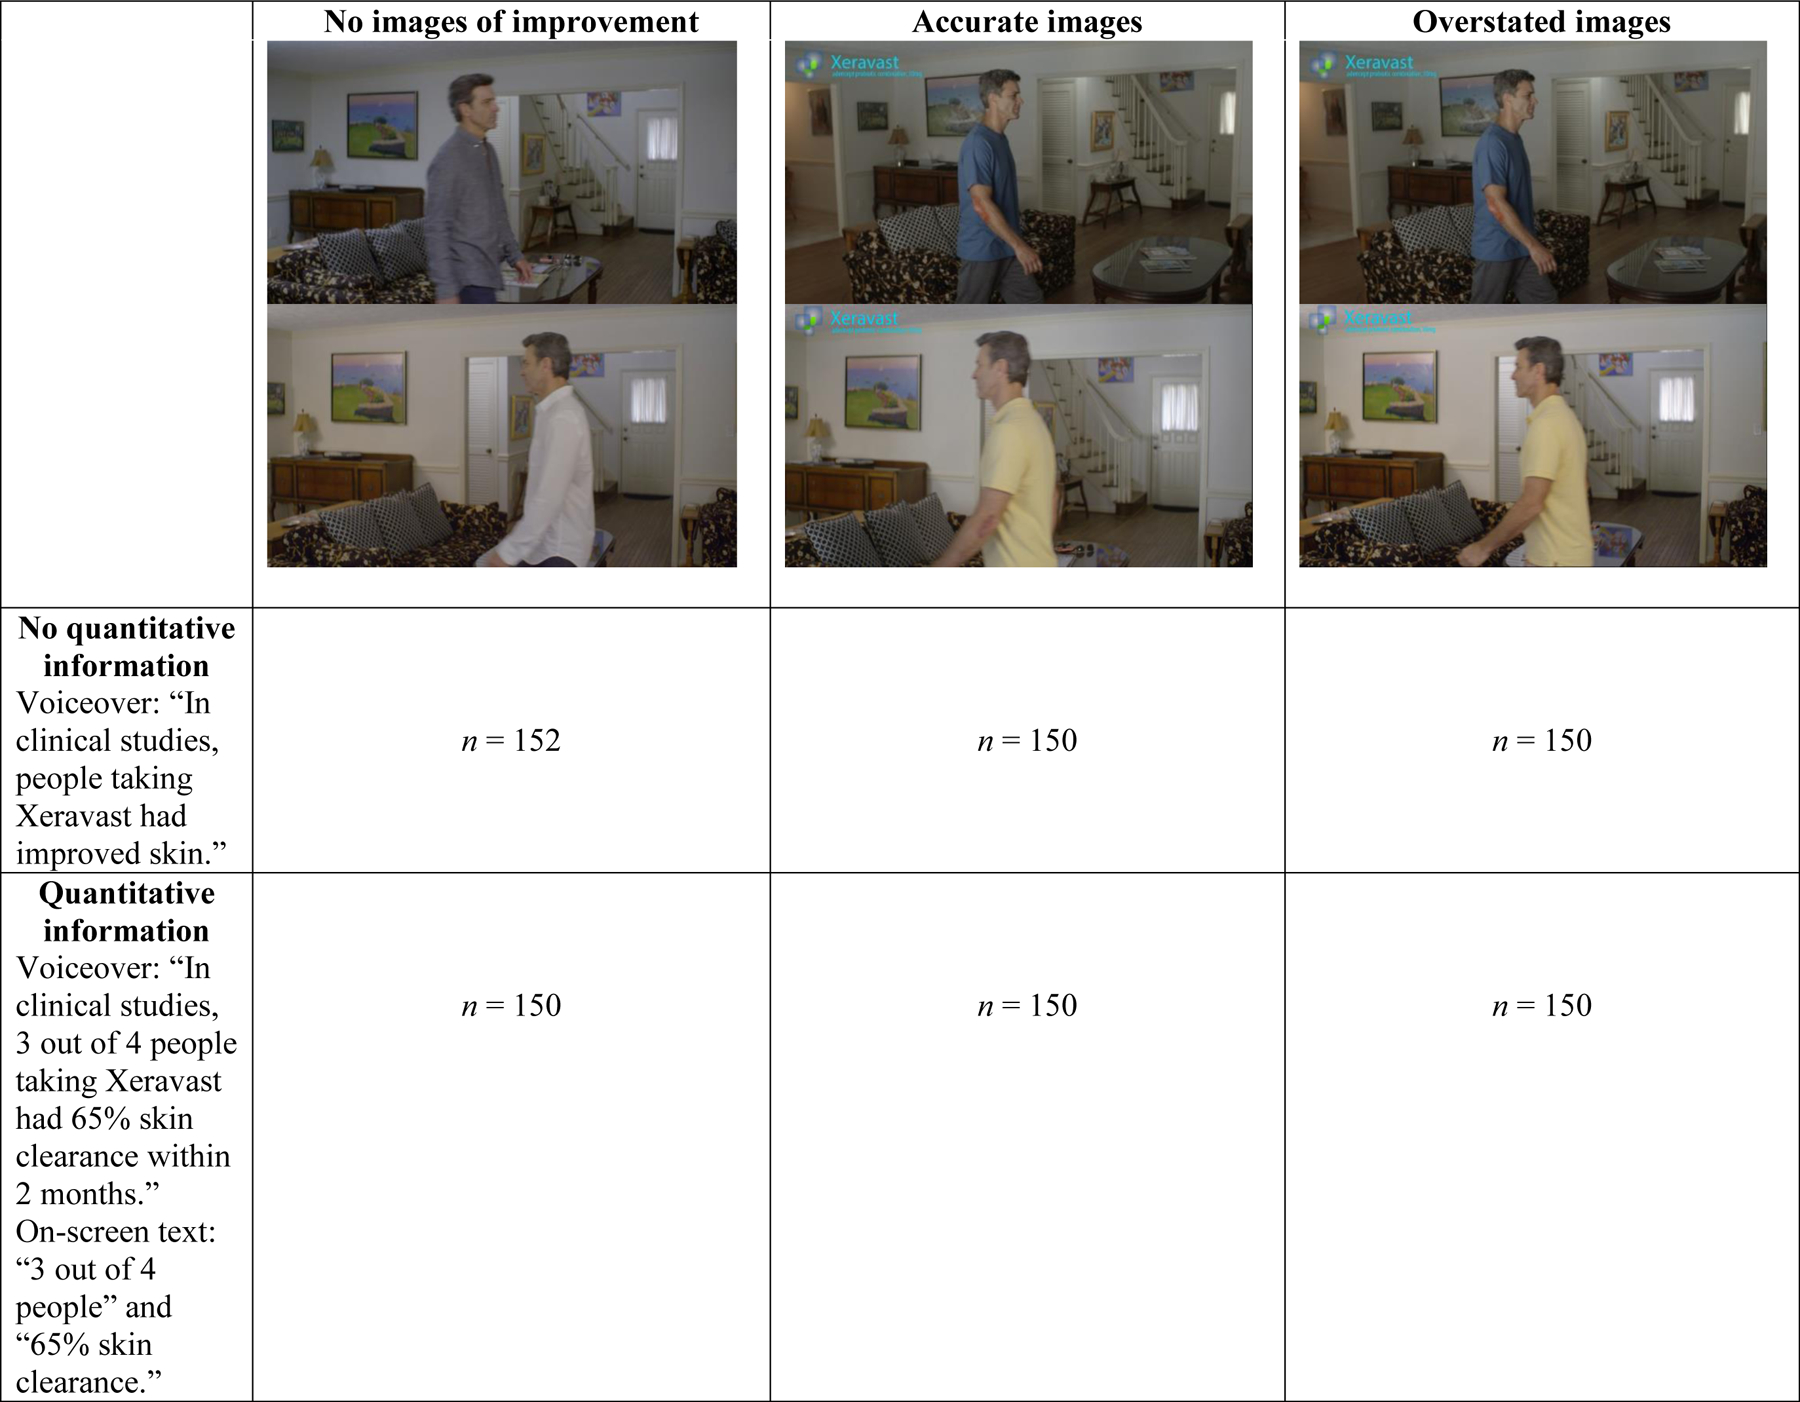
Study 2 design with quantiative claims and example screenshots of the image conditions.
In the accurate and exaggerated image conditions in Study 1, a blind spot appeared on the screen four times throughout the ad. In the accurate image conditions, the blind spot decreased to 65% of its former size. In the exaggerated image condition, the blind spot decreased until it disappeared. In the accurate and exaggerated image ads in Study 2, the main character displayed a large psoriasis patch on his arm during the first 30 seconds of the ads. At 30 seconds, a digital effect indicated the passage of time, and the size of the psoriasis patch changed. In the accurate image ads, the psoriasis patch became smaller and accurately showed 65% skin clearance for the remainder of the ad. In the exaggerated image ads, the psoriasis patch disappeared, and the main character had no plaque on his arm for the remainder of the ad.
The accurate image conditions were created to reflect realistic drug efficacy based on the quantitative information presented, whereas the exaggerated image conditions were created to overstate the drug’s efficacy. The quantitative claims can be seen in Figures 1 and 2.
2.2. Procedure
In each study, participants were randomly assigned to view one of six television ads. Participants watched the ad twice and then completed a cognitively-tested and pretested questionnaire containing the outcome measures. Participants were not able to proceed to the questionnaire without viewing the ad and could not view the ad again after beginning the questionnaire.
2.3. Participants
For Studies 1 and 2, we recruited participants 60 years of age or older from Dynata, an online consumer panel of U.S. adults. Older adults are a relevant sample for both studies because they watch more television [24] and use more prescription drugs than do younger adults [25]. In addition, having older adults as participants increased the likelihood that participants would be motivated to pay attention to the ads, as plaque psoriasis affects older adults and wet AMD disproportionally affects older adults [26]. We analyzed data from 901 panelists in Study 1 and 902 panelists in Study 2 who provided informed consent and completed the study (Table 1).
Table 1.
Participant Characteristics
| Study 1 | Study 2 | |||
|---|---|---|---|---|
| n | % | n | % | |
| Total | 901 | 100 | 902 | 100 |
| Age | ||||
| 60–64 years | 222 | 24.6 | 203 | 22.5 |
| 65–74 years | 511 | 56.7 | 528 | 58.5 |
| 75–92 years | 168 | 18.6 | 171 | 19.0 |
| Sex | ||||
| Male | 451 | 50.1 | 452 | 50.1 |
| Female | 450 | 49.9 | 450 | 49.9 |
| Race | ||||
| White | 789 | 87.6 | 785 | 87.0 |
| Black | 90 | 10.0 | 92 | 10.2 |
| Other | 27 | 3.0 | 25 | 2.8 |
| Ethnicity | ||||
| Hispanic/Latino | 17 | 1.9 | 24 | 2.7 |
| Not Hispanic/Latino | 884 | 98.1 | 878 | 97.3 |
| Education | ||||
| High school or less | 451 | 50.1 | 453 | 50.2 |
| Some college or higher | 450 | 49.9 | 449 | 49.8 |
| Has macular degeneration | 36 | 4.0 | N/A | N/A |
| Has psoriasis | N/A | N/A | 30 | 3.3 |
| Mean | SD | Mean | SD | |
| Objective numeracy (0–3) | 1.64 | 0.95 | 1.63 | 0.95 |
| Subjective numeracy (1–6) | 4.20 | 1.09 | 4.19 | 1.09 |
2.4. Materials and Measures
2.4.1. Manipulation checks.
In both studies, we asked all participants whether the ad contained any numbers about how well the drug improved vision (yes, no, don’t know). In both studies, we asked participants whether they noticed the manipulations (Study 1: dark spot on the screen; Study 2: plaque psoriasis [skin problems] on the main character; response scale: yes, no, don’t know). If they said yes, we asked whether they noticed any changes (Study 1: dark spot disappeared, got smaller, got bigger, did not change; Study 2:) (plaque psoriasis disappeared, got smaller, got bigger, did not change).
In both studies, we asked participants in the conditions with quantitative information and images of improvement to rate on a 5-point scale how closely the numbers and images matched (1 = the image showed less improvement than the numbers, 3 = the image showed the same improvement as the numbers, 5 = the image showed more improvement than the numbers).
2.4.2. Gist recall/estimation.
To measure whether participants understood the gist of the benefit information in the ad, we asked two gist questions in Study 1 and three gist questions in Study 2. We coded the responses to these questions as correct/incorrect. See Tables 2 and 4 for the items and their correct responses. Following the precedent in previous studies that measured recall against a control condition [21,22, 27–30], the information needed to answer these questions correctly was stated in the conditions with the quantitative information present and implied in the conditions with the accurate image.
Table 2.
Study 1: Percentages and means (95% confidence intervals [CI]) and for dependent variables, by image conditions.
| No image | Accurate image | Exaggerated image | |
|---|---|---|---|
| N | 300 | 300 | 301 |
| % (CI) | % (CI) | % (CI) | |
| Gist recall/estimation | |||
| Item 1: False: “Vistasin eliminates the vision problems caused by wet AMD.” | 35.0 (29.6, 40.4) | 56.0 (50.4, 61.6) | 38.2 (32.7, 43.7) |
| Item 2: Agree: “Vision will improve but won’t be back to normal.” | 84.3 (80.2, 88.5) | 86.3 (82.4, 90.4) | 71.4 (66.3, 76.6) |
| Verbatim recall/estimation | |||
| Item 1: 45%: “On average, if someone with wet AMD takes another prescription drug by what percentage will their blind spots shrink?” | 31.3 (26.0, 36.6) | 29.7 (24.5, 34.9) | 28.9 (23.8, 34.0) |
| Item 2: 65%: “On average, if someone with wet AMD takes Vistasin by what percentage will their blind spots shrink?” | 34.7 (29.2, 40.1) | 37.3 (31.8, 42.8) | 32.2 (26.9, 27.3) |
| Item 3: Higher than 65%: “On average, if someone with wet AMD takes Vistasin by what percentage will their blind spots shrink?” | 6.7 (3.8, 9.5) | 11.3 (7.7, 14.9) | 16.9 (12.7, 21.2) |
| M (CI) | M (CI) | M (CI) | |
| Perceived efficacy (1 = strongly disagree, 6 = strongly agree) | 4.21 (4.08, 4.35) | 4.19 (4.07, 4.32) | 4.35 (4.23, 4.47) |
Note. OR = odds ratio. Significance was defined as P < 0.017. Verbatim items 2 and 3 represent two different codes of the same questionnaire item: correct (65%) and overestimated (higher than 65%).
Table 4.
Study 2: Percentages and means (95% confidence intervals [CI]) for dependent variables, by image conditions.
| No image | Accurate image | Exaggerated image | |
|---|---|---|---|
| N | 302 | 300 | 300 |
| % (CI) | % (CI) | % (CI) | |
| Gist recall/estimation | |||
| Item 1: False: “Xeravast eliminates the skin problems caused by plaque psoriasis.” | 33.8 (28.4, 39.1) | 36.0 (30.5, 41.5) | 21.3 (16.7, 26.0) |
| Item 2: Agree: “Plaque psoriasis will improve but skin won’t be back to normal.” | 38.7 (33.2, 44.3) | 43.3 (37.7, 49.0) | 32.0 (26.7, 37.3) |
| Item 3: True: “More than half of people with plaque psoriasis who take Xeravast will have some skin clearance in 2 months.” | 89.7 (86.3, 93.2) | 91.7 (88.5, 94.8) | 94.0 (91.3, 96.7) |
| Verbatim recall/estimation | |||
| Item 1: 3 out of 4: “How many people with plaque psoriasis who take Xeravast will have some skin clearance in 2 months?” | 50.0 (44.3, 55.7) | 51.0 (45.3, 56.7) | 52.0 (46.3, 57.7) |
| Item 2: 65%: “In most cases, Xeravast provided __% skin clearance in 2 months.” | 31.5 (26.2, 36.7) | 30.0 (24.8, 35.2) | 26.0 (21.0, 31.0) |
| Item 3: Higher than 65%: “In most cases, Xeravast provided __% skin clearance in 2 months.” | 26.5 (21.5, 31.5) | 26.3 (21.3, 31.3) | 37.3 (31.8, 42.8) |
| M (CI) | M (CI) | P-value, f | |
| Perceived efficacy (1 = strongly disagree, 6 = strongly agree) | 4.06 (3.96, 4.17) | 4.16 (4.03, 4.29) | 4.24 (4.11, 4.36) |
Note. OR = odds ratio. Significance was defined as P < 0.017. Verbatim items 2 and 3 represent two different codes of the same questionnaire item: correct (65%) and overestimated (higher than 65%).
2.4.3. Verbatim recall/estimation.
To measure whether participants could accurately report the quantitative information, we asked participants to report the magnitude of the efficacy of the drug and its comparator in Study 1 and the magnitude and likelihood of the drug’s efficacy in Study 2. We coded the responses to these questions as correct/incorrect. To measure overestimation of the magnitude of the drug’s efficacy in both studies, we also coded whether the responses regarding the magnitude of the drug’s efficacy were over 65% (the correct answer). See Tables 2 and 4 for the items and their correct responses. The information needed to answer these questions was stated in the conditions with the quantitative information present, making these questions a recall task for participants in those conditions, but an estimation task for participants in the conditions with no quantitative information.
2.4.4. Efficacy perceptions.
In both studies, participants reported their agreement with an efficacy statement on a 6-point scale (1 = strongly disagree, 6 = strongly agree). The Study 1 statement was, “Vistasin is more likely to improve vision than other treatments for wet AMD”. The Study 2 statement was, “Xeravast is more likely to improve plaque psoriasis than other treatments.”
2.4.5. Numeracy.
In both studies, we measured numeracy with a subjective numeracy scale (α =.89) and measured objective numeracy by summing the number of correct responses to 3 fill-in-the-blank math questions [31, 32].
2.5. Statistical Analysis
We conducted all analyses with SPSS Version 23. First, to assess whether the quantitative information and images of improvement affected gist and verbatim recall/estimation, we examined logistic regression models with the main effects and an interaction term. Second, because the interaction term was not significant at P < 0.05, we re-examined these models with the main effects only. Third, when the main effect for images was significant at P < 0.05, we examined contrasts among the image conditions with a Bonferroni-adjusted P < 0.017 (0.05/3 comparisons) Fourth, when the main effect of images was significant at P < 0.05, we conducted a second series of contrasts to test Hypothesis 4 (regarding the interplay of exaggerated images and quantitative information). These contrasts compared the exaggerated image condition to the accurate image condition and to the no image condition when there was no quantitative information and compared the exaggerated image condition to the accurate image condition and to the no image condition when there was a quantitative information present. For Hypothesis 4, significance was defined with a Bonferroni adjusted P < 0.0125 (0.05/4 comparisons).
Fifth, we repeated the analyses from step 2 with each numeracy measure and an interaction term between the numeracy measure and quantitative information to test whether numeracy moderated the effect of quantitative information. Sixth, we tested whether numeracy moderated any significant effects identified by the Hypothesis 4 contrasts in step 4. We repeated these steps with Analyses of Variance (ANOVAs) to test whether the quantitative information and images affected efficacy perceptions. Finally, we tested the associations between the numeracy measures and the dependent variables with t-tests and correlation. Descriptive and test statistics are presented in Tables 2, 3, 4, and 5. Significant results are discussed in the results sections and Figure 3 shows which hypotheses were supported.
Table 3.
Study 1: Percentages and means (95% confidence intervals [CI]) for dependent variables, by quantitative information conditions.
| Quantitative information | |||
|---|---|---|---|
| Absent | Present | ||
| N | 450 | 451 | |
| % (CI) | % (CI) | P-value, OR | |
| Gist recall/estimation | |||
| Item 1: False: “Vistasin eliminates the vision problems caused by wet AMD.” | 38.4 (33.9, 43.0) | 47.7 (43.0, 52.3) | 0.004, 1.48 |
| Item 2: Agree: “Vision will improve but won’t be back to normal.” | 74.9 (70.9, 78.9) | 86.5 (83.3, 89.6) | <0.001, 2.20 |
| Verbatim recall/estimation | |||
| Item 1: 45%: “On average, if someone with wet AMD takes another prescription drug by what percentage will their blind spots shrink?” | 1.3 (0.3, 2.4) | 58.5 (54.0, 63.1) | <0.001, 104.90 |
| Item 2: 65%: “On average, if someone with wet AMD takes Vistasin by what percentage will their blind spots shrink?” | 3.6 (1.8, 5.3) | 65.9 (61.5, 70.3) | <0.001, 53.23 |
| Item 3: Higher than 65%: “On average, if someone with wet AMD takes Vistasin by what percentage will their blind spots shrink?” | 17.8 (14.2, 21.3) | 5.5 (3.4, 7.7) | <0.001, 0.26 |
| M (CI) | M (CI) | P-value, f | |
| Perceived efficacy (1 = strongly disagree, 6 = strongly agree) | 4.06 (3.96, 4.16) | 4.45 (4.35, 4.55) | <0.001, 0.18 |
Note. OR = odds ratio. Verbatim items 2 and 3 represent two different codes of the same questionnaire item: correct (65%) and overestimated (higher than 65%).
Table 5.
Study 2: Percentages and means (95% confidence intervals [CI]) for dependent variables, by quantitative information conditions.
| Quantitative information | |||
|---|---|---|---|
| Absent | Present | ||
| N | 452 | 450 | |
| % (CI) | % (CI) | P-value, OR | |
| Gist recall/estimation | |||
| Item 1: False: “Xeravast eliminates the skin problems caused by plaque psoriasis.” | 27.4 (23.3, 31.6) | 33.3 (29.0, 37.7) | 0.05, 1.33 |
| Item 2: Agree: “Plaque psoriasis will improve but skin won’t be back to normal.” | 34.5 (30.1, 38.9) | 41.6 (37.0, 46.1) | 0.03, 1.35 |
| Item 3: True: “More than half of people with plaque psoriasis who take Xeravast will have some skin clearance in 2 months.” | 90.3 (87.5, 93.0) | 93.3 (91.0, 95.6) | 0.09, 1.51 |
| Verbatim recall/estimation | |||
| Item 1: 3 out of 4: “How many people with plaque psoriasis who take Xeravast will have some skin clearance in 2 months?” | 37.8 (33.3, 42.3) | 64.2 (59.8, 68.7) | <0.001, 2.95 |
| Item 2: 65%: “In most cases, Xeravast provided __% skin clearance in 2 months.” | 5.1 (3.0, 7.1) | 53.3 (48.7, 58.0) | <0.001,21.59 |
| Item 3: Higher than 65%: “In most cases, Xeravast provided __% skin clearance in 2 months.” | 38.5 (34.0, 43.0) | 21.6 (17.7, 25.4) | <0.001,0.43 |
| M (CI) | M (CI) | P-value, f | |
| Perceived efficacy (1 = strongly disagree, 6 = strongly agree) | 4.17 (4.07, 4.26) | 4.14 (4.04, 4.24) | 0.71, 0.01 |
Note. OR = odds ratio. Verbatim items 2 and 3 represent two different codes of the same questionnaire item: correct (65%) and overestimated (higher than 65%).
Figure 3.

Summary of support for hypotheses in Studies 1 and 2.
3. Study 1 Results
3.1. Manipulation checks
Most participants (76.4%) who saw the quantitative information accurately reported that the ad contained numbers about how well Vistasin worked, and 7.8% of participants who did not see the quantitative information inaccurately reported this, χ2(1) = 435.19, P < 0.001. Most participants (76.3%) who saw the accurate image correctly reported seeing the dark spot and that it got smaller; whereas 72.1% of participants who saw the exaggerated image correctly reported seeing the dark spot and that it disappeared, χ2(1) = 185.20, P < 0.001. These results suggest that the manipulations were successful.
3.2. The effect of the exaggerated image
3.2.1. Comparisons with no image condition.
Participants in the exaggerated image condition were significantly less likely to understand that vision will improve but won’t return to normal, compared with participants in the no image condition (gist recall item 2; Table 2). When separating the quantitative and no quantitative information conditions, this effect was significant in the conditions with no quantitative information (exaggerated image: 63.3%, no image: 82.0%, OR = 0.38, P < 0.001) but not in the conditions with quantitative information present (exaggerated image: 79.5%, no image: 93.3%, OR = 0.60, P = 0.10).
Participants in the exaggerated image condition were also significantly more likely to overestimate the drug’s efficacy, compared with participants in the no image condition (verbatim recall item 3; Table 2). Again, this effect was significant in the conditions with no quantitative information (exaggerated image: 24.7%, no image: 9.3%, OR = 3.18, P = 0.001) but not in the conditions with quantitative information present (exaggerated image: 9.3, no image: 4.0%, OR = 2.45, P = 0.07).
3.2.2. Comparisons with accurate image condition.
Overall, participants in the exaggerated image condition were significantly less likely to understand that Vistasin does not eliminate the vision problems caused by wet AMD, compared with participants in the accurate image condition (gist recall item 1; Table 2). This effect was not significant in the conditions with no quantitative information (exaggerated image: 36.7%, accurate image: 46.0%, OR = 0.68, P = 0.10) but was significant in the conditions with quantitative information (exaggerated image: 39.7%, accurate image: 66.0%, OR = 0.34, P < 0.001).
Participants in the exaggerated image condition were significantly less likely to understand that vision will improve but won’t return to normal, compared with participants in the accurate image condition (gist recall item 2; Table 2). This effect was significant in both the conditions with no quantitative information (exaggerate image: 63.3%, accurate image: 79.3%, OR = 0.45, P = 0.002) and the conditions with quantitative information present (exaggerated image: 79.5%, accurate image: 93.3%, OR = 0.28, P = 0.001).
3.3. The effect of the accurate image
We explored the comparison of the no image and accurate image conditions. Participants in the accurate image condition were significantly more likely to understand that Vistasin does not eliminate the vision problems caused by wet AMD, compared with participants in the no image condition (gist recall item 1; Table 2). This effect was not significant in the conditions with no quantitative information (accurate image: 46.0%; no image: 32.7%, OR = 1.76, P = 0.02) but was significant in the conditions with quantitative information (accurate image: 66.0%; no image: 37.3%, OR = 3.26, P < 0.001).
3.4. The main effect of quantitative information
Participants who saw the quantitative information were significantly more likely to give the correct responses to all the gist and verbatim recall questions and less likely to overestimate the drug’s benefit, compared with participants who did not see the quantitative information (Table 3). They also had significantly higher perceived drug efficacy than those who did not see the information.
3.5. Numeracy
Participants with higher objective numeracy and participants with higher subjective numeracy were more likely to give the correct responses to each of the gist and verbatim recall/estimation items than were participants with lower objective and subjective numeracy (P < 0.001). Participants with higher objective numeracy were less likely to overestimate the drug’s benefit than were participants with lower objective numeracy (P = 0.004). Subjective numeracy was significantly positively associated with perceived efficacy (r = 0.14, P < 0.001)
Subjective numeracy significantly moderated the effect of quantitative information on two verbatim recall/estimation items (items 1 and 2), such that higher subjective numeracy was associated with correct responses when quantitative information was present but not when it was absent (item 1: OR = 2.26, P = 0.02; item 2: OR = 1.71, P = 0.03). Objective and subjective numeracy did not significantly affect the Hypothesis 4 findings.
4. Study 2 Results
4.1. Manipulation checks
Most participants (64.9%) who saw the quantitative information accurately reported that the ad contained numbers about how well Xeravast worked, and 27.0% of participants who did not see the quantitative information inaccurately reported this, χ2(1) = 130.43, P < 0.001. Most participants (76.4%) who saw the accurate image correctly reported seeing the plaque psoriasis and that it got smaller; whereas 70.5% of participants who saw the exaggerated image correctly reported seeing the plaque psoriasis and that it disappeared, χ2(1) = 113.86, P < 0.001. These results suggest that the manipulations were successful.
4.2. The effect of the exaggerated image
4.2.1. Comparisons with no image condition.
Overall, participants in the exaggerated image condition were significantly less likely to understand that Xeravast does not eliminate the skin problems caused by plaque psoriasis, compared with participants in the no image condition (gist recall item 1; see Table 4). When separating the quantitative and no quantitative information conditions, this effect was significant in the conditions with no quantitative information (exaggerated image: 18.7%, no image: 32.9%, OR = 2.14, P = 0.005) but not in the conditions with quantitative information present (exaggerated image: 24.0%, no image: 34.7%, OR = 1.68, P = 0.04; based on an adjusted P-value of 0.0125).
Participants in the exaggerated image condition also were significantly more likely to overestimate the drug’s efficacy, compared with participants in the no image condition (verbatim recall item 3; Table 4). This effect was not significant in the conditions with no quantitative information (exaggerated image: 46.0%, no image: 37.5%, OR = 0.70, P = 0.14) but was significant in the conditions with quantitative information present (exaggerated image: 28.7%, no image: 15.3%, OR = 0.45, P = 0.006).
4.2.2. Comparisons with accurate image condition.
Overall, participants in the exaggerated image condition were significantly less likely to understand that Xeravast does not eliminate the skin problems caused by plaque psoriasis, compared with participants in the accurate image condition (gist recall item 1; Table 4). This effect was not significant in the conditions with no quantitative information (exaggerated image: 18.7%, accurate image: 30.7%, OR = 1.93, P = 0.02; based on an adjusted P-value of 0.0125) but was significant in the conditions with quantitative information present (exaggerated image: 24.0%, accurate image: 41.3%, OR = 2.23, P = 0.002).
Participants in the exaggerated image condition also were significantly less likely to understand that plaque psoriasis will improve but skin won’t be back to normal, compared with participants in the accurate image condition (gist recall item 2; Table 4). However, this effect did not reach significance when separating the conditions with no quantitative information (exaggerated image: 28.0%, accurate image: 38.0%, OR = 1.58, P = 0.07) and the conditions with quantitative information (exaggerated image: 36.0%, accurate image: 48.7%, OR = 1.68, P = 0.03).
Participants in the exaggerated image condition were also significantly more likely to overestimate the drug’s efficacy, compared with participants in the accurate image condition (verbatim recall item 3; Table 4). However, this effect did not reach significance when separating the conditions with no quantitative information (exaggerated image: 46.0%, accurate image: 32.0%, OR = 0.55, P = 0.013) and the conditions with quantitative information (exaggerated image: 28.7%, accurate image: 20.7%, OR = 0.65, P = 0.11).
4.3. The effect of the accurate image
We explored the comparison of the no image and accurate image conditions and did not find any significant effects (Table 4).
4.4. The main effect of quantitative information
Participants who saw the quantitative information were significantly more likely to give correct responses to one of the gist recall questions (gist recall item 2) and both verbatim recall questions, and they were significantly less likely to overestimate the drug’s benefit, compared with participants who did not see the quantitative information (Table 5). We did not find a significant effect for perceived efficacy.
4.5. Numeracy
Participants with higher objective numeracy were more likely to give the correct responses to two gist recall/estimation items (items 1 and 2) and one verbatim recall/estimation item (item 2) than were participants with lower objective numeracy (P < 0.05). They were also less likely to overestimate the drug’s benefits than were participants with lower objective numeracy (P = 0.02). Participants with higher subjective numeracy were more likely to give the correct responses to the three gist recall/estimation items (items 1–3) than were participants with lower subjective numeracy (P < 0.05). Objective numeracy was significantly negatively associated with perceived efficacy (r = −0.14, P < 0.001). Objective and subjective numeracy did not significantly modify the effects of the quantitative information or significantly affect the Hypothesis 4 findings.
5. Discussion and Conclusion
5.1. Discussion
Two content analyses have shown that images depicting drug efficacy are prevalent in DTC television ads [7, 8]. Research has also shown that images can be powerful tools in communicating product information [11], and in some cases, have the potential to exaggerate product benefit [16]. Across our two studies, we found that exaggerated images, but not accurate images, resulted in misperceptions about the advertised drug’s efficacy. Specifically, we found that using images that exaggerate drug efficacy in DTC television ads can cause consumers to think the drug works better than it does. By contrast, using images that more accurately reflect a drug’s efficacy did not increase misperceptions. These results support visual persuasion theory [13] by showing that consumers do process visual images when evaluating the usefulness of advertised products. Moreover, they provide support for examining visual images when FDA evaluates whether television ads present an accurate representation of drug efficacy [33].
Previous research suggests that DTC television ads that include quantitative efficacy information can affect perceptions of drug efficacy [21,22]. In this study, we also found that adding accurate quantitative information helped consumers understand how well the drug worked. This finding supports FDA guidance on including quantitative information in DTC ads [34]. Further, in some—but not all—cases, ads with accurate quantitative information seemed to counter the effects of exaggerated images, leading participants to have more modest and accurate perceptions of the drug’s efficacy. This finding deserves additional research to determine the circumstances under which accurate quantitative information may counteract misleading images. Higher numeracy was associated with better gist and verbatim recall/estimation; however, for the most part, the addition of quantitative information did not have a differential effect on participants with varying levels of numeracy.
These studies had limitations that may affect the generalizability of these results. First, although participants were at risk for the medical condition, only a small percentage of our samples reported having been diagnosed with these conditions. This may have reduced the attention they paid to the ad; therefore, results may be different with patients who have the underlying conditions. Second, because participants were older internet panelists, the results from this sample may not represent the general population. Finally, participants with lower numeracy may have been underrepresented in our samples, potentially reducing our ability to find effects for numeracy. Future studies could be conducted with a broader array of participants.
5.2. Conclusion
These results provide the first evidence that images depicting exaggerated improvements in disease have the potential to mislead consumers about drug efficacy. We found remarkable consistency in the results using television ads for two different medical conditions with distinctive visual presentations. This provides confidence that our findings are not limited to specific images or conditions we tested. Nonetheless, future research should attempt to replicate these results with other medical conditions, populations, and images.
5.3. Practical Implications
Our findings suggest that regulators and the pharmaceutical industry should continue to ensure that DTC promotion is accurate and non-misleading, paying particular attention to images presented in ads. Evaluating images to confirm they accurately reflect the extent of the drug’s efficacy and providing correct, prominent, and consumer-friendly quantitative information about the drug’s efficacy may be two ways the pharmaceutical industry can accomplish this. Regulators’ review of claims (including quantitative information) and images shown in DTC ads will also contribute to ensuring accurate portrayals of drug’s efficacy. Finally, healthcare providers’ awareness of patients’ drug efficacy misperceptions is important, and therefore providers may wish to probe patients about their expectations when prescribing a drug or when patients make inquiries about potential drugs.
I confirm all patient/personal identifiers have been removed or disguised so the patient/person(s) described are not identifiable and cannot be identified through the details of the story.
Highlights.
Participants viewed fictitious prescription drug ads in two studies (N=901; N=902).
Ads varied in images of drug efficacy and presence of quantitative information.
Images that exaggerated a drug’s efficacy misled participants.
Quantitative information helped participants understand drug efficacy.
In some cases, quantitative information countered effects of exaggerated images.
Acknowledgments:
Financial support for this study was provided by a contract with the U.S. Food and Drug Administration. For their assistance in creating the study stimuli, we would like to thank David Contois and Heather Holt of Better World Advertising and Scott Riggan and Ari Kirschenbaum of RTI International. For their expertise and review, we thank Rhea Lloyd, Carrie Newcomer, Zarna Patel, and Meena Ramachandra of the U.S. Food and Drug Administration. For their help developing and refining the questionnaire and measurements, we thank Linda Squiers and Brian Southwell of RTI International.
Footnotes
Declaration of interests: none.
References
- 1.Schwartz LM, Woloshin S. Medical marketing in the United States, 1997–2016. J Amer Med Assoc. 2019;321:80–96. [DOI] [PubMed] [Google Scholar]
- 2.Avery RJ, Eisenberg MD, Simon KI. The impact of direct-to-consumer television and magazine advertising on antidepressant use. J Health Econ. 2012;31:705–18. [DOI] [PubMed] [Google Scholar]
- 3.Daubresse M, Hutfless S, Kim Y, Kornfield R, Qato DM, Huang J, et al. Effect of direct-to-consumer advertising on asthma medication sales and healthcare use. Am J Respir Crit Care Med. 2015;192:40–6. [DOI] [PMC free article] [PubMed] [Google Scholar]
- 4.Kim Y, Kornfield R, Shi Y, Vera L, Daubresse M, Alexander GC, Emery S. Effects of televised direct-to-consumer advertising for varenicline on prescription dispensing in the United States, 2006–2009. Nicotine Tob Res. 2016;18:1180–7. [DOI] [PMC free article] [PubMed] [Google Scholar]
- 5.Layton JB, Kim Y, Alexander GC, Emery SL. Association between direct-to-consumer advertising and testosterone testing and initiation in the United States, 2009–2013. J Amer Med Assoc. 2017;317:1159–66. [DOI] [PMC free article] [PubMed] [Google Scholar]
- 6.Niederdeppe J, Byrne S, Avery RJ, Cantor J. Direct-to-consumer television advertising exposure, diagnosis with high cholesterol, and statin use. J Gen Intern Med. 2013;28:886–93. [DOI] [PMC free article] [PubMed] [Google Scholar]
- 7.Macias W, Pashupati K, Lewis LS. A wonderful life or diarrhea and dry mouth? Policy issues of direct-to-consumer drug advertising on television. Health Commun. 2007;22:241–52. [DOI] [PubMed] [Google Scholar]
- 8.Frosch DL, Kreuger PM, Hornik RC, Cronholm PF, Barf FK. Creating demand for prescription drugs: A content analysis of television direct-to-consumer advertising. Ann Fam Med. 2007;56:6–13. [DOI] [PMC free article] [PubMed] [Google Scholar]
- 9.US Food and Drug Administration. Background on drug advertising. 2015. RetrievedJune 19, 2020from https://www.fda.gov/drugs/prescription-drug-advertising/background-drug-advertising
- 10.US Food and Drug Administration. Warning letters and notice of violation letters to pharmaceutical companies. 2020. RetrievedJune 19, 2020from https://www.fda.gov/drugs/enforcement-activities-fda/warning-letters-and-notice-violation-letters-pharmaceutical-companies
- 11.Houts PS, Doak CC, Doak LG, Loscalzo MJ. The role of pictures in improving health communication: a review of research on attention, comprehension, recall, and adherence. Patient Educ Couns. 2006;61:173–90. [DOI] [PubMed] [Google Scholar]
- 12.Suh T Visual persuasion. Communication Research Trends. 1999;19:3–17. [Google Scholar]
- 13.Messaris P Visual Persuasion: The Role of Images in Advertising. Thousand Oaks, CA: Sage. 1997. [Google Scholar]
- 14.Rickard LN, Schuldt JP, Eosco GM, Scherer CW, Daziano RA. The proof is in the picture: The influence of imagery and experience in perceptions of hurricane messaging. Weather Clim Soc. 2017;9:471–85. [Google Scholar]
- 15.Boudewyns V, Southwell BG, Betts KR, Gupta CS, Paquin RS, O’Donoghue AC, Vazquez N. Awareness of misinformation in health-related advertising: A narrative review of the literature. In Southwell BG, Thorson EA, Sheble L (Eds.), Misinformation and Mass Audiences. University of Texas Press. 2018. [Google Scholar]
- 16.Pandey AV, Rall K, Satterthwaite ML, Nov O, Bertini E. How deceptive are deceptive visualizations?: An empirical analysis of common distortion techniques. Proceedings of the 33rd Annual ACM Conference on Human Factors in Computing Systems 2015:1469–78. [Google Scholar]
- 17.Dixon GN, McKeever BW, Holton AE, Clarke C, Eosco G. The power of a picture: Overcoming scientific misinformation by communicating weight-of-evidence information with visual exemplars. J Comm. 2015;65:639–59. [Google Scholar]
- 18.Nyhan B, Reifler J. Misinformation and Fact-checking. Research Findings 2012. RetrievedJune 19, 2020from https://www.dartmouth.edu/ñyhan/Misinformation_and_Fact-checking.pdf
- 19.Brainerd CJ, Reyna VF, Ceci SJ. Developmental reversals in false memory: A review of data and theory. Psychol Bull. 2008;134:343–82. [DOI] [PubMed] [Google Scholar]
- 20.Reyna VF. A theory of medical decision making and health: Fuzzy trace theory. Med Decis Making. 2008;28:850–65. [DOI] [PMC free article] [PubMed] [Google Scholar]
- 21.Sullivan HW, O’Donoghue AC, Lynch M, Johnson M, Davis C, Rupert DJ. The effect of including quantitative information on multiple endpoints in direct-to-consumer prescription drug television advertisements. Med Decis Making. 2019;39:975–85. [DOI] [PMC free article] [PubMed] [Google Scholar]
- 22.O’Donoghue AC, Sullivan HW, Aikin KJ, Chowdhury D, Moultrie RR, Rupert DJ. Presenting efficacy information in direct-to-consumer prescription drug advertisements. Patient Educ Couns. 2014;95:271–80. [DOI] [PMC free article] [PubMed] [Google Scholar]
- 23.Reyna VF, Nelson WL, Han PK, Dieckmann NF. How numeracy influences risk comprehension and medical decision making. Psychol Bull. 2009;135:943–73. [DOI] [PMC free article] [PubMed] [Google Scholar]
- 24.Depp CA, Schkade DA, Thompson WK, Jeste DV. Age, affective experience, and television use. American journal of preventive medicine. 2010;39:173–8. [DOI] [PMC free article] [PubMed] [Google Scholar]
- 25.Kantor ED, Rehm CD, Haas JS, Chan AT, Giovannucci EL. Trends in prescription drug use among adults in the United States from 1999–2012. J Amer Med Assoc. 2015;314:1818–30. [DOI] [PMC free article] [PubMed] [Google Scholar]
- 26.National Eye Institute. Age-related macular degeneration (AMD) data and statistics. RetrievedJune 19, 2020from https://nei.nih.gov/health/maculardegen/armd_facts
- 27.Knapp P, Raynor DK, Woolf E, Gardner PH, Carrigan N, McMillan B. Communicating the risk of side effects to patients. Drug Saf. 2009;32:837–49. [DOI] [PubMed] [Google Scholar]
- 28.Mühlbauer V, Prinz R, Mühlhauser I, Wegwarth O. Alternative package leaflets improve people’s understanding of drug side effects—A randomized controlled exploratory survey. PloS One. 2018;13: e0203800. [DOI] [PMC free article] [PubMed] [Google Scholar]
- 29.Schwartz LM, Woloshin S, Welch HG. Using a drug facts box to communicate drug benefits and harms: Two randomized trials, Ann Intern Med. 2009:150:516–27. [DOI] [PubMed] [Google Scholar]
- 30.Sullivan HW, O’Donoghue AC, Aikin KJ. Communicating benefit and risk information in direct-to-consumer print advertisements: A randomized study. Ther Innov Regul Sci. 2015;49:493–502. [DOI] [PMC free article] [PubMed] [Google Scholar]
- 31.Fagerlin A, Zikmund-Fisher BJ, Ubel PA, Jankovic A, Derry H, Smith DM. Measuring numeracy without a math test: Development of the Subjective Numeracy Scale (SNS). Med Decis Making. 2007;27:672–80. [DOI] [PubMed] [Google Scholar]
- 32.Schwartz L, Woloshin S, Black W, Welch HG. The role of numeracy in understanding the benefit of screening mammography. Ann Intern Med. 1997;127:966–72. [DOI] [PubMed] [Google Scholar]
- 33.21 C.F.R.§ 202.1. Prescription drug advertisements. 2013. RetrievedJune 19, 2020from: http://www.accessdata.fda.gov/scripts/cdrh/cfdocs/cfCFR/CFRSearch.cfm?fr=202.1
- 34.US Food and Drug Administration. Presenting quantitative efficacy and risk information in direct-to-consumer promotional labeling and advertisements: Guidance for industry. 2018. RetrievedJune 19, 2020from https://www.fda.gov/media/117573/download