

Abstract
Purpose:
X-ray irradiation of tumors causes diverse effects on the tumor microenvironment including metabolism. Recent developments of hyperpolarized 13C-MRI enabled detecting metabolic changes in tumors using a tracer [1-13C]pyruvate, which participates in important bioenergetic processes that are altered in cancers. Here, we investigated the effects of X-ray irradiation on pyruvate metabolism in squamous cell carcinoma (SCCVII) and colon cancer (HT-29) using hyperpolarized 13C-MRI.
Experimental design:
SCCVII and HT-29 tumors were grown by injecting tumor cells into the hind legs of mice. [1-13C]pyruvate was hyperpolarized and injected intravenously into tumor bearing mice, and 13C-MR signals were acquired using a 4.7 T scanner.
Results:
[1-13C]pyruvate and [1-13C]lactate were detected in the tumor-bearing legs immediately after hyperpolarized [1-13C]pyruvate administration. The [1-13C]lactate to [1-13C]pyruvate ratio (Lac/Pyr) increased as the tumors grew in non-irradiated SCCVII tumors. The increase in Lac/Pyr was suppressed modestly with a single 10 Gy of irradiation, but it significantly decreased by further irradiation (10 Gy × 3). Similar results were obtained in HT-29; Lac/Pyr significantly dropped with fractionated 30 Gy irradiation. Independent ex vivo measurements revealed that the LDH activity and protein level were significantly smaller in the irradiated SCCVII tumors compared with the non-irradiated tumors, indicating that a decrease in LDH activity was one of the main factors responsible for the decrease of Lac/Pyr observed on 13C-MRI.
Conclusion:
Robust changes of Lac/Pyr observed in the HT-29 after the radiation suggested that lactate conversion from pyruvate monitored with hyperpolarized 13C-MRI could be useful for the evaluation of early response to radiotherapy.
Keywords: hyperpolarized 13C MRI, pyruvate metabolism, radiotherapy, LDH activity, tumor hypoxia
Introduction
Radiation therapy is widely used for cancer treatment. The efficacy of radiotherapy is mainly evaluated by the shrinkage of tumor volume, but it can take weeks to detect such changes. The anatomical information obtained by computed tomography (CT) and magnetic resonance imaging (MRI) is important and is widely used for the diagnosis and localization of tumors, but these modalities are not suitable for detecting early responses to treatment (1,2). Therefore, imaging biomarkers for monitoring early response to radiotherapy are desired to provide more effective treatments. Irradiation can induce diverse effects on the tumor microenvironment, such as changes in perfusion, oxygenation, and metabolism, in addition to killing tumor cells (3–7). Changes in the tumor microenvironment can serve as useful markers for assessing the efficacy of radiotherapy because these changes occur in advance of tumor shrinkage (8,9). Although several modalities exist that can monitor changes in the tumor microenvironment, such as dynamic contrast-enhanced MRI (DCE-MRI) (10,11) and 18F-fluoro-2-deoxyglucose positron emission tomography (FDG-PET) (12,13), new MRI-based approaches are being explored that could provide anatomically co-registered metabolic/physiologic information (14,15).
Hyperpolarized MRI could provide us with the ability to monitor the metabolic processes of hyperpolarized substrates in live animals and humans (15–17). Several studies using hyperpolarized [1-13C]pyruvate have shown that lactate formation from pyruvate was significantly higher in tumors compared with normal tissues, and it decreased with treatments, such as PI3K inhibitors and antiangiogenic agents (8,18–20). A recent study using transgenic mice of prostate cancer was able to distinguish between responders and non-responders to androgen deprivation therapy based on the changes of Lac/Pyr ratio before and after treatment suggesting that this imaging biomarker can be a useful non-invasive tool in monitoring treatment response (21). These studies clearly demonstrated that hyperpolarized 13C-MRI using [1-13C]pyruvate was a promising approach for detecting early changes in tumor metabolism.
In this study, we investigated tumor response to radiotherapy in squamous cell carcinoma (SCCVII) and the HT-29 colon cancer xenograft model using hyperpolarized 13C-MRI with [1-13C]pyruvate. These two cell lines as implants have been recently studied to characterize tumor oxygenation and blood flow. Thus, these two tumors could serve as useful models to investigate the feasibility of early detection of treatment response to radiation by 13C MRSI using [1-13C]pyruvate.
Materials and Methods
Animal studies
All of the animal experiments were performed in compliance with the Guide for the Care and Use of Laboratory Animal Resources (National Research Council, 1996) and were approved by the National Cancer Institute Animal Care and Use Committee (NCI-CCR-ACUC [Bethesda, MD], protocol nos. RBB-153, 155, and 159). Female C3H/Hen mice and athymic nude mice were supplied by the Frederick Cancer Research Center, Animal Production (Frederick, MD). SCCVII cell line was kindly obtained from Dr. T. Philips, University of California San Francisco (San Francisco, CA). The SCCVII is a squamous carcinoma which arose spontaneously in the abdominal wall of a C3H mouse in the laboratory of Dr. H. Suit, Massachusetts General Hospital (Boston, MA) (22,23), and was subsequently adapted for clonogenic growth by Dr. K. Fu, University of California San Francisco (24). HT-29 was purchased from American Type Culture Collection (ATCC). Both cell lines were tested in 2013 by IDEXX RADIL (Columbia, MO) using a panel of microsatellite markers.
SCCVII and HT-29 solid tumors were formed by injecting 5 × 10⁵ cells and 1 × 10⁶ cells, respectively, subcutaneously into the right hind legs of mice. The length and width of tumor were measured by a digital caliper, and the volume was calculated by length × width2 × π/6. The radiation doses used in this study were based on the results obtained in these cells in in vitro and in vivo studies (25). The growth of SCCVII tumors (n=7 for each control group and irradiated group) and HT-29 tumors (n=7 for each control group and irradiated group) were monitored until they exceeded 1800 mm3 or they were not visually observed after radiotherapy. The 13C-MRI studies and X-ray treatments was initiated 8 days and 10 days after tumor cell implantation with SCCVII and HT-29 tumor cells, respectively. The tumor volumes were 600–750 mm3 at the beginning of the experiments. The mice were anesthetized with isoflurane (4 % for induction and 1.5–2.5 % for maintaining anesthesia) in medical air (500 mL/min) and were positioned prone with their tumor-bearing legs placed inside the resonator. During MRI measurements, the breathing rate of the mouse was monitored with a pressure transducer (SA Instruments Inc., Stony Brook, NY) and was maintained at 80 ± 10 breaths per minute. Core body temperature was also monitored with a non-magnetic rectal temperature probe (FISO) and was maintained at 36 ± 1°C with a flow of warm water. For administration of [1-13C]pyruvate, a 24-gauge catheter (Surflash i.v. catheter, Terumo Co.) was cannulated into the tail vein and was extended using polyethylene tubing (PE-10).
Hyperpolarized 13C-MRI studies
[1-13C]pyruvic acid (30 μL), containing 15 mM OX063 and 2.5 mM gadolinium chelate ProHance (Bracco Diagnostics, Milano, Italy), was hyperpolarized using the Hypersense DNP polarizer (Oxford Instruments, Abingdon, UK) as described previously (26). After 30–60 min, the hyperpolarized sample was rapidly dissolved in 4.5 mL of a superheated alkaline buffer that consisted of 40 mM 4-(2-hydroxyethyl)-1-piperazineethanesulfonic acid, 30 mM of NaCl, and 100 mg/L ethylendiaminetetraacetic acid. A hyperpolarized [1-13C] pyruvate solution (96 mM) was intravenously injected through a catheter placed in the tail vein of the mouse (12 μL/g body weight). Hyperpolarized 13C MRI studies were performed on a 4.7 T scanner (Bruker Bio-Spin MRI GmbH) using a 17 mm home-built 13C solenoid coil placed inside of a saddle coil for 1H. For the dynamic study, 13C spectra were acquired every 1sec for 240 sec from a 8–12 mm slice on the SCCVII (n=4 for control and n=6 for irradiated group) and HT-29 (n=5 for each control and irradiated group). The slice thickness was defined as it included most part of the tumor. 13C two-dimensional spectroscopic images were also acquired 30 s after the start of the pyruvate injection, with a 32 × 32 mm2 field of view in a 8 mm axial slice through the tumor, a matrix size of 16 × 16, spectral width of 4000 Hz, repetition time of 75 ms, and 250 μs Gaussian excitation pulse with a flip angle of 5°. The total time required to acquire each image was 19.2 s. Five SCCVII tumors and five HT-29 tumors were measured before and after X-ray treatments in the imaging study.
Electron paramagnetic resonance (EPR) imaging
Tumor pO2 maps in SCCVII tumor (n=5) and HT-29 tumor (n=4) were obtained using EPR imaging. Technical details of the EPR scanner operating at 300 MHz, data acquisition based on the single-point imaging (SPI) modality, image reconstruction, and oxygen mapping procedure have been described in earlier reports (27,28). After the animal was placed in the resonator, a triarylmethyl radical probe (OX063, GE Healthcare) was injected intravenously as a 1.125 mmol/kg bolus through a cannula placed in the tail vein. EPR signals were obtained following the RF excitation pulses (60 ns, 80 W, 70° flip angle) using an analog-to-digital converter (200 megasamples/s). The repetition time (TR) was 8.0 μs. The FIDs were collected under a nested loop of the x, y, and z gradients, and each time point in the FID underwent phase modulation enabling 3D spatial encoding. Because EPRI doesn’t provide anatomical information, anatomical images were obtained using a 7 T MRI controlled with ParaVision software, version 5.0 (Bruker BioSpin MRI GmbH). T2-weighted anatomical images were obtained using a fast spin echo sequence (RARE) with an echo time (TE) of 13 ms, TR of 2.5 s, 14 slices, RARE factor 8, resolution of 0.109 × 0.109 mm, and acquisition time of 80 s. The MRI images had the field of view of 28 mm × 28 mm and slice thickness of 2 mm. Co-registration of EPR and MRI images was accomplished using code written in MATLAB (Mathworks), as described in a previous report (28).
Western blot and LDH activity assay
The mice (n=3 for each group) were euthanized by breathing carbon dioxide gas, and 5–10 mm3 tumor biopsy samples were excised. The tumor tissues were immediately homogenized with T-PER tissue protein extraction reagent (Thermo scientific, Rockford, IL). The homogenate was centrifuged, and the supernatant was used for LDH assay. LDH-A protein levels were measured by western blot. The proteins in tumor extract were separated on 4–12 % Bis-Tris gel (Life Technologies) by SDS-PAGE and were transferred to nitrocellulose membrane. The membranes were blocked for 1 hour in blocking buffer (3 % non-fat dry milk in 0.1 % Tween 20/TBS), which was then replaced by the primary antibody diluted in blocking buffer at a 1:2000 dilution, and were incubated for 1 hour at room temperature. The membranes were then washed three times in washing buffer (0.1% Tween 20/TBS). The primary antibody was detected using horseradish peroxidase–linked goat anti-mouse or goat anti-rabbit IgG antibody at a 1:2000 dilution (Santa Cruz Biotechnology, Santa Cruz, CA), visualized with Western Lightning Plus-ECL enhanced chemiluminescence substrate (Perkin Elmer Inc.) and measured by the Fluor Chem HD2 chemiluminescent imaging system (Alpha Innotech Corp.). LDH activity was measured by monitoring NADH consumption in the presence of pyruvate. The tumor extract was added to the mixture of 200 μM NADH and 2 mM pyruvate, and the absorbance at 340 nm was measured every 20 sec with the Agilent 8453 UV-Visible Spectrophotometer.
Colony formation assay
The mice (n=3 for each group) were euthanized by breathing carbon dioxide gas, and 5–10 mm3 tumor biopsy samples were excised. The tumor tissues were immediately minced with scissors and were digested by 0.2 % collagenase/0.02 % deoxyribonuclease solution to yield single-cell suspensions. The cells were counted and seeded in culture dishes at concentrations of 250–10,000 cells/dish for colony formation. Ten days later, the colonies were stained with crystal violet dye, and the numbers of colonies were counted.
X-ray irradiation
The mice were fixed in a specially designed jig for X-ray irradiation in which they were restricted from moving without anesthesia. X-ray irradiation (10 Gy) was delivered to the tumor-bearing leg 8, 9, and 10 days after SCCVII tumor implantation and 10, 11, and 12 days after HT-29 implantation, using a XRAD-320 (Precision X-ray Inc., North Branford, CT).
Statistical analysis
All of the results are expressed as the means ± SEMs. The differences in the means of groups were determined by Student’s 2-tailed t test. The minimum level of significance was set at p <0.05.
Results
Tumor pO2 and growth suppression by X-ray irradiation
In this study, two types of tumors, SCCVII murine carcinoma and HT-29 human colon carcinoma, were used to examine metabolic changes caused by X-ray irradiation. As shown in a previous study, these tumors differed in their microenvironmental features, such as oxygenation and blood vessel integrity (29). Figure 1A shows representative pO2 maps in a SCCVII tumor and an HT-29 tumor implanted in mouse legs. From the pO2 maps obtained from these tumors, HF10 (fractional tumor volume with pO2 < 10 mmHg) was computed and the results are shown in Fig. 1B. The results showed that the SCCVII tumor was relatively more radiobiologically hypoxic compared to HT-29 tumor. Additionally, previous studies showed that the SCCVII tumor displayed cycling hypoxia to a larger extent than the HT-29 tumor (29), a feature associated with pro-survival pathways which can confer resistance to treatment (30,31). The difference in tumor oxygenation could influence each tumor’s response to irradiation. Figure 1C shows the growth curves of the non-irradiated SCCVII tumors and the fractionated 30 Gy (10 Gy × 3) irradiated tumors. X-ray irradiation was started 8 days after tumor implantation. The doubling time of the non-irradiated SCCVII tumor was found to be 2.7 ± 0.2 days. Tumor suppression was confirmed 2 days after the beginning of irradiation, and the growth was delayed for 5 days by 30 Gy of irradiation. X-ray irradiation to HT-29 tumors was started 10 days after tumor implantation when the tumor size was similar to that on Day 8 with the SCCVII tumors. The doubling time of the non-irradiated HT-29 tumor was found to be 4.9 ± 0.6 days. The growth kinetics of the irradiated HT-29 tumors were almost same as the those of the non-irradiated control tumors until 1 day after fractionated 30 Gy irradiation, after which the tumor shrank (Fig. 1D). The difference in radiation response in these two tumors was consistent with the relatively higher median pO2 of the HT-29 tumors compared to the SCCVII tumors as well as the better blood flow characteristics (29).
Figure 1.

(A) pO2 maps in a SCCVII tumor and a HT-29 tumor. (B) Percentage of hypoxic fraction (pO2 < 10 mmHg) in SCCVII tumors (n=5) and HT-29 tumors (n=4). (C,D) Growth curves of SCCVII (n=7 for each control and irradiated group) and HT-29 (n=7 for each control and irradiated group) with (●) and without (○) X-irradiation.
Lactate formation from pyruvate in tumors measured using hyperpolarized 13C-MRI was decreased by X-irradiation
To evaluate the effects of X-ray irradiation on pyruvate metabolism, 13C-MR spectroscopic measurements were carried out in SCCVII tumor-bearing mice. Hyperpolarized [1-13C]pyruvate was intravenously injected into the SCCVII tumor-bearing mice, and 13C spectra in the tumor region were acquired every 1 sec. Figure 2 shows representative images of the anatomy of the tumor-bearing leg, 13C-MR spectra from the tumor region, and signal intensity curves of [1-13C]pyruvate and [1-13C]lactate after hyperpolarized [1-13C]pyruvate administration. Signals of [1-13C]pyruvate (171 ppm) and [1-13C]lactate (183 ppm) were observed immediately after the [1-13C]pyruvate injection (Fig. 2B), indicating that exogenously administered pyruvate was quickly absorbed into the tumor cells and was converted into lactate by a LDH-catalyzed reaction in the SCCVII tumors. It is known that acetate is produced through a bimolecular reaction with H2O2. However, because of the slow rate of reaction of pyruvate with hydrogen peroxide and the levels of H2O2 in the nM levels (32), no detectable acetate peak was found. Representative signal intensity curves of a SCCVII tumor and a HT-29 tumor obtained from the 13C spectra were shown in Fig. 2C and D. There was not remarkable difference in behavior of the curves between the two tumor lines. The [1-13C]lactate to [1-13C]pyruvate ratio (Lac/Pyr) was calculated from the areas under the curves (AUC) in the time- intensity curves shown in the Fig. 2C and D. Hill et al. compared AUC with kinetic modeling, and showed there was an excellent correlation between Lac/Pyr calculated from AUC and the rate constant of the reaction from pyruvate to lactate both in vitro and in vivo (33). So, we used AUC to quantify the lactate formation from pyruvate.
Figure 2.
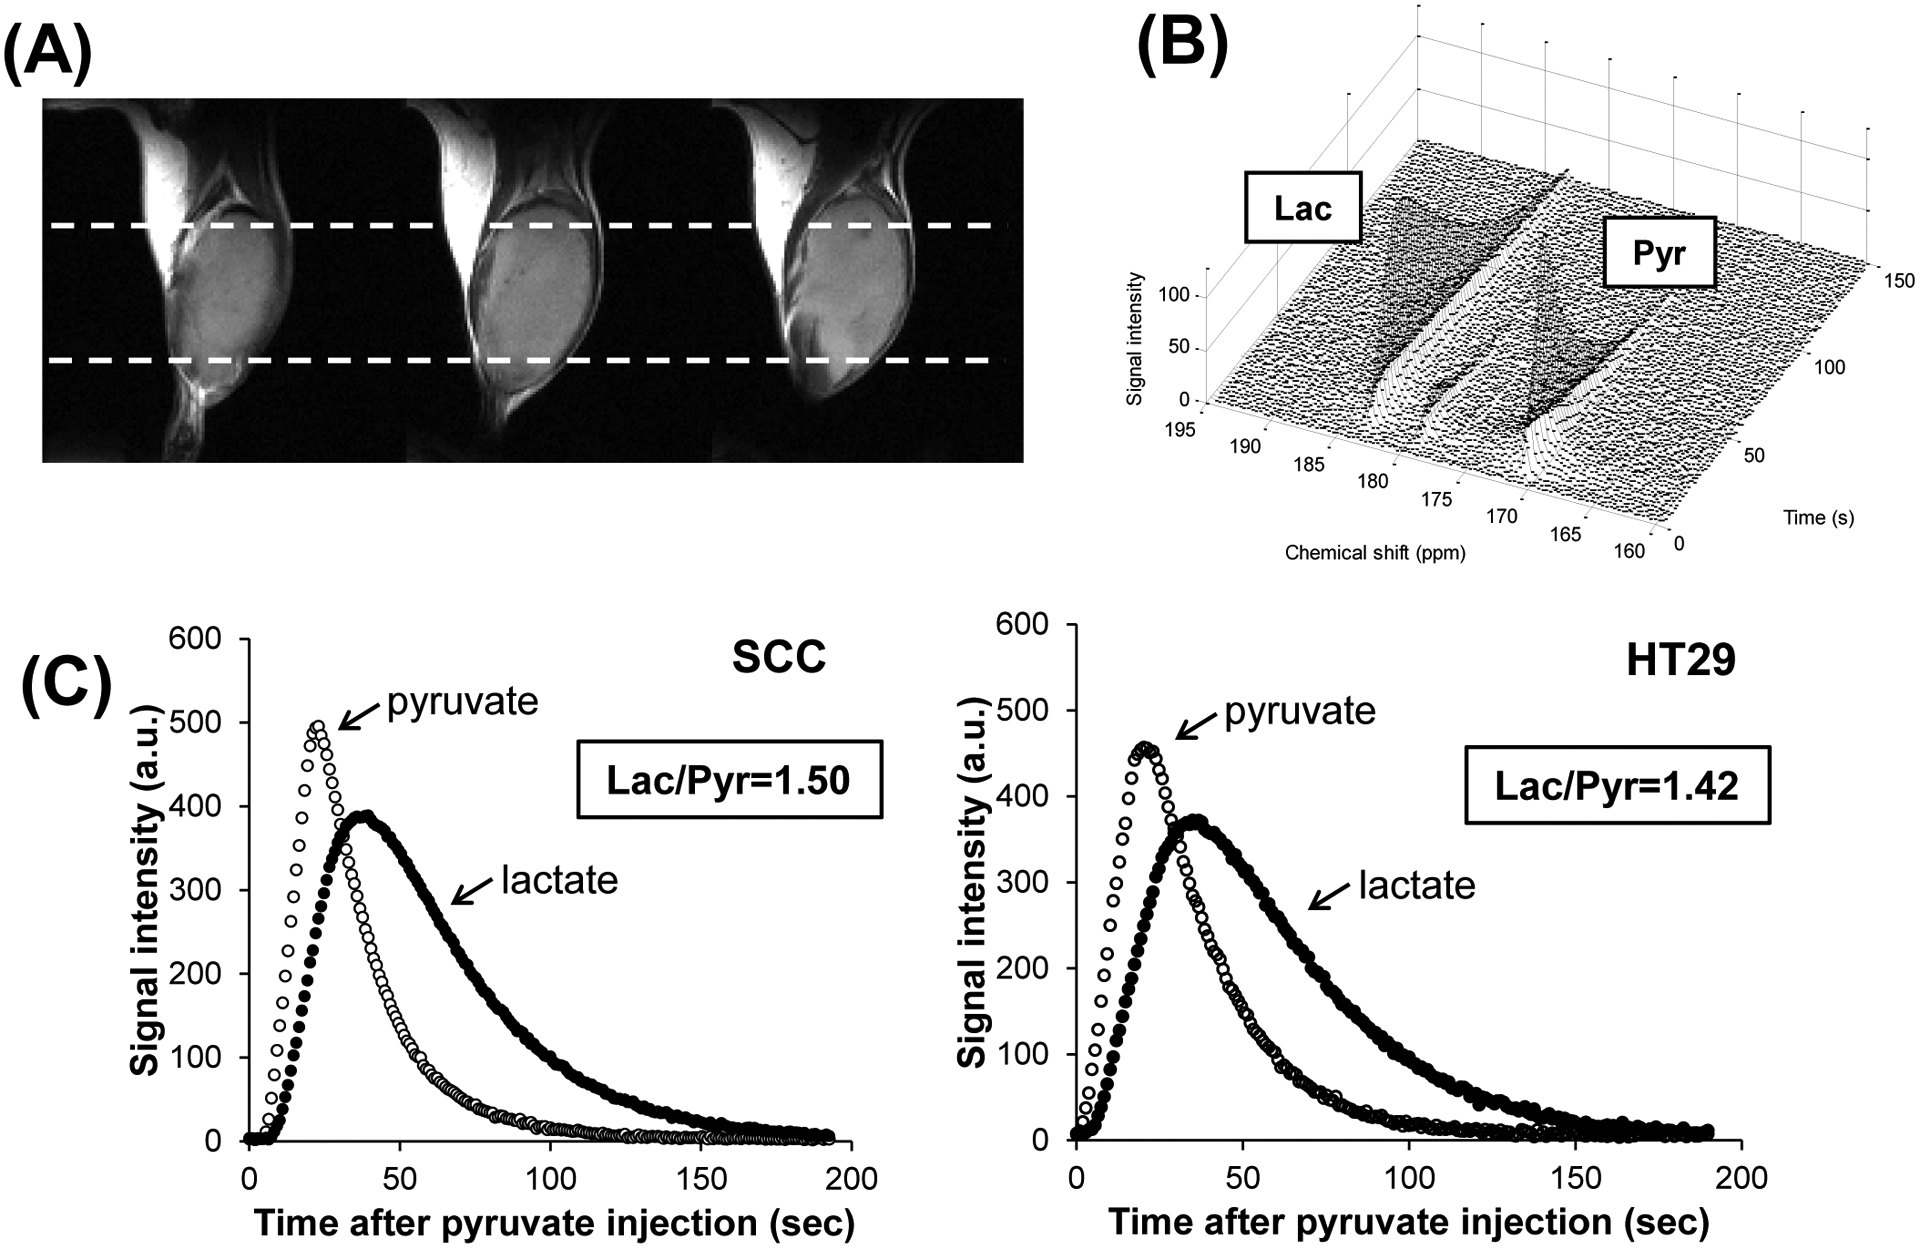
(A) T2-weighted anatomical image of a SCCVII tumor-bearing leg (3 adjacent slices). White dashed lines indicate the regions of the 13C-MRS measurements. (B) 13C-MR spectra and (C) signal intensity curves of [1-13C]pyruvate and [1-13C]lactate detected in the SCCVII tumor after hyperpolarized [1-13C]pyruvate injection. Representative signal intensity curves measured in a HT-29 tumor after hyperpolarized [1-13C]pyruvate injection was also displayed.
Longitudinal changes in Lac/Pyr in non-irradiated control SCCVII tumors and X-ray irradiated tumors were examined using hyperpolarized 13C-MRS. Lac/Pyr was measured before irradiation (Day 8), 1 day after the first 10 Gy of irradiation (Day 9) and 1 day after the 30 Gy irradiation (Day 11). In the non-irradiated control group, Lac/Pyr increased as the tumor grew from 1.58 ± 0.13 on Day 8 to 2.44 ± 0.27 on Day 11 (Fig. 3A). The increase in lactate formation was suppressed upon exposure to radiation. The Lac/Pyr ratio 1 day after 10 Gy irradiation (Day 9) increased compared with Lac/Pyr before irradiation (Day 8), but it was 10 % smaller than in the control group. Further irradiation caused a significant decrease in lactate. Lac/Pyr decreased to 1.36 ± 0.08 1 day after the 30 Gy irradiation. This was ~ 40 % smaller compared with the day-matched control tumors.
Figure 3.

(A) The [1-13C]lactate to [1-13C]pyruvate ratio in the SCCVII tumors with (●, n=6) and without (○, n=4) X-ray irradiation, calculated from the area under the curve of the signal intensity curves. * p<0.05 compared with control Day 8. ** p<0.05 and 0.005 compared with X-ray Day 9 and control Day 11, respectively. (B) The [1-13C]lactate to [1-13C]pyruvate ratio in the HT-29 tumors with (●, n=5) and without (○, n=5) X-ray irradiation. * p<0.05 compared with X-ray Day 10 and control Day 13.
The decrease in the Lac/Pyr ratio caused by irradiation was observed in another tumor xenograft model: the HT-29 tumor. In the control group, Lac/Pyr did not change significantly from Day 10 to Day 13. In contrast, Lac/Pyr decreased significantly after a 30 Gy dose of radiation, from 1.40 ± 0.16 before irradiation to 0.88 ± 0.13 1 day after irradiation (Fig. 3B). This ratio was 45 % smaller than the day-matched controls, although the tumor size was almost the same at that time point (Day 13). This response in metabolism changes in HT-29 tumors was consistent with the subsequent tumor size decreases and was in agreement with the higher pO2 status of this tumor.
Distribution of [1-13C]pyruvate and [1-13C]lactate in SCCVII tumors and HT-29 tumors after hyperpolarized [1-13C]pyruvate administration was monitored by 13C-MRI. Chemical shift images of the tumor-bearing mouse legs were acquired between 30 and 50 sec after hyperpolarized [1-13C]pyruvate injection (Fig. 4A,D). Figure 4B and E show maps of total 13C, which is the sum of the [1-13C]pyruvate and [1-13C]lactate signals. The total 13C maps showed the lack of the 13C signal in some regions of the tumors after 30 Gy of irradiation, especially in the SCCVII, indicating a lack of blood flow in the region due to radiation damage. The [1-13C]lactate to [1-13C]pyruvate ratio was calculated in each pixel (Fig. 4C,F). The median value of Lac/Pyr in the tumor region, calculated from chemical shift images, showed drop of lactate formation by the radiation that is similar to the results of 13C-MRS (Fig. 4G). The drop of Lac/Pyr by the radiation was larger in HT-29 tumor (34.4 % drop compared with before radiation) than SCCVII tumor (25.4 % drop compared with before radiation).
Figure 4.

Representative chemical shift images of a SCC tumor (A) and a HT29 tumor (D) obtained before irradiation, at 1 day after 10 Gy of irradiation, and at 1 day after fractionated 30 Gy irradiation. The images were acquired at 30 to 50 sec after hyperpolarized [1-13C]pyruvate injection. The left peak is [1-13]lactate, and the right peak is [1-13C]pyruvate, which are detected in each voxel. The voxel size is 2 mm × 2 mm × 8 mm. Total 13C maps (B,E) and images of the [1-13C]lactate to [1-13C]pyruvate ratio (C,F) in the SCC tumor (B,C) and the HT-29 tumor (E,F). (G) The [1-13C]lactate to [1-13C]pyruvate ratio in SCCVII tumors (n=5) and HT-29 tumors (n=5), calculated from the chemical shift images. * p < 0.05 compared with the 10 Gy radiation.
LDH activity and protein levels were decreased by X-ray irradiation
Independent ex vivo measurements, using an extract of SCCVII tumor, revealed that LDH activity was significantly lower in 30 Gy-irradiated tumors compared to non-irradiated tumors. The results of western blotting showed that the LDH-A protein levels in irradiated tumors were 38 % lower than in non-irradiated control tumors (Fig. 5A,B). LDH activity, measured by NADH consumption in the presence of pyruvate, was also smaller in the irradiated tumors (1.15 ± 0.03 μmol NADH/min/mg protein) compared with the control tumors (1.52 ± 0.06 μmol NADH/min/mg protein), indicating that a decrease in LDH activity was one of the factors responsible for the decrease in lactate formation observed in 13C-MRI (Fig. 5C). Tumor cell survival, assessed by the colony formation assay, revealed significant cell killing in tumors after irradiation. The colony-forming ability of SCCVII tumors after 10 and 30 Gy of irradiation was decreased by 44 % and 91 %, respectively compared with that of the non-irradiated control tumors (Fig. 5D). The colony forming ability of HT-29 was decreased by radiation to a larger extent than SCCVII tumor. This is consistent with better response of HT-29 to radiation observed in growth assay and in 13C-MRI experiments, indicating cell death caused by radiation was a dominant factor of the Lac/Pyr decrease. LDH protein level and activity in HT-29 tumors also decreased by the radiation. However, drop of total protein level made the changes of LDH/Actin and LDH activity per unit protein moderate.
Figure 5.

(A, B) Western blot analysis of LDH-A protein expression and (C) LDH activity in SCCVII tumors (n=3) and HT-29 tumors (n=3), measured using tumor homogenate. The tumors were excised 1 day after fractionated 30 Gy of irradiation and homogenized, and the proteins were extracted. LDH activity in the extraction was assessed from NADH oxidation in the presence of pyruvate. Control was day-matched non-irradiated tumors. (D) The colony-forming ability of non-irradiated tumor cells (n=3) and X-ray irradiated tumor cells (n=3). * p < 0.05, ** p < 0.01, *** p < 0.001 compared with the control.
Discussion
Studies using hyperpolarized 13C-MRI have demonstrated that [1-13C]pyruvate is a promising probe for monitoring energy metabolism in tumors and determining early responses to therapies (8,15,19). The decrease in lactate formation by X-ray irradiation, monitored using hyperpolarized 13C-MRI, was first reported by Day et al using C6 glioma tumors with a single dose of 15 Gy of irradiation (34). In that study, Lac/Pyr decreased between 24 and 96 hours after irradiation, although there was no significance at 24 and 48 hours. In the present study, we found that Lac/Pyr was significantly decreased with fractionated 30 Gy (3 × 10 Gy) irradiation of two tumor implants, SCCVII and HT-29, in mice. The effects of irradiation on pyruvate metabolism were stronger in HT-29 tumors than in SCCVII tumors: that is, at 1 day after the 3 fractions of radiation, lactate to pyruvate ratio in the HT-29 tumor measured by 13C-MRS decreased by 37 % compared with that before radiation, whereas it decreased by 15 % in the SCCVII tumor (Fig. 3). Lac/Pyr in SCCVII tumors was significantly smaller in the irradiated group compared with the day-matched control group, but there was no significance compared with that before irradiation. In contrast, Lac/Pyr significantly decreased in treated tumors compared with before irradiation in HT-29 tumors (Fig. 3B). It is well known that the efficacy of radiotherapy depends on pre-treatment tumor oxygenation (35–37). The strong effects of irradiation on HT-29 growth and pyruvate metabolism could be attributed to higher oxygenation (Fig. 1B). The increase in Lac/Pyr in non-irradiated SCCVII tumors from Day 8 to Day 11 was also consistent with previous studies (38,39) that showed that SCCVII tumors became more hypoxic as tumors grew, with LDH expected to increase because it is a downstream protein of HIF-1.
LDH protein levels and activity significantly decreased in irradiated tumors (Fig. 5B, C). This decrease in LDH protein would have resulted from the potent cytocidal effects of 30 Gy irradiation, which were further confirmed by colony formation assay (Fig. 5D). In addition to LDH, monocarboxylate transporters (MCTs), which transport pyruvate into tumor cells, affect the rate of lactate conversion from pyruvate. Although the radiation-induced changes in the MCTs were not monitored in this study, it was expected that MCT proteins were also reduced by irradiation, as with LDH. Indeed, Chen et al. reported that MCT4 protein levels in MDA-MB-231 tumors were decreased by a single 16 Gy dose of irradiation (40). The decrease in the transport of pyruvate into tumor cells by irradiation may have contributed to the decrease in Lac/Pyr observed in this study.
Radiation causes alterations in tumor blood vessels and influences tumor perfusion/permeability. Bohndiek et al reported that the changes in 13C flux between hyperpolarized [1-13C]pyruvate and [1-13C]lactate by anti-VEGF therapy were correlated with the changes in uptake of gadolinium contrast agent measured using DCE-MRI in LoVo tumors and HT-29 tumors (41). The total 13C maps showed a lack of the 13C signal in some regions of the SCCVII tumors after the 30 Gy irradiation, whereas the 13C signal was observed throughout the tumors before irradiation (Fig. 4B). It was not possible to quantify the blood flow using hyperpolarized 13C-MRI because the 13C signal intensity was influenced by the magnitude of polarization. However, the lack of the 13C signal indicated that tumor perfusion was altered by irradiation, at least in that region.
In conclusion, 13C-MRI with hyperpolarized [1-13C]pyruvate revealed that pyruvate metabolism into lactate in SCCVII and HT-29 tumors was reduced by X-ray irradiation. Especially in HT-29, the robust changes of Lac/Pyr were observed after the radiation though the tumor size did not yet show a robust response. The results suggested the hyperpolarized 13C-MRI was useful for evaluating early response to radiotherapy. It was also shown that the decrease in Lac/Pyr was mainly attributed to the decrease in LDH activity due to cell death caused by irradiation. Further studies using lower dose rates are necessary to assess the effects of irradiation on tumor metabolism because the dose rate used in this study (10 Gy × 3) was higher than that used clinically.
Translational Relevance:
Magnetic Resonance Spectroscopic Imaging (MRSI) using hyperpolarized tracers [1-13C]pyruvate provided an imaging biomarker which delineates the tumor on the basis of aerobic glycolysis by monitoring the conversion of injected pyruvate to the metabolic product lactate. In two tumor cell lines implanted in mice, lactate/pyruvate ratios were monitored before, during and after fractionated radiotherapy. The lactate/pyruvate ratios significantly responded to radiation in HT-29 tumors, which are relatively less hypoxic, whereas the response in the relatively more hypoxic SCCVII tumor was modest. The response to radiotherapy measured as tumor regrowth delay was in agreement with the response of the lactate/pyruvate: the regrowth delay was longer and more profound in HT-29 tumors than SCCVII tumors. [1-13C]pyruvate is used with metabolic MRI in humans to detect prostate cancer with sensitivity and specificity making it a promising imaging modality to provide imaging biomarkers to monitor response to radiotherapy.
Acknowledgments
This study was supported by intramural research program of NCI/NIH.
Footnotes
The authors declare that there are no potential conflicts of interest.
References
- 1.Brindle K New approaches for imaging tumour responses to treatment. Nat Rev Cancer. 2008;8:94–107. [DOI] [PubMed] [Google Scholar]
- 2.Penet M-F, Krishnamachary B, Chen Z, Jin J, Bhujwalla ZM. Molecular imaging of the tumor microenvironment for precision medicine and theranostics. Adv Cancer Res. 2014;124:235–56. [DOI] [PMC free article] [PubMed] [Google Scholar]
- 3.Koutcher JA, Alfieri AA, Devitt ML, Rhee JG, Kornblith AB, Mahmood U, et al. Quantitative changes in tumor metabolism, partial pressure of oxygen, and radiobiological oxygenation status postradiation. Cancer Res. 1992;52:4620–7. [PubMed] [Google Scholar]
- 4.Kobayashi H, Reijnders K, English S, Yordanov AT, Milenic DE, Sowers AL, et al. Application of a macromolecular contrast agent for detection of alterations of tumor vessel permeability induced by radiation. Clin Cancer Res. 2004;10:7712–20. [DOI] [PubMed] [Google Scholar]
- 5.Fokas E, Hänze J, Kamlah F, Eul BG, Lang N, Keil B, et al. Irradiation-dependent effects on tumor perfusion and endogenous and exogenous hypoxia markers in an A549 xenograft model. Int J Radiat Oncol Biol Phys. 2010;77:1500–8. [DOI] [PubMed] [Google Scholar]
- 6.Fujii H, Sakata K-I, Katsumata Y, Sato R, Kinouchi M, Someya M, et al. Tissue oxygenation in a murine SCC VII tumor after X-ray irradiation as determined by EPR spectroscopy. Radiother Oncol. 2008;86:354–60. [DOI] [PMC free article] [PubMed] [Google Scholar]
- 7.Hou H, Lariviere JP, Demidenko E, Gladstone D, Swartz H, Khan N. Repeated tumor pO(2) measurements by multi-site EPR oximetry as a prognostic marker for enhanced therapeutic efficacy of fractionated radiotherapy. Radiother Oncol. 2009;91:126–31. [DOI] [PMC free article] [PubMed] [Google Scholar]
- 8.Bohndiek SE, Kettunen MI, Hu D, Witney TH, Kennedy BWC, Gallagher FA, et al. Detection of tumor response to a vascular disrupting agent by hyperpolarized 13C magnetic resonance spectroscopy. Mol Cancer Ther. 2010;9:3278–88. [DOI] [PMC free article] [PubMed] [Google Scholar]
- 9.Day SE, Kettunen MI, Cherukuri MK, Mitchell JB, Lizak MJ, Morris HD, et al. Detecting response of rat C6 glioma tumors to radiotherapy using hyperpolarized [1– 13C]pyruvate and 13C magnetic resonance spectroscopic imaging. Magn Reson Med. 2011;65:557–63. [DOI] [PMC free article] [PubMed] [Google Scholar]
- 10.Ellingsen C, Hompland T, Galappathi K, Mathiesen B, Rofstad EK. DCE-MRI of the hypoxic fraction, radioresponsiveness, and metastatic propensity of cervical carcinoma xenografts. Radiother Oncol. 2014;110:335–41. [DOI] [PubMed] [Google Scholar]
- 11.Øvrebø KM, Gulliksrud K, Mathiesen B, Rofstad EK. Assessment of tumor radioresponsiveness and metastatic potential by dynamic contrast-enhanced magnetic resonance imaging. Int J Radiat Oncol Biol Phys. 2011;81:255–61. [DOI] [PubMed] [Google Scholar]
- 12.Weber WA, Ott K, Becker K, Dittler HJ, Helmberger H, Avril NE, et al. Prediction of response to preoperative chemotherapy in adenocarcinomas of the esophagogastric junction by metabolic imaging. J Clin Oncol. 2001;19:3058–65. [DOI] [PubMed] [Google Scholar]
- 13.Gambhir SS. Molecular imaging of cancer with positron emission tomography. Nat Rev Cancer. 2002;2:683–93. [DOI] [PubMed] [Google Scholar]
- 14.Golman K, Ardenkjaer-Larsen JH, Petersson JS, Mansson S, Leunbach I. Molecular imaging with endogenous substances. Proc Natl Acad Sci U S A. 2003;100:10435–9. [DOI] [PMC free article] [PubMed] [Google Scholar]
- 15.Golman K, in ‘t Zandt R, Thaning M. Real-time metabolic imaging. Proc Natl Acad Sci U S A. 2006;103:11270–5. [DOI] [PMC free article] [PubMed] [Google Scholar]
- 16.Albers MJ, Bok R, Chen AP, Cunningham CH, Zierhut ML, Zhang VY, et al. Hyperpolarized 13C lactate, pyruvate, and alanine: noninvasive biomarkers for prostate cancer detection and grading. Cancer Res. 2008;68:8607–15. [DOI] [PMC free article] [PubMed] [Google Scholar]
- 17.Nelson SJ, Kurhanewicz J, Vigneron DB, Larson PEZ, Harzstark AL, Ferrone M, et al. Metabolic imaging of patients with prostate cancer using hyperpolarized [1-13C]pyruvate. Sci Transl Med. 2013;5:198ra108. [DOI] [PMC free article] [PubMed] [Google Scholar]
- 18.Day SE, Kettunen MI, Gallagher FA, Hu D-E, Lerche M, Wolber J, et al. Detecting tumor response to treatment using hyperpolarized 13C magnetic resonance imaging and spectroscopy. Nat Med. 2007;13:1382–7. [DOI] [PubMed] [Google Scholar]
- 19.Ward CS, Venkatesh HS, Chaumeil MM, Brandes AH, Vancriekinge M, Dafni H, et al. Noninvasive detection of target modulation following phosphatidylinositol 3-kinase inhibition using hyperpolarized 13C magnetic resonance spectroscopy. Cancer Res. 2010;70:1296–305. [DOI] [PMC free article] [PubMed] [Google Scholar]
- 20.Dafni H, Larson PEZ, Hu S, Yoshihara HAI, Ward CS, Venkatesh HS, et al. Hyperpolarized 13C spectroscopic imaging informs on hypoxia-inducible factor-1 and myc activity downstream of platelet-derived growth factor receptor. Cancer Res. 2010;70:7400–10. [DOI] [PMC free article] [PubMed] [Google Scholar]
- 21.Chen A, Bok R, Zhang V, Xu d., Veeraraghavan S, Hurd R, et al. Serial Hyperpolarized 13C 3D-MRSI Following Therapy in a Mouse Model of Prostate Cancer. Proc 16th Sci Meet Int Soc Magn Reson Med 2008. page 888. [Google Scholar]
- 22.Suit HD, Suchato C. Hyperbaric oxygen and radiotherapy of a fibrosarcoma and of a squamous-cell carcinoma of C3H mice. Radiology. 1967;89:713–9. [DOI] [PubMed] [Google Scholar]
- 23.Suit HD, Maimonis P, Michaels HB, Sedlacek R. Comparison of hyperbaric oxygen and misonidazole in fractionated irradiation of murine tumors. Radiat Res. 1981;87:360–7. [PubMed] [Google Scholar]
- 24.Fu KK, Rayner PA, Lam KN. Modification of the effects of continuous low dose rate irradiation by concurrent chemotherapy infusion. Int J Radiat Oncol Biol Phys. 1984;10:1473–8. [DOI] [PubMed] [Google Scholar]
- 25.Cook JA, Chuang EY, Tsai M-H, Coffin D, Degraff W, Sowers AL, et al. Radiation-induced changes in gene-expression profiles for the SCC VII tumor cells grown in vitro and in vivo. Antioxid Redox Signal. 8:1263–72. [DOI] [PubMed] [Google Scholar]
- 26.Matsumoto S, Saito K, Yasui H, Morris HD, Munasinghe JP, Lizak M, et al. EPR oxygen imaging and hyperpolarized 13C MRI of pyruvate metabolism as noninvasive biomarkers of tumor treatment response to a glycolysis inhibitor 3-bromopyruvate. Magn Reson Med. 2013;69:1443–50. [DOI] [PMC free article] [PubMed] [Google Scholar]
- 27.Matsumoto K, Subramanian S, Devasahayam N, Aravalluvan T, Murugesan R, Cook JA, et al. Electron paramagnetic resonance imaging of tumor hypoxia: enhanced spatial and temporal resolution for in vivo pO2 determination. Magn Reson Med. 2006;55:1157–63. [DOI] [PubMed] [Google Scholar]
- 28.Matsumoto S, Hyodo F, Subramanian S, Devasahayam N, Munasinghe J, Hyodo E, et al. Low-field paramagnetic resonance imaging of tumor oxygenation and glycolytic activity in mice. J Clin Invest. 2008;118:1965–73. [DOI] [PMC free article] [PubMed] [Google Scholar]
- 29.Yasui H, Matsumoto S, Devasahayam N, Munasinghe JP, Choudhuri R, Saito K, et al. Low-field magnetic resonance imaging to visualize chronic and cycling hypoxia in tumor-bearing mice. Cancer Res. 2010;70:6427–36. [DOI] [PMC free article] [PubMed] [Google Scholar]
- 30.Cairns RA, Kalliomaki T, Hill RP. Acute (cyclic) hypoxia enhances spontaneous metastasis of KHT murine tumors. Cancer Res. 2001;61:8903–8. [PubMed] [Google Scholar]
- 31.Cairns RA, Khokha R, Hill RP. Molecular mechanisms of tumor invasion and metastasis: an integrated view. Curr Mol Med. 2003;3:659–71. [DOI] [PubMed] [Google Scholar]
- 32.Melzer E, Schmidt HL. Carbon isotope effects on the decarboxylation of carboxylic acids. Comparison of the lactate oxidase reaction and the degradation of pyruvate by H2O2. Biochem J. 1988;252:913–5. [DOI] [PMC free article] [PubMed] [Google Scholar]
- 33.Hill DK, Orton MR, Mariotti E, Boult JKR, Panek R, Jafar M, et al. Model free approach to kinetic analysis of real-time hyperpolarized 13C magnetic resonance spectroscopy data. PLoS One. 2013;8:e71996. [DOI] [PMC free article] [PubMed] [Google Scholar]
- 34.Ardenkjaer-Larsen JH, Fridlund B, Gram A, Hansson G, Hansson L, Lerche MH, et al. Increase in signal-to-noise ratio of > 10,000 times in liquid-state NMR. Proc Natl Acad Sci U S A. 2003;100:10158–63. [DOI] [PMC free article] [PubMed] [Google Scholar]
- 35.Gatenby RA, Kessler HB, Rosenblum JS, Coia LR, Moldofsky PJ, Hartz WH, et al. Oxygen distribution in squamous cell carcinoma metastases and its relationship to outcome of radiation therapy. Int J Radiat Oncol Biol Phys. 1988;14:831–8. [DOI] [PubMed] [Google Scholar]
- 36.Hockel M, Schlenger K, Aral B, Mitze M, Schaffer U, Vaupel P. Association between tumor hypoxia and malignant progression in advanced cancer of the uterine cervix. Cancer Res. 1996;56:4509–15. [PubMed] [Google Scholar]
- 37.Dewhirst MW. Relationships between cycling hypoxia, HIF-1, angiogenesis and oxidative stress. Radiat Res. 2009;172:653–65. [DOI] [PMC free article] [PubMed] [Google Scholar]
- 38.Matsumoto S, Batra S, Saito K, Yasui H, Choudhuri R, Gadisetti C, et al. Antiangiogenic agent sunitinib transiently increases tumor oxygenation and suppresses cycling hypoxia. Cancer Res. 2011;71:6350–9. [DOI] [PMC free article] [PubMed] [Google Scholar]
- 39.Saito K, Matsumoto S, Yasui H, Devasahayam N, Subramanian S, Munasinghe JP, et al. Longitudinal imaging studies of tumor microenvironment in mice treated with the mTOR inhibitor rapamycin. PLoS One. 2012;7:e49456. [DOI] [PMC free article] [PubMed] [Google Scholar]
- 40.Chen AP, Chu W, Gu Y-P, Cunnhingham CH. Probing early tumor response to radiation therapy using hyperpolarized [1-13C]pyruvate in MDA-MB-231 xenografts. PLoS One. 2013;8:e56551. [DOI] [PMC free article] [PubMed] [Google Scholar]
- 41.Bohndiek SE, Kettunen MI, Hu D, Brindle KM. Hyperpolarized (13)C spectroscopy detects early changes in tumor vasculature and metabolism after VEGF neutralization. Cancer Res. 2012;72:854–64. [DOI] [PMC free article] [PubMed] [Google Scholar]