

The quantitative signal for the association of fires and land cover change is strong and the impact of frequent fires is vast.
Abstract
Fire plays a dominant role in deforestation, particularly in the tropics, but the relative extent of transformations and influence of fire frequency on eventual forest loss remain unclear. Here, we analyze the frequency of fire and its influence on postfire forest trajectories between 2001 and 2018. We account for ~1.1% of Latin American forests burnt in 2002–2003 (8,465,850 ha). Although 40.1% of forests (3,393,250 ha) burned only once, by 2018, ~48% of the evergreen forests converted to other, primarily grass-dominated uses. While greater fire frequency yielded more transformation, our results reveal the staggering impact of even a single fire. Increasing fire frequency imposes greater risks of irreversible forest loss, transforming forests into ecosystems increasingly vulnerable to degradation. Reversing this trend is indispensable to both mitigate and adapt to climate change globally. As climate change transforms fire regimes across the region, key actions are needed to conserve Latin American forests.
INTRODUCTION
Forests cover nearly one-third (4.06 billion ha) of land globally (1) and play a central role in the earth system by providing global ecosystem services such as climate regulation and water cycling (2) and as reservoirs of land biodiversity. More than half (56%) of world forests are tropical (45%) and subtropical (11%) (1), and these are also the forests experiencing most deforestation. Globally, annual net forest loss dropped by 20% (10 million ha) in 2015–2020 compared to 2010–2015 (12 million ha). Despite this decline in global forest loss, forest area is still decreasing (3): Africa had the largest forest loss in 2010–2020 (3.9 million ha), followed by South America (2.6 million ha) (1).
Tropical forest loss is associated with human activities that continuously threaten these ecosystems, from ranching to infrastructure expansion, causing biodiversity loss and decreased soil and water protection. Although the globally burnt area declined between 1998 and 2015, increases in fire frequency and intensity make this driver of forest conversion and degradation crucial to understanding deforestation (4). While this reduction in burned area (BA) was mainly associated with tropical savannas and grasslands (5), the global BA has shifted to regions with more tree cover: closed canopy forests. This shift has been traced to the use of fire for deforestation and agricultural management in the tropics (5). As a result, from 2001 to 2015, wildfires contributed to 23% (± 4%) of forest loss (4) and a carbon emission of 454 ± 496 Tg CO2 year−1 worldwide (6).
Fire can be essential to many ecosystems globally, as it consistently influences ecosystems along multiple dimensions ranging from physicochemical properties to biotic patterns and processes (7). Since fire can also cause critical shifts, it has been identified as a prevalent forest disturbance in the tropics causing forest degradation (1, 8). Increasingly, many drivers of land use change interact and operate synergistically (9) and quickly (3). Global warming caused by climate change increases forest vulnerability to fire through different pathways. First, global warming alters fire regimes by increasing the duration, frequency, and intensity of the dry season. These climatic alterations are strongly related to the El Niño-Southern Oscillation and ocean-surface temperature anomalies (10), directly increasing the occurrence of wildfires and subsequent forest die-offs (11). Second, extreme events such as droughts cause larger, more frequent, intense, and severe fires resulting in higher carbon emissions per burned unit area (11). Droughts increase forest inflammability (12) through fuel accumulation on the forest floor or increases in the air temperature. The interaction of climate change with natural topography and wind conditions, as well as other anthropogenic activities, can then result in severe and extended fires, further affecting large forest areas and reducing forest carbon storage (11–13). Fire-induced forest degradation in tropical regions can represent close to 69% of their total carbon lost (14). Together, deforestation and degradation of forests in the American tropics have led to losses of approximately 516 ± 69.5 Tg C year−1 (14), indicating that most losses are associated with fires.
Latin American forests are of planetary importance, with South America alone holding 21% of the world’s remaining forests (15). While both forest cover and naturally regenerating forest area have declined in South America since the 1990s (1) resulting in 7% of regional forests lost in under 15 years (1990–2005) (16), these dynamics prevail across rainforests worldwide (17). Over the past decade, and thanks to Brazil’s ability to reduce Amazon Basin deforestation rates (17), forest loss in the Amazon declined from peaks in the 2000s. However, political and economic moves to undermine forest conservation in Brazil have since brought back massive deforestation in both “legal Amazonia” and elsewhere in the basin (18).
In the Amazon, forest degradation from the extraction of forest resources (19) is leading to major forest and biodiversity loss. A number of factors drive land use change, but conversion of forests to pastures for cattle ranching and agriculture is prevalent in Latin America (9). Bolivia, Peru (20), and Colombia (21) follow the Brazilian pattern, wherein most forest loss is caused by agricultural expansion (20). Fire is routinely used to convert forests to agricultural uses and has been identified as a direct driver of deforestation in the region (22). Fires used for clearing vegetation or burning agricultural fields or pastures often result in unintended wildfires that spread into adjacent forests, degrading them (23). Once the agricultural frontier consolidates, fire activity tends to decline (24), but the cycle of colonization and consolidation spills into nearby forests where pastures and crops will then be established, with subsequent deforestation and expanding fire-related degradation. Wildfires, in turn, interact with other drivers of tropical forest loss such as fragmentation (25), selective logging, or even policy changes (26) that, through complex feedbacks, increase the vulnerability of remaining forests to further degradation. Thus, exposure and altered microclimates in forest edges result in increases in forest fire occurrence, magnifying subsequent impacts (27).
Already altered tropical forests are less resistant to climate change and human activity (13). Once disturbed, forests are even more vulnerable to other disturbances and subsequent fires (6). Increased susceptibility of tropical forests to fires has resulted in a spike in fire-related loss, but remaining forests have also become more vulnerable to fire under drier conditions (3). Forests in South America are predicted to have low resilience, particularly in areas with a high risk of future droughts (28). Forest fire studies often focus on measuring forest area burnt (29) or its effect on carbon cycling and atmospheric emissions (30). Yet, few studies have analyzed the vulnerability of forests to increased frequency of fires, and those available are largely based on local observations (31). Systematic analyses of fire-associated forest loss, examining forest trajectories under changing fire frequency, can help disentangle the mechanisms determining forest degradation and examine forest capacity for resilience. Here, we address three key questions. First, what proportion of 2001 Latin America forests, including but not limited to the Amazon region, burned in 2002/2003? Second, what are the trajectories of postfire change in those burnt forests? Third, how does fire frequency influence those trajectories? We draw on advances in remote sensing to discover forest areas affected by fire in 2002/2003 and follow their land cover trajectory up to 2018, providing methods to account for the role of fire frequency on forest conversion in Latin America and beyond. Specifically, we analyzed data for forests in 2001 using previously published moderate resolution imaging spectroradiometer (MODIS) land cover and burnt area datasets (32), assessing how fire frequency influenced forest conversion and modeling land cover trajectories in the region.
RESULTS
Area burned (2002/2003)
Latin America had 7,781,832 km2 of forests in 2001 (Fig. 1A), mostly evergreen forests (EF; 7,194,695 km2), deciduous broadleaf (DB; 446,212 km2), and mixed forests (MF; 140,925 km2). The total land area burned in 2002/2003 was 84,451,200 ha, of which more than half was savannas [45.56% savannas and 8% woody savannas (WS)], followed by grasslands (26.64%) and 10.65% forests. In response to our first question, a total of 8,465,800 ha of 2001 forests were affected by fire in 2002/2003, so 1.09% of Latin American forests were burned that period. A 74.4% of the affected forest were EF (6,298,100 ha), followed by a 23.4% of DB forests (1,977,100 ha) and the rest corresponded to MF (190,500 ha). The forests burned represented ~1.09% of all Latin American forests in 2001.
Fig. 1. The magnitude of burning occurrences per land cover in Latin America.
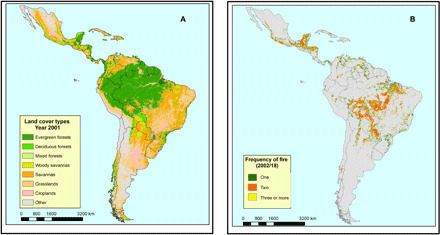
Distribution of (A) land cover types in Latin America and (B) selected forest pixels with fire frequency between 2002/2018 (one, two, and three or more occurrences).
Globally, Brazil has the largest extension of forest and had the most forest area affected in 2002/03 with 4,695,775 ha of forest affected by fires (1.2% of total forest present in 2001). Similarly, in Bolivia, 1,431,325 ha of 2001 forests were burnt (2.6% of total forest) while in Mexico with 983,325 ha burnt (3.4% of total forest in 2001). Paraguay (8.4%), Guatemala (7.8%), and Honduras (6.1%) had less total area affected but a greater proportion of their forest burned (table S1).
Frequency of fire (2002/2018)
Approximately 40% of forests pixels that burned in 2002/2003 (3,393,250 ha; Fig. 1B) then did not undergo any other fire event in the following 15 years (i.e., fire frequency of one up to 2018). Around 1,885,675 ha (22.4% of the forests affected in 2002/2003) experienced a second fire (Fig. 1B), and the remaining 3,186,925 ha (37.6%) underwent three or more fires up to 2018 (Fig. 1B).
Of the forest pixels burned only once, 81.9% (i.e., 2,777,675 ha) were EF, and 16.8% (570,925 ha) and the rest 1.3% (44,650 ha) were MF. Those forest pixels burnt twice corresponded to 77.8% (i.e., 1,466,625 ha) were EF, and 20.3% (382,275 ha) and the rest 2% (36,775 ha) were MF. Those pixels burnt thrice, 66.4% (i.e., 2,052,375 ha) were EF, and 32.1% (1,023,775 ha) and the rest 3.4% (109,150 ha) were MF (Table 1).
Table 1. Area of forest burnt in 2002/2003 per forest cover type and fire frequency.
| Burned once | Burned twice | Burned thrice | |
| Total forest (ha) | 3,393,250 | 1,885,675 | 3,185,300 |
| EF | 81.9% | 77.8% | 64.4% |
| (ha) | 2,777,675 | 1,466,625 | 2,052,375 |
| DB forests | 16.8% | 20.3% | 32.1% |
| (ha) | 570,925 | 382,275 | 1,023,775 |
| MF | 1.3% | 2% | 3.4% |
| (ha) | 44,650 | 36,775 | 109,150 |
Proportion of land cover types and trajectories of postfire change
Overall, and in response to our second question, the trend of forest loss over time is clear, forests are mostly replaced by savannas and grasslands. Both regional and cross-country trajectories of postfire changes indicate that in all cases, even after being burnt only once and following the initial loss in forest cover of 2001, there is a general declining trend of proportion of forest cover over later years. However, there is some variation in temporal patterns (fig. S1). For some countries, forest loss trajectories after fire are faster in the years immediately after the 2002/2003 fire. While Argentina, Brazil, Chile, Guyana, and Panama had rapid losses, Mexico, Guatemala, Honduras, and Venezuela had slower declines in the proportion of forest cover over the years (fig. S1). In Chile, forest recovered after 2004, for Surinam regrowth followed 2009, and Colombia had a small increase in forest cover after 2017.
In response to our third research question, the overall proportion of forest loss varies considerably with changing fire frequency (Fig. 2). For forest pixels undergoing only one fire, the proportion of forests is reduced to 74% by 2004, the year after the initial fire. This reduction in the proportion of forest is more evident for EF, which reduced their proportion to 58.8% by 2004 and further to 43.5% by 2018. In forests that burned twice during the period of analysis, the proportion of forests reduces initially to 66.4% by 2004, and again, EF fall from to 47.8% by 2004 and further to 26.7% by 2018. These trajectories are more marked in those forests burned thrice or more: A mere 14% of those EF remain by 2018.
Fig. 2. Proportion (%) of land cover types over time per fire frequency.
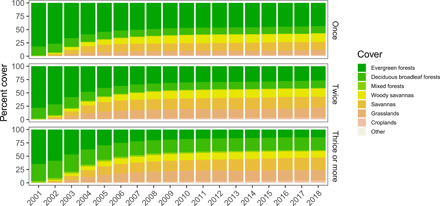
One fire (top), two fires (middle), and three or more fires (bottom) in the period 2002–2018.
Land cover type changes per fire frequency
Greater fire frequency undermines forest persistence from 2001 to 2018 (Fig. 3). Although most forest loss concentrates in the 2001–2004 period in all cases, subsequent years also show continuous forest loss over time. Detailed analyses of pixel fate through time show a large portion of burnt 2001 forest converts to other nonforest land cover types. This pattern especially holds for EF, the forest type comprising the largest area burnt.
Fig. 3. Land cover type trajectories between 2001 and 2018 for forests with frequency of one, two, or three or more fire events.
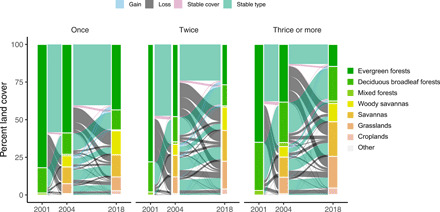
The width of the land cover type bar in each case represents the proportion of the total forest area burnt. The color of the trajectories indicates whether the land cover type changes to another land cover type (gray), maintains stable (green), the forest type changes but forest cover remained (pink), or the change indicates some recovery (blue).
For EF burned once (2,777,675 ha), 27.3% (759,261 ha) was lost between the 2001 and 2004, just after fire, and a further 21% (581,830 ha) of the 2001 EF area was lost between 2004 and 2018. The trajectory of loss reflects conversion mostly to WS, savannas, and grasslands, with most 2001–2004 forest conversion to savannas (11.93%), while for the 2004–2018, remaining EF were lost to WS (16.5%). Patterns of forest loss and land cover type conversion for forest with higher fire frequencies reveal even more marked losses, with lower proportions of forest remaining stable at greater fire frequency.
Within region and cross-country variation
A general pattern of loss of forest cover after fire is found in all countries (Fig. 4). Belize had the highest forest persistence. In contrast, Paraguay, Panama, and Brazil had higher proportions of forest loss following fire. For EF, Chile and Belize had the highest forest persistence (83.9 and 82.5%, respectively). Panama (64.7%), Paraguay (61.5%), and Brazil (56.6%) showed a relatively high proportion of EF conversion to other land cover types (Fig. 4 and table S2). In Panama, EF converted mostly to savannas (48.6% WS, 11.6% S), as was the case in Paraguay (33.8% S, 11.6% WS). Brazil EF converted to both savannas (23.4% S, 12.5% WS) and grasslands (15.9%). While EF in Bolivia persisted at high proportion (70.7%), they also experienced the highest conversion to croplands of all countries, at 5.5%, followed by Brazil (3.5%) and Paraguay (3.1%).
Fig. 4. Land cover type trajectories in each country between 2001 and 2018 for forests with frequency of one, two, or three or more fire events.
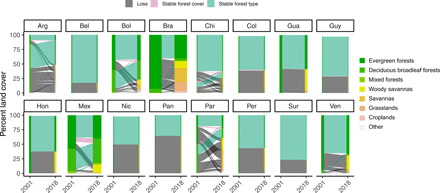
The width of the land cover type bar in each case represents the proportion of the total forest area burnt, with all countries but Brazil magnified by a factor of 2. The color of the trajectories indicates whether the land cover type changes to another land cover type (gray), maintains stable (green), or the forest type changes but forest cover remains (pink).
For DB forests, Chile (78.9%) and Paraguay (68%) had higher forest conversion rate to other land cover types. Chile’s DB converted, to a great extent, to croplands (26.8%), savannas (22.1% S, 11.3% WS), and grasslands (11.3%). Argentina’s DB forests followed Chile’s conversion to croplands with 17.6% of the forests affected by fire in 2001. Mexico and Bolivia’s DB forests, on the other hand, persisted better after fire (88.7 and 80.3%). MF persisted better in Mexico (56%) and Chile (38.4%), but the Chile case also changed a high proportion of these to grasslands (19.5%). Argentina’s MF converted mostly to grasslands (68.2%) and savannas (15.9% WS, 6.8% S).
Modeled influence of starting cover type and country
To model the varying trajectories of the single-fire pixels and quantitatively answer our second question, we adopted a hierarchical Bayesian approach to estimate the frequency of changes from various forest cover types while accounting for country-specific variation in both the total pixels and the proportion of forest types burnt. All models converged, yielding posterior effective sampling sizes >200 for all parameters. Deviation information criterion (DIC) comparisons (table S3) showed transition types differ (i.e., the best fit model included interactions between start and end land covers). Country-specific effects were allowed to vary such that country identity explained different amounts of variation depending on the starting forest type and initial forest cover types covary to different degrees. Sample-wide coefficients for this model (Fig. 5) reflect starkly varying transition frequencies after accounting for country-specific variation in initial forest cover type burned (fig. S2). Full model parameters are summarized in table S4.
Fig. 5. Posterior distribution of sample-wide coefficients on transition frequencies for the single fire data.
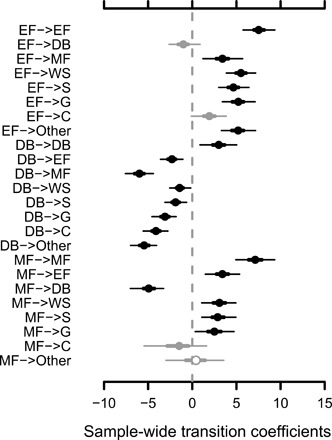
Posterior distributions whose 95% credible intervals do not overlap with 0 are shown in black, in gray those whose 50% credible intervals do not overlap with 0.
DISCUSSION
Blazing for weeks and emitting smoke that reached as far as São Paulo, the 2019 fires in the Brazilian Amazon highlighted the importance of anthropogenic fires in forest loss on a planetary scale. Our results reveal less marked, but similarly consequential, fire events have shaped forest conversion across Latin America in the Amazon and beyond over the past two decades. These hitherto underexplored events both reinforce the links between fire and forest loss and reveal the vast negative impacts that fire exerts over Latin American forests. While contributions to carbon emissions are often highlighted, fire-sensitive EF were most affected, and species therein lack adaptations to tolerate fires (12, 33). Thus, fires that obliterated half the affected forests over the past two decades have impacts far beyond biomass loss (34), threatening species, phylogenetic, and functional diversity.
Shockingly, a single fire event can set the stage for a massive proportion of forest loss and its conversion into other uses. This association may indicate that fires are agents of loss (i.e., humans use fire to deforest), a common cause drives more fires and deforestation (e.g., climate change makes wildfires more common and people opportunistically deforest the burnt area), or some combination of both. Previous studies of postfire vegetation dynamics have found most South American forests can be severely affected by single fires and therefore recover only very slowly, requiring up to two decades to grow back (35). While statistical analyses confirm persistence is frequent enough after a single fire (Fig. 5), conversion to various nonforest cover types is at least as frequent, particularly for EF and MF. This high variability in the frequency of transitions, together with among-country differences in the types of forests initially burnt (fig. S2), suggests fire is used in country-specific ways. Nevertheless, fire generally leads to cleared forests instead of to other forest cover types. We acknowledge that burnt forests that end up being deforested could result from several confounding effects that drive fire frequency and vary regionally such as biomass, ignition season, and length of dry season. Yet, our results highlight the markedly increased threat of fires to Latin American forests: Even a single fire—we cannot ascertain whether used as a human tool or wildfire—coincides with widespread conversion to other uses. Despite forest persistence, areas that burned are also as likely to become deforested as not (Fig. 3) (36).
Our analyses reveal how fire promotes the degradation of forest into savannas and grasslands. Although the land cover types we analyzed cannot determine whether particular covers result from human use, resulting savannas are primarily degraded forests with less tree cover, instead of old-growth savannas, and grass-dominated vegetation in many cases reflects conversion to pastures for livestock grazing and not natural grasslands (37). Forest-to-savanna land cover type transitions were indeed frequent, with transitions to crops at much lower frequency, at least at this spatial scale (Fig. 5). Instead of smooth transitions to savannas and prairies, these were abrupt, directly following fires in EF and DB forests (Fig. 3). These sharp transitions are both a response from fire-vulnerable species (12) and the result of altered fire regimes (28) and conversion to pastures (38). Burned tropical forest can become highly degraded systems and, in some cases, experience a transformation to human-derived savannas or other anthropogenic and novel ecosystems (37). Further, positive feedbacks between climate change and human activities then change the structural and compositional trajectories of forest succession, driving further forest conversion and increasing fire probabilities at broader scales (39). After forests burn, the recovering vegetation can become more vulnerable to climate variation and surrounding pressures. For example, at the community level, forests in postfire recovery stage comprise fast-growing pioneer species, typical in early successional stages, which can increase drought susceptibility, thus increasing fuel accumulation and vulnerability to fire (40).
Although fragmentation-fire feedbacks were not directly examined here, fragmented forests are more exposed to anthropogenic fires (39). Edges created by fragmentation favor hostile climatic conditions that influence vegetation regeneration and persistence (40). Since fragmented forests have higher edge-to-core ratio, they are more vulnerable to fire intrusion, and further synergies between fragmentation and fire ensue (12, 25, 41). Together with shifts in community composition, these physical changes make subsequent fires burn hotter and longer than in intact forests. Our analyses uncovered repeated fires are a powerful determinant of forest conversion and there is greater forest loss with higher fire frequency: After 16 years, forests affected by more than one fire seldom returned to their initial forest cover type.
We discovered fire-associated forest devastation on a previously unknown scale. However, forest loss is not subject to purely physical or ecological dynamics in isolation. Instead, synergies among all drivers—climate change, land use, increasing drought intensity and frequency, deforestation, and its associated wildfires—can further reduce forests areas, compromising carbon reserves (12). Since the extent of forest loss following even one fire event is vast, our research emphasizes the importance of committing to an urgent reduction of forest fires from any cause to conserve Latin American forests. Given the broader patterns of massive change found in the region, renewed regional efforts are urgent to stop irreversible forest change of epochal planetary consequences.
MATERIALS AND METHODS
The study region encompasses Latin America, from Mexico in the north to Chile and Argentina in the south, with tropical, subtropical, and some temperate forests. We included 25 countries.
We used Google Earth Engine (GEE) (42), a cloud-based platform that facilitates access to high-performance computing resources to access and collect base information from the MCD64A1 MODIS burnt area product (43) and MCD12Q1 MODIS yearly land cover type (32). Both datasets have a spatial resolution of 500 m. MCD64A1 has been found to be the most accurate of six different global BA datasets (44–46), is widely used for the regional and global impact of fire (47), and forms the basis for the Global Fire Atlas (47). Several studies have also indicated that this BA product has substantial improvements compared to the previous generation of global-scale medium-resolution BA products (48–50). Using the BA information as a baseline, we built different image collections from 2001 since this is the first year of MCD64A1 burned data available using date filters and reclassifications to reduce the size of the collections and in preparation for spatial operations. We calculated the fire frequency from 2002 for all pixels that burned in the 2002–2003 period. Neither 2002 nor 2003 experienced anomalous climate.
Here, we used the “Cover Type 1” band from the MCD12Q1 MODIS product that refers to a classification of land cover types using the IGBP (International Geosphere-Biosphere Program) methodology. This product has been widely used as a reference to obtain land cover data (45); to study relationships between BA, forest loss, and cover changes (51); to analyze the relationship between climate change, fires, and changes in vegetation (52); or to analyze BA in relation to cover types for the Global Fire Atlas (47). We reclassified the original category into 8 new land cover types by maintaining some of the 17 original land cover types: DB forests (type 4, defined as forest cover dominated by DB trees with canopy >2 m and tree cover >60%), MF [type 5, defined as forests dominated by neither deciduous nor evergreen (40 to 60% of each) tree type (canopy >2 m) and tree cover >60%], WS [type 8, areas with tree cover 30 to 60% (canopy >2 m)] and savannas (S; type 9, defined as areas with tree cover 10 to 30% (canopy >2 m)], grasslands [type 10, dominated by herbaceous annuals (<2 m)], or croplands (type 12, pixels with at least 60% of area is cultivated cropland). One key limitation of this classification is the inability to discern human use for grass-dominated vegetation, as natural grasslands and pastures (with anthropogenic use) are merged for the grassland land cover.
Given the small extension of the evergreen needleleaf forests (original type 1) in the region, we merged these with evergreen broadleaf forests (original type 2) into one single category of EF, and lastly, we merged all other categories into a new category named “others.” The MODIS land cover type dataset has annual information, from which annual rasters were extracted for the region and countries of Latin America and the Caribbean.
Combining both datasets from the burnt datasets, we extracted all pixels that were forests in 2001. To select only forests affected by fire after 2001, we removed from the analysis the 544,425 ha of forests area that were identified as also burnt in 2001. Therefore, the sampled pixels complied with two conditions: (i) They had to have had forests cover in 2001, and (ii) of those forests, only if burnt in 2002/2003 were included in our database for analysis. All images were built using GEE were exported to Google Drive for further processing.
We analyzed these datasets using ArcGIS (ESRI) and R statistical software package RStudio with raster-based zonal statistics. We calculated change trajectories defined as sequences of successive conversion of land cover types that provided information on changes between two or more periods of time. We focus on 2001/2004 changes to assess immediate postfire forest cover type changes since our sampled pixels consisted only of forests burnt in 2002/2003. For the 2004/2018 period, after forest conversion to other land cover types, the starting point for analysis does contain all land cover types, including those remaining as forests and we also follow their trajectory of all over time. To summarize the results, we use alluvial charts and include four trajectory classes of stable forest type (when forest type remains the same between periods), stable forest cover (when a specific forest type changed to other type but remain as a forest), loss (when forest cover type is transformed to other nonforest land cover), and gain (for cases where forest cover type is recovered). These visualizations where repeated for all forest pixels with frequency of two or three and more fires over the period of study.
The political administrative limits provided the spatial bases for the extraction and quantification of yearly datasets per forest type, fire frequency, and region or country. Only countries with more than 5000 ha of forests affected by fires in 2002/2003 were included in country analyses.
We adopted a hierarchical Bayesian approach to estimate changes from various forest cover types while accounting for country-specific variation in both the total pixels and the proportion of forest types burnt. These models were applied for the single fire dataset, with burned pixel counts as the response variable and the starting forest type, final cover type, and country as categorical explanatory variables. We generated a series of Poisson-distributed models with increasingly complex hierarchical structures using the R package MCMCglmm (53). In a hierarchical model, the variance explained by the predictors can be modeled as applying to the entire sample (often called “fixed”) or only to certain groups [often called “random” (54)]. Besides the advantages of accounting for overdispersion in real data relative to the Poisson distribution and being able to estimate group-specific coefficients (e.g., for country effects), the Bayesian approach also allowed for different levels of variation and covariation in group-specific effects (e.g., EF is present in all countries, but DB and MF are not and so the latter two categories have greater variance). Thus, the simplest model had three categorical predictors as sample-wide regressors and no group-specific coefficients, while the most complex model included country-specific effects allowed to vary depending on the starting forest type and covary between pairs of starting forest types to different degrees. Depending on model complexity, models ran for 100,000 to 2 million iterations sampling every 100 to 1000 iterations in the chain and discarding the first half of all iterations as burn-in. The DIC, with lower values corresponding to better fit, was used to evaluate model fit to the data.
Acknowledgments
Funding: NAS Subaward Letters nos. 2000007526 and 2000010972 awarded to D.A. The Chilean National of Scientific and Technological Research (CONICYT) with Project Formación de Redes Internacionales para Investigadores en Etapa Inicial N° REDI170329 awarded to A.H.-M. L.M.D. was supported in part by NSF-DGE 1633299. Author contributions: D.A. designed research; D.A., A.M., and J.S.B. performed research and data analysis; L.M.D. conducted visualizations and Bayesian models; D.A., A.M., J.S.B., A.H.-M., C.Z.-E., T.M.G.-D., M.C.M, L.M.D., and J.R. analyzed the results; and D.A. wrote the paper with inputs from T.M.G-D., L.M.D., and J.R. All authors revised and approved the final text. Competing interests: The authors declare that they have no competing interests. Data and materials availability: All data needed to evaluate the conclusions in the paper are present in the paper and/or the Supplementary Materials. R codes for Alluvial Graph figures and Bayesian models are available at Dryad, Dataset, https://doi.org/10.5061/dryad.9cnp5hqh6.
SUPPLEMENTARY MATERIALS
Supplementary material for this article is available at http://advances.sciencemag.org/cgi/content/full/7/33/eabd3357/DC1
REFERENCES AND NOTES
- 1.Food and Agriculture Organization of the United Nations (FAO), Global Forest Resources Assessment (Food and Agriculture Organization, 2020). [Google Scholar]
- 2.Foley J. A., Defries R., Asner G. P., Barford C., Bonan G., Carpenter S. R., Chapin F. S., Coe M. T., Daily G. C., Gibbs H. K., Helkowski J. H., Holloway T., Howard E. A., Kucharik C. J., Monfreda C., Patz J. A., Prentice I. C., Ramankutty N., Snyder P. K., Global consequences of land use. Science 309, 570–574 (2005). [DOI] [PubMed] [Google Scholar]
- 3.Seymour F., Harris N. L., Reducing tropical deforestation. Science 365, 756–757 (2019). [DOI] [PubMed] [Google Scholar]
- 4.Curtis P. G., Slay C. M., Harris N. L., Tyukavina A., Hansen M. C., Classifying drivers of global forest loss. Science 361, 1108–1111 (2018). [DOI] [PubMed] [Google Scholar]
- 5.Andela N., Morton D. C., Giglio L., Chen Y., van der Werf G. R., Kasibhatla P. S., DeFries R. S., Collatz G. J., Hantson S., Kloster S., Bachelet D., Forrest M., Lasslop G., Li F., Mangeon S., Melton J. R., Yue C., Randerson J. T., A human-driven decline in global burned area. Science 356, 1356–1362 (2017). [DOI] [PMC free article] [PubMed] [Google Scholar]
- 6.Aragão L. E. O. C., Anderson L. O., Fonseca M. G., Rosan T. M., Vedovato L. B., Wagner F. H., Silva C. V. J., Silva Junior C. H. L., Arai E., Aguiar A. P., Barlow J., Berenguer E., Deeter M. N., Domingues L. G., Gatti L., Gloor M., Malhi Y., Marengo J. A., Miller J. B., Phillips O. L., Saatchi S., 21st Century drought-related fires counteract the decline of Amazon deforestation carbon emissions. Nat. Commun. 9, 536 (2018). [DOI] [PMC free article] [PubMed] [Google Scholar]
- 7.Bowman D. M. J. S., Balch J. K., Artaxo P., Bond W. J., Carlson J. M., Cochrane M. A., D’Antonio C. M., Defries R. S., Doyle J. C., Harrison S. P., Johnston F. H., Keeley J. E., Krawchuk M. A., Kull C. A., Marston J. B., Moritz M. A., Prentice I. C., Roos C. I., Scott A. C., Swetnam T. W., van der Werf G. R., Pyne S. J., Fire in the earth system. Science 324, 481–484 (2009). [DOI] [PubMed] [Google Scholar]
- 8.M. A. Cochrane, Tropical Fire Ecology (Springer, 2009). [Google Scholar]
- 9.Hosonuma N., Herold M., de Sy V., de Fries R. S., Brockhaus M., Verchot L., Angelsen A., Romijn E., An assessment of deforestation and forest degradation drivers in developing countries. Environ. Res. Lett. 7, 44009 (2012). [Google Scholar]
- 10.Chen Y., Randerson J. T., Morton D. C., DeFries R. S., Collatz G. J., Kasibhatla P. S., Giglio L., Jin Y., Marlier M. E., Forecasting fire season severity in South America using sea surface temperature anomalies. Science 334, 787–791 (2011). [DOI] [PubMed] [Google Scholar]
- 11.De Faria B. L., Brando P. M., Macedo M. N., Panday P. K., Soares-Filho B. S., Coe M. T., Current and future patterns of fire-induced forest degradation in Amazonia. Environ. Res. Lett. 12, 095005 (2017). [Google Scholar]
- 12.Brando P. M., Paolucci L., Ummenhofer C. C., Ordway E. M., Hartmann H., Cattau M. E., Rattis L., Medjibe V., Coe M. T., Balch J., Droughts, wildfires, and forest carbon cycling: A pantropical synthesis. Annu. Rev. Earth Planet. Sci. 47, 555–581 (2019). [Google Scholar]
- 13.Buma B., Disturbance interactions: Characterization, prediction, and the potential for cascading effects. Ecosphere 6, 1–15 (2015). [Google Scholar]
- 14.Baccini A., Walker W., Carvalho L., Farina M., Sulla-Menashe D., Houghton R. A., Tropical forests are a net carbon source based on aboveground measurements of gain and loss. Science 358, 230–234 (2017). [DOI] [PubMed] [Google Scholar]
- 15.Keenan R. J., Reams G. A., Achard F., de Freitas J. V., Grainger A., Lindquist E., Dynamics of global forest area: Results from the FAO Global Forest Resources Assessment 2015. For. Ecol. Manage. 352, 9–20 (2015). [Google Scholar]
- 16.Da Ponte E., Fleckenstein M., Leinenkugel P., Parker A., Oppelt N., Kuenzer C., Tropical forest cover dynamics for Latin America using Earth observation data: A review covering the continental, regional, and local scale. Int. J. Remote Sens. 36, 3196–3242 (2015). [Google Scholar]
- 17.Hansen M. C., Potapov P. V., Moore R., Hancher M., Turubanova S. A., Tyukavina A., Thau D., Stehman S. V., Goetz S. J., Loveland T. R., Kommareddy A., Egorov A., Chini L., Justice C. O., Townshend J. R. G., High-resolution global maps of 21st-century forest cover change. Science 342, 850–853 (2013). [DOI] [PubMed] [Google Scholar]
- 18.Armenteras D., Schneider L., Dávalos L. M., Fires in protected areas reveal unforeseen costs of Colombian peace. Nat. Ecol. Evol. 3, 20–23 (2019). [DOI] [PubMed] [Google Scholar]
- 19.Bullock E. L., Woodcock C. E., Souza C., Olofsson P., Satellite-based estimates reveal widespread forest degradation in the Amazon. Glob. Chang. Biol. 26, 2956–2969 (2020). [DOI] [PubMed] [Google Scholar]
- 20.Kalamandeen M., Gloor E., Mitchard E., Quincey D., Ziv G., Spracklen D., Spracklen B., Adami M., Aragão L. E. O. C., Galbraith D., Pervasive rise of small-scale deforestation in Amazonia. Sci. Rep. 8, 1600 (2018). [DOI] [PMC free article] [PubMed] [Google Scholar]
- 21.Armenteras D., Negret P., Melgarejo L. F., Lakes T. M., Londoño M. C., García J., Krueger T., Baumann M., Davalos L. M., Curb land grabbing to save the Amazon. Nat. Ecol. Evol. 3, 1497–1497 (2019). [DOI] [PubMed] [Google Scholar]
- 22.Davidson E. A., de Araújo A. C., Artaxo P., Balch J. K., Brown I. F., Bustamante M. M. C., Coe M. T., DeFries R. S., Keller M., Longo M., Munger J. W., Schroeder W., Soares-Filho B. S., Souza C. M. Jr., Wofsy S. C., The Amazon basin in transition. Nature 481, 321–328 (2012). [DOI] [PubMed] [Google Scholar]
- 23.Aragão L. E. O. C., Shimabukuro Y. E., The incidence of fire in Amazonian forests with implications for REDD. Science 328, 1275–1278 (2010). [DOI] [PubMed] [Google Scholar]
- 24.Brando P. M., Silvério D., Maracahipes-Santos L., Oliveira-Santos C., Levick S. R., Coe M. T., Migliavacca M., Balch J. K., Macedo M. N., Nepstad D. C., Maracahipes L., Davidson E., Asner G., Kolle O., Trumbore S., Prolonged tropical forest degradation due to compounding disturbances: Implications for CO2 and H2O fluxes. Glob. Chang. Biol. 25, 2855–2868 (2019). [DOI] [PubMed] [Google Scholar]
- 25.Armenteras D., González T. M., Retana J., Forest fragmentation and edge influence on fire occurrence and intensity under different management types in Amazon forests. Biol. Conserv. 159, 73–79 (2013). [Google Scholar]
- 26.Escobar H., Bolsonaro’s first moves have Brazilian scientists worried. Science 363, 330–330 (2019). [DOI] [PubMed] [Google Scholar]
- 27.Nogueira D. S., Marimon B. S., Marimon-Junior B. H., Oliveira E. A., Morandi P., Reis S. M., Elias F., Neves E. C., Feldpausch T. R., Lloyd J., Phillips O. L., Impacts of fire on forest biomass dynamics at the southern amazon edge. Environ. Conserv. 46, 285–292 (2019). [Google Scholar]
- 28.Hirota M., Holmgren M., Van Nes E. H., Scheffer M., Global resilience of tropical forest and savanna to critical transitions. Science 334, 232–235 (2011). [DOI] [PubMed] [Google Scholar]
- 29.Liu Z., Ballantyne A. P., Cooper L. A., Biophysical feedback of global forest fires on surface temperature. Nat. Commun. 10, 214 (2019). [DOI] [PMC free article] [PubMed] [Google Scholar]
- 30.van der Werf G. R., Randerson J. T., Giglio L., Collatz G. J., Mu M., Kasibhatla P. S., Morton D. C., DeFries R. S., Jin Y., van Leeuwen T. T., Global fire emissions and the contribution of deforestation, savanna, forest, agricultural, and peat fires (1997–2009). Atmos. Chem. Phys. Discuss. 10, 16153–16230 (2010). [Google Scholar]
- 31.Alencar A. A., Brando P. M., Asner G. P., Putz F. E., Landscape fragmentation, severe drought, and the new Amazon forest fire regime. Ecol. Appl. 25, 1493–1505 (2015). [DOI] [PubMed] [Google Scholar]
- 32.M. Friedl, D. Sulla-Menashe, MCD12Q1 MODIS/Terra+Aqua Land Cover Type Yearly L3 Global 500m SIN Grid V006 [Data set] (NASA EOSDIS Land Processes DAAC, 2019); 10.5067/MODIS/MCD12Q1.006. [DOI]
- 33.Nóbrega C. C., Brando P. M., Silvério D. V., Maracahipes L., de Marco P., Effects of experimental fires on the phylogenetic and functional diversity of woody species in a neotropical forest. For. Ecol. Manage. 450, 117497 (2019). [Google Scholar]
- 34.Barlow J., Peres C. A., Lagan B. O., Haugaasen T., Large tree mortality and the decline of forest biomass following Amazonian wildfires. Ecol. Lett. 6, 6–8 (2002). [Google Scholar]
- 35.Zhou L., Wang Y., Chi Y., Wang S., Wang Q., Contrasting post-fire dynamics between Africa and South America based on MODIS observations. Remote Sens. 11, 1074 (2019). [Google Scholar]
- 36.Curtis P. G., Slay C. M., Harris N. L., Tyukavina A., Hansen M. C., Supplementary Materials: Classifying drivers of global forest loss. Science 361, 1108–1111 (2018). [DOI] [PubMed] [Google Scholar]
- 37.Veldman J. W., Buisson E., Durigan G., Fernandes G. W., le Stradic S., Mahy G., Negreiros D., Overbeck G. E., Veldman R. G., Zaloumis N. P., Putz F. E., Bond W. J., Toward an old-growth concept for grasslands, savannas, and woodlands. Front. Ecol. Environ. 13, 154–162 (2015). [Google Scholar]
- 38.Tyukavina A., Hansen M. C., Potapov P. V., Stehman S. V., Smith-Rodriguez K., Okpa C., Aguilar R., Types and rates of forest disturbance in Brazilian Legal Amazon, 2000–2013. Sci. Adv. 3, e1601047 (2017). [DOI] [PMC free article] [PubMed] [Google Scholar]
- 39.Cochrane M. A., Fire science for rainforests. Nature 421, 913–919 (2003). [DOI] [PubMed] [Google Scholar]
- 40.Uriarte M., Schwartz N., Powers J. S., Marín-Spiotta E., Liao W., Werden L. K., Impacts of climate variability on tree demography in second growth tropical forests: The importance of regional context for predicting successional trajectories. Biotropica 48, 780–797 (2016). [Google Scholar]
- 41.Cochrane M. A., Synergistic interactions between habitat fragmentation and fire in evergreen tropical forests. Conserv. Biol. 15, 1515–1521 (2001). [Google Scholar]
- 42.Gorelick N., Hancher M., Dixon M., Ilyushchenko S., Thau D., Moore R., Google Earth Engine: Planetary-scale geospatial analysis for everyone. Remote Sens. Environ. 202, 18–27 (2017). [Google Scholar]
- 43.Giglio, L., C. Justice, L. Boschetti, D. Roy, MCD64A1 MODIS/Terra+Aqua Burned Area Monthly L3 Global 500m SIN Grid V006 [Data set] (NASA EOSDIS Land Processes DAAC, 2015).
- 44.Padilla M., Stehman S. V., Ramo R., Corti D., Hantson S., Oliva P., Alonso-Canas I., Bradley A. V., Tansey K., Mota B., Pereira J. M., Chuvieco E., Comparing the accuracies of remote sensing global burned area products using stratified random sampling and estimation. Remote Sens. Environ. 160, 114–121 (2015). [Google Scholar]
- 45.Fornacca D., Ren G., Xiao W., Performance of three MODIS fire products (MCD45A1, MCD64A1, MCD14ML), and ESA Fire_CCI in a mountainous area of Northwest Yunnan, China, characterized by frequent small fires. Remote Sens. (Basel) 9, 1131 (2017). [Google Scholar]
- 46.Quintero N., Viedma O., Urbieta I. R., Moreno J. M., Assessing landscape fire hazard by multitemporal automatic classification of landsat time series using the Google Earth Engine in West-Central Spain. Forests 10, 518 (2019). [Google Scholar]
- 47.Andela N., Morton D. C., Giglio L., Paugman R., Chen Y., Hantson S., van der Werf G. R., Randerson J. T., The Global Fire Atlas of individual fire size, duration, speed, and direction. Earth Syst. Sci. Data 11, 529–552 (2019). [Google Scholar]
- 48.Giglio L., Boschetti L., Roy D. P., Humber M. L., Justice C. O., The Collection 6 MODIS burned area mapping algorithm and product. Remote Sens. Environ. 217, 72–85 (2018). [DOI] [PMC free article] [PubMed] [Google Scholar]
- 49.Humber M. L., Boschetti L., Giglio L., Justice C. O., Spatial and temporal intercomparison of four global burned area products. Int. J. Digit. Earth. 12, 460–484 (2018). [DOI] [PMC free article] [PubMed] [Google Scholar]
- 50.Rodrigues J. A., Libonati R., Pereira A. A., Nogueira J. M. P., Santos F. L. M., Peres L. F., Santa Rosa A., Schroeder W., Pereira J. M. C., Giglio L., Trigo I. F., Setzer A. W., How well do global burned area products represent fire patterns in the Brazilian Savannas biome? An accuracy assessment of the MCD64 collections. Int. J. Appl. Earth Obs. Geoinf. 78, 318–331 (2019). [Google Scholar]
- 51.Fanin T., Van Der Werf G. R., Relationships between burned area, forest cover loss, and land cover change in the Brazilian Amazon based on satellite data. Biogeosciences 12, 6033–6043 (2015). [Google Scholar]
- 52.Safronov A. N., Effects of climatic warming and wildfires on recent vegetation changes in the Lake Baikal basin. Climate 8, 57 (2020). [Google Scholar]
- 53.Hadfield J. D., MCMC methods for multi-response generalized linear mixed models: The MCMCglmm R package. J. Stat. Softw. 33, 29555 (2010). [Google Scholar]
- 54.A. Gelman, J. Hill, Data Analysis using Regression and Multilevel/Hierarchical Models (Cambridge Univ. Press, 2017). [Google Scholar]
Associated Data
This section collects any data citations, data availability statements, or supplementary materials included in this article.
Supplementary Materials
Supplementary material for this article is available at http://advances.sciencemag.org/cgi/content/full/7/33/eabd3357/DC1