Abstract
In this report, we explored the benefits of cyclic ion mobility (cIM) mass spectrometry in the analysis of isomeric post-transcriptional modifications of RNA. Standard methyl-cytidine samples were initially utilized to test the ability to correctly distinguish different structures sharing the same elemental composition, and thus molecular mass. Analyzed individually, the analytes displayed characteristic arrival times (tD) determined by the different positions of the modifying methyl groups onto the common cytidine scaffold. Analyzed in mixture, the widths of the respective signals resulted in significant overlap that initially prevented their resolution on the tD scale. The separation of the four isomers was achieved by increasing the number of passes through the cIM device, which enabled to fully differentiate the characteristic ion mobility behaviors associated with very subtle structural variations. The placement of the cIM device between the mass-selective quadrupole and the time-of-flight analyzer allowed us to perform gas-phase activation of each of these ion populations, which had been first isolated according to a common mass-to-charge ratio, and then separated on the basis of different ion mobility behaviors. The observed fragmentation patterns confirmed the structures of the various isomers, thus substantiating the benefits of complementing unique tD information with specific fragmentation data to reach more stringent analyte identification. These capabilities were further tested by analyzing natural mono-nucleotide mixtures obtained by exonuclease digestion of total RNA extracts. In particular, the combination of cIM separation and post-mobility dissociation allowed us to establish the composition of methyl-cytidine and methyl-adenine components present in the entire transcriptome of HeLa cells. For this reason, we expect that this technique will benefit not only epitranscriptomics studies requiring the determination of identity and expression levels of RNA modifications, but also metabolomics investigations involving the analysis of natural extracts that may possibly contain subsets of isomeric/isobaric species.
Natural RNA is graced with over 160 post-transcriptional modifications (PTMs), which are dynamically introduced and eliminated by biogenetic enzymes to fine-tune RNA structure and function [1,2]. The discovery of new classes of RNAs has greatly expanded our appreciation of the functions enacted by this biopolymer [3,4] and placed new emphasis on understanding the regulatory roles of these epitranscriptomics marks [5,6]. In recent years, the investigation of PTMs has been advanced by the availability of new specific antibodies that enable the enrichment and analysis of modified RNA by next generation sequencing (NGS) approaches [7,8]. These technologies can afford unmatched throughput and accuracy in locating the sequence position of PTMs, but the reliance on immunoprecipitation makes them prone to misidentification errors caused by antibody promiscuity. Further, the inability to enrich unmodified samples precludes any accurate assessment of actual expression levels, which must rely on the determination of site occupancy. Alternative NGS-based approaches employ PTM-specific chemical reactions to introduce a point mutation, or to interfere with proper reverse transcription, which enable detection by comparing sequence information obtained before and after treatment [9,10]. Taken together, these sequencing strategies can support the analysis of approximately 20 different types of PTMs to date. In contrast, MS-based approaches are capable of achieving the unequivocal characterization and quantification of any modified RNA according to unique mass and fragmentation features [11–13]. Historically, this platform has been determinant in the discovery of virtually all known PTMs [14–16], which are now listed in dedicated databases [17–20]. More recently, MS technologies have been proven capable of revealing the sequence position of covalent modifications, either natural or man-made, in progressively larger RNA strands [21–26]. Although typical sequencing throughputs cannot match those afforded by the NGS approaches, the ability of MS technologies to tackle genuine modified RNAs ensures that this platform will rapidly assume a prominent role in epitranscriptomics analysis, mirroring the successful trajectory traced over the years in the proteomics arena [27].
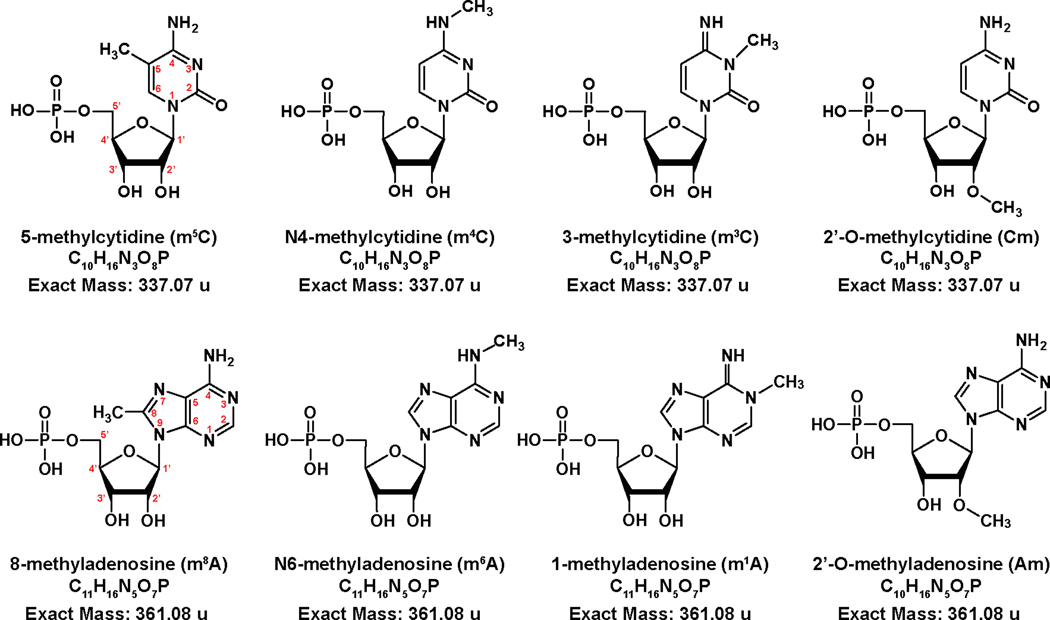
A wealth of information on epitranscriptomic functions can be obtained by monitoring the identity and expression levels of PTMs produced by a cell under different stimuli and environmental conditions, which can be readily secured without resorting to comprehensive sequence analysis [28,29]. To this effect, we developed an approach based upon direct infusion electrospray (i.e., nanospray) and ion mobility spectrometry mass spectrometry (IMS-MS), which can afford comprehensive PTM profiling of total nucleic acid extracts from biological samples [30]. Our approach involves digesting all strands present in nucleic acid fractions by using selected exonucleases to produce mono-nucleotide mixtures amenable to direct IMS-MS analysis. Each individual species is then identified according to its characteristic arrival time (tD) and mass-to-charge ratio (m/z), which are matched to corresponding information contained in a home-built database [30]. In the absence of front-end chromatographic separation, the challenges posed by the complexity of these sample mixtures are exacerbated by the presence of numerous subsets of isomeric/isobaric PTMs (exemplified in Scheme 1), which share the same elemental composition, but bear the covalent modification in different positions of the ribonucleotide structure. For the most part, these isomeric/isobaric forms adopt characteristic conformations that are sufficiently different to enable unambiguous discrimination on the tD scale. This case is exemplified by uridine (U) and pseudo-uridine (Ψ), which can be clearly differentiated from the ion mobility effects of characteristic conformations defined by the alternative presence of N- or C-glycosidic bonds [31]. In other cases, individual tD profiles cannot be satisfactorily resolved even with the aid of advanced curve-fitting algorithms. A possible solution consists of performing the gas-phase activation of isobaric/isomeric populations as they emerge from the ion mobility region of the instrument, which enables the acquisition of fragmentation data as a function of, and correlated with, tD. In this direction, we demonstrated the benefits of performing post-mobility dissociation of ions separated in the tD domain, either with or without initial m/z selection in the quadrupole (Q) mass filter [30–34]. Both types of experiments proved capable of producing unique diagnostic fragments that confirmed the composition of isomeric subsets with very similar tD values [30,31].
Scheme 1.
Structures of the methyl-cytidine and methyl-adenosine monophosphate isomers examined in the study.
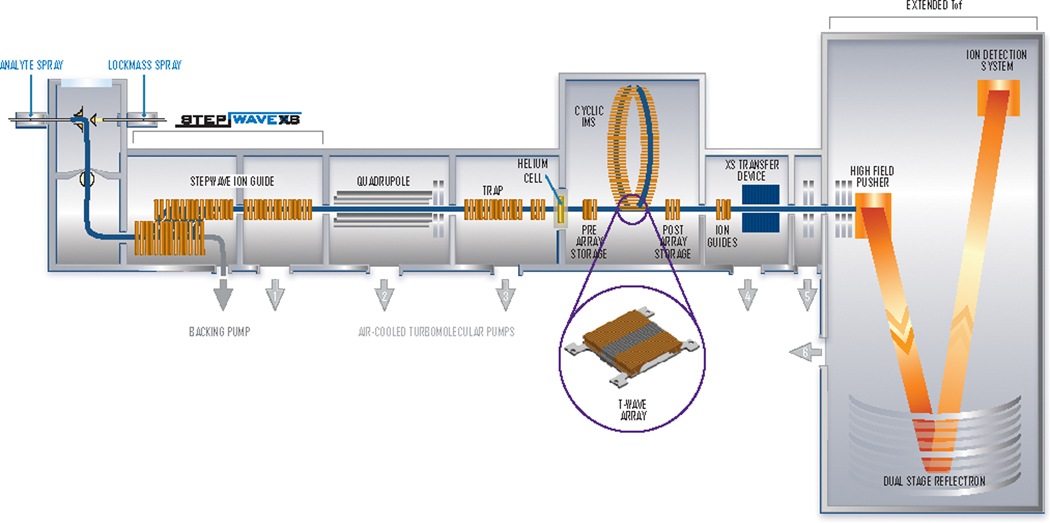
In this report, we explored the virtues of a new type of IMS-MS design in the analysis of complex mono-nucleotide mixtures. The heart of this instrument consists of a cyclic ion mobility (cIM) separator that capitalizes on the principle of traveling wave ion mobility (TWIMS) to enable multiple passes of the ions of interest (Scheme 2) [35,36]. Consistent with traditional drift tube separators, the resolution attainable by a TWIMS device is proportional to the square root of its length. This fundamental principle has been leveraged by introducing either cyclic [35–37] or serpentine [38,39] designs that significantly increase the path length, while preserving ion transmission and sensitivity within a compact instrumental design. The former, in particular, offers the ability to vary the number of passes through the device until the desired resolution is achieved over the selected mobility range. In this instrument, the placement of the cIM device at the center of the Q-TOF geometry (Q-cIM-TOF) offers the opportunity to perform the gas-phase activation of ion populations after multi-pass separation, which would enable one to combine specific tD and fragmentation data for more stringent analyte identification. For this reason, we set out to investigate the merits of this platform by tackling the analysis of selected ribonucleotide variants. Mixtures of isomeric mono-nucleotides were obtained from isolated synthetic standards, or whole-cell RNA extracts submitted to exonuclease digestion. The outcomes were evaluated in terms of the ability to achieve the positive identification of individual isomeric components, which was discussed in the context of possible epitranscriptomics applications.
Scheme 2.
Schematic representation of the cyclic IM instrument employed in the study.
Experimental
Materials.
Samples of the ribonucleotide variants displayed in Scheme 1 were synthesized from their corresponding nucleosides (vide infra). Stock solutions of the synthetic ribonucleotides were prepared in 10 mM ammonium acetate (pH adjusted to 7) with concentrations in the 1–10 μM range verified by UV spectrophotometry. Complex mono-nucleotide mixtures representative of typical biological samples were obtained from HeLa cells (ATCC, Manassas, VA) grown in Dulbecco’s modified Eagle’s medium (DMEM) (Life Technologies, Carlsbad, CA), 10% fetal bovine serum (FBS) and 1% glutamine and cultured at 37°C and 5% CO2. Cells were harvested at 85% confluency, lysed in TRIzol Reagent (Invitrogen, Carlsbad, CA), and total nucleic acid extracts were harvested according to the manufacturer’s protocol. The DNA fractions were eliminated by DNase I treatment followed by ethanol precipitation. The remaining RNA fractions were then digested by back-to-back RNase treatments using nuclease P1 and phosphodiesterase at 37°C for 2 hr to obtain the desired mono-nucleotide samples. The typical concentrations of these stock solutions were in the 40 ng/μL range, as verified by UV spectrophotometry. Each mono-nucleotide digest sample was diluted with the same ammonium acetate solution and added with a 10% volume of isopropanol to obtain final sample concentrations in the 4 ng/μL range.
Nucleotide Synthesis.
5-methylcytidine, N4-methylcytidine, 3-methylcytidine, 2’-O-methylcytidine, 8-methyladenosine, N6-methyladenosine, and 2’-O-methyladenosine were purchased from Berry & Associates Inc. (Dexter, MI). 1-methyladenosine was purchased from Carbosynth (Berkshire, England). Phosphorylation of the 5’-OH groups of the aforementioned nucleosides was carried out according to a previously described procedure [40]. Briefly, 5 to 100 mg of each nucleoside were dissolved in 1 mL of trimethyl phosphate placed in a 5 mL round bottom flask, which was flushed with N2. The reaction mixture was cooled to 0°C and two molar equivalents of phosphoryl chloride were added dropwise. The reaction was stirred under N2 atmosphere at 0°C for 18 h. The reaction was quenched by adding 1 mL of 0.1 M triethylammonium bicarbonate buffer at pH 7.5 and incubating for one hour at 0°C under continuous stirring. The solution containing the crude product was filtered through a 0.22 μm filter unit (MilliporeSigma, Burlington, MA) and transferred to a glass vial. The quality of the crude product was determined by tandem MS.
Nucleotide Purification.
Crude nucleotide products were purified by using a Rainin Dynamax (Mettler Toledo, Columbus, OH) SD-200 HPLC equipped with a C18 analytical reversed-phase column from Phenomenex (Luna 5 μm particle size, 100 Å pore size, 250 mm x 10 mm i.d., Torrance, CA) at a flow rate of 3 mL/min for 30 min. A gradient consisting of solvent A (5% acetonitrile, 100 mM ammonium acetate) and solvent B (50% acetonitrile, 100 mM ammonium acetate) was applied as follows: initial conditions 100% solvent A for 10 min; ramp solvent B to 80% in 10–25 min; decrease B to 0% in 30 min; and maintain 100% A for 5 min to remove any excess reagent. The effluent was monitored at 230 and 260 nm, while fractions were collected in 1.5 mL microfuge tubes beginning at 1 min. Nucleotide purity was determined by mass spectrometry analysis.
Mass Spectrometry.
Analyses were performed on either a modified SYNAPT G2-Si instrument equipped with the cIM separator (Scheme 2), or a standard SYNAPT G2 HDMS, both from Waters Corporation (Wilmslow, UK). The analyses performed on the SYNAPT G2 HDMS were accomplished in static nanospray mode by using quartz emitters prepared in-house as described in ref. [41]. A stainless-steel wire was inserted into the emitter back end to provide typical spray voltages in the 0.9 to 1.2 kV range. Source temperature and desolvation voltages were finely adjusted by monitoring the incidence of ammonium adducts and water clusters [42]. The ion mobility experiments were completed in the 25-cm TW cell by using a 90 mL/min flow of N2 and 180 mL/min of He to maintain a constant pressure of ~4.40 mbar (uncalibrated gauge reading). A typical 650 m/s wave velocity was utilized with a 40 V wave height, a 109 m/s transfer wave velocity, and a 2.0 V transfer wave height. Each spectrum represented the summation of scans acquired over a 60 s interval. External calibration was carried out by using a 2 mg/mL solution of cesium iodide in 50:50 water/methanol, which afforded a typical mass accuracy of ~9 ppm. The design and usual operation of the hybrid quadrupole ion mobility TOF mass spectrometer (Q-cIM-TOF) used for these studies is described in more detail in ref. [43]. For the nucleotide analyses, 4 μm coated nanospray emitters (New Objective, Woburn, MA, USA) were used at 0.8 to 1.5 kV. The source was held at 80°C and the cone voltage set to 20 V. The 98-cm cIM cell was operated with 50 mL/min of N2 in the main chamber and a He cell flow of 120 mL/min.
Mass-selected time-resolved (MaSTeR) [30] dissociation experiments were carried out by isolating the desired precursor ion(s) in the mass-selective quadrupole (Q, Scheme 2) with a window width of 3 m/z. After undergoing the desired number of passes in the cIM device, the emerging ions were activated in the XS transfer lens through collisions with N2 at an offset of 10 V. The TOF analyzer was then employed to record all ensuing fragments as a function of time. Each MaSTeR spectrum was finally obtained by signal averaging across the desired interval of the time scale of the experiment, which provided a representative portrayal of all fragments generated by the precursor ion possessing that specific tD.
Data interpretation.
The tD data acquired on either instrument employed in the study were processed by using MassLynx (Waters Corporation) software. When necessary, Gaussian curve fitting was carried out by using OriginPro 9.1 (Origin Lab, North Hampton, MA). Fragmentation data produced by gas-phase activation techniques were interpreted manually according to known dissociation patterns [14,44]. Resolving power was determined according to the RCCS = CCS / ΔCCS definition [45], in which CCS corresponds to the collision cross section manifested by the analyte, whereas ΔCCS represents the full-width at half maximum (FWHM) of the corresponding signal reported on the CCS scale. The fact that this treatment relies on direct knowledge of accurate CCS values, either through drift tube determinations, or computational approaches, limited its application only to the canonical ribonucleotide in the study. For this reason, this treatment was not extended to the various isomeric species, for which accurate CCS values are not known. As a possible alternative, we utilized the FWHM of the various signals on the tD scale to compare in self-consistent fashion the subtle differences of peak widths observed on the same platform for the various ion populations, which could be potentially attributed to either intrinsic structure dynamics of particular isomers, or to the presence of multiple unresolved components.
Results and Discussion
Multipass analysis of canonical ribonucleotides.
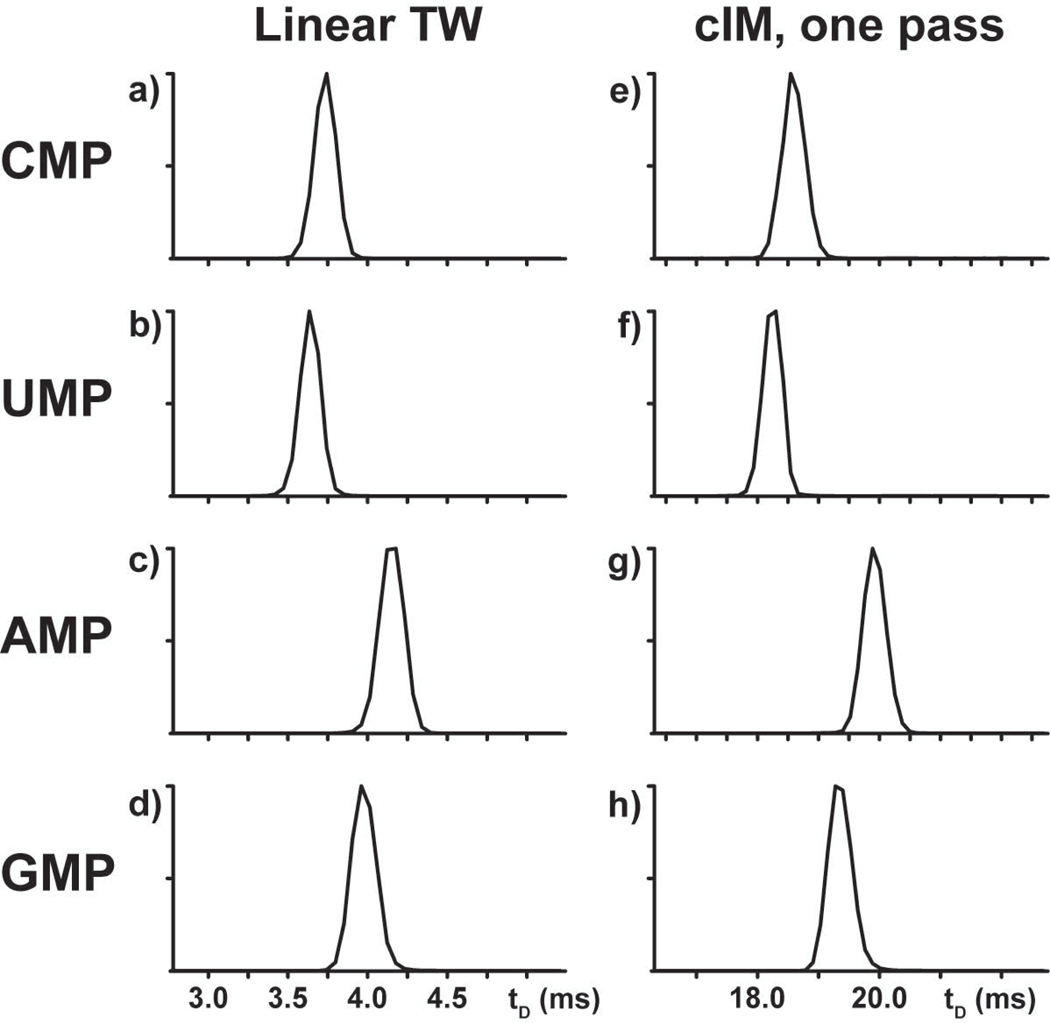
Comparing data obtained on either a linear TW or a cIM device could readily reveal the benefits of multipass operations in ribonucleotide analysis. Fig. 1 displays the arrival time distributions of the canonical ribonucleotides CMP, UMP, AMP, and GMP contained in the digest of a total RNA extract from HeLa cells, which was analyzed in parallel on either platform (see Experimental). At first sight, the data afforded by the linear TW looked very similar to those recorded after a single pass on the cIM instrument. Consistent with the close relationship between arrival time (tD) and structural features characteristic of the individual analytes, the observed order of tDs remained unchanged on either instrument. However, the various ribonucleotides displayed significantly longer tDs on the cIM than on the linear TW, as illustrated for example in Fig. 1a and 1e. At the same time, the mutual spacing between tDs was also considerably wider, which attested to the greater separating power afforded by the cIM experiment even after a single pass. This observation was ascribed to the fact that this device possessed a significantly longer separation path than that of the linear TW (i.e., 98 versus 25.4 cm, respectively) [46].
Figure 1.
IM-MS data obtained from canonical ribonucleotides on either a linear TW (left) or a cIM (right) device after a single pass.
Visual inspection of Fig. 1 could not provide any immediate appreciation of the effects of path length on signal width, and therefore resolution, which were instead readily evident when comparing actual values of resolving power. Indeed, the availability of known values of collision cross section (CCS) for the canonical ribonucleotides [47] allowed us to translate experimental tD data into corresponding CCS counterparts, which were in turn utilized to calculate resolving power according to the CCS definition (RCCS, see Experimental) [45]. This treatment revealed that single-pass analysis could already improve RCCS by an average ~35% over linear TW determinations solely by virtue of the larger dimensions of the cIM separator (Table 1).
Table 1.
Resolving power (RCCS) calculated from experimental data that were obtained from canonical ribonucleotides on either the linear TW or the cIM instrument.
| TW | cIM | |||
|---|---|---|---|---|
| one pass | two passes | three passes | ||
| CMP | 45 | 54 | 90 | 177 |
| UMP | 46 | 51 | 86 | 177 |
| AMP | 44 | 58 | 88 | 127 |
| GMP | 44 | 55 | 86 | 120 |
The effects observed after a single pass were greatly magnified in multipass experiments that further increased the path length employed for the separation process. Indeed, increasing the number of passes further increased the overall arrival times and mutual spacing between the signals of canonical ribonucleotides. Experimental tDs observed after two and three passes were utilized to calculate corresponding RCCS values, which clearly exhibited the expected upward trends (Table 1). More specifically, the results followed the square root relationship between RCCS and path length characteristic of both classic drift tubes and TW separators. The significance of this relationship on the design and performance of the cIM device was discussed in detail in a recent report and references therein [46].
Multipass separation of isomeric mono-nucleotides.
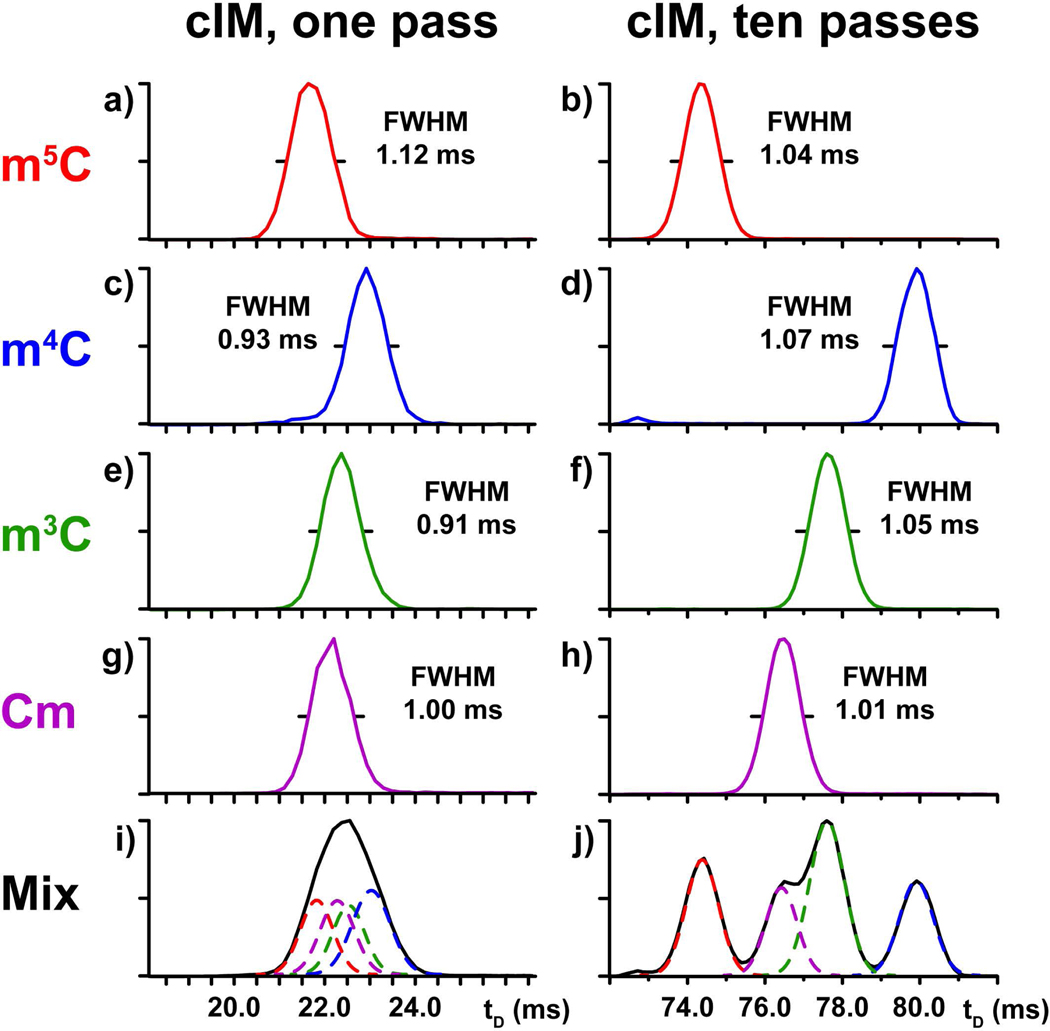
Selected methyl-cytosine ribonucleotide isomers (i.e., 5-methyl-, 4-methyl-, 3-methy-, and 2’-O-methyl-citydine, Scheme 1) were employed individually and in an equimolar mixture to evaluate the ability of multipass analysis to separate very closely related structures. The standards were first analyzed separately to determine their ion mobility behaviors and facilitate the proper assignment of the different tD signals recorded for the mixture. As shown in Fig. 2, each individual species produced a major well-delineated signal consistent with the presence of a unique, predominant conformation. More significantly, each individual isomer provided a very distinctive tD, thus indicating that the various isomeric structures were sufficiently different to confer unique ion mobility behaviors. At the same time, the various isomers manifested also different full-widths at half maximum (FWHM) on the tD scale (see Fig 2). Considering that all methyl-cytosine samples were analyzed under identical experimental conditions (a fact unequivocally verified in the analysis of their mixture discussed below), this observation should not be ascribed to instrumental parameters affecting the diffusion of ion populations during the analysis, which applied across the board. The distinctive FWHM should be instead ascribed to intrinsic structure dynamics of each individual isomer, which may contribute to the diversity of conformations included in the corresponding ion population. Therefore, this subtle but unique trait could represent an additional differentiating feature between isomers.
Figure 2.
IM-MS analysis of individual methyl-cytidine standards (Scheme 1) and their equimolar mixture. Data obtained after 1 and 10 passes in the cIM device are respectively displayed on the left and right column (see Experimental).
Increasing the number of passes in the cIM device produced the same beneficial effects described earlier for the canonical ribonucleotides. For instance, the signals recorded after ten passes exhibited tD values that were much greater than those observed after one pass (compare the right with the left column of Fig. 2). The spacing between individual signals was also significantly increased, consistent with the greater ability of multipass experiments to disperse isomers on the tD scale. However, the greater resolving power associated with the greater path length was more prominently showcased during the analysis of the entire methyl-cytidine mixture. After only one pass, the mixture was detected as a single unresolved signal with a rather large FWHM (Fig. 2i). In contrast, two out of four isomers were fully separated after ten passes, whereas the remaining two were partially resolved (Fig 2j). The tD values obtained from the analyses of the individual standards provided the information necessary to correctly assign the observed signals to the each isomer in the mixture. This operation identified m5C and m4C with the fully resolved populations possessing respectively the highest and lowest tDs in the series. A curve fitting algorithm was instead applied to tease out the different components contained in the partially resolved signal with intermediate tD (see Experimental), which were identified with Cm and m3C.
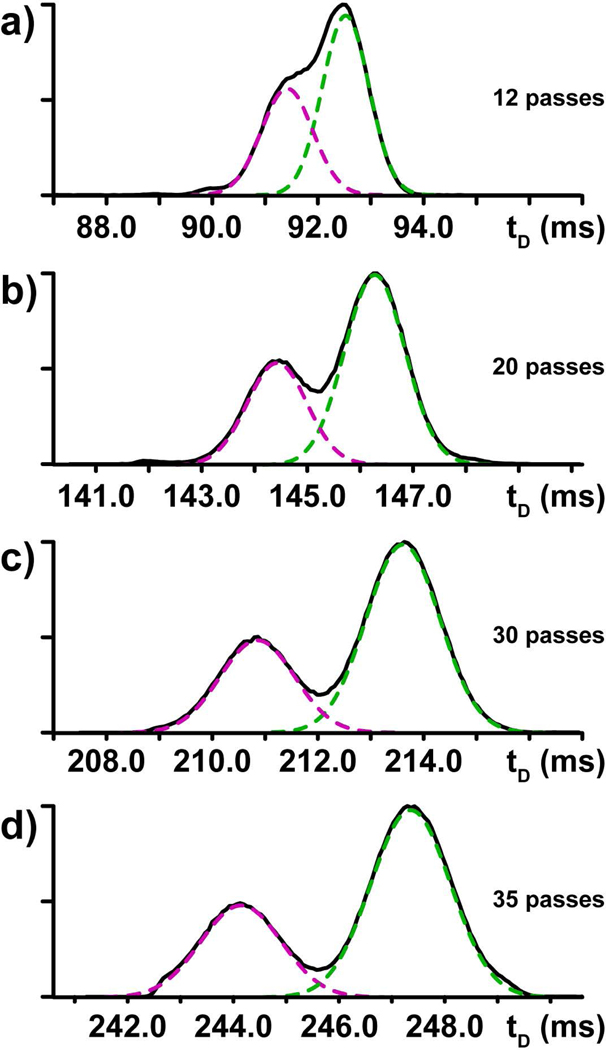
The relationship between resolving power and path length was further explored to determine the conditions necessary to separate the partially resolved components. After submitting the methyl-cytidine mixture to 10 passes in the cIM separator (Fig. 2j), the fully resolved m5C and m4C species were ejected from the device to prevent possible “wrap-around” effects produced by faster ion populations overtaking slower ones that completed fewer passes [46]. In contrast, the remaining Cm and m3C were submitted to additional passes under exactly the same experimental conditions (Fig. 3). The data recorded after 12, 20, 30 and 35 passes clearly showed that resolving power increased as a function of path length, as evidenced by the steadily increasing separation between the Cm and m3C signals.
Figure 3.
Multi-pass cIM analysis of methyl-cytidine mixture. After 10 passes, m5C and m4C were ejected from the separator, whereas the partially resolved Cm/m3C were submitted to additional passes to reach a total of a) 12, b) 20, c) 30, and d) 35 (see Experimental).
Some considerations should be made when implementing a multipass strategy to boost the separation capabilities. The fact that resolving power and path length follow a square root relationship translates into progressively smaller gains as the number of passes increases. Further, this modus operandi requires prolonged time-scales, as can be readily appreciated in Fig 3. The operations could be accelerated by increasing the TW voltage used in the cIM device, where a greater wave velocity would translate into a greater number of passes attainable per unit time and, thus, a longer path traveled during the experiment. As true for any strategy aimed at increasing resolving power by extending the path length, ion statistics may pose a practical obstacle toward achieving the desired separation. In fact, the number of ions reaching the detector can be potentially affected by putative factors, such as overall ion transmission and fragmentation, which are expected to exacerbate as a function of path length. Prior work has demonstrated that these types of experiments tend to afford a modest 2% loss of ion current per pass [46]. In our experiments, no signs of fragmentation events were detected during methyl-cytidine analysis. For these reasons, the Cm and m3C samples in the mixture still provided excellent signal-to-noise ratios after 35 passes through the cIM separator (Fig. 3d). Nevertheless, these possible factors should always be considered when fine-tuning the number of passes to achieve the desired separation.
Gas-phase activation of multipass separated ions.
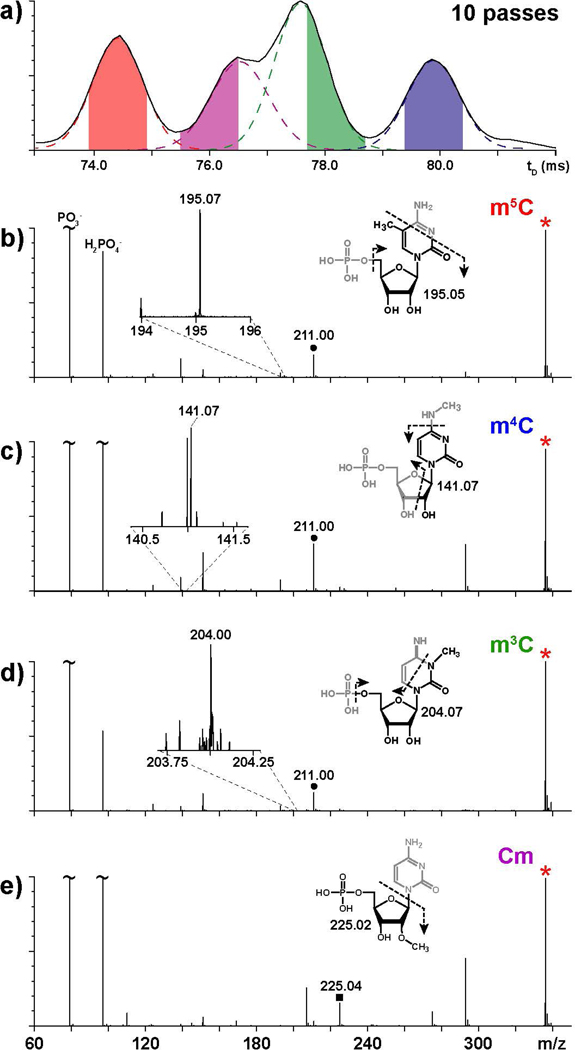
The placement of the cIM device between the mass-selective Q and the TOF analyzer (Scheme 2) offers the possibility of activating the gas-phase dissociation of selected precursor ions after they are separated on the tD scale. In particular, we explored the merits of MaSTeR experiments that involved isolating a specific set of isomeric/isobaric ions in the Q according to their common m/z ratio, allowing them to separate in the cIM region according to their characteristic ion mobility behaviors, activating them as they sequentially emerged from the cIM region, and then finally analyzing the ensuing fragments in the TOF analyzer (see Experimental). The data produced by the four isomeric components of the methyl-cytidine mixture are shown in Fig. 4. In this experiment, the precursor ion population at 336.06 m/z was collisionally activated in the XS transfer lens after 10 passes in the cIM device (Scheme 2). Each MaSTeR spectrum was then extracted by signal averaging the recorded fragments across a selected tD window approximately 1-ms wide (Fig. 4a). The center of each window was adjusted on the basis of information afforded by curve-fitting operations (see Experimental), which helped minimize possible overlaps between adjacent ion populations (Fig. 4a). In this way, the ensuing fragmentation spectra were generated from precursor ion populations that were as structurally homogenous as possible.
Figure 4.
Mass-selected time-resolved (MaSTeR) dissociation spectra obtained from the equimolar mixture of methyl-cytidine isomers. Panel a) shows the windows of tD from which the various product ion spectra were obtained (see Experimental). In particular, panel b) corresponds to the population emerging at 74.4 ±0.5 ms; c) at 79.9 ±0.5 ms; d) at 78.2 ±0.5 ms; and e) at 76.0 ±0.5 ms. Precursor ions are marked with a red asterisk, whereas signals produced by base loss are marked with black circles or squares.
The observed fragmentation patterns (Fig. 4b - e) were consistent with the structures of the various isomers (Scheme 1) and matched very closely those obtained from the individual species analyzed separately under the same experimental conditions (compare with Fig. S-1 of Supporting Information), or fully resolved by additional passes in the cIM device. For all nucleotides, the detection of signals corresponding to PO3- and H2PO4- in the low m/z range was consistent with typical dissociation processes involving the phosphate group (Fig. 4b - e). Facile cleavage of the rather labile N-glycosidic bond was also observed in the form of fragments at either 211.00 or 225.04 m/z, which respectively corresponded to the loss of methylated and regular cytosine base (compare Fig. 4b - d with 4e). Based on the position of the methyl group on the nucleotide structure, these specific fragments were sufficient to single-handedly differentiate the m5C/m4C/m3C subset from Cm, which bear the modification on either the nucleobase or ribose moiety (Scheme 1). Additional fragmentation processes involving loss of methylamine or opening of the pyrimidine ring produced signals that enabled unambiguous discrimination of the remaining isomers with methylated bases (Fig. 4b - d).
In this example, the MaSTeR determinations were successfully accomplished on species that were not fully resolved, such as Cm and m3C, by taking advantage of a curve-fitting algorithm to identify tD windows with minimum overlap (Fig. 4a). However, prior knowledge of unique diagnostic fragments could readily enable the creation of reconstructed arrival time distributions from a whole ensemble of tD signals, regardless of whether they might be fully resolved. For the methyl-cytidines in the study, this essential information was obtained by activating individual isomers analyzed in separate experiments (Fig. S-1), or in mixture with different degrees of separation (Fig. 4b - d, for example). When the isomer-specific fragments were employed to analyze the entire 73 – 82 ms range depicted in Fig. 4a, the ensuing reconstructed profiles matched very closely the tD signals obtained from the individual isomers under identical experimental conditions (compare Fig. S-2 with the right column of Fig. 2). This outcome offered further proof of the virtues of this type of multi-dimensional analysis, which is capable of combining tD, mass, and fragmentation information to enable unambiguous identification and structural characterization.
cIM analysis of complex biological samples.
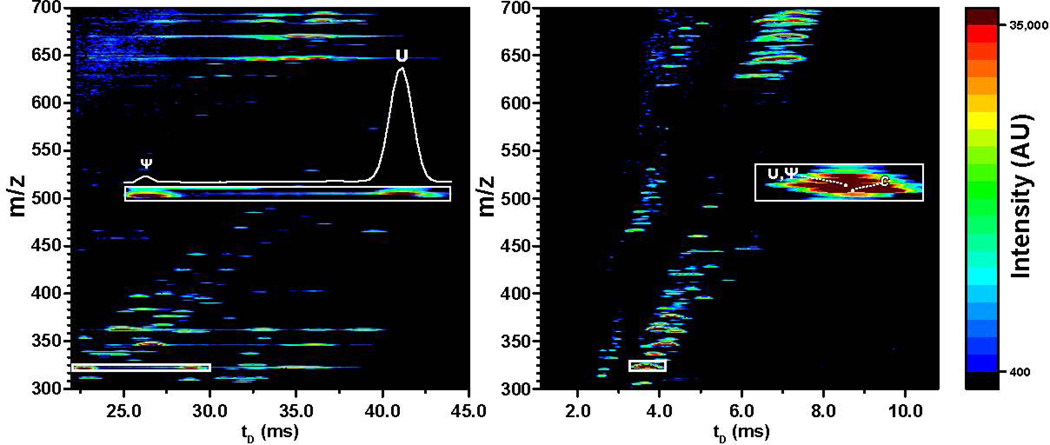
The results afforded by isomeric mixtures from commercial standards highlighted numerous features that could immediately benefit the analysis of complex samples from cellular extracts. For example, Fig. 5 shows the data obtained from a sample generated by exonuclease digestion of a total RNA extract of HeLa cells (see Experimental). A comprehensive view of these types of data is typically obtained by using a heatmap format, in which m/z is plotted against tD and a color gradient is used to convey signal intensity. The heatmaps provided by both cIM and linear TW determinations displayed the typical complexity expected from these types of samples. However, the bands/spots corresponding to the various PTMs were more widely spaced on the tD dimension in the former than in the latter, consistent with the greater resolution achievable in multipass experiments. A direct comparison of the regions containing the U/Ψ couple provided a greater appreciation of this effect. Indeed, the signals corresponding to the individual isomers were fully resolved on the cIM heatmap, whereas displayed extensive overlap on the linear TW one (Fig. 5 insets).
Figure 5.
Heatmap plots obtained by cIM after 3 passes (left) and linear TW (right) analysis of an exonuclease digestion mixture from total RNA extract of HeLa cells (see Experimental). The cIM separator fully resolved the uridine (U) and pseudo-uridine (Ψ) isomers, whereas the linear TW device displayed extensive overlap (insets).
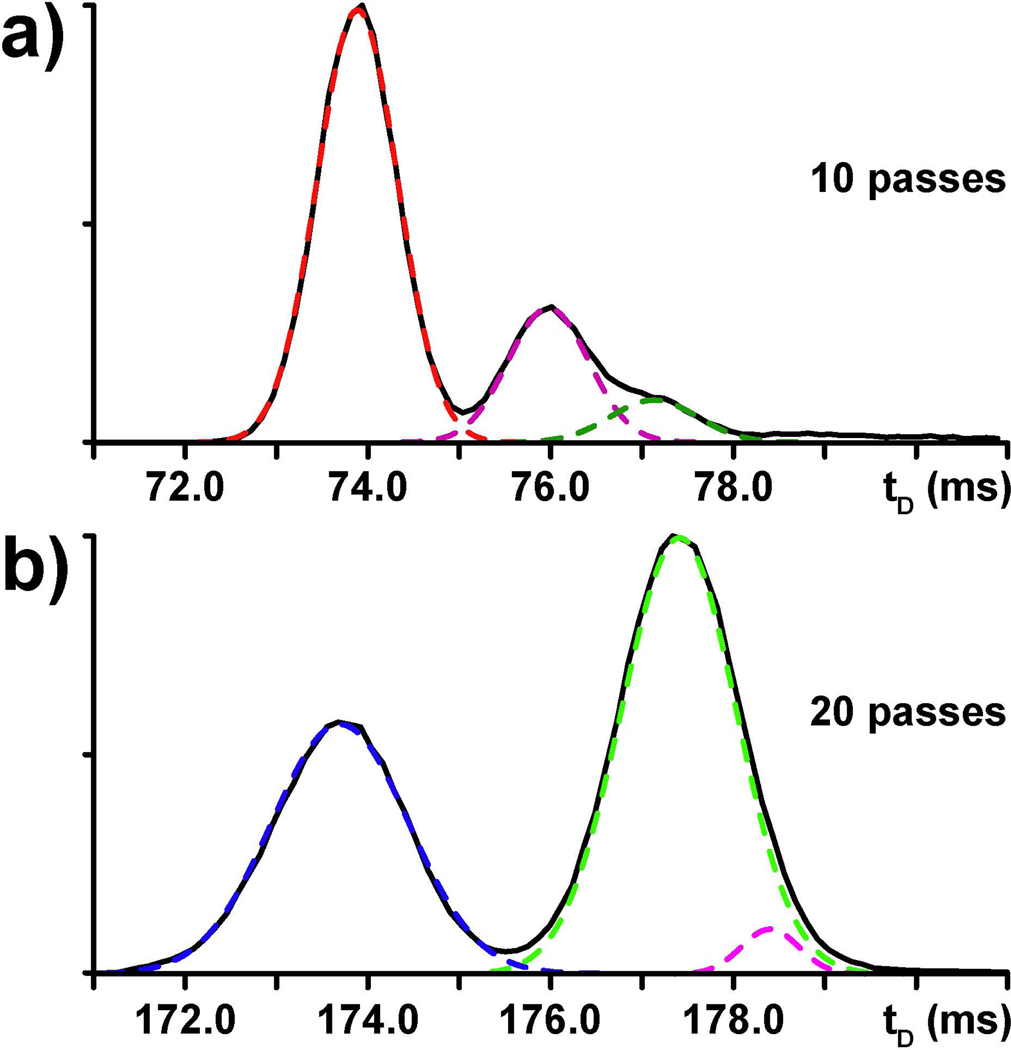
The greater separating power afforded by multipass operations could be leveraged not only to resolve isomeric subsets on the tD scale, but also to facilitate the application of MaSTeR dissociation to verify the respective structures. For example, Fig. 6 shows the multipass analysis of ion populations at 336.06 and 360.07 m/z, which corresponded respectively to the methyl-cytidine and methyl-adenine isomeric subsets. Owing to the unknown/un-controlled composition of this natural sample, the signal distribution afforded by the former did not completely match the one provided by the equimolar mixture of commercial standards described above (compare Fig. 6a with Fig 4a). Nevertheless, the methyl-cytidine components in the celular extract were still recognizable on the basis of their characteristic tD values and corroborating MaSTeR dissociation data (Fig. S-3). In similar fashion, the various methyl-adenine components were recognized according to characteristic diagnostic fragments (Fig. S-4). These results clearly indicated that this strategy could be readily applied to cover in systematic fashion all the 22 isomeric/isobaric subsets recognizable among the >160 PTMs known to date [17–20].
Figure 6.
Multi-pass analysis of methyl-cytidine (a) and methyl-adenine (b) isomeric subsets present in the exonuclease mixture from total HeLa RNA (see Experimental). Isomeric sets with 336.06 and 360.07 m/z were isolated in the mass-selective Q, then analyzed after 10 (for methyl-cytidines) or 20 (for methyl-adenosines) passes in the cIM device.
Conclusions
The challenges posed by isomeric ribonucleotide variants provided an excellent test for the capabilities afforded by the cyclic ion mobility design in the analysis of complex sample mixtures. In the case of methyl-cytidine and methyl-adenosine subsets, the ability to extend the separation path by increasing the number of passes allowed us to capitalize on very subtle differences in ion mobility behaviors induced by the different placement of a single methyl group onto the ribonucleotide scaffold. This feature proved to be beneficial in the analysis of model standard mixtures, as well as more complex samples of cellular origin. Upon separation in the arrival time domain from the cIM determination, the identities of the different isomeric components were readily assignable according to characteristic tD values that matched those observed for the individual standards. An additional avenue for achieving positive identification was offered by the possibility of performing the gas-phase fragmentation of isomeric species emerging at different tDs from the cIM device. The observed fragmentation patterns matched those recorded for the individual standards. More significantly, however, such patterns reflected the effects of the specific position of the methyl group on the dissociation pathway, which revealed unique diagnostic fragments for each isomer in the study. This outcome supported the systematic application of MaSTeR dissociation to tackle the complexity of total epitranscriptomic analysis illustrated here by the heatmaps obtained from total RNA extracts. As typically afforded by multi-dimensional analytical techniques, the availability of distinctive tD, mass, and fragmentation information lent additional robustness to analyte identification. Based on these capabilities, this technique will be expected to find increasing application in epitranscriptomics studies in which the identity and expression levels of RNA modifications must be determined as a function of different stimuli and conditions. Beyond epitranscriptomics, the broad applicability of this technique will enable the analysis of other types of samples containing subsets of isomeric/isobaric species, such as those frequently encountered in metabolomics studies.
Supplementary Material
Acknowledgements
Funding for this work was provided by the University at Albany-SUNY (to D.F.); the National Institute of Allergy and Infectious Diseases (NIAID) [R21 AI133617-01 to D.F.]; and the National Institute of General Medical Sciences [R01 GM121844-01 to D.F.].
Footnotes
Conflict of interest statement. None declared.
References
- 1.Grosjean H: Fine-tuning of RNA functions by modification and editing. (Springer, 2005). [Google Scholar]
- 2.Carell T, Brandmayr C, Hienzsch A, Müller M, Pearson D, Reiter V, Thoma I, Thumbs P. & Wagner M: Structure and function of noncanonical nucleobases. Angew. Chem. Int. Ed. Engl 51, 7110–7131 (2012). [DOI] [PubMed] [Google Scholar]
- 3.Mattick JS & Makunin IV: Non-coding RNA. Human molecular genetics 15 Spec No 1, R17–29 (2006). [DOI] [PubMed] [Google Scholar]
- 4.Morris KV & Mattick JS: The rise of regulatory RNA. Nat Rev Genet 15, 423–437 (2014). [DOI] [PMC free article] [PubMed] [Google Scholar]
- 5.Shafik A, Schumann U, Evers M, Sibbritt T. & Preiss T: The emerging epitranscriptomics of long noncoding RNAs. Biochim. Biophys. Acta 1859, 59–70 (2015). [DOI] [PubMed] [Google Scholar]
- 6.Zhao BS, Roundtree IA & He C: Post-transcriptional gene regulation by mRNA modifications. Nat. Rev. Mol. Cell Biol 18, 31–42 (2017). [DOI] [PMC free article] [PubMed] [Google Scholar]
- 7.Dominissini D, Moshitch-Moshkovitz S, Schwartz S, Salmon-Divon M, Ungar L, Osenberg S, Cesarkas K, Jacob-Hirsch J, Amariglio N, Kupiec M, Sorek R. & Rechavi G: Topology of the human and mouse m6A RNA methylomes revealed by m6A-seq. Nature 485, 201–206 (2012). [DOI] [PubMed] [Google Scholar]
- 8.Schwartz S. & Motorin Y: Next-generation sequencing technologies for detection of modified nucleotides in RNAs. RNA Biol 14, 1124–1137 (2016). [DOI] [PMC free article] [PubMed] [Google Scholar]
- 9.Behm-Ansmant I, Helm M, Motorin Y, Behm-Ansmant I, Helm M. & Motorin Y: Use of Specific Chemical Reagents for Detection of Modified Nucleotides in RNA, Use of Specific Chemical Reagents for Detection of Modified Nucleotides in RNA. Journal of Nucleic Acids 2011, 2011, e408053 (2011). [DOI] [PMC free article] [PubMed] [Google Scholar]
- 10.Helm M. & Motorin Y: Detecting RNA modifications in the epitranscriptome: predict and validate. Nat. Rev. Genet 18, 275–291 (2017). [DOI] [PubMed] [Google Scholar]
- 11.Nordhoff E, Kirpekar F. & Roepstorff P: Mass spectrometry of nucleic acids. Mass Spectrometry Reviews 15, 67–138 (1996). [DOI] [PubMed] [Google Scholar]
- 12.Limbach PA: Indirect mass spectrometric methods for characterizing and sequencing oligonucleotides. Mass Spectrom. Rev 15, 297–336 (1996). [DOI] [PubMed] [Google Scholar]
- 13.Wetzel C. & Limbach PA: Mass spectrometry of modified RNAs: recent developments. Analyst 141, 16–23 (2016). [DOI] [PMC free article] [PubMed] [Google Scholar]
- 14.McCloskey JA: Characterization of nucleosides by mass spectrometry. Nucleic Acids Symp Ser s109–13 (1979). [DOI] [PubMed]
- 15.Crain PF: Preparation and enzymatic hydrolysis of DNA and RNA for mass spectrometry. Meth. Enzymol 193, 782–790 (1990). [DOI] [PubMed] [Google Scholar]
- 16.Crain PF & McCloskey JA: Applications of mass spectrometry to the characterization of oligonucleotides and nucleic acids. Curr. Opin. Biotechnol 9, 25–34 (1998). [DOI] [PubMed] [Google Scholar]
- 17.Limbach PA, Crain PF & McCloskey JA: Summary: the modified nucleosides of RNA. Nucleic Acids Res 22, 2183–2196 (1994). [DOI] [PMC free article] [PubMed] [Google Scholar]
- 18.Cantara WA, Crain PF, Rozenski J, McCloskey JA, Harris KA, Zhang X, Vendeix FAP, Fabris D. & Agris PF: The RNA modification database, RNAMDB: 2011 update. Nucleic Acids Res 39, D195–D201 (2011). [DOI] [PMC free article] [PubMed] [Google Scholar]
- 19.Dunin-Horkawicz S, Czerwoniec A, Gajda MJ, Feder M, Grosjean H. & Bujnicki JM: MODOMICS: a database of RNA modification pathways. Nucleic Acids Res. 34, D145–149 (2006). [DOI] [PMC free article] [PubMed] [Google Scholar]
- 20.Machnicka MA, Milanowska K, Osman Oglou O, Purta E, Kurkowska M, Olchowik A, Januszewski W, Kalinowski S, Dunin-Horkawicz S, Rother KM, Helm M, Bujnicki JM & Grosjean H: MODOMICS: a database of RNA modification pathways−−2013 update. Nucleic Acids Research 41, D262–D267 (2012). [DOI] [PMC free article] [PubMed] [Google Scholar]
- 21.Kowalak JA, Pomerantz SC, Crain PF & McCloskey JA: A novel method for the determination of post-transcriptional modification in RNA by mass spectrometry. Nucleic Acids Res. 21, 4577–85 (1993). [DOI] [PMC free article] [PubMed] [Google Scholar]
- 22.Kowalak JA, Bruenger E, Hashizume T, Peltier JM, Ofengand J. & McCloskey JA: Structural characterization of U*−1915 in domain IV from Escherichia coli 23S ribosomal RNA as 3-methylpseudouridine. Nucleic Acids Res. 24, 688–693 (1996). [DOI] [PMC free article] [PubMed] [Google Scholar]
- 23.Kirpekar F, Douthwaite S. & Roepstorff P: Mapping posttranscriptional modifications in 5S ribosomal RNA by MALDI mass spectrometry. RNA 6, 296–306 (2000). [DOI] [PMC free article] [PubMed] [Google Scholar]
- 24.Yu E. & Fabris D: Direct probing of RNA structures and RNA-protein interactions in the HIV-1 packaging signal by chemical modification and electrospray ionization fourier transform mass spectrometry. J. Mol. Biol 330, 211–223 (2003). [DOI] [PubMed] [Google Scholar]
- 25.Yu ET, Hawkins AE, Eaton J. & Fabris D: MS3D structural elucidation of the HIV-1 packaging signal. Proc Natl Acad Sci U S A 105, 12248–12253 (2008). [DOI] [PMC free article] [PubMed] [Google Scholar]
- 26.Taucher M. & Breuker K: Characterization of Modified RNA by Top-Down Mass Spectrometry. Angewandte Chemie International Edition 51, 11289–11292 (2012). [DOI] [PMC free article] [PubMed] [Google Scholar]
- 27.Limbach PA & Paulines MJ: Going global: the new era of mapping modifications in RNA. Wiley Interdiscip Rev RNA 8, (2017). [DOI] [PMC free article] [PubMed] [Google Scholar]
- 28.Rose RE, Pazos MA, Curcio MJ & Fabris D: Global profiling of RNA post-transcriptional modifications as an effective tool for investigating the epitranscriptomics of stress response. Mol. Cell Proteomics 15, 932–944 (2016). [DOI] [PMC free article] [PubMed] [Google Scholar]
- 29.McIntyre W, Netzband R, Bonenfant G, Biegel JM, Miller C, Fuchs G, Henderson E, Arra M, Canki M, Fabris D. & Pager CT: Positive-sense RNA viruses reveal the complexity and dynamics of the cellular and viral epitranscriptomes during infection. Nucleic Acids Res. 46, 5776–5791 (2018). [DOI] [PMC free article] [PubMed] [Google Scholar]
- 30.Rose RE, Quinn R, Sayre JL & Fabris D: Profiling ribonucleotide modifications at full-transcriptome level by electrospray ionization mass spectrometry. RNA appeared on line on May 20 21, 1361–1374 (2015). [DOI] [PMC free article] [PubMed] [Google Scholar]
- 31.Quinn R, Basanta-Sanchez M, Rose RE & Fabris D: Direct infusion analysis of nucleotide mixtures of very similar or identical elemental composition. J. Mass Spectrom 48, 703–12 (2013). [DOI] [PMC free article] [PubMed] [Google Scholar]
- 32.Hoaglund-Hyzer CS, Li J. & Clemmer DE: Mobility Labeling for Parallel CID of Ion Mixtures. Anal. Chem 72, 2737–2740 (2000). [DOI] [PubMed] [Google Scholar]
- 33.Damen CWN, Chen W, Chakraborty AB, van Oosterhout M, Mazzeo JR, Gebler JC, Schellens JHM, Rosing H. & Beijnen JH: Electrospray ionization quadrupole ion-mobility time-of-flight mass spectrometry as a tool to distinguish the lot-to-lot heterogeneity in N-glycosylation profile of the therapeutic monoclonal antibody trastuzumab. J. Am. Soc. Mass Spectrom 20, 2021–2033 (2009). [DOI] [PubMed] [Google Scholar]
- 34.Castro-Perez J, Roddy TP, Nibbering NMM, Shah V, McLaren DG, Previs S, Attygalle AB, Herath K, Chen Z, Wang S-P, Mitnaul L, Hubbard BK, Vreeken RJ, Johns DG & Hankemeier T: Localization of fatty acyl and double bond positions in phosphatidylcholines using a dual stage CID fragmentation coupled with ion mobility mass spectrometry. J. Am. Soc. Mass Spectrom 22, 1552–1567 (2011). [DOI] [PMC free article] [PubMed] [Google Scholar]
- 35.Giles K, Wildgoose J, Pringle S, Langridge DJ, Nixon P, Garside J. & Carney P: Characterizing a T-Wave enabled multi-pass cyclic ion mobility separator. Proceedings of the 63rd American Society for Mass Spectrometry Conference, June 2015, St. Louis, MO [Google Scholar]
- 36.Giles K, Ujma J, Wildgoose J, Green M, Richardson K, Langridge DJ & Tomczyk N: Design and performance of a second-generation cyclic ion mobility enabled Q-TOF. Proceedings of the 65th American Society for Mass Spectrometry Conference, June 2017, Indianapolis, IN [Google Scholar]
- 37.Merenbloom SI, Glaskin RS, Henson ZB & Clemmer DE: High-resolution ion cyclotron mobility spectrometry. Anal. Chem 81, 1482–1487 (2009). [DOI] [PMC free article] [PubMed] [Google Scholar]
- 38.Deng L, Ibrahim YM, Hamid AM, Garimella SVB, Webb IK, Zheng X, Prost SA, Sandoval JA, Norheim RV, Anderson GA, Tolmachev AV, Baker ES & Smith RD: Ultra-High Resolution Ion Mobility Separations Utilizing Traveling Waves in a 13 m Serpentine Path Length Structures for Lossless Ion Manipulations Module. Anal. Chem 88, 8957–8964 (2016). [DOI] [PMC free article] [PubMed] [Google Scholar]
- 39.Deng L, Webb IK, Garimella SVB, Hamid AM, Zheng X, Norheim RV, Prost SA, Anderson GA, Sandoval JA, Baker ES, Ibrahim YM & Smith RD: Serpentine Ultralong Path with Extended Routing (SUPER) High Resolution Traveling Wave Ion Mobility-MS using Structures for Lossless Ion Manipulations. Anal. Chem 89, 4628–4634 (2017). [DOI] [PMC free article] [PubMed] [Google Scholar]
- 40.Ikemoto T, Haze A, Hatano H, Kitamoto Y, Ishida M. & Nara K: Phosphorylation of Nucleosides with Phosphorus Oxychloride in Trialkyl Phosphate. Chem. Pharm. Bull 43, 210–215 (1995). [Google Scholar]
- 41.Kenderdine T, Xia Z, Williams ER & Fabris D: Submicrometer Nanospray Emitters Provide New Insights into the Mechanism of Cation Adduction to Anionic Oligonucleotides. Anal. Chem 90, 13541–13548 (2018). [DOI] [PMC free article] [PubMed] [Google Scholar]
- 42.Lippens JL, Mangrum JB, McIntyre W, Redick B. & Fabris D: A simple heated-capillary modification improves the analysis of non-covalent complexes by Z-spray electrospray ionization. Rapid Commun. Mass Spectrom 30, 773–783 (2016). [DOI] [PMC free article] [PubMed] [Google Scholar]
- 43.Ujma J, Ropartz D, Giles K, Richardson K, Langridge D, Wildgoose J, Green M. & Pringle S: Cyclic Ion Mobility Mass Spectrometry Distinguishes Anomers and Open-Ring Forms of Pentasaccharides. J. Am. Soc. Mass Spectrom (2019).doi: 10.1007/s13361-019-02168-9 [DOI] [PMC free article] [PubMed]
- 44.Crain PF: Mass spectrometric techniques in nucleic acid research. Mass Spectrom Rev 9, 505–554 (1990). [Google Scholar]
- 45.Dodds JN, May JC & McLean JA: Correlating Resolving Power, Resolution, and Collision Cross Section: Unifying Cross-Platform Assessment of Separation Efficiency in Ion Mobility Spectrometry. Anal. Chem 89, 12176–12184 (2017). [DOI] [PMC free article] [PubMed] [Google Scholar]
- 46.Giles K, Ujma J, Wildgoose J, Pringle S, Richardson K, Langridge D. & Green M: A Cyclic Ion Mobility-Mass Spectrometry System. Anal. Chem (2019).doi: 10.1021/acs.analchem.9b01838 [DOI] [PubMed]
- 47.Zheng X, Aly NA, Zhou Y, Dupuis KT, Bilbao A, Paurus VL, Orton DJ, Wilson R, Payne SH, Smith RD & Baker ES: A structural examination and collision cross section database for over 500 metabolites and xenobiotics using drift tube ion mobility spectrometry. Chem. Sci 8, 7724–7736 (2017). [DOI] [PMC free article] [PubMed] [Google Scholar]
Associated Data
This section collects any data citations, data availability statements, or supplementary materials included in this article.


