Figure 3.

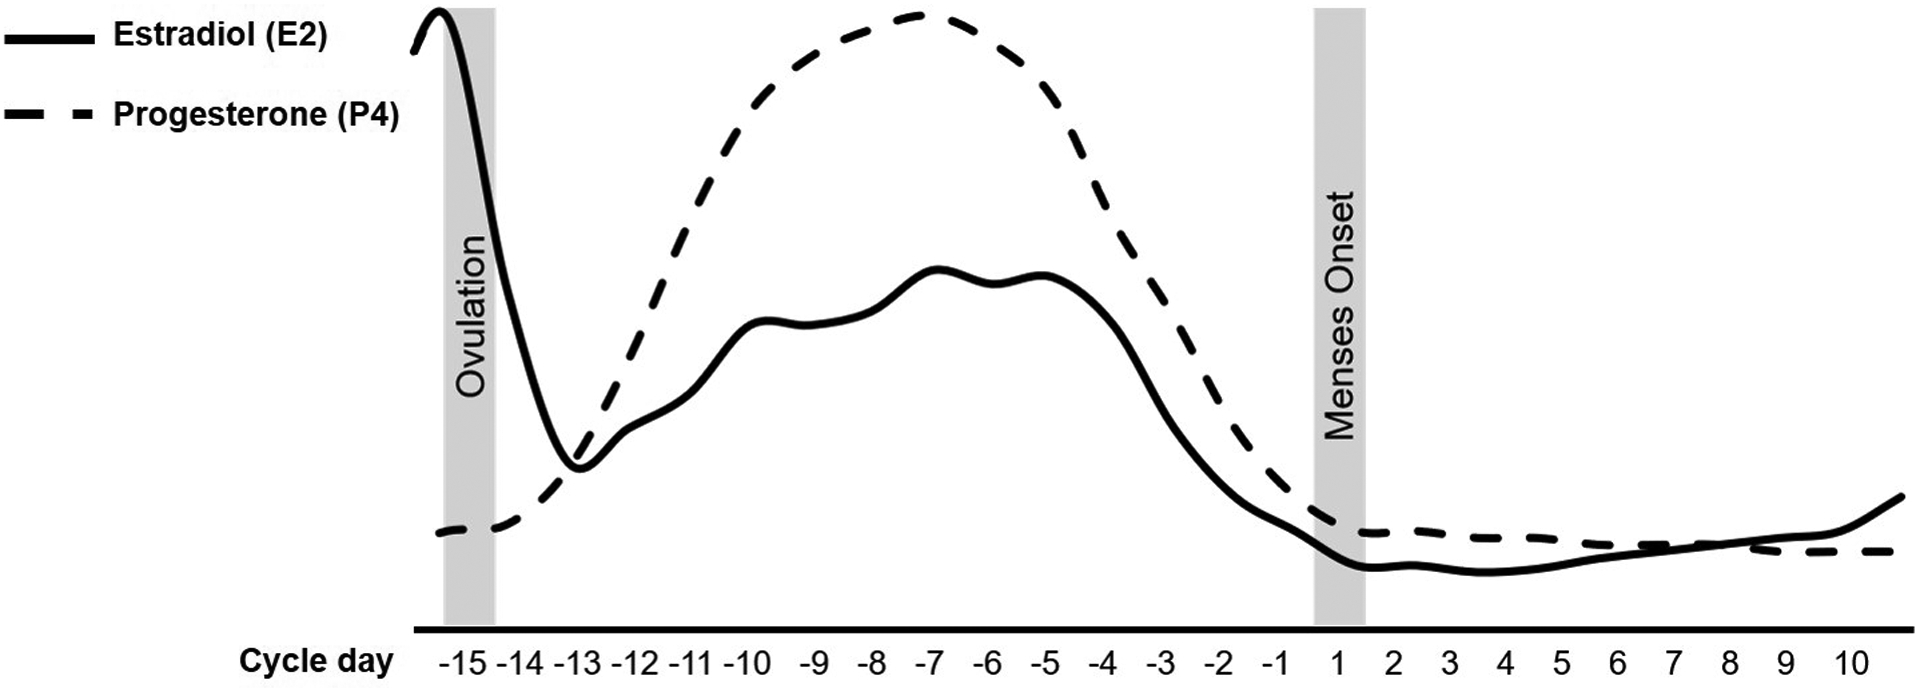
Recommended graphing method for visualizing menstrual cycle effects on person-centered outcomes across the full span of the cycle day variable (from −15 to +10, where menstrual onset is day +1 and there is no day 0).

Recommended graphing method for visualizing menstrual cycle effects on person-centered outcomes across the full span of the cycle day variable (from −15 to +10, where menstrual onset is day +1 and there is no day 0).