

Abstract
The U.S. has experienced a dramatic rise in opioid addiction and opioid-overdose deaths in recent years. We investigate the effect of the opioid epidemic at the local level on nonmarital fertility using aggregate- and individual-level analyses. Opioid-overdose death rates and prescriptions per capita are used as indicators of the intensity of the opioid epidemic. We estimate area-fixed effects models to test the effect of the opioid epidemic on nonmarital birth rates obtained from vital statistics for the years 2000-2016. We find an increase in nonmarital birth rates in communities that experienced a rise in opioid-overdose deaths and higher prescription rates. Our analyses also show that the local effect of the opioid epidemic is not driven by a reduction in marriage rates, and that marital birth rates are unaffected. Individual-level data from the ACS 2008-2016 are then used to further assess the potential causal mechanisms and to test heterogeneous effects by education and race-ethnicity. Our findings suggest that the opioid epidemic increased nonmarital birth rates through social disruptions primarily affecting unmarried women, but not through changes in their economic condition.
Keywords: Nonmarital fertility, opioid epidemic, marriage, family formation
The opioid epidemic is one of the greatest public health challenges facing the United States today (Gladden et al., 2016; Kolodny et al., 2015). According to the Substance Abuse and Mental Health Services Administration, more than 11 million people misused some type of opioid in 2017, accounting for nearly 5% of the total population aged 12 or older (SAMHSA, 2018). The rate of deaths due to opioid overdose has increased by 200 percent since 2000 (Rudd et al., 2016). This dramatic uptake was initially fueled by changes in medical prescription practices (Dasgupta et al., 2018; Kenan et al., 2012). Beginning in the late 1990s restrictions on the use of opioids for the treatment of chronic pain were substantially curtailed as pharmaceutical companies led campaigns to make opioid prescriptions a more acceptable strategy for pain management (Vadivelu et al., 2018). Because of the addictive nature of opioids, this large-scale change in treatment practices resulted in a sharp rise in the rate of abuse and misuse. The increase in prescription opioids also contributed to a growth in the use of illicit opioids such as heroin, particularly after 2010 (Cicero et al., 2014; Kolodny et al., 2015; Vadivelu et al., 2018). The introduction of fentanyl to the U.S. illicit drug market in 2013 further accelerated the growth in the number of deaths attributed to opioid overdose.
Previous studies have found that opioid-dependence has profound detrimental effects on the lives of affected individuals (Sansone et al., 2012; Scarpati et al., 2017; Scherrer et al., 2016; Terplan et al., 2015), and that drug addiction has the potential to disrupt social and economic conditions at the family- and community-levels (Birnbaum et al. 2011; Copello, Templeton, and Powell 2010; Krueger 2016). However, despite a growing body of research assessing the health-related causes and consequences of opioid misuse, we still know little about its effect on family formation and childbearing patterns in the United States in general, and on nonmarital fertility in particular. Assessing the effects of the opioid epidemic on nonmarital fertility is key to understanding the social and intergenerational repercussions of the opioid epidemic because unmarried mothers and their children are particularly vulnerable to poverty and economic hardship (McLanahan & Kelly, 2006).
The opioid epidemic may affect nonmarital fertility through multiple channels. Compared to their married counterparts, unmarried women are more likely to misuse opioids (SAMHDA, 2019), and opioid-dependence has been linked to a higher risk of unintended pregnancy and to a greater unmet need for contraception (Terplan et al., 2015). Opioid-dependent men are more likely to become perpetrators of intimate partner violence (IPV) (Moore et al., 2011). IPV has in turn been shown to decrease women’s contraceptive access and use (Gee et al., 2009). Drug dependence is linked to loss of work productivity and employment instability (Hasselt et al., 2015; Sansone et al., 2012), to higher probability of involvement in criminal activities (Bennett et al., 2008; Lo & Stephens, 2002), and to higher risk of incarceration (Kopak et al., 2014).
These factors are all negatively associated with men’s perceived suitability as long-term partners (Lopoo & Western, 2005; Smock et al., 2005). Opioid use among men may therefore decrease the availability of marriageable partners, thereby potentially contributing to an increase in nonmarital fertility through a decrease in marriage opportunities for women.
At the community level, the opioid epidemic has been shown to reduce labor force participation rates (Krueger, 2016). Deteriorating economic conditions triggered by a rise in opioid abuse may contribute to a decline in childbearing since negative economic shocks have been linked to lower birth rates (Schneider, 2015). The opioid crisis may also alter fertility rates at the community level by increasing mortality (Nobles et al., 2015) and criminal violence (Carter et al., 2018). Violent crime and the visible presence of drug users and dealers has the potential to erode social cohesion and collective efficacy (Harding 2009; Markowitz et al. 2001). Exposure to violent environments, increased local mortality, and lower collective efficacy have in turn been linked to changes in the timing of the transition to motherhood and to a higher probability of experiencing a nonmarital birth (D. J. Harding, 2009; Johns, 2011; Nobles et al., 2015).
In this paper we assess the impact of the local opioid epidemic on nonmarital fertility among young women of reproductive age. Our analysis covers the years 2000 to 2016, which encompass three distinctive stages of the opioid epidemic: an initial stage in which increased opioid use was driven by prescription drugs (2000-2010), a second stage characterized by a rise in heroin addiction (2011-2013); and a third stage marked by the growth of synthetic opioids (2014-2016). Our analytical strategy involves both aggregate- and individual-level analyses to estimate the effect of local opioid-overdose death rates (ODRs) on nonmarital birth rates and on the probability of having a birth among never married women. We explore differences in the effect of the opioid epidemic on the fertility of never married women of different race-ethnicity and level of education. To better understand the mechanisms linking the opioid epidemic to nonmarital fertility, we also assess its effects on potential mediators, such as marriage rates and employment. In the following sections we first review the sociodemographic patterns of the opioid epidemic. We then discuss the possible mechanisms through which changes in local opioid misuse may affect nonmarital fertility.
The Opioid Epidemic in the United States
Approximately 11.4 million people were misusing opioids in the United States in 2017 (SAMHSA, 2018), accounting for nearly 5% of the total population aged 12 or older. Increasing misuse and abuse of opioids in the last two decades have led to staggering death rates. Between 1999 and 2017, approximately 400,000 people died as a result of an opioid overdose (Scholl et al., 2019). In 2017, more individuals died from opioid overdose than due to gun violence or motor vehicle accidents (CDC, 2019c). Mortality rates due to opioid overdose vary significantly geographically and across demographic groups. Figure 1 shows county-level opioid-overdose death rates in 2000-2003 and 2014-2016. Although opioid overdose deaths were high in both the eastern and western parts the country by 2014-2016, they increased more dramatically in the East, particularly in counties within the Appalachian region. According to our own calculations using restricted vital statistics data (NVSS, 2018), the rise in the opioid-overdose death rate has been highest among older adults aged 25 and over, followed by those aged 20-24. By contrast, the overdose deaths for adolescents have remained low and flat since 2000.
Figure 1. Opioid Overdose Death Rate (per 100,000) in 2000-2003 (above) and 2014-2016 (below).
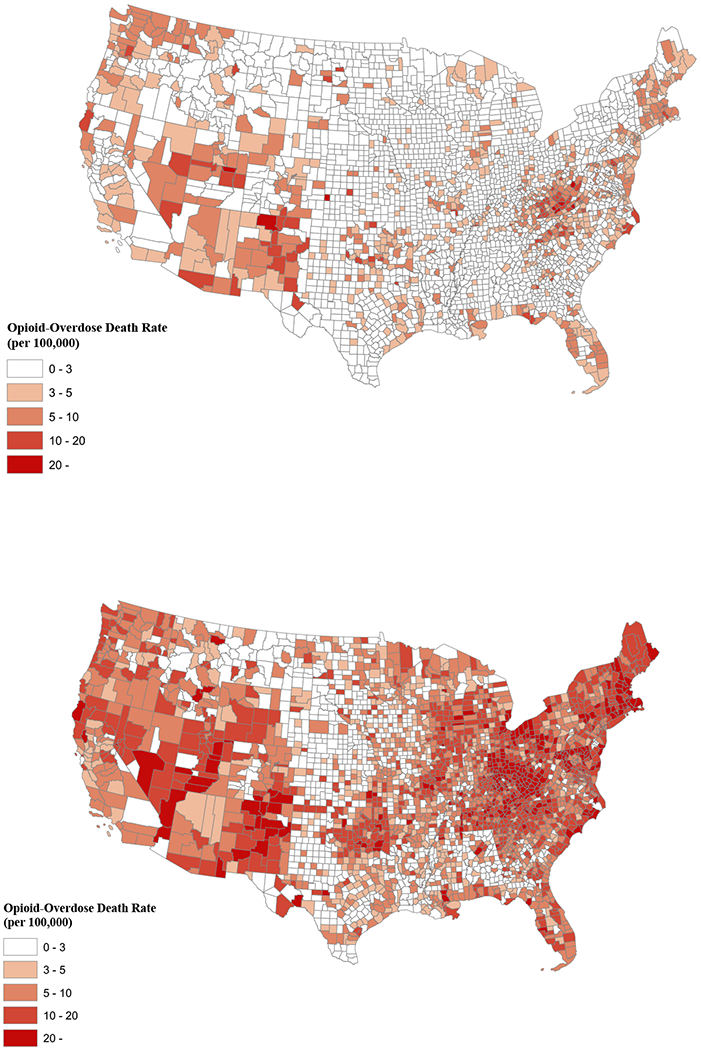
Notes: Authors’ calculations based on data from the National Vital Statistics System (NVSS, 2018). 3-year averages for 2000-2003 and 2014-2016 were used to smooth out yearly fluctuations.
The rate of death due to opioid overdose is especially high among non-Hispanic whites. As shown in Figure 2, non-Hispanic whites experienced the sharpest increase in the ODR during the initial phase of the epidemic when deaths were driven by prescription opioids. The ODR for blacks remained stable until 2010 when the opioid mortality rate for whites was twice as high as that for blacks (Alexander et al., 2018). Racial disparities in the ODR during this period partly reflect differences in health insurance coverage, which initially made opioid pain relievers more accessible to whites (Hansen 2016), and to biases against minority patients in the prescription of opioid pain medications (Singhal, Tien, and Hsia 2016). However, after 2010 the ODR for both blacks and whites increased sharply, now driven by heroin use and, more recently, by the use of synthetic opioids such as fentanyl (Alexander et al., 2018). The ODR for Hispanics has been comparatively lower for most of the time period, but has started to increase in recent years (Shiels et al., 2018).
Figure 2. Opioid-Overdose Death Rates (per 100,000) for Non-Hispanic Whites, Non-Hispanic Blacks, and Hispanics, 2000-2016.

Notes: Authors’ calculations based on data from the National Vital Statistics System (NVSS, 2018). Values represent yearly national opioid-overdose death rates.
Finally, the opioid epidemic has also had a differential effect by gender. As shown in Figure 3, the ODR for men is considerably higher than that for women during the entire time period. However, rates of opioid dependence and overdose have been rising rapidly among women (Ho, 2017; Mazure & Fiellin, 2018; McHugh et al., 2013). Women are more likely to receive an opioid prescription to manage pain, to be prescribed higher doses, and to use opioids for longer periods than men (CDC, 2013). A study of opioid-dependent women and men found that women become dependent more quickly (Back et al., 2011). Closely related to the uptake in opioids misuse among women, the rate of deliveries to women with an opioid-use disorder quadrupled between 1999 and 2014 (Haight, 2018).
Figure 3. Opioid-Overdose Death Rates (per 100,000) for Women and Men, 2000-2016.

Notes: Authors’ calculations based on data from the National Vital Statistics System (NVSS, 2018). Values represent yearly national opioid-overdose death rates.
Individual, Family, and Community Level Effects of Substance Use Disorders
The opioid epidemic may affect the proximate determinants of fertility—sexual activity and contraceptive use—through several direct and indirect channels. Studies using small samples of women enrolled or screened to enroll in opioid treatment programs have found that more than 80% of the pregnancies among this population group were unintended (Black et al., 2012; Heil et al., 2011). This is about twice the share of pregnancies that are unintended among the overall population (Guttmacher Institute, 2019). The high prevalence of unintended pregnancies among opioid-dependent women appears to be driven by a higher probability of risky sexual activity. Previous studies have found that opioid-dependent women have low rates of contraceptive use (Black et al., 2012), and low probabilities of using more effective contraceptive methods such as the hormonal pill, compared to non-dependent women (Cornford et al., 2015; Terplan et al., 2015). Qualitative evidence from interviews with opioid-dependent women in the United Kingdom suggests that one of the reasons for failing to use contraception is a low perceived risk of pregnancy, and that opioid-dependent women often welcome motherhood as an opportunity to control their drug use (C. Harding & Ritchie, 2003). In addition, Black et al. (2012) found that among the sexually active opioid-dependent women they interviewed, more than 30% reported having had sex in exchange for money or drugs, and 44% reported having had sex while intoxicated in the last year. According to the 2017 National Survey on Drug Use and Health, 73% of female adult respondents who reported suffering from opioid dependence or abuse in the previous year were unmarried, compared to 54% of non-dependent respondents (SAMHDA, 2019). To the extent that unmarried women are overrepresented among opioid abusers, the opioid epidemic may disproportionately increase nonmarital fertility.
Previous research also shows that opioid-dependent men are more likely to engage in sexual, physical, and psychological violence against their partners (Moore et al., 2011). Intimate partner violence has in turn been shown to decrease women’s contraceptive access and use (Gee et al., 2009). Women who fear violence from their partner are at a disadvantage when negotiating condom use, and are more vulnerable to forced sex, reproductive coercion, and birth control sabotage (Bergmann & Stockman, 2015). Thus, women’s victimization due to their partners’ opioid use may increase their risk of an unintended pregnancy. Moreover, because unmarried women who are cohabiting are at higher risk of experiencing intimate partner violence compared to their married counterparts (Manning et al., 2018), the effect of opioid use due to IPV may be higher on nonmarital fertility.
In addition to directly affecting the proximate determinants of fertility, such as contraceptive use and sexual activity, opioid misuse and abuse can potentially influence nonmarital fertility through more indirect channels, such as employment instability and criminal activity. Opioid abuse and misuse have been linked to greater workplace absenteeism (Birnbaum et al., 2011; Hasselt et al., 2015; Inocencio et al., 2013). Employees who abuse prescription drugs are more likely to miss days of work, which reduces overall productivity, strains work relations, and increases costs for employers (Hasselt et al., 2015). Abuse of prescription medications has also been linked to unstable employment trajectories, and a greater probability of being fired (Sansone et al., 2012). A long line of research has shown that a lack of financial resources, primarily among men, is an important reason why unmarried couples decide to postpone or forego marriage (Gibson-Davis et al., 2005; Smock et al., 2005). Employment instability among men may reduce the likelihood of marriage, thereby increasing the time that sexually active women spend being at risk of a nonmarital pregnancy (South & Lloyd, 1992).
Opioid-dependent individuals are also at higher risk of committing criminal offenses and becoming involved with the criminal justice system (Bennett et al., 2008). Criminal activity is often used as a way to obtain drugs for personal use (Lo & Stephens, 2002). The stigma attached to a criminal background reduces individuals’ marriageability (Lopoo & Western, 2005; Van Schellen et al., 2012). As in the case of employment instability, an increase in the population with a criminal background may reduce the pool of marriageable partners in affected communities, thereby deterring women from getting married without necessarily reducing or postponing their fertility.
The consequences of the opioid epidemic are not limited to individuals with opioid use disorders. Family members who do not abuse opioids themselves may nevertheless lose working hours due to the time burden of caring for an opioid-dependent relative (Copello et al., 2010). Compared to non-abusing patients, the healthcare excess costs for patients suffering from opioid overdose or poisoning, abuse, and dependence range from $18,000 to $44,000 dollars over the immediate two-year period after diagnosis (Scarpati et al., 2017). The families of opioid-dependent individuals may suffer economically as a result of these unexpected healthcare expenses.
The negative economic effects of the opioid epidemic may also have community-level implications. Several studies have found that areas with higher opioid prescription rates have experienced reductions in labor force participation and increases in unemployment among women and men (Aliprantis et al., 2019; Harris et al., 2019; Krueger, 2016). Local level unemployment and poverty rates have been shown to be spatially correlated with the ODR (Ghertner & Groves, 2018). The negative economic shocks caused by the opioid epidemic may contribute to greater economic uncertainty at the household- and community levels. Economic uncertainty has in turn been linked to reductions and delays in fertility for women of any marital status (Cherlin et al., 2013; Schneider, 2015; Schneider & Hastings, 2015).
Finally, other disruptions in the social environment induced by the opioid epidemic may cause behavioral and psychological responses among individuals, which may lead to changes in their sexual activity and contraceptive behavior. Past studies have shown that neighborhoods with high illicit drug-market activity promote social environments where other disorderly conduct such as prostitution, gambling, and public drunkenness also take place (Weisburd and Mazerolle 2000). Together, these transgressions can create widespread fear among community members, and consequently reduce social cohesion and collective efficacy (LaGrange et al., 1992; Markowitz et al., 2001). Lower neighborhood collective efficacy is in turn associated with higher nonmarital teenage fertility in some types of neighborhoods (Way et al., 2006). Opioid-drug activity has also been shown to be spatially correlated with violent crime (Carter et al., 2018), and neighborhood violence has been linked to a greater probability of adolescent pregnancy, possibly due to the psychological distress caused by a greater perceived risk of victimization and uncertainty about the future (D. J. Harding, 2009; Johns, 2011). Previous studies have documented that women increase their fertility and accelerate family formation if they perceive a dramatic increase in mortality in their communities (Nobles et al., 2015). Having an opioid-dependent family member may also induce depression (Ray et al., 2009), which has been associated with contraceptive inconsistency (Hall et al., 2013).
To summarize, the opioid epidemic may affect nonmarital fertility through several channels. Opioid abuse is linked to lower and inconsistent contraceptive use and greater probability of engaging in risky sex. Because unmarried women are more likely to abuse opioids than their married counterparts, these mechanisms are likely to disproportionately increase nonmarital fertility. Opioid-dependence is also associated with employment instability, criminal involvement and incarceration, which may reduce the availability of male marriageable partners, thereby increasing the risk of a nonmarital birth among unmarried women. Finally, the opioid epidemic may bring about community-level economic decline, social disorder, and higher violent victimization rates. Regardless of their opioid use or marital status, women may change their sexual activity and contraceptive use to reduce their fertility in response to economic uncertainty, but may also increase it in response to reduced collective efficacy and increased violence and social disorder. In the analysis below we test the association between opioid use at the local level and marital and nonmarital birth rates. To specifically assess whether the effect of the opioid epidemic on fertility is mediated by increased barriers to marriage, we also test its effect on local marriage rates. Beyond being a potential causal mechanism linking the opioid epidemic to family formation patterns, changes in socioeconomic status and local economic conditions can precede both of these phenomena and act as a confounder instead (Case & Deaton, 2015; Ghertner & Groves, 2018; Hollingsworth et al., 2017; Monnat, 2019). Our analytical strategy will incorporate several strategies to account for this and other potential sources of confounding.
Data and Methods
Aggregate-level Analysis
We use vital statistics records for the years 2000-2016 to compute nonmarital birth rates per 1,000 women for each Consistent Public Use Microdata Area (CPUMA) and year (NVSS 2018). CPUMAs are the smallest geographical units that can be identified consistently over time from census microdata samples. They are defined based on the aggregation of PUMAs1 (Ruggles et al., 2019a). Because vital statistics records are only available at the county level, we converted the county-level information into CPUMAs.2 Each CPUMA encompasses territories of at least 100,000 residents (Ruggles et al., 2019a). Using CPUMAs instead of counties as the unit of analysis avoids volatile and unreliable minority ODRs due to very small subpopulation sizes. Because CPUMAs can be geographically smaller than counties, we sometimes had to assign the same county-level ODR to all the CPUMAs included within the same county. To account for CPUMAs that are not independent within counties, all of our models cluster standard errors by county. As a robustness check, we replicated our main models using counties as units of analysis instead of CPUMAs (see Table A1 in Online Appendix) and reached the same conclusions.
Our final dataset comprises 18,190 CPUMA-years. We focused on births to women aged 20-34, because we are primarily interested in nonmarital childbearing, and women who experience nonmarital childbearing have a high probability of transitioning to motherhood by age 35 (England, Shafer, and Wu 2012, Driscoll et al. 2017). We excluded adolescent women from our analyses because adolescents have been the age group least affected by the opioid epidemic, and have had low opioid-overdose death levels and a flat trend since 2000.
Vital statistics records are based on data from birth certificates, which collect information about mother’s age and marital status at the time of birth. We used this information to calculate the total number of nonmarital births for women aged 20-34, for each CPUMA-year. Although the U.S. Census Bureau computes yearly local population estimates, it does not make them available by marital status. For this reason, the age-specific population estimates of married and unmarried women in each CPUMA-year used as denominators in our birth rates were obtained from the 1-year samples of the American Community Survey (ACS) and from the 5-percent sample of the 2000 census (Ruggles et al., 2018). Such values were available for years 2000, and 2005-2016, and were interpolated for years 2001-2004.
We use opioid-overdose death rates to approximate the degree of opioid abuse in a community. ODRs in each county and year are estimated using data from death certificates compiled in restricted-use vital statistics files. Using the ODR to approximate opioid misuse and abuse at the local level has several advantages, such as not relying on personal accounts, which may be subject to underreporting. ODRs also capture deaths due to overdose by both prescription and illegal opioids. An additional advantage of using overdose deaths to approximate the strength of the opioid epidemic is that they specifically allow us to produce estimates for different sociodemographic groups and different types of opioids, including illicit ones. Other recent studies have used the local ODRs as a measure of the strength of the opioid epidemic (Carter et al., 2018; Ho, 2017; Rigg et al., 2018). We calculated separate ODRs per 100,000 for the entire population, and for each gender and ethnoracial category of the deceased. To differentiate overdose deaths involving fentanyl from those that did not, we also constructed an ODR that included only deaths that involved synthetic opioids, and a separate ODR that excluded overdose deaths in which a synthetic opioid was listed among the multiple causes of death. Particularly after 2013, overdose deaths involving synthetic opioids have been primarily driven by fentanyl (O’Donnell et al., 2017). Thus, for simplicity, we will refer to our synthetic-opioid overdose category as fentanyl-related overdose deaths.
We follow the CDC guidelines for identifying fatalities due to opioid overdoses (Seth et al., 2018). Deaths with underlying causes X40–44 (unintentional), X60–64 (suicide), X85 (homicide), or Y10–Y14 (undetermined intent) were included if the multiple causes were: opium (T40.0), heroin (T40.1), natural/semisynthetic opioids (T40.2), methadone (T40.3), synthetic opioids other than methadone (T40.4); and other and unspecified narcotics (T40.6).3 Following CDC guidelines, we identified deaths due to fentanyl and other synthetic opioids by only selecting cases where the multiple cause identified was T40.4 (synthetic opioids other than methadone) (O’Donnell et al., 2017). We used county-year population estimates from the U.S. Census Bureau by age and sex to compute denominators for each county and year. To calculate race-specific ODRs, we used the NCHS bridged population estimates for Non-Hispanic Blacks, Non-Hispanic Whites, and Hispanics as denominators (CDC, 2019b). We converted these variables to CPUMA-years as described above.
Although ODRs capture overdose deaths due to any type of opioid, regardless of whether it is sold legally, they may disproportionately reflect the most extreme cases of opioid abuse and misuse. To conduct a robustness check of our analyses using a measure that may capture less extreme forms of opioid misuse, we estimated models using the quantity of opioids prescribed per person and year in each CPUMA. Because ODRs since 2010 have been mostly driven by heroin and fentanyl use (Vadivelu et al., 2018), the amount of prescribed opioids in a community is likely to capture patterns of misuse and dependence that may not always lead to death by overdose. We obtained information regarding the total amount of sales of the two leading opioid prescription medications (oxycodone and hydrocodone) for each CPUMA per year from the U.S. Drug Enforcement Administration’s Automated Reports and Consolidated Ordering System (ARCOS) for years 2000-2016.4 The total sales of both medications were converted into equivalent grams of morphine using the CDC’s morphine milligram equivalent (MME) conversion table (CDC, 2019a). We then divided the total grams of morphine by the total population (per 100 residents). Opioid prescription rates are particularly effective in capturing the initial phase of the opioid epidemic that was driven mostly by prescription opioids. However, compared to the ODR, they are a less accurate measure of the opioid epidemic in later years. In addition, unlike the ODR, opioid prescription rates cannot be calculated specifically by gender or race-ethnicity, and do not capture the use of opioids such as heroin or black-market fentanyl.
For these reasons, we rely on the local ODR (total, by sex, and by type of opioid) as our primary predictor, and use the prescription rates only as an additional measure to check the robustness of our findings. Our models include a series of time-varying CPUMA-level controls obtained from the 1-year samples of the American Community Survey: the percentage of the population with and without completed high school, the percentage that is unemployed, the percentage receiving government income assistance5, the average household income, and the percentage that is non-Hispanic black, Hispanic, and foreign born. We also control for the population density in the CPUMA (defined as the total population per square mile), and the sex ratio (number of men aged 25-39 per 1,000 women aged 20-34). In addition to including these time-varying predictors, our models combine several strategies to account for potential unobserved confounders. First, we introduce CPUMA fixed effects to control for heterogeneity in unmeasured factors such as social norms and values, geographical features, and labor market characteristics that do not change over time and that affect both opioid abuse and fertility rates. Second, we also include year fixed effects to capture national trends in unobserved factors that may be associated with both the opioid epidemic and fertility, such as macroeconomic changes, that may not be captured by our time-varying controls. Third, we include interactions between year indicators and state dummy variables. These interactions capture state-specific trends in factors that may not be measured by our time-varying controls and that might predict both fertility and opioid misuse and abuse.6 After accounting for all of these potential sources of confounding, and controlling for CPUMA-level time-varying controls, our models rely on the remaining time-variation within CPUMAs to estimate the causal effect of the opioid epidemic.
Our aggregate models are weighted using the CPUMA population size in 2000, to obtain estimates that are representative of the national average. We lagged the ODR by two years in our birth rate models to capture the local opioid misuse conditions during the year prior to conception. The CPUMA-level time-varying controls are always measured a year before the ODR, so they are lagged by three years. These controls are lagged by an additional year relative to the treatment because it is important that they strictly measure pre-treatment conditions that may act as confounders, instead of potential mediators that are themselves caused by the treatment. As will be described below, we re-estimated our main models using an alternative lag structure as a robustness check.
Individual-level Analysis
We pooled the 1-year samples of the ACS for the years 2008-2016 (Ruggles et al. 2018) to assemble an individual-level dataset of 1,014,955 never married white, Black, and Hispanic women aged 20-34 at the time of interview. Because the ACS only started asking whether female household residents had experienced a birth in the past 12 months in 2008, we limited our individual-level analysis to the years 2008-2016. We used these data to estimate linear probability models where having a birth in the last year is the outcome, and the ODR in the respondent’s CPUMA of residence is the main predictor. We use total, race-specific, male, and female ODRs as predictors of interest. Black and Hispanic subsamples were restricted to individuals living in CPUMAs where at least 15% of residents were of their same race-ethnicity, so that race-specific ODRs could be reliably estimated.
Because the outcome measures the probability of having a birth in the previous 12 months, and we are interested in capturing any exposure to the opioid epidemic previous to the corresponding pregnancies, we lagged the ODR by three years in order to capture the local opioid misuse conditions during the year prior to conception. The CPUMA-level time-varying controls were measured a year before the ODR. Our individual-level models allow us to assess whether the effect of the opioid epidemic on the fertility of never married women varied by level of education, and race and ethnicity. We estimated separate models for white, black, and Hispanic women with different levels of education who had never been married. We defined women as “more educated” if they had completed four years of college or more, and “less educated” if they had up to some college. All of our individual-level models control for respondent’s age, number of own children living in the household (biological, adopted, or step-children), insurance coverage, whether they were born outside the U.S., whether they lived in a household with income below the poverty line, and for less educated respondents, whether they had completed high school. All of these individual controls were measured at the time of interview. The models also include all of the CPUMA-level time-varying controls included in the aggregate models. Finally, the models include CPUMA and year fixed effects, and state by year interactions, to account for time-invariant and time-varying unobserved heterogeneity. All individual models use the appropriate survey weights to produce population-representative estimates.
Assessment of Causal Mechanisms
We created a series of additional outcome variables that allowed us to examine potential causal mechanisms or mediators linking the opioid epidemic to nonmarital fertility. First, to assess whether the opioid epidemic has affected fertility in general, or only nonmarital fertility, we estimated our models using marital birth rates as an alternative outcome. Second, to assess if increased barriers to marriage mediate the relationship between the opioid epidemic and nonmarital fertility, we estimated additional models using marriage rates as an outcome. We calculated local marriage rates per 1,000 unmarried women using the 1-year samples of the ACS. Because the ACS introduced the question about whether respondents got married during the previous year in 2008, this analysis could only be conducted for the years 2008-2016. Finally, to test whether the effect of the opioid epidemic is mediated by economic factors, we used individual-level data from the ACS 1-year samples to estimate the association between the local ODR in the previous year and three measures of economic wellbeing, separately for women and men: the probability of being employed at the time of interview among respondents in the labor force; the probability of living in a household with income below the poverty line; and total household income. We used linear models and restricted this analysis to never married women aged 20-34, and to never married men aged 20-39, because the latter likely includes the group of actual and potential male partners for women in the specified age group. As a robustness check, we estimated models for never married men in the same age range used for women (20-34). In the analyses for both marriage rates and economic indicators, we lagged the ODR by one year, and local controls by two years, so that they are measured strictly before the ODR.
Results
Aggregate-level Analysis
Table 1 shows weighted means for all of the variables used in our aggregate analysis at the CPUMA-level for the period 2000-2016. Differences in the race- and gender-specific ODRs confirm that the opioid epidemic has been concentrated among the non-Hispanic white and male populations. The ODR due to the synthetic opioid fentanyl is much lower than the ODR due to other opioids during this time period, which is partly explained by the fact that fentanyl was not introduced to the U.S. illicit drug market until 2013.
Table 1.
Descriptive statistics of all CPUMAs, 2000-2016
| Mean | SD | |
|---|---|---|
| Fertility and marriage rates (per 1,000 women) | ||
| Nonmarital birth rate | 63.98 | 20.10 |
| Marital birth rate | 167.93 | 36.52 |
| Marriage rate | 64.87 | 32.16 |
| Opioid-overdose death rates (per 100,000 pop.) | ||
| Opioid-overdose death rate | 6.64 | 5.71 |
| Female opioid-overdose death rate | 4.46 | 4.03 |
| Male opioid-overdose death rate | 8.91 | 7.97 |
| Non-Hispanic white opioid-overdose death rate | 8.55 | 6.84 |
| Hispanic opioid-overdose death rate | 3.07 | 5.25 |
| Non-Hispanic black opioid-overdose death rate | 4.93 | 9.43 |
| Fentanyl-overdose death rate | 1.24 | 2.69 |
| Non-Fentanyl opioid-overdose death rate | 5.39 | 4.10 |
| Opioid prescription rates (grams per 100 pop.) | ||
| Prescribed morphine rate | 39.15 | 23.92 |
| Sociodemographic characteristics | ||
| Percentage of population with less than HS education | 20.24 | 5.51 |
| Percentage of population with HS | 57.56 | 8.20 |
| Percentage of population with BA or more | 22.20 | 10.72 |
| Percentage of unemployed population | 8.97 | 3.72 |
| Average household income | 53.62 | 15.63 |
| Percentage receiving public assistance | 1.56 | 1.03 |
| Percentage of non-Hispanic white population | 65.10 | 21.25 |
| Percentage of Hispanic population | 15.15 | 15.94 |
| Percentage of non-Hispanic black population | 12.57 | 12.30 |
| Percentage of foreign-born population | 13.23 | 11.80 |
| Population per square mile | 29.10 | 85.61 |
| Sex ratio (men aged 25-39 per 1,000 women aged 20-34) | 1012.66 | 96.53 |
| Observations | 18,190 | |
|
| ||
Notes: Data obtained from the National Vital Statistics System (NVSS 2018) and 1-year samples of the American Community Survey (Ruggles et al. 2018). Marriage rate is only available for years 2008-2016 (9,630 CPUMA-years).
Table 2 shows weighted descriptive statistics for never married women aged 20-34 interviewed by the ACS, by race-ethnicity and education level for the period 2008-2016. The average ODRs in the CPUMA in which women in this age group resided varied substantially, with less and more educated white and black women being exposed to the highest local ODRs, while Hispanic women live in areas relatively less affected by the opioid epidemic.
Table 2.
Average characteristics of never married women aged 20-34 in the United States by education level, 2008-2016
| Less educated |
More educated |
|||||
|---|---|---|---|---|---|---|
| White | Black | Hispanic | White | Black | Hispanic | |
| Individual characteristics (%) | ||||||
| Had premarital birth last year | 5.6 | 9.9 | 8.1 | 1.0 | 3.8 | 2.6 |
| Employed ± | 89.6 | 78.8 | 86.7 | 95.5 | 91.9 | 93.4 |
| Age | ||||||
| 20-24 | 59.3 | 45.5 | 51.8 | 32.8 | 23.7 | 29.6 |
| 25-29 | 26.3 | 31.6 | 29.4 | 45.4 | 44.2 | 45.3 |
| 30-34 | 14.3 | 22.9 | 18.8 | 21.9 | 32.1 | 25.1 |
| Education | ||||||
| Less than High School | 6.5 | 11.3 | 17.6 | 0.0 | 0.0 | 0.0 |
| High School | 93.5 | 88.7 | 82.4 | 0.0 | 0.0 | 0.0 |
| College | 0.0 | 0.0 | 0.0 | 100.0 | 100.0 | 100.0 |
| Foreign-born | 3.2 | 5.9 | 31.2 | 5.1 | 10.1 | 22.2 |
| Number of own children living in household | ||||||
| None | 77.2 | 54.9 | 64.6 | 95.3 | 78.3 | 87.4 |
| One | 13.6 | 20.5 | 16.4 | 3.4 | 14.7 | 8.5 |
| Two or more | 9.3 | 24.6 | 19.0 | 1.2 | 7.0 | 4.1 |
| Has health insurance coverage | 78.6 | 72.5 | 61.5 | 91.2 | 84.1 | 81.4 |
| Household income (in thousands) + | 50.5 | 31.1 | 43.1 | 70.9 | 52.7 | 64.4 |
| Lives in household with income below poverty line | 28.8 | 39.0 | 31.1 | 11.8 | 12.0 | 11.1 |
| Opioid-overdose death rates in CPUMA (per 100,000 pop.) | ||||||
| Opioid-overdose death rate | 9.1 | 8.3 | 6.0 | 9.1 | 8.1 | 6.2 |
| Female opioid-overdose death rate | 6.4 | 5.5 | 4.0 | 5.9 | 5.2 | 3.9 |
| Male opioid-overdose death rate | 11.9 | 11.4 | 8.2 | 12.4 | 11.3 | 8.6 |
| Non-Hispanic white opioid-overdose death rate | 11.2 | 12.4 | 10.0 | 11.5 | 12.4 | 10.2 |
| Hispanic opioid-overdose death rate | 4.0 | 3.3 | 3.7 | 4.4 | 3.4 | 4.1 |
| Non-Hispanic black opioid-overdose death rate | 6.4 | 5.2 | 5.2 | 7.4 | 5.5 | 5.5 |
| Fentanyl-overdose death rate | 2.1 | 2.0 | 0.8 | 2.2 | 2.0 | 1.1 |
| Non-Fentanyl opioid-overdose death rate | 7.0 | 6.3 | 5.2 | 6.9 | 6.1 | 5.1 |
| Opioid prescription rates in CPUMA (grams per 100 pop.) | ||||||
| Prescribed morphine rate | 52.1 | 49.4 | 36.5 | 47.0 | 45.1 | 34.5 |
| Sociodemographic characteristics of CPUMA | ||||||
| Percentage of population with less than HS education | 18.7 | 20.4 | 23.6 | 16.7 | 19.2 | 20.9 |
| Percentage of population with HS | 58.6 | 57.8 | 56.1 | 51.7 | 54.8 | 53.3 |
| Percentage of population with BA or more | 22.7 | 21.9 | 20.3 | 31.6 | 26.1 | 25.8 |
| Percentage of unemployed population | 9.7 | 12.7 | 10.9 | 8.9 | 11.7 | 10.1 |
| Average household income (in thousands) | 261.7 | 253.5 | 206.3 | 272.9 | 247.6 | 214.6 |
| Percentage receiving public assistance | 1.5 | 1.8 | 1.8 | 1.5 | 1.7 | 1.7 |
| Percentage of non-Hispanic white population | 71.5 | 49.8 | 37.3 | 63.6 | 46.1 | 36.1 |
| Percentage of Hispanic population | 12.2 | 13.3 | 42.6 | 15.1 | 15.5 | 41.8 |
| Percentage of non-Hispanic black population | 11.1 | 32.0 | 10.6 | 13.9 | 32.4 | 12.2 |
| Percentage of foreign-born population | 10.5 | 13.2 | 27.5 | 15.1 | 16.7 | 29.6 |
| Population per square mile | 15.5 | 54.4 | 69.5 | 60.1 | 80.6 | 104.9 |
| Sex ratio (men aged 25-39 per 1,000 women aged 20-34) | 993.8 | 1017.8 | 1073.3 | 1051.5 | 1048.4 | 1097.0 |
| Observations | 462,970 | 117,398 | 130,849 | 253,360 | 25,985 | 24,393 |
|
| ||||||
Notes: Data obtained from the National Vital Statistics System (NVSS 2018) and 1-year samples of the American Community Survey (Ruggles et al. 2018).
Percentage among population in the labor force.
Household income is given in constant 1999 dollars.
Models 1a to 4b in Table 3 show the results of CPUMA fixed-effects models using the total, female, and male ODRs to predict nonmarital birth rates, while controlling for local sociodemographic conditions. Models 5a and 5b break down the ODR according to whether the deaths can be attributed to fentanyl- and non-fentanyl-opioids. Models 6a and 6b include the local opioid prescription rate as a predictor. A model with and without time-varying controls is presented for each combination of measures of the opioid epidemic. All models include CPUMA fixed effects, year fixed effects, and state-year interactions. The results indicate a positive and statistically significant association between the local ODR and higher nonmarital birth rates. The coefficients from the models without local controls show that the association between the different types of ODR and nonmarital birth rates varies from 0.10 to 0.38. Once local controls are included in the models, the coefficients are somewhat smaller, but remain statistically significant. This suggests that time-varying local sociodemographic conditions explain part of the association observed in the models with no controls. According to model 1b, for example, every increase of 1 opioid overdose death per 100,000 population is associated with 0.17 more nonmarital births per 1,000 unmarried women. Based on our calculations using vital statistics data, between 2000 and 2016 opioid-overdose deaths increased by 10 per 100,000 nationally. This change corresponds to an increase of approximately 1.7 nonmarital births per 1,000 unmarried women. This is a very sizable effect, that represents about 14% of the steep decline in the nonmarital birth rate observed for women aged 20-34 between 2010 and 2016 in the United States. Thus, our findings suggest that the decline in nonmarital fertility observed over the past decade might have been even steeper had the opioid epidemic not occurred.
Table 3.
CPUMA fixed effects models using total and gender-specific opioid-overdose death rates to predict nonmarital birth rates per 1,000 women, 2000-2016
| Nonmarital Birth Rate per 1,000 Women |
||||||||||||
|---|---|---|---|---|---|---|---|---|---|---|---|---|
| 1a | 1b | 2a | 2b | 3a | 3b | 4a | 4b | 5a | 5b | 6a | 6b | |
| Opioid-overdose death rates (per 100,000 pop.) in CPUMA (year y-2) | ||||||||||||
| ODR | 0.23 *** | 0.17** | 0.21** | 0.15* | ||||||||
| [0.07] | [0.06] | [0.07] | [0.06] | |||||||||
| Female ODR | 0.22*** | 0.16** | 0.15** | 0.11* | ||||||||
| [0.06] | [0.06] | [0.05] | [0.05] | |||||||||
| Male ODR | 0.14** | 0.10* | 0.10* | 0.07 | ||||||||
| [0.05] | [0.04] | [0.05] | [0.04] | |||||||||
| Fentanyl ODR | 0.38* | 0.30 | ||||||||||
| [0.16] | [0.15] | |||||||||||
| Non-Fentanyl ODR | 0.21** | 0.15* | ||||||||||
| [0.08] | [0.07] | |||||||||||
| Opioid prescription rates (grams per 100 pop.) (year y-3) | ||||||||||||
| Prescribed morphine rate | 0.04** | 0.04** | ||||||||||
| [0.02] | [0.01] | |||||||||||
| Sociodemographic characteristics of CPUMA (year y-3) | ||||||||||||
| % with <HS | 0.19** | 0.19** | 0.19** | 0.19** | 0.19** | 0.20** | ||||||
| [0.07] | [0.07] | [0.07] | [0.07] | [0.07] | [0.07] | |||||||
| % with HS | 0.21*** | 0.21*** | 0.21*** | 0.21*** | 0.21*** | 0.21*** | ||||||
| [0.06] | [0.06] | [0.06] | [0.06] | [0.06] | [0.06] | |||||||
| % unemployed | 0.21*** | 0.21*** | 0.21*** | 0.21*** | 0.21*** | 0.20*** | ||||||
| [0.05] | [0.05] | [0.05] | [0.05] | [0.05] | [0.06] | |||||||
| % Hispanic | −1.19*** | −1.18*** | −1.20*** | −1.19*** | −1.19*** | −1.21*** | ||||||
| [0.33] | [0.34] | [0.33] | [0.33] | [0.33] | [0.33] | |||||||
| % Non-Hispanic black | 0.79** | 0.81** | 0.79** | 0.79** | 0.79** | 0.78** | ||||||
| [0.25] | [0.25] | [0.25] | [0.25] | [0.25] | [0.25] | |||||||
| % foreign-born | −0.02 | −0.01 | −0.02 | −0.02 | −0.02 | −0.02 | ||||||
| [0.09] | [0.09] | [0.09] | [0.09] | [0.09] | [0.09] | |||||||
| Average household income | 0.14* | 0.14* | 0.14* | 0.14* | 0.14* | 0.14* | ||||||
| [0.05] | [0.06] | [0.05] | [0.05] | [0.05] | [0.05] | |||||||
| % public assistance | 0.06 | 0.06 | 0.07 | 0.06 | 0.06 | 0.05 | ||||||
| [0.23] | [0.23] | [0.23] | [0.23] | [0.23] | [0.23] | |||||||
| Population per square mile | −0.30*** | −0.31*** | −0.30*** | −0.30*** | −0.29*** | −0.29*** | ||||||
| [0.09] | [0.09] | [0.09] | [0.09] | [0.09] | [0.09] | |||||||
| Sex ratio | −0.01 | −0.01 | −0.01 | −0.01 | −0.01 | −0.01 | ||||||
| [0.01] | [0.01] | [0.01] | [0.01] | [0.01] | [0.01] | |||||||
| CPUMA Fixed Effects | Yes | Yes | Yes | Yes | Yes | Yes | Yes | Yes | Yes | Yes | Yes | Yes |
| Year Fixed Effects | Yes | Yes | Yes | Yes | Yes | Yes | Yes | Yes | Yes | Yes | Yes | Yes |
| State*Year Fixed Effects | Yes | Yes | Yes | Yes | Yes | Yes | Yes | Yes | Yes | Yes | Yes | Yes |
| Observations | 14,980 | 14,980 | 14,980 | 14,980 | 14,980 | 14,980 | 14,980 | 14,980 | 14,980 | 14,980 | 14,980 | 14,980 |
|
| ||||||||||||
Notes: Nonmarital birth rates are restricted to women aged 20-34. Birth rates and opioid-overdose death rates were calculated using data from the National Vital Statistics System (NVSS 2018). Local controls were obtained from the 1-year samples of the American Community Survey (Ruggles et al. 2018). Analyses were conducted at the CPUMA-level. Standard errors clustered by county.
p<0.05,
p<0.01,
p<0.001.
Standard errors in brackets.
We test the association between nonmarital birth rates and female and male ODRs in separate models, and then include both predictors in the same model (models 4a and 4b). We find that when both female and male ODR are included, only the female ODR has a significant effect on women’s nonmarital fertility. This suggests that opioid misuse and abuse among women is an important causal mechanism linking the opioid epidemic to increased nonmarital fertility, possibly because it promotes risky sexual behaviors and lower contraceptive use, whereas men’s opioid use is not a relevant mediator.
Models 5a and 5b in Table 3 break down the total ODR based on whether the deaths are fentanyl- and non-fentanyl-related and show that although the fentanyl-related ODR coefficient is twice as large, only the non-fentanyl ODR is significant after including all controls. When we include the fentanyl ODR and the non-fentanyl ODR separately, their coefficients are significant and only slightly larger than in the model with both measures (results not shown), which suggests that both the fentanyl-driven overdose deaths and those due to other types of opioids are measuring different aspects of the opioid epidemic. Models 6a and 6b in Table 3 include both the total ODR and the rate of prescribed grams of morphine per 100 population as predictors. Both the total ODR and the opioid prescription rate in model 6b are significantly associated with a higher nonmarital birth rate. The coefficient for the total ODR in model 6b is only slightly smaller than in the model in which no other measures of the opioid epidemic are included (model 1b). The coefficient for prescribed grams of morphine similarly does not change in magnitude or significance when the total ODR is excluded from the model (results not shown). These findings again suggest that the total ODR and the opioid prescription rate are also capturing different aspects of the opioid epidemic.
Table 4 shows analogous models predicting marital birth rates. In contrast to the nonmarital birth rate models, none of the ODR or opioid prescription rate measures are significantly associated with marital birth rates, regardless of whether local time-varying controls are included in the models. The opioid epidemic therefore only appears to have affected the fertility of unmarried women. To examine whether the opioid epidemic is reducing the pool of marriageable partners for local women, we also tested models using women’s marriage rate as an outcome. The results are shown in Table 5. Once again, none of the ODR or opioid prescription rate measures are significantly associated with the marriage rate, which suggests that the opioid epidemic is not increasing the barriers to marriage in affected communities.7 The opioid epidemic therefore appears to lead to higher nonmarital fertility by increasing the number of births to unmarried women rather than by decreasing women’s probability of marriage. It follows that any mechanisms linking the opioid epidemic with increasing nonmarital fertility are operating through changes in the sexual or contraceptive behavior of unmarried women and their sexual partners.
Table 4.
CPUMA fixed effects models using total and gender-specific opioid-overdose death rates to predict marital birth rates per 1,000 women, 2000-2016
| Marital Birth Rate per 1,000 Women |
||||||||||||
|---|---|---|---|---|---|---|---|---|---|---|---|---|
| 1a | 1b | 2a | 2b | 3a | 3b | 4a | 4b | 5a | 5b | 6a | 6b | |
| Opioid-overdose death rates (per 100,000 pop.) in CPUMA (year y-2) | ||||||||||||
| ODR | 0.01 | −0.03 | −0.02 | −0.05 | ||||||||
| [0.13] | [0.13] | [0.13] | [0.13] | |||||||||
| Female ODR | 0.13 | 0.08 | 0.21 | 0.15 | ||||||||
| [0.13] | [0.12] | [0.13] | [0.12] | |||||||||
| Male ODR | −0.05 | −0.06 | −0.1 | −0.11 | ||||||||
| [0.09] | [0.09] | [0.10] | [0.09] | |||||||||
| Fentanyl ODR | 0.46 | 0.35 | ||||||||||
| 0.46 | 0.35 | |||||||||||
| Non-Fentanyl ODR | −0.06 | −0.09 | ||||||||||
| [0.14] | [0.14] | |||||||||||
| Opioid prescription rates (grams per 100 pop.) (year y-3) | ||||||||||||
| Prescribed morphine rate | 0.06 | 0.05 | ||||||||||
| [0.04] | [0.04] | |||||||||||
| Sociodemographic characteristics of CPUMA (year y-3) | ||||||||||||
| % with <HS | 0.08 | 0.08 | 0.07 | 0.07 | 0.08 | 0.08 | ||||||
| [0.24] | [0.24] | [0.24] | [0.24] | [0.24] | [0.24] | |||||||
| % with HS | 0.32 | 0.32 | 0.32 | 0.32 | 0.32 | 0.33 | ||||||
| [0.19] | [0.19] | [0.19] | [0.19] | [0.19] | [0.19] | |||||||
| % unemployed | 1.06*** | 1.06*** | 1.06*** | 1.06*** | 1.06*** | 1.04*** | ||||||
| [0.26] | [0.26] | [0.26] | [0.26] | [0.26] | [0.26] | |||||||
| % Hispanic | −1.43* | −1.42* | −1.42* | −1.41* | −1.42* | −1.45* | ||||||
| [0.64] | [0.64] | [0.64] | [0.64] | [0.64] | [0.64] | |||||||
| % Non-Hispanic black | −1.52* | −1.53* | −1.51* | −1.51* | −1.52* | −1.53* | ||||||
| [0.66] | [0.66] | [0.66] | [0.66] | [0.66] | [0.66] | |||||||
| % foreign-born | −0.51 | −0.51 | −0.51 | −0.51 | −0.51 | −0.52 | ||||||
| [0.30] | [0.30] | [0.30] | [0.30] | [0.30] | [0.30] | |||||||
| Average household income | −0.32* | −0.32* | −0.32* | −0.32* | −0.32* | −0.32* | ||||||
| [0.16] | [0.16] | [0.16] | [0.16] | [0.16] | [0.16] | |||||||
| % public assistance | −0.75 | −0.76 | −0.75 | −0.76 | −0.74 | −0.76 | ||||||
| [0.86] | [0.86] | [0.86] | [0.86] | [0.86] | [0.86] | |||||||
| Population per square mile | −0.60* | −0.59* | −0.61* | −0.60* | −0.59* | −0.59* | ||||||
| [0.27] | [0.27] | [0.27] | [0.27] | [0.27] | [0.27] | |||||||
| Sex ratio | 0.00 | 0.00 | 0.00 | 0.00 | 0.00 | 0.00 | ||||||
| [0.02] | [0.02] | [0.02] | [0.02] | [0.02] | [0.02] | |||||||
| CPUMA Fixed Effects | Yes | Yes | Yes | Yes | Yes | Yes | Yes | Yes | Yes | Yes | Yes | Yes |
| Year Fixed Effects | Yes | Yes | Yes | Yes | Yes | Yes | Yes | Yes | Yes | Yes | Yes | Yes |
| State*Year Fixed Effects | Yes | Yes | Yes | Yes | Yes | Yes | Yes | Yes | Yes | Yes | Yes | Yes |
| Observations | 14,980 | 14,980 | 14,980 | 14,980 | 14,980 | 14,980 | 14,980 | 14,980 | 14,980 | 14,980 | 14,980 | 14,980 |
|
| ||||||||||||
Notes: Marital birth rates are restricted to women aged 20-34. Birth rates and opioid-overdose death rates were calculated using data from the National Vital Statistics System (NVSS 2018). Local controls were obtained from the 1-year samples of the American Community Survey (Ruggles et al. 2018). Analyses were conducted at the CPUMA-level. Standard errors clustered by county.
p<0.05,
p<0.01,
p<0.001.
Standard errors in brackets.
Table 5.
CPUMA fixed effects models using total and gender-specific opioid-overdose death rates to predict marriage rates per 1,000 women, 2008-2016
| Marriage Rate per 1,000 Women |
||||||||||||
|---|---|---|---|---|---|---|---|---|---|---|---|---|
| 1a | 1b | 2a | 2b | 3a | 3b | 4a | 4b | 5a | 5b | 6a | 6b | |
| Opioid-overdose death rates (per 100,000 pop.) in CPUMA (year y-1) | ||||||||||||
| ODR | 0.19 | 0.26 | 0.18 | 0.26 | ||||||||
| [0.17] | [0.17] | [0.17] | [0.17] | |||||||||
| Female ODR | 0.07 | 0.12 | −0.03 | 0.00 | ||||||||
| [0.19] | [0.19] | [0.21] | [0.21] | |||||||||
| Male ODR | 0.15 | 0.2 | 0.16 | 0.20 | ||||||||
| [0.11] | [0.11] | [0.12] | [0.12] | |||||||||
| Fentanyl ODR | −0.12 | −0.03 | ||||||||||
| [0.41] | [0.42] | |||||||||||
| Non-Fentanyl ODR | 0.25 | 0.32 | ||||||||||
| [0.20] | [0.20] | |||||||||||
| Opioid prescription rates (grams per 100 pop.) (year y-2) | ||||||||||||
| Prescribed morphine rate | 0.01 | 0.02 | ||||||||||
| [0.03] | [0.03] | |||||||||||
| Sociodemographic characteristics of CPUMA (year y-2) | ||||||||||||
| % with <HS | −0.04 | −0.04 | −0.04 | −0.04 | −0.04 | −0.04 | ||||||
| [0.23] | [0.23] | [0.23] | [0.23] | [0.23] | [0.23] | |||||||
| % with HS | 0.01 | 0.01 | 0.01 | 0.01 | 0.01 | 0.01 | ||||||
| [0.16] | [0.16] | [0.16] | [0.16] | [0.16] | [0.16] | |||||||
| % unemployed | −0.19 | −0.19 | −0.19 | −0.19 | −0.19 | −0.19 | ||||||
| [0.16] | [0.16] | [0.16] | [0.16] | [0.16] | [0.16] | |||||||
| % Hispanic | 0.47 | 0.46 | 0.44 | 0.44 | 0.46 | 0.46 | ||||||
| [0.92] | [0.92] | [0.92] | [0.92] | [0.92] | [0.92] | |||||||
| % Non-Hispanic black | −1.90* | −1.83* | −1.92* | −1.92* | −1.88* | −1.87* | ||||||
| [0.93] | [0.93] | [0.93] | [0.93] | [0.94] | [0.94] | |||||||
| % foreign-born | 0.09 | 0.09 | 0.09 | 0.09 | 0.09 | 0.09 | ||||||
| [0.27] | [0.27] | [0.27] | [0.27] | [0.27] | [0.27] | |||||||
| Average household income | −0.1 | −0.1 | −0.1 | −0.1 | −0.1 | −0.1 | ||||||
| [0.14] | [0.14] | [0.14] | [0.14] | [0.14] | [0.14] | |||||||
| % public assistance | 0.35 | 0.35 | 0.37 | 0.37 | 0.35 | 0.35 | ||||||
| [0.62] | [0.62] | [0.62] | [0.62] | [0.62] | [0.62] | |||||||
| Population per square mile | 0.51** | 0.49** | 0.51** | 0.51** | 0.51** | 0.52** | ||||||
| [0.16] | [0.16] | [0.16] | [0.16] | [0.16] | [0.16] | |||||||
| Sex ratio | 0.01 | 0.01 | 0.01 | 0.01 | 0.01 | 0.01 | ||||||
| [0.02] | [0.02] | [0.02] | [0.02] | [0.02] | [0.02] | |||||||
| CPUMA Fixed Effects | Yes | Yes | Yes | Yes | Yes | Yes | Yes | Yes | Yes | Yes | Yes | Yes |
| Year Fixed Effects | Yes | Yes | Yes | Yes | Yes | Yes | Yes | Yes | Yes | Yes | Yes | Yes |
| State*Year Fixed Effects | Yes | Yes | Yes | Yes | Yes | Yes | Yes | Yes | Yes | Yes | Yes | Yes |
| Observations | 9,630 | 9,630 | 9,630 | 9,630 | 9,630 | 9,630 | 9,630 | 9,630 | 9,630 | 9,630 | 9,630 | 9,630 |
|
| ||||||||||||
Notes: Marriage rates are restricted to women aged 20-34, and were calculated per 1,000 women who were never married at the beginning of the year. Marriage rates are only available for years 2008-2016. Opioid-overdose death rates were calculated using data from the National Vital Statistics System (NVSS 2018). Marriage data and local controls were obtained from the 1-year samples of the American Community Survey (Ruggles et al. 2018). Analyses were conducted at the CPUMA-level. Standard errors clustered by county.
p<0.05
p<0.01
p<0.001.
Standard errors in brackets.
Robustness Checks
Although our analyses use CPUMAs as the primary geographic unit, we also prepared a county-level dataset to conduct a robustness check of our main aggregate models. Our findings in Tables 3 and 4 were replicated using county-level data (see Table A1 in Online Appendix). However, we prefer our estimates based on CPUMA-level data, because they guarantee a critical population size per geographic unit and avoid volatility in birth rates in very small counties. Using our CPUMA-level dataset, we also replicated Tables 3 and 4 using the same lag for controls as for the ODR, and thus measuring all predictors in year y-2 (see Table A3 in Online Appendix). Results are nearly identical to those in Tables 3 and 4.
Although in our main analyses we restricted the age range in birth rates and marriage rates to women aged 20-34 to facilitate the theoretical interpretation of our results, it is worth noting that our findings were robust to expanding our sample to include women aged 15-19 (see Table A4 in Online Appendix), and to restricting the sample to only adolescent women (results not shown). Similarly, our results were robust to excluding opioid-overdose deaths that were ruled as homicides or suicides from our estimates of the local ODR (see Table A5 in Online Appendix). To assess whether our findings were potentially generalizable to overall drug abuse, we re-estimated our models for nonmarital birth rates using as the main predictor the overdose death rate due to any type of drug with abuse potential.8 These models show that an increase in overall drug overdose deaths at the local level increases the non-marital birth rate among women aged 20-34 (see Table A2 in Online Appendix), which suggests that the effects we identify are generalizable to overall drug abuse. However, these results should be interpreted with caution. Unlike opioids, abuse of some of these other substances entails a lower risk of death, and thus their corresponding overdose death rates are a less appropriate measure of the prevalence of their use in a community. Finally, we estimated separate models by region, and for urban and rural CPUMAs, based on the percentage of the population living in metropolitan areas released by the Economic Research Service of the U.S. Department of Agriculture (USDA, 2016). These results suggest that the opioid epidemic has had similar effects on family formation in both urban and rural areas, and stronger effects in the Appalachian region (see Table A6 in the Online Appendix).
Individual-level Analysis
Table 6 shows three panels with the main results from our individual-level linear probability models for white, black, and Hispanic never married women, respectively. All models include CPUMA and year fixed effects, and state by year interactions. Each panel in Table 6 presents separate models for women with high and low education levels. Model 1 in the first panel shows that for less educated never married white women, a higher ODR significantly increases the probability of experiencing a birth in the previous year. Specifically, an increase of 1 death per 100,000 due to opioid-overdose is associated with an increase of 0.07 percentage points in the probability of having a birth. According to the descriptive statistics presented in Table 2, the average probability that a less educated and never married white woman between the ages of 20-34 will have a birth in a given year is 5.6%. Since the ODR increased by 10 per 100,000 between 2000 and 2016, Model 1 suggests that less educated never married white women would have experienced an increase of 0.7 percentage points in their probability of having a birth as a consequence of the opioid epidemic throughout this period. This represents an increase of about 13% in their average probability of having a baby during the 2008-2016 period.
Table 6.
Linear probability models with CPUMA fixed effects using total, gender- and race-specific opioid-overdose death rates to predict having a premarital birth in the previous year by education level, among never married non-Hispanic white, non-Hispanic black, and Hispanic women, 2008-2016
| Non-Hispanic White Women | ||||||||||
|---|---|---|---|---|---|---|---|---|---|---|
| Less Educated Women (HS or less) |
More Educated Women (College or more) |
|||||||||
| 1 | 2 | 3 | 4 | 5 | 6 | 7 | 8 | 9 | 10 | |
|
|
|
|||||||||
| Opioid-overdose death rates (per 100,000 pop.) in CPUMA (year y-3) | ||||||||||
| ODR | 0.0007*** | 0.0003 | ||||||||
| [0.0002] | [0.0002] | |||||||||
| Non-Hispanic white ODR | 0.0005** | 0.0002 | ||||||||
| [0.0002] | [0.0001] | |||||||||
| Female ODR | 0.0009*** | 0.0008** | 0.0002 | 0.0001 | ||||||
| [0.0002] | [0.0002] | [0.0002] | [0.0002] | |||||||
| Male ODR | 0.0003* | 0.0001 | 0.0002 | 0.0002 | ||||||
| [0.0002] | [0.0002] | [0.0001] | [0.0001] | |||||||
| Individual-level controls (year y) | Yes | Yes | Yes | Yes | Yes | Yes | Yes | Yes | Yes | Yes |
| CPUMA-level controls (year y-4) | Yes | Yes | Yes | Yes | Yes | Yes | Yes | Yes | Yes | Yes |
| CPUMA Fixed Effects | Yes | Yes | Yes | Yes | Yes | Yes | Yes | Yes | Yes | Yes |
| Year Fixed Effects | Yes | Yes | Yes | Yes | Yes | Yes | Yes | Yes | Yes | Yes |
| State*Year Fixed Effects | Yes | Yes | Yes | Yes | Yes | Yes | Yes | Yes | Yes | Yes |
| Observations | 462,970 | 462,970 | 462,970 | 462,970 | 462,970 | 253,360 | 253,360 | 253,360 | 253,360 | 253,360 |
| Non-Hispanic Black Women | ||||||||||
|---|---|---|---|---|---|---|---|---|---|---|
| Less Educated Women (HS or less) |
More Educated Women (College or more) |
|||||||||
| 1 | 2 | 3 | 4 | 5 | 6 | 7 | 8 | 9 | 10 | |
|
|
|
|||||||||
| Opioid-overdose death rates (per 100,000 pop.) in CPUMA (year y-3) | ||||||||||
| ODR | 0.0012 | 0.0006 | ||||||||
| [0.0007] | [0.0012] | |||||||||
| Non-Hispanic black ODR | 0.000 | 0.0014 | ||||||||
| [0.0007] | [0.0009] | |||||||||
| Female ODR | 0.0009 | 0.0005 | −0.0008 | −0.0014 | ||||||
| [0.0008] | [0.0009] | [0.0014] | [0.0014] | |||||||
| Male ODR | 0.0007 | 0.0006 | 0.0008 | 0.0011 | ||||||
| [0.0005] | [0.0005] | [0.0007] | [0.0007] | |||||||
| Individual-level controls (year y) | Yes | Yes | Yes | Yes | Yes | Yes | Yes | Yes | Yes | Yes |
| CPUMA-level controls (year y-4) | Yes | Yes | Yes | Yes | Yes | Yes | Yes | Yes | Yes | Yes |
| CPUMA Fixed Effects | Yes | Yes | Yes | Yes | Yes | Yes | Yes | Yes | Yes | Yes |
| Year Fixed Effects | Yes | Yes | Yes | Yes | Yes | Yes | Yes | Yes | Yes | Yes |
| State*Year Fixed Effects | Yes | Yes | Yes | Yes | Yes | Yes | Yes | Yes | Yes | Yes |
| Observations | 117,398 | 117,398 | 117,398 | 117,398 | 117,398 | 25,985 | 25,985 | 25,985 | 25,985 | 25,985 |
| Hispanic Women | ||||||||||
|---|---|---|---|---|---|---|---|---|---|---|
| Less Educated Women (HS or less) |
More Educated Women (College or more) |
|||||||||
| 1 | 2 | 3 | 4 | 5 | 6 | 7 | 8 | 9 | 10 | |
|
|
|
|||||||||
| Opioid-overdose death rates (per 100,000 pop.) in CPUMA (year y-3) | ||||||||||
| ODR | 0.0006 | −0.0001 | ||||||||
| [0.0008] | [0.0013] | |||||||||
| Hispanic ODR | −0.0011 | 0.0013 | ||||||||
| [0.0007] | [0.0012] | |||||||||
| Female ODR | 0.0009 | 0.001 | −0.0011 | −0.0018 | ||||||
| [0.0009] | [0.0010] | [0.0013] | [0.0014] | |||||||
| Male ODR | 0.0001 | −0.0001 | 0.0004 | 0.001 | ||||||
| [0.0005] | [0.0006] | [0.0010] | [0.0010] | |||||||
| Individual-level controls (year y) | Yes | Yes | Yes | Yes | Yes | Yes | Yes | Yes | Yes | Yes |
| CPUMA-level controls (year y-4) | Yes | Yes | Yes | Yes | Yes | Yes | Yes | Yes | Yes | Yes |
| CPUMA Fixed Effects | Yes | Yes | Yes | Yes | Yes | Yes | Yes | Yes | Yes | Yes |
| Year Fixed Effects | Yes | Yes | Yes | Yes | Yes | Yes | Yes | Yes | Yes | Yes |
| State*Year Fixed Effects | Yes | Yes | Yes | Yes | Yes | Yes | Yes | Yes | Yes | Yes |
| Observations | 130,849 | 130,849 | 130,849 | 130,849 | 130,849 | 24,393 | 24,393 | 24,393 | 24,393 | 24,393 |
Notes: Sample was restricted to women aged 20-34. Controls for individual characteristics include respondent’s age, number of own children living in the household, insurance coverage, whether the household income is below the poverty level, and whether respondents were born outside the U.S. For less educated respondents, we also control for whether they had completed high school. All of these individual controls were measured at the time of interview (year y). Controls for sociodemographic characteristics at the CPUMA level include the percentage of the population that has less than high school, percentage of the population that has high school, average household income, the percentage population that is unemployed, the percentage that receives public assistance income, and the percentage Non-Hispanic black, Hispanic, and foreign born. We also included controls for the population density in the CPUMA (total population per square mile), and the sex ratio (number of men aged 25-39 per women aged 20-34). Local controls were measured in year y-4. Data obtained from the 1-year samples of the American Community Survey (Ruggles et al. 2018) and the National Vital Statistics System (NVSS 2018). Standard errors are clustered by CPUMA.
p<0.05
p<0.01
p<0.001.
Standard errors in brackets.
Increases in the white ODR and in the female ODR are also associated with significant increases in the probability of experiencing a birth among less educated never married white women (models 2 and 3, first panel of Table 6). Model 4 shows that the male ODR is positively associated with the probability of giving birth among never married women, but the magnitude of this coefficient is less than half that of the female ODR in Model 2. When both the female and male ODR are included as predictors in model 5, the magnitude of the female ODR coefficient is almost the same as the magnitude of the total ODR in model 1, and still significant, whereas the male ODR has no significant association with the probability of a birth. Consistent with findings from our aggregate-level models, the results of our individual-level models suggest that the local female ODR is a more important predictor of premarital fertility than the male ODR.
Models 6 to 10 in the first panel of Table 6 replicate the models discussed above, but now for more educated never married white women. The association between each of the ODR measures and the probability of experiencing a birth is always nonsignificant. The second and third panels in Table 6 show analogous linear probability models for non-Hispanic black and Hispanic never married women, respectively. None of the ODR measures is a significant predictor of the probability of having a birth in the previous year among Hispanic or Black women of any education level. Overall, our individual-level analyses suggest that the positive association between the ODR and nonmarital birth rates in the aggregate models is explained by births to white women with less education, and that the family formation patterns of this group are the most vulnerable to the opioid epidemic.9
Finally, to assess whether the effect of the opioid epidemic on nonmarital fertility may be mediated by the economic consequences of the epidemic, we estimated linear models in which individuals’ employment status, household income, and whether they live in a household with income below the poverty line are used as dependent variables. These models are restricted to less educated never married women and men because our findings indicate that they bear the greatest consequences of the opioid epidemic in terms of disruptions in family formation patterns. The first three columns in Table 7 show the results of the linear models for never married women aged 20-34 by race-ethnicity. The next three columns show models for never married men aged 20-39 by race-ethnicity. The ODR has a nonsignificant effect on the probability that white, black, or Hispanic women are employed or live in a household with income below the poverty line, and has a nonsignificant effect on their reported household income as well. The same is true for white, black, and Hispanic men. Our findings for men were replicated when the sample was restricted to ages 20-34, which is the same age range used for the female sample (see Table A7 in Online Appendix). These results do not support the hypothesis that the effects of the opioid epidemic on the nonmarital fertility of women aged 20-34 are driven by changes in economic conditions.
Table 7.
Linear models with CPUMA fixed effects using total opioid-overdose death rates to predict being employed, household income, and living in a household with income below the poverty line, by race-ethnicity, among never married less educated women and never married less educated men
| Women Aged 20-34 |
Men Aged 20-39 |
|||||
|---|---|---|---|---|---|---|
| White | Black | Hispanic | White | Black | Hispanic | |
|
|
|
|||||
| Opioid-Overdose Death Rate (per 100,000 pop.) in CPUMA (year y-3) | ||||||
| Employed | ||||||
| ODR | 0.0001 | 0.0001 | 0.0012 | −0.0003 | −0.0002 | 0.0013 |
| [0.0003] | [0.0008] | [0.0013] | [0.0003] | [0.0010] | [0.0011] | |
| CPUMA-level controls (year y-2) | Yes | Yes | Yes | Yes | Yes | Yes |
| CPUMA Fixed Effects | Yes | Yes | Yes | Yes | Yes | Yes |
| Year Fixed Effects | Yes | Yes | Yes | Yes | Yes | Yes |
| State*Year Fixed Effects | Yes | Yes | Yes | Yes | Yes | Yes |
| Household Income ꓕ | ||||||
| ODR | 2.9487 | −11.9756 | 37.3391 | −12.2588 | −101.578 | 49.7555 |
| [35.0447] | [72.5272] | [136.8263] | [32.1129] | [72.0312] | [123.2651] | |
| CPUMA-level controls (year y-2) | Yes | Yes | Yes | Yes | Yes | Yes |
| CPUMA Fixed Effects | Yes | Yes | Yes | Yes | Yes | Yes |
| Year Fixed Effects | Yes | Yes | Yes | Yes | Yes | Yes |
| State*Year Fixed Effects | Yes | Yes | Yes | Yes | Yes | Yes |
| Living in a Household with Income below Poverty Line | ||||||
| ODR | −0.0003 | 0.0006 | 0.0013 | −0.0001 | 0.0017 | 0.0004 |
| [0.0005] | [0.0010] | [0.0014] | [0.0003] | [0.0013] | [0.0010] | |
| CPUMA-level controls (year y-2) | Yes | Yes | Yes | Yes | Yes | Yes |
| CPUMA Fixed Effects | Yes | Yes | Yes | Yes | Yes | Yes |
| Year Fixed Effects | Yes | Yes | Yes | Yes | Yes | Yes |
| State*Year Fixed Effects | Yes | Yes | Yes | Yes | Yes | Yes |
| Observations | 462,970 | 117,398 | 130,849 | 777,434 | 146,507 | 202,143 |
|
| ||||||
Notes: Analyses were restricted to women aged 20-34 and men aged 20-39. Controls for individual characteristics include respondent’s age, number of own children living in the household (for women), and whether respondents were born outside the U.S. For less educated respondents, we also control for whether they had completed high school. All of these individual controls were measured at the time of interview (year y). Controls for sociodemographic characteristics at the CPUMA level include the percentage of the population that has less than high school, percentage of the population that has high school, average household income, the percentage population that is unemployed, the percentage that receives public assistance income, and the percentage Non-Hispanic black, Hispanic, and foreign born. We also included controls for the population density in the CPUMA (total population per square mile), and the sex ratio (number of men aged 25-39 per women aged 20-34). Local controls were measured in year y-2. Data obtained from the 1-year samples of the American Community Survey (Ruggles et al. 2018) and the National Vital Statistics System (NVSS 2018). Standard errors are clustered by CPUMA.
Household income given in 1999 constant dollars.
p<0.05
p<0.01
p<0.001.
Standard errors in brackets.
Discussion
The opioid epidemic is one of the greatest public health challenges facing the United States today (Gladden et al., 2016; Kolodny et al., 2015). More than 11 million people were estimated to misuse opioids in 2017 (SAMHSA, 2018). In the same year, 47,600 individuals died as a result of an opioid overdose (Scholl et al., 2019), surpassing the number of deaths due to gun violence and motor vehicle accidents (CDC, 2019c). A rapidly growing body of research has documented trends in opioid prescription, abuse, and deaths due to overdose (Guy et al., 2017; Kelly et al., 2008; Rigg et al., 2018; West et al., 2015). Studies have also found opioid dependence to have profound detrimental social and economic effects for individuals (Sansone et al., 2012; Scarpati et al., 2017; Scherrer et al., 2016; Terplan et al., 2015) and communities (Birnbaum et al., 2011; Florence et al., 2016; Krueger, 2016). However, little is still known about the implications of the opioid epidemic for family formation and childbearing patterns.
Our study is the first to examine the effect of the opioid epidemic on nonmarital fertility in the United States. We found robust evidence indicating that areas that have witnessed increasing opioid abuse, as measured by local opioid-overdose death rates and total prescriptions per capita, have also experienced an increase in nonmarital birth rates. According to our analyses, the magnitude of the total increase in nonmarital births due to the opioid epidemic since 2000 is equivalent to about 14% of the steep decline in nonmarital birth rates observed between 2010 and 2016 in the U.S. Thus, our findings suggest that the decrease in nonmarital fertility over the past decade would have been greater had the opioid epidemic not occurred. They also suggest that the increase in nonmarital births observed before 2008 would have been lower in the absence of the opioid epidemic. Our results were consistent using different ODR specifications, and when using opioid prescription rates as predictors. Given that opioids are often undercounted as a cause of overdose deaths, our estimates are conservative and plausibly represent a lower bound. Our main results were also replicated when we used counties instead of CPUMAs as our primary geographic unit of observation, when we expanded our analyses to a broader spectrum of reproductive age women (15-34 years of age), and when we split the analysis according to different urbanization levels. Marital birth rates appear to be unaffected by the epidemic, which indicates that any relevant causal mechanisms are primarily influencing unmarried women, either because they are disproportionately likely to be opioid-dependent themselves (SAMHDA, 2019), or because they might be more vulnerable to the effects of the opioid epidemic on families and communities.
Our analyses provide evidence that the effects of the opioid epidemic on nonmarital fertility have been primarily driven by less educated white women. By contrast, we found no effects among Hispanic or Black women of any education level. These results are consistent with the fact that the greatest incidence of opioid overdose deaths has been concentrated among non-Hispanic whites (Shiels et al., 2018). Our findings suggest that the opioid epidemic has important intergenerational implications, because they increase the probability that less educated women will have a nonmarital birth, thus making them and their children more vulnerable to poverty and family instability.
Although our analysis does not allow us to establish the exact causal mechanisms through which increasing local opioid use might lead to higher fertility rates among unmarried women, our results provide different degrees of support for potential explanations. According to our findings, the opioid epidemic does not appear to be affecting women’s probability of marriage due to a reduction in the marriageability of men. We found marriage rates to be unaffected by opioid overdose deaths and opioid prescription rates. The increase in nonmarital fertility is therefore more likely to be mediated by changes in the sexual and contraceptive behavior of unmarried individuals. We hypothesized that such changes were possibly induced by mechanisms such as intoxication, changing economic conditions, or behavioral and psychological responses to the social disruptions brought about by the opioid epidemic.
We did not find evidence that supported changing economic conditions as a relevant mediating mechanism. Past research has demonstrated the harmful consequences that opioid abuse may have for local economies by increasing unemployment and reducing labor force participation (Aliprantis et al., 2019; Harris et al., 2019; Krueger, 2016). Women may adjust their sexual and contraceptive behavior to seek or avoid pregnancy as their opportunity costs change. However, we found that the increase in the opioid-overdose death rate was not associated with changes in the probabilities that never married women and men in the age groups studied (20-34 and 20-39, respectively) were employed, were living below the poverty line, or had a lower household income. It is possible that our findings on unemployment differ from the aforementioned studies because we restricted our analysis to never married individuals of a particular age group, whereas these studies analyzed outcomes among a broad population segment. But given that previous studies indicate a positive association between local economic distress and opioid abuse (Ghertner & Groves, 2018; Hollingsworth et al., 2017), and a negative association between local economic distress and nonmarital fertility (Schneider, 2015), any time-varying economic distress that remained unaccounted for in our models would cause us to underestimate, rather than overestimate, the magnitude of the positive effect of opioid abuse on nonmarital childbearing.
Because our analysis relies on an aggregate-level indicator of opioid abuse, we cannot disentangle whether the increase in nonmarital fertility can be attributed to unmarried women’s own opioid use or to behavioral responses to other family- and community-level disruptions induced by the opioid epidemic. The fact that female, but not male overdose-death rates had a positive and significant effect on nonmarital fertility suggests that intoxication is a relevant channel through which the sexual and contraceptive practices of unmarried women are changed. But the fact that we find the opioid epidemic to have also increased adolescent nonmarital fertility even though the adolescent ODR has remained flat and low over the observation time period, suggests that the causal mechanisms are not limited to women’s own individual opioid use. Furthermore, based on the rate of deliveries to mothers with opioid use disorder (Haight, 2018), we estimate that births to opioid-dependent women represent less than a third of the surplus in nonmarital fertility that can be attributed to the opioid epidemic according to our statistical analysis.10 This suggests that the opioid epidemic may have ripple effects that are modifying the sexual and contraceptive behavior of less educated white unmarried women in affected communities, regardless of their own opioid use. It is therefore plausible that less educated white women and their sexual partners are also changing their sexual and contraceptive behaviors in response to disruptions to their social environment, such as community violence, increased mortality, or loss of collective efficacy. Future research should further assess the causal mechanisms linking the opioid epidemic with disruptions in family formation patterns.
We applied multiple strategies to produce estimates of the associations between the opioid epidemic and the outcomes of interest that reasonably approach a causal inference standard. We used local area fixed effects, controlled for national and state-specific trends, and included a series of time-varying controls capturing changes in local sociodemographic characteristics. The most natural potential confounders, such as education, insurance coverage, race-ethnicity, and level of urbanization, have been controlled in our models. However, we are unable to entirely rule out the possibility of bias introduced by unobserved trends in other local conditions. We believe that our analysis provides a reasonable approximation to the causal effects of the opioid epidemic. Future research should continue to explore the specific causal effects of the opioid epidemic and the mechanisms that link it to family formation patterns.
Supplementary Material
Acknowledgements.
This study was funded in part by a grant from the Eunice Kennedy Shriver National Institute of Child Health and Human Development (NICHD) to the authors (R03HD102516). We also gratefully acknowledge support from the NICHD grants to the Maryland Population Research Center (P2CHD041041), and to the California Center for Population Research (P2CHD041022).
Footnotes
Ethics and Consent. The authors report no ethical issues.
Conflict of Interest. The authors declare no conflicts of interest.
Each PUMA may encompass multiple counties in areas of low population density, or form part of a county in more densely populated areas, but never cross state boundaries (Ruggles et al., 2019b).
The county-level information was first converted into PUMAs and then aggregated into CPUMAs. The conversion from counties to PUMAS was based on the crosswalks available from the Geographic Correspondence Engine of the Missouri Census Data Center (2016) (http://mcdc.missouri.edu/applications/geocorr2014.html). The aggregation of PUMAs into CPUMAs was based on the crosswalk provided by the Minnesota Population Center’s Integrated Public Use Microdata Series (IPUMS) (https://usa.ipums.org/usa/volii/pumas10.shtml). It is necessary for us to conduct our analysis at the CPUMA level because the boundaries for PUMAs changed during the period of study. We excluded from our sample 8 CPUMAs in the state of Colorado that contain portions of counties whose boundaries changed over time in ways that make it difficult to map into distinct CPUMAs.
See for example: https://www.cdc.gov/nchs/nvss/vsrr/drug-overdose-data.htm
Summaries for the ARCOS system are available online
(https://www.deadiversion.usdoj.gov/arcos/retail_drug_summary/). These summaries provide the total sales of each drug at the 3-digit zip code level. The zip code-level information was converted to PUMAs and then aggregated into CPUMAs using the same crosswalks listed above.
Encompasses welfare income that the respondent received during the previous year, such as social security income, AFDC, and general assistance.
Because our controls and predictor of interest, the ODR, are measured at the CPUMA level, adding interactions between CPUMA and year indicators is not feasible, since it would saturate the model.
As a robustness check, we estimated models using different ODR measures to predict women’s probability of marriage in the last year, using individual-level data from our 1-year ACS dataset for years 2008-2016. We estimated these models separately by race-ethnicity and education, and found no significant association between the ODR measures and the probability of marriage in any subgroup.
We followed the CDC’s definition of overall drug overdose deaths, which includes substances such as cocaine, psychostimulants with abuse potential, and opioids (Scholl, 2019).
As a robustness check, we estimated analogous individual models using the probability of having a nonmarital instead of premarital birth as an outcome and obtained nearly identical results (not shown).
This calculation is based on the rates of deliveries to mothers with opioid use disorder published by Haight (2018), and on the total number of births to unmarried women aged 20-34 in 2014 (NVSS 2018). The 2013-2014 change in the number of births to mothers with an opioid-use disorder per 1,000 hospital deliveries was 0.8 (Haight, 2018). Multiplying this number by the 1,233,979 births to unmarried women aged 20-34 registered in 2014 (NVSS, 2018) results in an increase of 987 births to mothers with an opioid-use disorder. In turn, our analysis predicts that between 2013 and 2014, the opioid epidemic caused about 3,608 more nonmarital births to women in this age group in just this particular year (prediction based on model 1b of Table 3, and on our estimation of the number of unmarried women in the United States in 2014, according to the corresponding ACS 1-year sample). This means that births to opioid-dependent women represent less than a third of the surplus in nonmarital fertility that our models attribute to the opioid epidemic.
Contributor Information
Mónica L. Caudillo, Department of Sociology, University of Maryland, College Park, 2112 Parren Mitchell Art-Sociology Building, 3834 Campus Dr., College Park, MD 20742.
Andrés Villarreal, Department of Sociology, University of California, Los Angeles, 264 Haines Hall, 375 Portola Plaza Los Angeles, CA.
Data availability.
This study used restricted Vital Statistics data that were requested from CDC (https://www.cdc.gov/nchs/nvss/nvss-restricted-data.htm). The analysis also included data from the American Community Survey, which are publicly available at the IPUMS website (https://ipums.org/).
References
- Alexander MJ, Kiang MV, & Barbieri M (2018). Trends in Black and White Opioid Mortality in the United States, 1979–2015. Epidemiology (Cambridge, Mass.), 29(5), 707–715. 10.1097/EDE.0000000000000858 [DOI] [PMC free article] [PubMed] [Google Scholar]
- Aliprantis D, Fee K, & Schweitzer ME (2019). Opioids and the Labor Market (SSRN Scholarly Paper ID 3179068). Social Science Research Network https://papers.ssrn.com/abstract=3179068 [Google Scholar]
- Back SE, Payne RL, Wahlquist AH, Carter RE, Stroud Z, Haynes L, Hillhouse M, Brady KT, & Ling W (2011). Comparative Profiles of Men and Women with Opioid Dependence: Results from a National Multisite Effectiveness Trial. The American Journal of Drug and Alcohol Abuse, 37(5), 313–323. 10.3109/00952990.2011.596982 [DOI] [PMC free article] [PubMed] [Google Scholar]
- Bennett T, Holloway K, & Farrington D (2008). The statistical association between drug misuse and crime: A meta-analysis. Aggression and Violent Behavior, 13(2), 107–118. [Google Scholar]
- Bergmann JN, & Stockman JK (2015). How does Intimate Partner Violence Affect Condom and Oral Contraceptive Use in the United States? A Systematic Review of the Literature. Contraception, 91(6), 438–455. 10.1016/j.contraception.2015.02.009 [DOI] [PMC free article] [PubMed] [Google Scholar]
- Birnbaum HG, White AG, Schiller M, Waldman T, Cleveland JM, & Roland CL (2011). Societal costs of prescription opioid abuse, dependence, and misuse in the United States. Pain Medicine, 12(4), 657–667. [DOI] [PubMed] [Google Scholar]
- Black KI, Stephens C, Haber PS, & Lintzeris N (2012). Unplanned pregnancy and contraceptive use in women attending drug treatment services. Australian and New Zealand Journal of Obstetrics and Gynaecology, 52(2), 146–150. 10.1111/j.1479-828X.2012.01413.x [DOI] [PubMed] [Google Scholar]
- Carter JG, Mohler G, & Ray B (2018). Spatial Concentration of Opioid Overdose Deaths in Indianapolis: An Application of the Law of Crime Concentration at Place to a Public Health Epidemic. Journal of Contemporary Criminal Justice, 104398621880352. 10.1177/1043986218803527 [DOI] [Google Scholar]
- Case A, & Deaton A (2015). Rising morbidity and mortality in midlife among white non-Hispanic Americans in the 21st century. Proceedings of the National Academy of Sciences, 112(49), 15078–15083. [DOI] [PMC free article] [PubMed] [Google Scholar]
- CDC. (2013). Prescription painkiller overdoses: A growing epidemic, especially among women. CDC Vital Signs. https://www.cdc.gov/vitalsigns/pdf/2013-07-vitalsigns.pdf [Google Scholar]
- CDC. (2019a). Calculating Total Daily Dose of Opioids For Safer Dosage. https://www.cdc.gov/drugoverdose/pdf/calculating_total_daily_dose-a.pdf [Google Scholar]
- CDC. (2019b). U.S. Census Populations With Bridged Race Categories. National Vital Statistics Systetm. https://www.cdc.gov/nchs/nvss/bridged_race.htm [Google Scholar]
- CDC. (2019c). Underlying Cause of Death 1999-2017 on CDC WONDER Online Database, Released December, 2018. Data Are from the Multiple Cause of Death Files, 1999-2017, as Compiled from Data Provided by the 57 Vital Statistics Jurisdictions through the Vital Statistics Cooperative Program. http://wonder.cdc.gov/ucd-icd10.html [Google Scholar]
- Cherlin A, Cumberworth E, Morgan SP, & Wimer C (2013). The effects of the Great Recession on family structure and fertility. The ANNALS of the American Academy of Political and Social Science, 650(1), 214–231. [Google Scholar]
- Cicero TJ, Ellis MS, Surratt HL, & Kurtz SP (2014). The Changing Face of Heroin Use in the United States: A Retrospective Analysis of the Past 50 Years. JAMA Psychiatry, 71(7), 821–826. 10.1001/jamapsychiatry.2014.366 [DOI] [PubMed] [Google Scholar]
- Copello A, Templeton L, & Powell J (2010). The impact of addiction on the family: Estimates of prevalence and costs. Drugs: Education, Prevention and Policy, 17(sup1), 63–74. 10.3109/09687637.2010.514798 [DOI] [Google Scholar]
- Cornford CS, Close HJ, Bray R, Beere D, & Mason JM (2015). Contraceptive Use and Pregnancy Outcomes among Opioid Drug-Using Women: A Retrospective Cohort Study. PLOS ONE, 10(3), e0116231. 10.1371/journal.pone.0116231 [DOI] [PMC free article] [PubMed] [Google Scholar]
- Dasgupta N, Beletsky L, & Ciccarone D (2018). Opioid Crisis: No Easy Fix to Its Social and Economic Determinants. American Journal of Public Health, 108(2), 182–186. 10.2105/AJPH.2017.304187 [DOI] [PMC free article] [PubMed] [Google Scholar]
- Florence C, Luo F, Xu L, & Zhou C (2016). The Economic Burden of Prescription Opioid Overdose, Abuse and Dependence in the United States, 2013. Medical Care, 54(10), 901–906. 10.1097/MLR.0000000000000625 [DOI] [PMC free article] [PubMed] [Google Scholar]
- Gee RE, Mitra N, Wan F, Chavkin DE, & Long JA (2009). Power over parity: Intimate partner violence and issues of fertility control. American Journal of Obstetrics and Gynecology, 201(2), 148. e1–148. e7. [DOI] [PubMed] [Google Scholar]
- Ghertner R, & Groves L (2018). The opioid crisis and economic opportunity: Geographic and economic trends (ASPE Research Brief, p. 22). Office of the Assistant Secretary for Planning and Evaluation; US Department of Health and Human Services. [Google Scholar]
- Gibson-Davis CM, Edin K, & McLanahan S (2005). High Hopes but Even Higher Expectations: The Retreat From Marriage Among Low-Income Couples. Journal of Marriage and Family, 67(5), 1301–1312. 10.1111/j.1741-3737.2005.00218.x [DOI] [Google Scholar]
- Gladden RM, Martinez P, & Seth P (2016). Fentanyl Law Enforcement Submissions and Increases in Synthetic Opioid–Involved Overdose Deaths—27 States, 2013–2014. MMWR. Morbidity and Mortality Weekly Report, 65(33), 837–843. 10.15585/mmwr.mm6533a2 [DOI] [PubMed] [Google Scholar]
- Guttmacher Institute. (2019). Unintended pregnancy in the United States [Fact Sheet]. Guttmacher Institute. https://www.guttmacher.org/sites/default/files/factsheet/fb-unintended-pregnancy-us.pdf [Google Scholar]
- Guy GP, Zhang K, Bohm MK, Losby J, Lewis B, Young R, Murphy LB, & Dowell D (2017). Vital Signs: Changes in Opioid Prescribing in the United States, 2006–2015. MMWR. Morbidity and Mortality Weekly Report, 66(26), 697–704. 10.15585/mmwr.mm6626a4 [DOI] [PMC free article] [PubMed] [Google Scholar]
- Haight SC (2018). Opioid Use Disorder Documented at Delivery Hospitalization—United States, 1999–2014. MMWR. Morbidity and Mortality Weekly Report, 67. 10.15585/mmwr.mm6731a1 [DOI] [PMC free article] [PubMed] [Google Scholar]
- Hall KS, Moreau C, Trussell J, & Barber J (2013). Young women’s consistency of contraceptive use—Does depression or stress matter? Contraception, 88(5), 641–649. [DOI] [PMC free article] [PubMed] [Google Scholar]
- Harding C, & Ritchie J (2003). Contraceptive practice of women with opiate addiction in a rural centre. Australian Journal of Rural Health, 11(1), 2–6. 10.1046/j.1440-1584.2003.00477.x [DOI] [PubMed] [Google Scholar]
- Harding DJ (2009). Collateral Consequences of Violence in Disadvantaged Neighborhoods. Social Forces; a Scientific Medium of Social Study and Interpretation, 88(2), 757–784. 10.1353/sof.0.0281 [DOI] [PMC free article] [PubMed] [Google Scholar]
- Harris MC, Kessler LM, Murray MN, & Glenn B (2019). Prescription Opioids and Labor Market Pains: The Effect of Schedule II Opioids on Labor Force Participation and Unemployment. Journal of Human Resources, 1017–9093R2. [Google Scholar]
- Hasselt MV, Keyes V, Bray J, & Miller T (2015). Prescription Drug Abuse and Workplace Absenteeism: Evidence from the 2008–2012 National Survey on Drug Use and Health. Journal of Workplace Behavioral Health, 30(4), 379–392. 10.1080/15555240.2015.1047499 [DOI] [Google Scholar]
- Heil SH, Jones HE, Arria A, Kaltenbach K, Coyle M, Fischer G, Stine S, Selby P, & Martin PR (2011). Unintended Pregnancy in Opioid-abusing Women. Journal of Substance Abuse Treatment, 40(2), 199–202. 10.1016/j.jsat.2010.08.011 [DOI] [PMC free article] [PubMed] [Google Scholar]
- Ho JY (2017). The Contribution of Drug Overdose to Educational Gradients in Life Expectancy in the United States, 1992–2011. Demography, 54(3), 1175–1202. 10.1007/s13524-017-0565-3 [DOI] [PMC free article] [PubMed] [Google Scholar]
- Hollingsworth A, Ruhm CJ, & Simon K (2017). Macroeconomic conditions and opioid abuse. Journal of Health Economics, 56, 222–233. [DOI] [PubMed] [Google Scholar]
- Inocencio TJ, Carroll NV, Read EJ, & Holdford DA (2013). The economic burden of opioid-related poisoning in the United States. Pain Medicine, 14(10), 1534–1547. [DOI] [PubMed] [Google Scholar]
- Johns SE (2011). Perceived environmental risk as a predictor of teenage motherhood in a British population. Health & Place, 17(1), 122–131. [DOI] [PubMed] [Google Scholar]
- Kelly JP, Cook SF, Kaufman DW, Anderson T, Rosenberg L, & Mitchell AA (2008). Prevalence and characteristics of opioid use in the US adult population: Pain, 138(3), 507–513. 10.1016/j.pain.2008.01.027 [DOI] [PubMed] [Google Scholar]
- Kenan K, Mack K, & Paulozzi L (2012). Trends in prescriptions for oxycodone and other commonly used opioids in the United States, 2000–2010. Open Medicine, 6(2), e41–e47. [PMC free article] [PubMed] [Google Scholar]
- Kolodny A, Courtwright DT, Hwang CS, Kreiner P, Eadie JL, Clark TW, & Alexander GC (2015). The prescription opioid and heroin crisis: A public health approach to an epidemic of addiction. Annual Review of Public Health, 36, 559–574. 10.1146/annurev-publhealth-031914-122957 [DOI] [PubMed] [Google Scholar]
- Kopak AM, Vartanian L, Hoffmann NG, & Hunt DE (2014). The connections between substance dependence, offense type, and offense severity. Journal of Drug Issues, 44(3), 291–307. [Google Scholar]
- Krueger AB (2016). Where have all the workers gone? Unpublished, Princeton University and NBER, October, 4. [Google Scholar]
- LaGrange RL, Ferraro KF, & Supancic M (1992). Perceived risk and fear of crime: Role of social and physical incivilities. Journal of Research in Crime and Delinquency, 29(3), 311–334. [Google Scholar]
- Lo CC, & Stephens RC (2002). The Role of Drugs in Crime: Insights from a Group of Incoming Prisoners. Substance Use & Misuse, 37(1), 121–131. 10.1081/JA-120001499 [DOI] [PubMed] [Google Scholar]
- Lopoo LM, & Western B (2005). Incarceration and the Formation and Stability of Marital Unions. Journal of Marriage and Family, 67(3), 721–734. JSTOR. [Google Scholar]
- Manning WD, Longmore MA, & Giordano PC (2018). Cohabitation and Intimate Partner Violence During Emerging Adulthood: High Constraints and Low Commitment. Journal of Family Issues, 39(4), 1030–1055. 10.1177/0192513X16686132 [DOI] [PMC free article] [PubMed] [Google Scholar]
- Markowitz FE, Bellair PE, Liska AE, & Liu J (2001). Extending social disorganization theory: Modeling the relationships between cohesion, disorder, and fear. Criminology, 39(2), 293–319. [Google Scholar]
- Mazure CM, & Fiellin DA (2018). Women and opioids: Something different is happening here. The Lancet, 392, 9–10. [DOI] [PubMed] [Google Scholar]
- McHugh RK, DeVito EE, Dodd D, Carroll KM, Potter JS, Greenfield SF, Connery HS, & Weiss RD (2013). Gender Differences in a Clinical Trial for Prescription Opioid Dependence. Journal of Substance Abuse Treatment, 45(1), 38–43. 10.1016/j.jsat.2012.12.007 [DOI] [PMC free article] [PubMed] [Google Scholar]
- McLanahan SS, & Kelly EL (2006). The feminization of poverty. In Saltzman Chafetz J (Ed.), Handbook of the Sociology of Gender. Springer. [Google Scholar]
- Missouri Census Data Center. (2016). Geocorr 2014: Geographic Correspondence Engine. http://mcdc.missouri.edu/applications/geocorr2014.html.http://mcdc.missouri.edu/applications/geocorr2014.html [Google Scholar]
- Monnat SM (2019). The contributions of socioeconomic and opioid supply factors to U.S. drug mortality rates: Urban-rural and within-rural differences. Journal of Rural Studies, 68, 319–335. 10.1016/j.jrurstud.2018.12.004 [DOI] [Google Scholar]
- Moore BC, Easton CJ, & McMahon TJ (2011). Drug Abuse and Intimate Partner Violence: A Comparative Study of Opioid-Dependent Fathers. The American Journal of Orthopsychiatry, 81(2), 218–227. 10.1111/j.1939-0025.2011.01091.x [DOI] [PMC free article] [PubMed] [Google Scholar]
- Nobles J, Frankenberg E, & Thomas D (2015). The effects of mortality on fertility: Population dynamics after a natural disaster. Demography, 52(1), 15–38. [DOI] [PMC free article] [PubMed] [Google Scholar]
- NVSS. (2018). Restricted Data from the National Vital Statistics System. Centers for Disease Control and Prevention; National Center for Health Statistics. https://www.cdc.gov/nchs/nvss/index.htm [Google Scholar]
- O’Donnell JK, Gladden RM, & Seth P (2017). Trends in Deaths Involving Heroin and Synthetic Opioids Excluding Methadone, and Law Enforcement Drug Product Reports, by Census Region—United States, 2006–2015. Morbidity and Mortality Weekly Report, 66(34), 7. [DOI] [PMC free article] [PubMed] [Google Scholar]
- Ray GT, Mertens JR, & Weisner C (2009). Family members of people with alcohol or drug dependence: Health problems and medical cost compared to family members of people with diabetes and asthma. Addiction, 104(2), 203–214. 10.1111/j.1360-0443.2008.02447.x [DOI] [PMC free article] [PubMed] [Google Scholar]
- Rigg KK, Monnat SM, & Chavez MN (2018). Opioid-related mortality in rural America: Geographic heterogeneity and intervention strategies. International Journal of Drug Policy, 57, 119–129. [DOI] [PubMed] [Google Scholar]
- Rudd R, Aleshire N, Zibell J, & Gladden MR (2016). Increases in Drug and Opioid Overdose Deaths—United States, 2000–2014. Morbidity and Mortality Weekly Report, 64(50), 1323–1327. [DOI] [PubMed] [Google Scholar]
- Ruggles S, Flood S, Goeken R, Grover J, Meyer E, Pacas J, & Sobek M (2018). IPUMS USA: Version 8.0 [dataset]. 10.18128/D010.V9.0. 10.18128/D010.V9.0 [DOI] [Google Scholar]
- Ruggles S, Flood S, Goeken R, Grover J, Meyer E, Pacas J, & Sobek M (2019a). 1980-1990-2000 CONSPUMA DEFINITIONS. https://usa.ipums.org/usa/volii/conspuma.shtml [Google Scholar]
- Ruggles S, Flood S, Goeken R, Grover J, Meyer E, Pacas J, & Sobek M (2019b). GEOGRAPHIC TOOLS. https://usa.ipums.org/usa/volii/tgeotools.shtml [Google Scholar]
- SAMHDA. (2019). Online Analysis Tool: National Survey on Drug Use and Health 2017. https://www.samhsa.gov/data/nsduh/reports-detailed-tables-2017-NSDUH [Google Scholar]
- SAMHSA. (2018). Key substance use and mental health indicators in the United States: Results from the 2017 National Survey on Drug Use and Health. Substance Abuse and Mental Health Services Administration; Center for Behavioral Health Statistics and Quality, Substance Abuse and Mental Health Services Administration. https://www.samhsa.gov/data/ [Google Scholar]
- Sansone RA, Leung JS, & Wiederman MW (2012). The Abuse of Prescription Medications and Employment History. The International Journal of Psychiatry in Medicine, 43(3), 273–278. [DOI] [PubMed] [Google Scholar]
- Scarpati LM, Kirson NY, Jia ZB, Wen J, & Howard J (2017). Opioid abuse: A detailed examination of cost drivers over a 24-month follow-up period. Journal of Managed Care & Specialty Pharmacy, 23(11), 1110–1115. [DOI] [PMC free article] [PubMed] [Google Scholar]
- Scherrer JF, Salas J, Copeland LA, Stock EM, Ahmedani BK, Sullivan MD, Burroughs T, Schneider FD, Bucholz KK, & Lustman PJ (2016). Prescription opioid duration, dose, and increased risk of depression in 3 large patient populations. The Annals of Family Medicine, 14(1), 54–62. [DOI] [PMC free article] [PubMed] [Google Scholar]
- Schneider D (2015). The great recession, fertility, and uncertainty: Evidence from the United States. Journal of Marriage and Family, 77(5), 1144–1156. [Google Scholar]
- Schneider D, & Hastings OP (2015). Socioeconomic variation in the effect of economic conditions on marriage and nonmarital fertility in the United States: Evidence from the Great Recession. Demography, 52(6), 1893–1915. [DOI] [PubMed] [Google Scholar]
- Scholl L (2019). Drug and Opioid-Involved Overdose Deaths—United States, 2013–2017. MMWR. Morbidity and Mortality Weekly Report, 67. 10.15585/mmwr.mm6751521e1 [DOI] [PMC free article] [PubMed] [Google Scholar]
- Scholl L, Seth P, Mbabazi K, Wilson N, & Baldwin G (2019). Drug and Opioid-Involved Overdose Deaths—United States, 2013–2017. MMWR. Morbidity and Mortality Weekly Report, 67. 10.15585/mmwr.mm6751521e1 [DOI] [PMC free article] [PubMed] [Google Scholar]
- Seth P, Scholl L, Rudd RA, & Bacon S (2018). Overdose Deaths Involving Opioids, Cocaine, and Psychostimulants—United States, 2015–2016. MMWR. Morbidity and Mortality Weekly Report, 67. 10.15585/mmwr.mm6712a1 [DOI] [PMC free article] [PubMed] [Google Scholar]
- Shiels MS, Freedman ND, Thomas D, & Berrington de Gonzalez A (2018). Trends in U.S. Drug Overdose Deaths in Non-Hispanic Black, Hispanic, and Non-Hispanic White Persons, 2000–2015. Annals of Internal Medicine, 168(6), 453. 10.7326/M17-1812 [DOI] [PMC free article] [PubMed] [Google Scholar]
- Smock PJ, Manning WD, & Porter M (2005). “Everything’s there except money”: How money shapes decisions to marry among cohabitors. Journal of Marriage and Family, 67(3), 680–696. [Google Scholar]
- South SJ, & Lloyd KM (1992). Marriage Opportunities and Family Formation: Further Implications of Imbalanced Sex Ratios. Journal of Marriage and Family, 54(2), 440–451. JSTOR. 10.2307/353075 [DOI] [Google Scholar]
- Terplan M, Hand DJ, Hutchinson M, Salisbury-Afshar E, & Heil SH (2015). Contraceptive use and method choice among women with opioid and other substance use disorders: A systematic review. Preventive Medicine, 80, 23–31. 10.1016/j.ypmed.2015.04.008 [DOI] [PMC free article] [PubMed] [Google Scholar]
- USDA. (2016). Identifying the metro-nonmetro status of Public Use Microdata Areas (Economic Research Service; United States Department of Agriculture; ). https://www.ers.usda.gov/topics/rural-economy-population/rural-classifications/. [Google Scholar]
- Vadivelu N, Kai AM, Kodumudi V, Sramcik J, & Kaye AD (2018). The Opioid Crisis: A Comprehensive Overview. Current Pain and Headache Reports, 22(3), 16. 10.1007/s11916-018-0670-z [DOI] [PubMed] [Google Scholar]
- Van Schellen M, Poortman A-R, & Nieuwbeerta P (2012). Partners in crime? Criminal offending, marriage formation, and partner selection. Journal of Research in Crime and Delinquency, 49(4), 545–571. [Google Scholar]
- Way S, Finch BK, & Cohen D (2006). Hispanic concentration and the conditional influence of collective efficacy on adolescent childbearing. Archives of Pediatrics & Adolescent Medicine, 160(9), 925–930. [DOI] [PubMed] [Google Scholar]
- West NA, Severtson SG, Green JL, & Dart RC (2015). Trends in abuse and misuse of prescription opioids among older adults. Drug and Alcohol Dependence, 149, 117–121. 10.1016/j.drugalcdep.2015.01.027 [DOI] [PubMed] [Google Scholar]
Associated Data
This section collects any data citations, data availability statements, or supplementary materials included in this article.
Supplementary Materials
Data Availability Statement
This study used restricted Vital Statistics data that were requested from CDC (https://www.cdc.gov/nchs/nvss/nvss-restricted-data.htm). The analysis also included data from the American Community Survey, which are publicly available at the IPUMS website (https://ipums.org/).