

Abstract
Aim
Pressure injuries are common adverse events in clinical practice, affecting the well‐being of patients and causing considerable financial burden to healthcare systems. It is therefore essential to use reliable assessment tools to identify pressure injuries for early prevention. The Braden Scale is a widely used tool to assess pressure injury risk, but the literature is currently lacking in determining its accuracy. This study aimed to evaluate the accuracy of the Braden Scale in assessing pressure injury risk.
Design
Systematic review and meta‐analysis.
Methods
Articles published between 1973–2020 from periodicals indexed in the PubMed, EMBASE, CINAHL, Web of Science and the Cochrane Library were selected. Two reviewers independently selected the relevant studies for inclusion. Data were analysed by the STATA 15.0 and the RevMan 5.3 software.
Results
In total, 60 studies involving 49,326 individuals were eligible for this meta‐analysis. The pooled SEN, SPE, PLR, NLR, DOR and AUC were 0.78 (95% CI: 0.74 to 0.82), 0.72 (95% CI: 0.66 to 0.78), 2.80 (95% CI: 2.30 to 3.50), 0.30 (95% CI: 0.26 to 0.35), 9.00 (95% CI: 7.00 to 13.00) and 0.82 (95% CI: 0.79 to 0.85), respectively. Subgroup analyses indicated that the AUC was higher for prospective design (0.84, 95% CI: 0.81 to 0.87), mean age <60 years (0.87, 95% CI: 0.84 to 0.90), hospital (0.82, 95% CI: 0.79 to 0.86) and Caucasian population (0.86, 95% CI: 0.82 to 0.88). In addition, 18 was found to be the optimal cut‐off value.
Conclusion
The evidence indicated that the Braden Scale had a moderate predictive validity. It was more suitable for mean age <60 years, hospitalized patients and the Caucasian population, and the cut‐off value of 18 might be used for the risk assessment of pressure injuries in clinical practice. However, due to the different cut‐off values used among included studies, the results had a significant heterogeneity. Future studies should explore the optimal cut‐off value in the same clinical environment.
Keywords: pressure ulcer, risk assessment, sensitivity and specificity, systematic review
1. INTRODUCTION
Pressure injuries (PIs), also known as decubitus ulcers, ischaemic ulcers, bedsores, pressure sores and pressure ulcers, are localized damage to the skin and underlying soft tissue usually over a bony prominence or related to a medical or other device (NPUAP, 2016). Individuals who are at high risk are those characterized by multiple risk factors that affect both the mechanical boundary conditions and the susceptibility and tolerance of the individual (National Pressure Ulcer Advisory Panel and Alliance, 2014). However, most PIs can be prevented if effective measures including systematic skin examination, risk assessment, bed and chair support surfaces, repositioning and mobilization, and nutritional support are implemented (Bredesen et al., 2015). Risk assessment is a central component of PI prevention (Coleman et al., 2013, National Pressure Ulcer Advisory Panel and Alliance, 2014), so it is important to use a valid and reliable assessment tool to identify high‐risk patients and implement appropriate interventions for the prevention of PIs.
Since the early 1960s, a variety of risk assessment tools have been developed with over 50 scales currently to determine the risk of PIs, such as the Norton Scale, the Waterlow Scale and the Braden Scale (Shi et al., 2019). The Braden Scale is the most common around the world due to its ease of use with wider risk factor incorporation (e.g. moisture and sensory perception) when compared to other scales (National Pressure Ulcer Advisory Panel and Alliance, 2014). However, it has been used in different population clinical settings, with a variety of re‐verification results. In order to take appropriate measures and prevent PI development early, practitioners must ascertain whether the Braden Scale can accurately identify the risk of PIs.
2. BACKGROUND
PIs are one of the most frequently occurring adverse events in hospitalized patients worldwide (Li et al., 2020, National Pressure Ulcer Advisory Panel and Alliance, 2014), which prolong hospital stay, increase medical expenses, decrease quality of life and result in increased nosocomial infection, disability, morbidity and mortality (Al Mutairi & Hendrie, 2018; Aloweni et al., 2019; Amir et al., 2017; Coleman et al., 2013; Ferris et al., 2019; Jackson et al., 2019; Mallow et al., 2013). The prevalence of PIs remains unacceptably high, ranging from 1.1%–26.7% in the hospital setting and 6%–29% in the community setting (Graves & Zheng, 2014). It has been estimated that the annual cost of treating PIs is $26.8 billion in the United States (Padula & Delarmente, 2019), €334.86 million to €2.59 billion in Europe (Severens et al., 2002) and A$983 million in Australia (Nguyen et al., 2015). A recent study noted that the cost of PI prevention was more cost‐effective than that of PI treatment across all clinical settings (Demarré et al., 2015). For these reasons, PI prevention is of great importance. An essential component of preventive strategies is the risk assessment of PI development in the individual.
Risk assessments tools are generally used to assess the risk of developing PIs, such as the Norton Scale, the Waterlow Scale and the Braden Scale. The ideal risk assessment tool must accurately identify individuals at risk, as well as those not at risk. The Norton Scale is the first structured risk assessment tool for predicting PIs, but it lacks the part of friction shear, which may result in the occurrence of PIs (National Pressure Ulcer Advisory Panel and Alliance, 2014). Although it was also developed to assess senile patients at risk of developing PIs, the Waterlow Scale cannot accurately identify those individuals who are not at risk, with the specificity of 32.9% (Serpa et al., 2009). The Baden Scale is based on six common risk factors including sensory function, moisture, activity, mobility, nutrition, shearing force and friction. A summative score reveals the level of risk where lower values are indicative of higher risk (Kelechi et al., 2013). Due to the ease of use and interpretation of the point system, the Braden Scale has quickly gained popularity among practitioners. However, in order to reflect the population characteristics and the medical culture of the country, the Braden Scale has been re‐verified by different researchers in the past 30 years. The sensitivity and specificity of it showed a wide range of differences from 50%–100% depending on the research subjects or conditions (Chou et al., 2013), and the cut‐off point differed as well (Cowan et al., 2012). Some studies (Chen et al., 2016; Pancorbo‐Hidalgo et al., 2010; Park et al., 2016) found that the Braden Scale offered the best balance between sensitivity and specificity. But a systematic review (Wei et al., 2012) revealed that the Braden Scale could not be used alone in assessing PIs’ risk in surgical patients. As a result, there is no consensus on predictive validity of the Braden Scale among different studies.
Given the importance of risk assessment for PI prevention, practitioners have used the Braden Scale in different population and clinical settings. However, it is unclear whether the Braden scale can accurately identify the risk of PIs in practice. The purpose of this study was to determine predictive validity of the Braden Scale and to explore the suitable population and optimal cut‐off value through a diagnostic method oriented meta‐analysis. Understanding the predictive validity, applicable population and optimal cut‐off value is beneficial for practitioners to identify the risk of PIs and take preventive measures early.
3. DESIGN
We conducted a systematic review and meta‐analysis. The study was performed in accordance with the guidelines from the Cochrane Handbook for Systematic Reviews of Diagnostic Test Accuracy from the Cochrane Collaboration (Macaskill et al., 2010) and Preferred Reporting Items for Systematic Review and Meta‐analysis (PRISMA) (Moher et al., 2009). Our study protocol was registered with the International Prospective Register of Systematic Reviews (PROSPERO) (CRD42020142181).
4. METHODS
4.1. Search strategy
The digital databases including PubMed, EMBASE, Web of Science, the Cochrane Library and the Cumulative Index of Nursing and Allied Health (CINAHL) were searched, from inception of each database to July 2020. In addition, we explored the bibliographies of relevant reviews in order to identify other potentially eligible studies. The literature search terms and strategies used are available in supplementary appendix 1.
4.2. Inclusion and exclusion criteria
The eligible studies must meet the following criteria: (a) patients were 18 years of age or older and had no PIs at time of admission; (b) the Braden Scale was used to identify the risk of PIs; (c) studies directly provided true positive (TP), false positive (FP), false negative (FN) and true negative (TN) for predicting PIs’ risk or with data available regarding these statistics; (d) the definition and classification of PIs were produced by one of the accepted standards, such as the National Pressure Ulcer Advisory Panel (NPUAP), the European Pressure Ulcer Advisory Panel (EPUAP), the Agency for Health Care Policy and Research (AHCPR), the International Classification of Diseases, Ninth Revision (ICD‐9), and the Bergstrom and others; and (e) the cross‐sectional study and the cohort study were included.
Exclusion criteria were as follows: (a) studies failed to obtain a complete data; (b) letter, comment and meeting abstract; and (c) duplicate publications.
4.3. Study selection
Two reviewers independently screened titles and abstracts for eligibility with the consistent accomplishment of a pilot literature selection. The full text was read if the abstract and title cannot be determined for inclusion. In case of disagreement, a third reviewer resolved the conflict between them.
4.4. Data extraction
Two reviewers extracted data into a spreadsheet independently and resolved any discrepancies through discussion to reach a consensus. For each study included, the following information was extracted: first author, publication year, country, study design, age, gender, sample size, cut‐off value, reference standard, TP, FP, TN and FN.
4.5. Quality assessment
The Quality Assessment of Diagnostic Accuracy Studies Ⅱ (QUADAS‐Ⅱ) (Whiting et al., 2011) was used to assess the quality of each of the included studies. It contains four domains: patient selection, index test, reference standard, and flow and timing, classifying the methodological quality as having a low, high or unclear risk of bias. Two reviewers independently rated the applicability and risk of bias, and any conflict was resolved by a third reviewer.
4.6. Statistical analysis
All statistical analyses were performed using STATA 15.0 (Stata, College Station, TX, USA) and Review Manager 5.3 software (Cochrane Collaboration, Oxford, UK). The bivariate meta‐analysis model was selected to calculate the pooled sensitivity (SEN), specificity (SPE), positive likelihood ratio (PLR), negative likelihood ratio (NLR), diagnostic odds ratio (DOR) and their corresponding 95% confidence intervals (95% CIs) (Reitsma et al., 2005). Furthermore, the summary receiver operator characteristic (SROC) curve was constructed and the area under the curve (AUC) was calculated to quantify the diagnostic power (Jones & Athanasiou, 2005). With respect to the value, a value of 0.5 was deemed informative, 0.5 < AUC≤0.7 was considered less accurate, 0.7 < AUC≤0.9 was thought to be moderate, 0.9 < AUC<1 was deemed very accurate, and AUC = 1 was considered a perfect test (Greiner et al., 2000). Heterogeneity was analysed by I2 statistics. ≤25%, 25%<I2 ≤ 75% and > 75% indicated respectively low, moderate and high heterogeneity between studies (Higgins et al., 2003). Subgroup analysis and sensitivity analysis were used to identify the sources of heterogeneity. Subgroup analysis was performed under the following covariates: (a) study design (prospective vs. retrospective); (b) mean age (<60 years vs. ≥60 years); (c) setting (hospital vs. non‐hospital); (d) ethnicity (Asian population vs. Caucasian population); and (e) reference standard (authoritative vs. non‐authoritative). In addition, we used Deeks’ funnel plot to assess any potential publication bias (Deeks et al., 2005).
5. RESULTS
5.1. Search results
A total of 6,441 publications were identified in our initial search. 4,215 studies remained after removing duplications. After scanning titles and abstracts, 71 studies were identified for further examination. By reviewing the full text of the remaining articles, 11 studies with insufficient data or no relevance to the diagnosis were rejected. Finally, a total of 60 studies were included in this review (Table 1). The detailed screening process is presented in Figure 1.
TABLE 1.
Characteristics of the included studies
| Author/year | Country | Study design | Setting | Age (year) | Gender (female/male) | Sample size | Cut‐off | TP | FP | FN | TN |
|---|---|---|---|---|---|---|---|---|---|---|---|
| Lim et al., (2019) | Singapore | R | Ward | 68 ± 17.1 | 80/119 | 199 | ≤17 | 68 | 25 | 32 | 74 |
| Limaserrano et al., (2018) | Spain | P | ICU | 63.74 ± 16.12 | 129/206 | 335 | ≤12 | 21 | 82 | 6 | 226 |
| Han et al., (2018) | Korea | R | ICU | 62.37 ± 14.32 | 223/377 | 600 | ≤16 | 242 | 131 | 58 | 169 |
| Chen et al., (2017) | China | R | Ward | 60.5 ± 15.6 | 962/1563 | 2,525 | ≤14 | 63 | 727 | 13 | 1722 |
| Deng et al., (2017) | China | R | ICU | 58 ± 17 | 119/349 | 468 | ≤16 | 70 | 80 | 24 | 294 |
| Roca‐Biosca et al., (2017) | Spain | P | ICU | 59.34–62.92 | NR | 295 | ≤12 | 34 | 168 | 7 | 86 |
| Šáteková et al., (2017) | Czech Republic | P | LTCF | 73.89 ± 10.12 | NR | 100 | ≤15 | 12 | 40 | 2 | 46 |
| Roa Díaz et al., (2017) | Colombia | P | Ward | ≥18 | 407/531 | 938 | ≤18 | 43 | 361 | 5 | 529 |
| Griswold et al., (2017) | USA | R | ICU | 48.3 ± 18.2 | 743/1917 | 2,660 | ≤12 | 50 | 1,299 | 11 | 1,299 |
| Jin et al., (2015) | Korea | R | ICU | 62.66 ± 17.98 | NR | 965 | ≤18 | 615 | 87 | 92 | 171 |
| Kumari et al., (2015) | Indian | P | Ward | ≥18 | NR | 100 | ≤17 | 23 | 0 | 8 | 69 |
| García‐Díaz et al., (2015) | Spain | P | LTCF | 82.3 ± 10.07 | 99/254 | 353 | ≤15 | 34 | 85 | 6 | 200 |
| Freitas and Alberti, (2013) | Brazil | P | LTCF | 82.5 ± 12.1 | 126/57 | 183 | ≤18 | 37 | 56 | 0 | 90 |
| Hyun et al., (2013) | USA | R | ICU | 58.7 ± 15.2 | 3317/4473 | 7,790 | ≤13 | 5,901 | 124 | 1655 | 110 |
| Cowan et al., (2012) | USA | R | ACU | 71.0 ± 10.6 | 7/206 | 213 | ≤18 | 65 | 34 | 35 | 79 |
| Fromantin et al., (2011) | France | P | Ward | 16–89 | 434/148 | 582 | ≤18 | 26 | 100 | 3 | 453 |
| Costa and Caliri, (2011) | Brazil | P | ICU | ≥18 | NR | 53 | ≤14 | 19 | 18 | 1 | 15 |
| Serpa et al., (2011) | Brazil | R | ICU | 60.9 ± 16.5 | 24/48 | 72 | ≤13 | 6 | 11 | 2 | 53 |
| Cho and Noh, (2010) | Korea | R | ICU | 62.33 ± 15.5 | 282/433 | 715 | ≤13 | 32 | 355 | 10 | 318 |
| de Souza et al., (2010) | Brazil | P | LTCF | 76.6 ± 9.2 | 129/104 | 233 | ≤17 | 27 | 48 | 10 | 148 |
| Feuchtinger et al., (2010) | Germany | P | ICU | 62.0 ± 12.1 | 22/31 | 53 | ≤16 | 20 | 19 | 6 | 8 |
| Chan et al., (2009) | China | P | ACU | 82.2 ± 7.35 | 167/30 | 197 | ≤16 | 12 | 64 | 6 | 115 |
| Kim et al., (2009) | Korea | P | ICU | 58.1 ± 1.2 | 74/145 | 219 | ≤14 | 37 | 54 | 3 | 125 |
| Tannen et al., (2008) | Netherlands | P | LTCF | 81.2 ± 10.2 | 7301/2797 | 10,098 | ≤18 | 2,337 | 3,591 | 834 | 3,336 |
| Oh et al., (2007) | Korea | P | Ward | 51.1 | 885/997 | 1882 | ≤18 | 4 | 114 | 0 | 1764 |
| Lahmann et al., (2006) | Germany | P | LTCF | 81.9 ± 12.2 | 3843/1003 | 4,846 | ≤20 | 406 | 2,507 | 268 | 1665 |
| Tannen et al., (2006) | Germany | P | LTCF | 84.6 ± 8.0 | 2873/626 | 3,499 | ≤20 | 243 | 1853 | 25 | 1,378 |
| Sanada et al., (2006) | Indonesia | P | ICU | 50.9 ± 17.0 | 33/72 | 105 | ≤12 | 28 | 32 | 7 | 38 |
| Lahmann et al., (2005) | Germany | P | LTCF | 83.6 | NR | 1,347 | ≤20 | 149 | 712 | 8 | 458 |
| Defloor and Grypdonck, (2005) | Belgium | P | LTCF | 84.6 ± 7.9 | 1403/369 | 1772 | ≤16 | 160 | 724 | 27 | 861 |
| Jalali and Rezaie, (2005) | Iran | P | Ward | 60 | 130/100 | 230 | ≤16 | 39 | 0 | 35 | 156 |
| Kwong et al., (2005) | China | P | ACU | 54.1 ± 16.9 | 176/253 | 429 | ≤14 | 8 | 118 | 1 | 302 |
| Seongsook et al., (2004) | Korea | P | ICU | 62 | 48/64 | 112 | ≤16 | 34 | 57 | 1 | 20 |
| Cho et al., (2004) | Korea | P | Ward | 55.3 ± 15.8 | 1555/2339 | 3,894 | ≤16 | 94 | 248 | 15 | 3,524 |
| Marrie et al., (2003) | Canada | R | Ward | 61.0 ± 18.0 | 90/98 | 188 | ≤16 | 35 | 33 | 11 | 109 |
| Lee, (2003) | Korea | P | ICU | 54.1 | 18/48 | 66 | ≤16 | 26 | 14 | 4 | 22 |
| Bergstrom and Braden, (2002) | USA | P | LTCF | 19–99 | NR | 825 | ≤18 | 74 | 165 | 32 | 554 |
| Schoonhoven et al., (2002) | Netherlands | P | Ward | 67.2 ± 14.8 | NR | 2,190 | ≤18 | 105 | 628 | 136 | 1,321 |
| Bergquist and Frantz, (2001) | USA | R | LTCF | 78.78 ± 8.38 | 1070/641 | 1696 | ≤19 | 75 | 604 | 32 | 985 |
| Halfens et al., (2000) | Netherlands | P | Ward | 60.9 ± 18.3 | 153/167 | 320 | ≤20 | 34 | 82 | 13 | 191 |
| Lewicki et al., (2000) | USA | P | Ward | 62 ± 11.59 | 83/254 | 337 | ≤14 | 9 | 26 | 7 | 295 |
| Hagisawa and Barbenel, (1999) | Japan | P | Ward | NR | NR | 275 | ≤16 | 5 | 0 | 7 | 263 |
| Bergstrom et al., (1998) | USA | P | LTCF | 63 ± 16 | 94/161 | 255 | ≤18 | 49 | 52 | 12 | 142 |
| Goodridge et al., (1998) | Canada | P | Ward | 78.6 ± 8.5 | NR | 330 | ≤19 | 22 | 134 | 10 | 164 |
| Lyder et al., (1998) | USA | P | Ward | 71.0 ± 6.5 | 21/15 | 36 | ≤16 | 5 | 0 | 9 | 22 |
| Schue and Langemo, (1998) | USA | R | Ward | 69.2 ± 10.9 | 0/170 | 170 | ≤18 | 33 | 50 | 13 | 74 |
| Pang and Wong, (1998) | China | P | Ward | 45–92 | 54/52 | 106 | ≤18 | 19 | 32 | 2 | 53 |
| Baldwin and Ziegler, (1998) | USA | P | ICU | 31.7 ± 10.9 | 20/16 | 36 | ≤10 | 10 | 1 | 1 | 24 |
| Olson et al., (1998) | Canada | P | Ward | 54.8–62.4 | NR | 128 | ≤16 | 9 | 19 | 2 | 98 |
| Watkinson, (1997) | UK | P | Ward | 82.7 | 68/24 | 92 | ≤16 | 14 | 18 | 1 | 59 |
| Capobianco and McDonald, (1996) | USA | P | Ward | 66.9 ± 19.3 | 32/18 | 50 | ≤18 | 10 | 6 | 4 | 30 |
| Harrison et al., (1996) | Canada | P | ACU | 60.0 ± 19.0 | 362/376 | 738 | ≤19 | 147 | 176 | 72 | 343 |
| VandenBosch et al., (1996) | USA | P | Ward | 67 ± 13.8 | 54/49 | 103 | ≤17 | 17 | 30 | 12 | 44 |
| Ramundo, (1995) | USA | P | LTCF | NR | NR | 48 | ≤18 | 7 | 27 | 0 | 14 |
| Braden and Bergstrom, (1994) | USA | P | LTCF | 75.9 ± 9.45 | 73/29 | 102 | ≤18 | 22 | 19 | 6 | 55 |
| Barnes and Payton, (1993) | USA | P | AVU | 50–90 | 178/183 | 361 | ≤16 | 16 | 32 | 6 | 307 |
| Salvadalena et al., (1992) | USA | P | Ward | 72.0 ± 13.0 | 63/34 | 99 | ≤16 | 8 | 24 | 12 | 55 |
| Choi and Song, (1991) | Korea | P | Ward | 54.1 | 57/89 | 146 | ≤16 | 13 | 8 | 3 | 122 |
| Langemo et al., (1991) | USA | P | LTCF | 66 | NR | 25 | ≤18 | 4 | 7 | 3 | 11 |
| Bergstrom et al., (1987) | USA | P | ICU | 58.5 ± 14.5 | 32/28 | 60 | ≤16 | 20 | 13 | 4 | 23 |
Abbreviations: ACU, acute care unit; ICU, intensive care unit; LTCF, long‐term care facility; TP, true positive; FP, false positive; FN, false negative; TN, true negative; R, retrospective; P, prospective; and NR, no report.
FIGURE 1.

Flow diagram of article of selection
5.2. Study characteristics
The baseline characteristics of these included studies are shown in Table 1. In total, 49,326 individuals were involved in this meta‐analysis, whose mean age ranged from 31–84 years. These studies were published between 1987–2019. 45 studies were performed in hospitals and 15 in long‐term care facilities (LTCF). Of all studies, 47 were prospective and 13 were retrospective in nature. Among these studies, 41 studies were performed in Caucasian populations, while 19 studies were conducted in Asian populations. The cut‐off point showed a wide range between 10–20 out of the total score of 23.
5.3. Results of risk of bias
The risk of bias and applicability were assessed. In the risk of bias, a low risk of patient selection was shown in 11 (18%) studies, and 39 (65%) studies were observed to have low risk in terms of the index test. Reference standard in 58 (97%) studies were judged to have a low risk of bias, and 50 (83%) studies belonged to low risk in the domain of flow and timing. In applicability, 44 (73%) studies were deemed to be low risk in the patient selection, 51 (85%) studies in the index test and 58 (97%) studies in the reference standard. Details regarding risk of bias and applicability are summarized in Figure 2.
FIGURE 2.
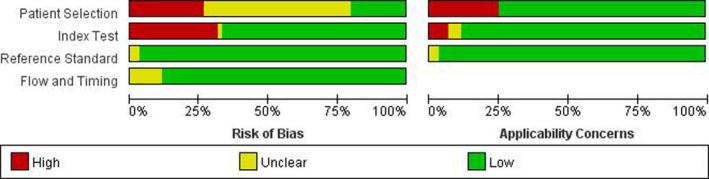
Study quality assessment results
5.4. Predictive validity of the Braden Scale
The pooled SEN was 0.78 (95% CI: 0.74 to 0.82), and the pooled SPE was 0.72 (95% CI: 0.66 to 0.78) (Figure 3). The pooled PLR and NLR were 2.80 (95% CI: 2.30 to 3.50) and 0.30 (95% CI: 0.26 to 0.35), respectively, which yielded a DOR of 9.00 (95% CI: 7.00 to 13.00). In addition, the SROC AUC was 0.82 (95% CI: 0.79 to 0.85) (Figure 4). I2 values in SEN and SPE reached 96.10% (c2 = 1512.52, p <.05) and 99.17% (c2 = 7820.13, p <.05), respectively.
FIGURE 3.
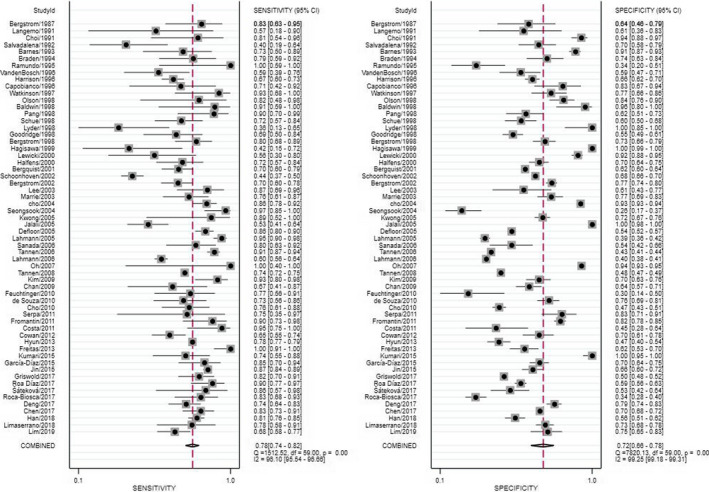
Sensitivity and specificity of included studies
FIGURE 4.
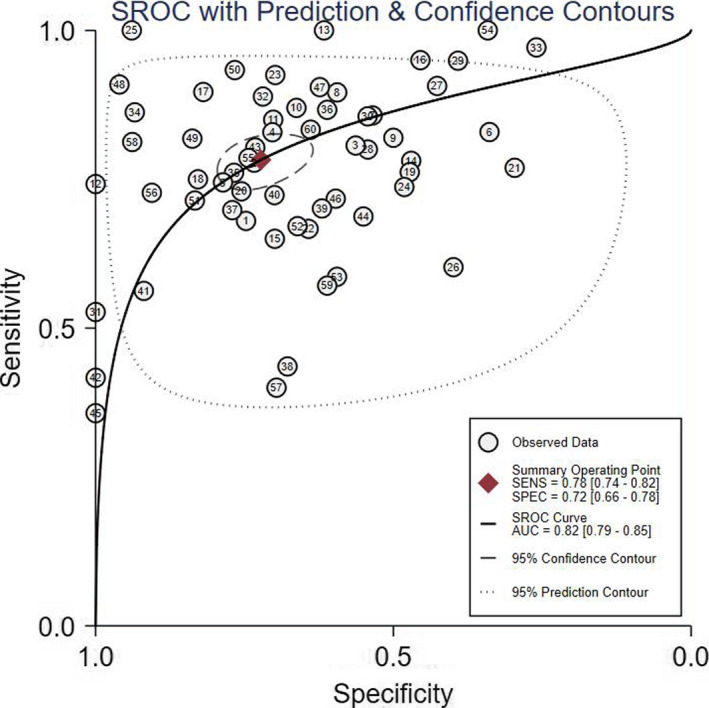
Summary receiver operating characteristic curve
5.5. Threshold effect
Visual inspection of forest plots and SROC curves, as well as Spearman's correlation of 0.334 (p =.009), suggested the presence of a threshold effect to some extent. The pooled results of different cut‐off points are shown in Table 2.
TABLE 2.
Summary results of meta‐analysis
| n | SEN (95% CI) | SPE (95% CI) | PLR (95% CI) | NLR (95% CI) | DOR (95% CI) | AUC (95% CI) | |
|---|---|---|---|---|---|---|---|
| Total | 60 | 0.78 (0.74–0.82) | 0.72 (0.66–0.78) | 2.80 (2.30–3.50) | 0.30(0.26–0.35) | 9.00 (7.00–13.00) | 0.82 (0.79–0.85) |
| Outlier excluded | 52 | 0.79 (0.76–0.82) | 0.70 (0.64–0.74) | 2.60 (2.20–3.10) | 0.30 (0.26–0.35) | 8.00 (6.00–11.00) | 0.82 (0.78–0.85) |
| Study design | |||||||
| Prospective | 47 | 0.80 (0.74–0.84) | 0.75 (0.67–0.82) | 3.20 (2.40–4.30) | 0.27 (0.22–0.33) | 12.00 (8.00–18.00) | 0.84 (0.81–0.87) |
| Retrospective | 13 | 0.77 (0.73–0.81) | 0.65 (0.58–0.71) | 2.20 (1.80–2.60) | 0.36 (0.30–0.43) | 6.00 (5.00–9.00) | 0.78 (0.75–0.82) |
| Mean age | |||||||
| <60 | 16 | 0.83 (0.79–0.87) | 0.78 (0.68–0.85) | 3.70 (2.50–5.50) | 0.22 (0.16–0.28) | 17.00 (10.00–31.00) | 0.87 (0.84–0.90 |
| ≥60 | 44 | 0.77 (0.71–0.81) | 0.71 (0.62–0.79) | 2.70 (2.10–3.40) | 0.33 (0.28–0.39) | 8.00 (6.00–11.00) | 0.81 (0.77–0.84) |
| Setting | |||||||
| Hospital | 46 | 0.76 (0.72–0.80) | 0.77 (0.69–0.84) | 3.40 (2.50–4.50) | 0.31 (0.26–0.36) | 11.00 (7.00–16.00) | 0.82 (0.79–0.86) |
| ACU | 5 | 0.68 (0.62–0.74) | 0.74 (0.63–0.83) | 2.60 (1.70–4.10) | 0.43 (0.33–0.56) | 6.00 (3.00–12.00) | 0.72 (0.67–0.75) |
| ICU | 17 | 0.83 (0.79–0.86) | 0.59(0.49–0.68) | 2.00 (1.60–2.50) | 0.29(0.23–0.37) | 7.00 (4.00–10.00) | 0.83 (0.79–0.86) |
| Wards | 24 | 0.71 (0.64–0.78) | 0.87 (0.78–0.93) | 5.60 (3.20–9.80) | 0.33 (0.26–0.42) | 17.00 (9.00–33.00) | 0.83 (0.80–0.86) |
| LTCF | 14 | 0.84 (0.77–0.90) | 0.58 (0.51–0.66) | 2.00 (1.70–2.40) | 0.27 (0.18–0.39) | 8.00 (5.00–12.00) | 0.77 (0.74–0.81) |
| Ethnicity | |||||||
| Asian | 19 | 0.80 (0.74–0.85) | 0.84 (0.67–0.93) | 4.90 (2.40–10.10) | 0.24 (0.19–0.30) | 20.00 (10.00–43.00) | 0.82 (0.79–0.86) |
| Caucasian | 41 | 0.77 (0.72–0.82) | 0.68 (0.61–0.73) | 2.40 (2.00–2.80) | 0.33 (0.27–0.40) | 7.00 (5.00–10.00) | 0.86 (0.82–0.88) |
| Cut‐off | |||||||
| ≤15 | 15 | 0.79 (0.76–0.82) | 0.66 (0.55–0.75) | 2.30 (1.70–3.20) | 0.31 (0.25–0.40) | 7.00 (4.00–12.00) | 0.80 (0.76–0.83) |
| 16 | 19 | 0.75 (0.67–0.82) | 0.85 (0.70–0.93) | 5.00 (2.50–10.20) | 0.29 (0.23–0.37) | 17.00 (8.00–36.00) | 0.84 (0.80–0.87) |
| 17 | 4 | 0.69 (0.61–0.76) | 0.86 (0.50–0.97) | 4.90 (1.00–25.00) | 0.36 (0.23–0.55) | 14.00 (2.00–103.00) | 0.73 (0.69–0.77) |
| 18 | 15 | 0.82 (0.73–0.89) | 0.70 (0.62–0.77) | 2.70 (2.10–3.60) | 0.25 (0.16–0.39) | 11.00 (6.00–20.00) | 0.83 (0.79–0.86) |
| ≥19 | 7 | 0.78 (0.65–0.87) | 0.54 (0.44–0.63) | 1.70 (1.40–2.00) | 0.41 (0.26–0.65) | 4.00 (2.00–7.00) | 0.67 (0.63–0.71) |
Abbreviations: SEN, sensitivity; SPE, specificity; PLR, positive likelihood ratio; NLR, negative likelihood ratio; DOR, diagnostic odds ratio; AUC, area under the curve; 95% CIs, 95% confidence intervals; ACU, acute care unit; ICU, intensive care unit; LTCF, long‐term care facility.
5.6. Subgroup analyses
In order to explore possible heterogeneity factors, we performed subgroup analyses based on study design (prospective vs. retrospective), mean age (<60 years vs. ≥60 years) (Matsumoto et al., 2018), setting (hospital vs. LTCF) and ethnicity (Asian population vs. Caucasian population). The pooled diagnostic parameters for subgroup analyses are summarized in Table 2.
5.7. Sensitivity analysis and publication bias
We carried out sensitivity analysis to assess the result reliability in Figure 5. The goodness of fit and bivariate normality showed that the included studies had only minimal influence on the overall estimates. Influence analysis and outlier detection identified eight outlier studies. After excluding these outlier studies, the SEN increased from 0.78–0.79, the SPE dropped from 0.72–0.70, the PLR decreased from 2.80–2.60, the NLR showed no change from 0.30–0.30, the DOR decreased from 9.00–8.00, and the AUC showed no change from 0.82–0.82, which suggested that the random‐effects bivariate model was robust for the calculation of the pooled estimates. Finally, Deeks’ funnel plot asymmetry test was used to assess the potential publication bias. The funnel plot (Figure 6) was not fully symmetrical, suggesting publication bias may exist in this meta‐analysis (p <.05).
FIGURE 5.
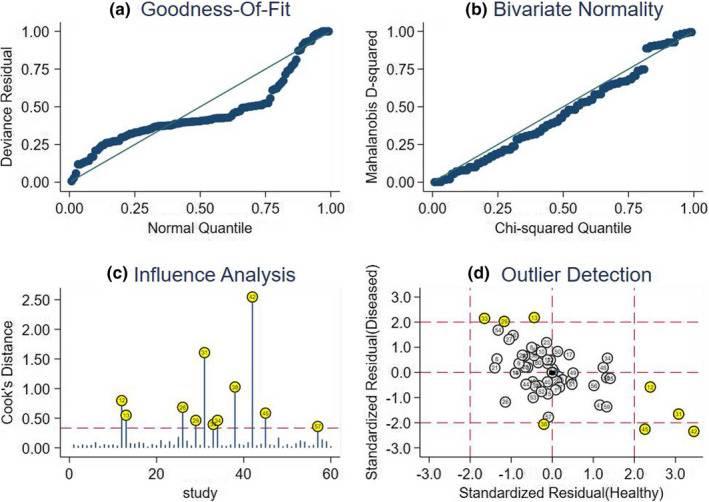
Sensitivity analysis results. a Goodness of fit; b bivariate normality; c influence analysis; and d outlier detection
FIGURE 6.
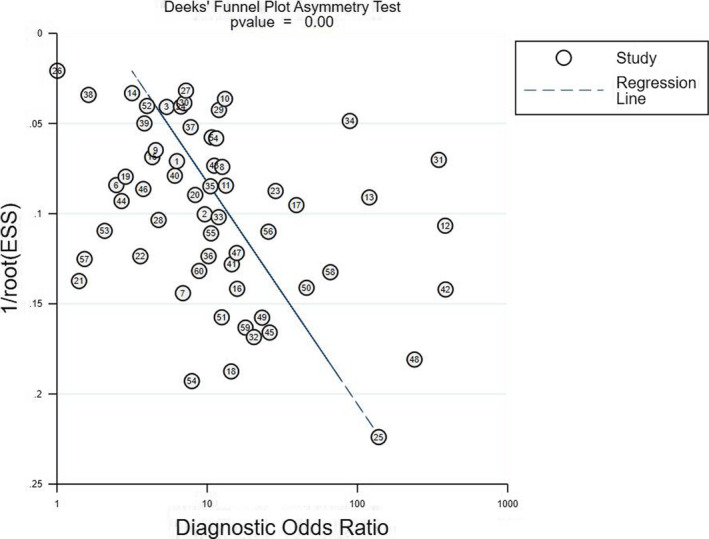
Deek's funnel plot asymmetry test for identifying publication bias
6. DISCUSSION
This meta‐analysis included 60 studies involving 49,326 patients. The pooled SEN, SPE, PLR, NLR, DOR and AUC were 0.78, 0.72, 2.80, 0.30, 9.00 and 0.82, respectively. Subgroup analyses indicated that the Braden Scale was more accurate in assessing the risk of PIs for mean age <60 years, hospitalized patients and Caucasian population. When the cut‐off value was 18, the Braden Scale was the most effective in identifying PIs’ risk.
The results indicated that the probability of a positive result was 78% when the Braden Scale was used to assess a person who actually developed PI, and the probability of a negative result was 72% when the Braden Scale was applied to assess a person who did not actually develop PI. The pooled PLR and NLR were also calculated in order to evaluate the diagnostic accuracy in clinical level. The pooled PLR value was 2.80, suggesting that the probability of PI in a person with a positive test was 2.80‐fold higher than that in a healthy individual. By contrast, the pooled NLR indicated that the probability of not having PI in a person with a negative test was 30%. Meanwhile, DOR demonstrated a high level of overall accuracy. DOR, which is found by dividing PLR by NLR, can range from 0–infinity, and a higher DOR represents higher accuracy (Deeks, 2001). Finally, the AUC (0.83) showed that the Braden Scale had a moderate predictive validity for PI risk assessment. In addition, compared with the Waterlow Scale (0.75) and the Norton Scale (0.55) (Park & Lee, 2016), the Braden Scale had a higher SEN. Based on the results above, it was suggested that the Braden Scale might be more suitable for PI risk assessment. The reasons are shown as follows: (a) a good assessment tool was high in both SEN (true‐positive rate) and SPE (true‐negative rate), which was generally unavailable in clinical settings (Park et al., 2015). PI risk assessment was a screening inspection that preferred a higher sensitive tool rather than a higher specific tool. When the AUC was the same, the higher SEN was better in identifying the risk of PIs, which was beneficial to taking PI preventive interventions in time; and (b) risk assessment tools of PIs were based on its risk factors. The Braden Scale included more factors than the Waterlow Scale and the Norton Scale, such as restricted mobility, limited sensory perception and excess moisture. They are important factors that lead to the development of PIs. Considering that preventive measures are more cost‐effective than therapeutic measures for PIs (Zarei et al., 2019), it is suggested that nursing staffs apply the Braden Scale to identify factors that impact on an individual's risk in clinical practice.
Given the significant heterogeneity among included studies, we carried out threshold analyses. Spearman's correlation of 0.334 (p =.009) suggested the presence of a threshold effect to some extent. Threshold effect occurs when different cut‐off values are used to define a positive test result in different studies, affecting the reported sensitivity and specificity of the test (Mahmood et al., 2019). In this meta‐analysis, the cut‐off value ranged from 10–20, which indicated that the cut‐off value might be the primary reason of significant heterogeneity. Moreover, we conducted cut‐off‐stratified analyses according to the values ≤15, 16, 17, 18 and ≥19. Compared with other cut‐off values, 16 and 18 were better in SEN (0.75 and 0.82), SPE (0.85 and 0.70) and AUC (0.84 and 0.83), which were also widely used in clinical practice nowadays. As a result, it seemed that the cut‐off value of 18 might be the best choice. The possible reason was that a risk assessment tool for PIs was not a diagnostic tool for the incidence of PIs but instead a screening tool assessing the risk of PIs. The cut‐off value of 18 had a higher SEN than that of 16. However, in view of the characteristics in the specific clinical setting, whether the value of 18 can be treated as the optimal cut‐off was unknown. Future studies could explore this issue among different populations, such as medical, surgical, critical and elderly patients. In addition, it is necessary to conduct multi‐centre, large‐sample studies in order to verify the effectiveness of 16 and 18 in PI risk assessment.
Based on the subgroup analyses, we found that results showed a higher level of accuracy among prospective studies (AUC: 0.84) than retrospective design (AUC: 0.78), which may be attributed to more rigorous design in the prospective studies. Although there was no significant difference in the AUC (0.87 vs. 0.81) between the young and middle‐aged population and the elderly, the pooled SEN and SPE of the young and middle‐aged population were 0.83 and 0.78, while those of the elderly were 0.77 and 071. Based on these, we found that the Braden Scale was more accurate in the young and middle‐aged population than in elderly. The possible reason was that older people developed chronic diseases due to their declined physiological reserve (Jaul, 2010), which was not considered in the Braden Scale. Moreover, oxygenation and perfusion situations that do not exist in the Braden Scale may also affect PI development in elderly people (Iranmanesh et al., 2012). An additional finding was that the Braden Scale had a higher diagnostic accuracy in the hospital than in the LTCF (AUC, 0.82 vs. 0.77). Such result correlated with some published studies (Park et al., 2015; Wei et al., 2020), but different from another study (Wei et al., 2012). The small number of selected studies might contribute to the difference. Further studies with an increased number of studies could clarify the inconsistency issue among studies. Moreover, compared with its use in the acute care unit (AUC: 0.72, SEN: 0.68, SPE: 0.74) and intensive care unit (AUC: 0.83, SEN: 0.83, SPE: 0.59), the Braden scale was more suitable for use in the general wards (AUC: 0.83, SEN: 0.71, SPE: 0.87). The reason was that some other risk factors for PIs in the acute care unit and intensive care unit including emergency environment, sedation, vasoactive agents, mechanical ventilation, incontinence and oedema were not found in the Braden Scale. In terms of ethnicity, the Braden Scale demonstrated higher diagnostic accuracy in the Caucasian population than in Asian population (AUC, 0.86 vs. 0.82). Taking cultural difference into account, the Braden Scale, which was developed in the United States, might be more suitable to Caucasian population.
6.1. Strengths and limitations
The strengths of this meta‐analysis included the large number of patients retained in the quantitative synthesis. Furthermore, this is the first meta‐analysis on the overall accuracy of the Braden Scale for identifying PI risk. In addition, we performed threshold analyses and cut‐off‐stratified analyses, and identified the optimal cut‐off value, which played an important role in determining the risk of PIs. More importantly, sensitivity analysis was performed in order to find outlier studies. After removing the outliers and performing the same analyses for the remaining studies, we found that the overall parameters of diagnostic accuracy did not change significantly, which suggested that the random‐effects bivariate model was robust for the calculation of the pooled estimates. However, there are still several limitations. First, we have implemented a comprehensive systematic literature review, yet the language of the included studies was limited to English and Chinese, which might lead to publication bias. Second, because the cut‐off value of 16 was only found in the 4 original studies, the pooled parameters in the systematic review had a limited interpretation. Future studies should conduct more original researches to compare the effectiveness of 18 with that of 17.
6.2. Implication for practice
The Braden Scale is more suitable to identify the risk of PI for mean age <60 years, hospitalized patients and the Caucasian population. It appears that 18 is the optimal cut‐off value in clinical practice.
7. CONCLUSION
The Braden Scale has a moderate predictive validity for PI risk assessment, and it is more suitable for mean age <60 years, hospitalized patients and Caucasian population, compared with mean age ≥60 years, long‐term care facility and Asian population. Meanwhile, the cut‐off value of 18 afforded the best choice in SEN and AUC, and could be recommended for use in clinical practice. Future studies should explore the optimal cut‐off in the specific environments.
CONFLICT OF INTEREST
The authors declare no conflict of interest.
AUTHOR CONTRIBUTIONS
C.H., Y.M., L.H.: Study design. C.H., Y.M., M.J.: Data collection. C.H., Y.M., C.M.: Data analysis. C.H., Y.M., M.J., C.W., L.H.: Manuscript writing and revisions for important intellectual content.
Supporting information
Supplementary Material
ACKNOWLEDGEMENTS
The authors declare that they have no known competing financial interests or personal relationships that could have appeared to influence the work reported in this paper. This study has been funded by the National Nature Science Foundation of China (Grant Nos. 71663002 and 71704071), the Fund of China Medical Board (#20‐374), the National Scientific Research Training Plan of Gansu Provincial Hospital (19SYPYA‐4), the Research Funds for the School of Nursing of Lanzhou University (LZUSON202002), the Natural Science Foundation of Gansu Province (20JR10RA603) and the Health Industry Scientific Research Project of Gansu Province (GSWSKY2017‐65).
Huang C, Ma Y, Wang C, et al. Predictive validity of the braden scale for pressure injury risk assessment in adults: A systematic review and meta‐analysis. Nurs Open. 2021;8:2194–2207. 10.1002/nop2.792
Funding Information
This study has been funded by the National Nature Science Foundation of China (Grant Nos. 71663002 and 71704071), the Fund of China Medical Board (#20‐374), the National Scientific Research Training Plan of Gansu Provincial Hospital (19SYPYA‐4), the Research Funds for the School of Nursing of Lanzhou University (LZUSON202002), the Natural Science Foundation of Gansu Province (20JR10RA603) and the Health Industry Scientific Research Project of Gansu Province (GSWSKY2017‐65).
DATA AVAILABILITY STATEMENT
The data used to support the findings of this study are available from the corresponding author on reasonable request.
REFERENCES
- Al Mutairi, K. B., & Hendrie, D. (2018). Global incidence and prevalence of pressure injuries in public hospitals: A systematic review. Wound Medicine, 22, 23–31. 10.1016/j.wndm.2018.05.004 [DOI] [Google Scholar]
- Aloweni, F., Ang, S. Y., Fook‐Chong, S., Agus, N., Yong, P., Goh, M. M., Tucker‐Kellogg, L., & Soh, R. C. (2019). A prediction tool for hospital‐acquired pressure ulcers among surgical patients: Surgical pressure ulcer risk score. International Wound Journal, 16(1), 164–175. 10.1111/iwj.13007 [DOI] [PMC free article] [PubMed] [Google Scholar]
- Amir, Y., Lohrmann, C., Halfens, R. J., & Schols, J. M. (2017). Pressure ulcers in four Indonesian hospitals: Prevalence, patient characteristics, ulcer characteristics, prevention and treatment. International Wound Journal, 14(1), 184–193. 10.1111/iwj.12580 [DOI] [PMC free article] [PubMed] [Google Scholar]
- Baldwin, K. M., & Ziegler, S. M. (1998). Pressure ulcer risk following critical traumatic injury. Advances in Wound Care: The Journal for Prevention and Healing, 11(4), 168–173. 10.1016/S1361-3111(98)80058-7 [DOI] [PubMed] [Google Scholar]
- Barnes, D., & Payton, R. G. (1993). Clinical application of the Braden Scale in the acute‐care setting. Dermatology Nursing, 5(5), 386–388. [PubMed] [Google Scholar]
- Bergquist, S., & Frantz, R. (2001). Braden scale: Validity in community‐based older adults receiving home health care. Applied Nursing Research, 14(1), 36–43. 10.1053/apnr.2001.21079 [DOI] [PubMed] [Google Scholar]
- Bergstrom, N., & Braden, B. J. (2002). Predictive validity of the Braden Scale among Black and White subjects. Nursing Research, 51(6), 398–403. 10.1097/00006199-200211000-00008 [DOI] [PubMed] [Google Scholar]
- Bergstrom, N., Braden, B., Kemp, M., Champagne, M., & Ruby, E. (1998). Predicting pressure ulcer risk: A multisite study of the predictive validity of the Braden Scale. Nursing Research, 47(5), 261–269. 10.1097/00006199-199809000-00005 [DOI] [PubMed] [Google Scholar]
- Bergstrom, N., Braden, B., Laguzza, A., & Holman, V. (1987). The Braden Scale for predicting pressure sore risk. Nursing Research, 36(4), 205–210. 10.1097/00006199-198707000-00002 [DOI] [PubMed] [Google Scholar]
- Braden, B. J., & Bergstrom, N. (1994). Predictive validity of the Braden Scale for pressure sore risk in a nursing home population. Research in Nursing & Health, 17(6), 459–470. 10.1002/nur.4770170609 [DOI] [PubMed] [Google Scholar]
- Bredesen, I. M., Bjøro, K., Gunningberg, L., & Hofoss, D. (2015). The prevalence, prevention and multilevel variance of pressure ulcers in Norwegian hospitals: A cross‐sectional study. International Journal of Nursing Studies, 52(1), 149–156. 10.1016/j.ijnurstu.2014.07.005 [DOI] [PubMed] [Google Scholar]
- Capobianco, M. L., & McDonald, D. D. (1996). Factors affecting the predictive validity of the Braden Scale. Advances in Wound Care: The Journal for Prevention and Healing, 9(6), 32–36. [PubMed] [Google Scholar]
- Chan, W. S., Pang, S. M. C., & Kwong, E. W. Y. (2009). Assessing predictive validity of the modified Braden scale for prediction of pressure ulcer risk of orthopaedic patients in an acute care setting. Journal of Clinical Nursing, 18(11), 1565–1573. 10.1111/j.1365-2702.2008.02757.x [DOI] [PubMed] [Google Scholar]
- Chen, H.‐L., Cao, Y.‐J., Zhang, W., Wang, J., & Huai, B.‐S. (2017). Braden scale (ALB) for assessing pressure ulcer risk in hospital patients: A validity and reliability study. Applied Nursing Research, 33, 169–174. 10.1016/j.apnr.2016.12.001 [DOI] [PubMed] [Google Scholar]
- Chen, H. L., Shen, W. Q., & Liu, P. (2016). A meta‐analysis to evaluate the predictive validity of the braden scale for pressure ulcer risk assessment in long‐term care. Ostomy Wound Manage, 62(9), 20–28. [PubMed] [Google Scholar]
- Cho, I., & Noh, M. (2010). Braden Scale: Evaluation of clinical usefulness in an intensive care unit. Journal of Advanced Nursing, 66(2), 293–302. 10.1111/j.1365-2648.2009.05153.x [DOI] [PubMed] [Google Scholar]
- Cho, M., Park, I., Kim, K., Woo, K., Joo, Y., Jeong, E., & Park, M. (2004). Evaluation of predictive validity for the pressure ulcer risk assessment tool in a medical ward inpatient: Using Braden scale. The Korean Nurses, 43(2), 68–82. [Google Scholar]
- Choi, K. S., & Song, M. S. (1991). Test of predictive validity for the new pressure risk assessment scale. Journal of Korean Academy of Adult Nursing, 3(1), 19–28. [Google Scholar]
- Chou, R., Dana, T., Bougatsos, C., Blazina, I., Starmer, A. J., Reitel, K., & Buckley, D. I. (2013). Pressure ulcer risk assessment and prevention: A systematic comparative effectiveness review. Annals of Internal Medicine, 159(1), 28–38. 10.7326/0003-4819-159-1-201307020-00006 [DOI] [PubMed] [Google Scholar]
- Coleman, S., Gorecki, C., Nelson, E. A., Closs, S. J., Defloor, T., Halfens, R., Farrin, A., Brown, J., Schoonhoven, L., & Nixon, J. (2013). Patient risk factors for pressure ulcer development: Systematic review. International Journal of Nursing Studies, 50(7), 974–1003. 10.1016/j.ijnurstu.2012.11.019 [DOI] [PubMed] [Google Scholar]
- Costa, I. G., & Caliri, M. H. L. (2011). Predictive validity of the Braden Scale for patients in intensive care. Acta Paulista De Enfermagem, 24(6), 772–777. [Google Scholar]
- Cowan, L. J., Stechmiller, J. K., Rowe, M., & Kairalla, J. A. (2012). Enhancing B raden pressure ulcer risk assessment in acutely ill adult veterans. Wound Repair and Regeneration, 20(2), 137–148. 10.1111/j.1524-475X.2011.00761.x [DOI] [PubMed] [Google Scholar]
- de Souza, D. M. S. T., de Gouveia Santos, V. L. C., Iri, H. K., & Oguri, M. Y. S. (2010). Predictive validity of the Braden Scale for Pressure Ulcer Risk in elderly residents of long‐term care facilities. Geriatric Nursing, 31(2), 95–104. 10.1016/j.gerinurse.2009.11.010 [DOI] [PubMed] [Google Scholar]
- Deeks, J. J. (2001). Systematic reviews in health care: Systematic reviews of evaluations of diagnostic and screening tests. BMJ, 323(7305), 157–162. [DOI] [PMC free article] [PubMed] [Google Scholar]
- Deeks, J. J., Macaskill, P., & Irwig, L. (2005). The performance of tests of publication bias and other sample size effects in systematic reviews of diagnostic test accuracy was assessed. Journal of Clinical Epidemiology, 58(9), 882–893. 10.1016/j.jclinepi.2005.01.016 [DOI] [PubMed] [Google Scholar]
- Defloor, T., & Grypdonck, M. F. (2005). Pressure ulcers: Validation of two risk assessment scales. Journal of Clinical Nursing, 14(3), 373–382. 10.1111/j.1365-2702.2004.01058.x [DOI] [PubMed] [Google Scholar]
- Demarré, L., Van Lancker, A., Van Hecke, A., Verhaeghe, S., Grypdonck, M., Lemey, J., Annemans, L., & Beeckman, D. (2015). The cost of prevention and treatment of pressure ulcers: A systematic review. International Journal of Nursing Studies, 52(11), 1754–1774. [DOI] [PubMed] [Google Scholar]
- Deng, X., Yu, T., & Hu, A. (2017). Predicting the risk for hospital‐acquired pressure ulcers in critical care patients. Critical Care Nurse, 37(4), e1–e11. 10.4037/ccn2017548 [DOI] [PubMed] [Google Scholar]
- Ferris, A., Price, A., & Harding, K. (2019). Pressure ulcers in patients receiving palliative care: A systematic review. Palliative Medicine, 33(7), 770–782. [DOI] [PubMed] [Google Scholar]
- Feuchtinger, J., Halfens, R., & Dassen, T. (2010). Pressure ulcer risk assessment immediately after cardiac surgery–does it make a difference? A comparison of three pressure ulcer risk assessment instruments within a cardiac surgery population. Nursing in Critical Care, 12(1), 42–49. 10.1111/j.1478-5153.2006.00198.x [DOI] [PubMed] [Google Scholar]
- Freitas, J. D. P. C., & Alberti, L. R. (2013). Application of the Braden Scale in the home setting: Incidence and factors associated with pressure ulcers. Acta Paulista De Enfermagem, 26(6), 515–521. [Google Scholar]
- Fromantin, I., Falcou, M., Baffie, A., Petot, C., Mazerat, R., Jaouen, C., Téot, L., & de Rycke, Y. (2011). Inception and validation of a pressure ulcer risk scale in oncology. Journal of Wound Care, 20(7), 328–334. 10.12968/jowc.2011.20.7.328 [DOI] [PubMed] [Google Scholar]
- García‐Díaz, F. J., Cabello‐Jaime, R., Muñoz‐Conde, M., Bergera‐Lezaun, I., Blanca‐Barba, F., Carrasco‐Herrero, J. M., Cubo‐Arroyo, J. D., Dumont‐Lupianez, E., Fernández‐Sevilla‐Leyva, A. B., & Gálvez‐Esquinas, J. (2015). Validación de las escalas de Braden y EMINA en pacientes de atención domiciliaria incluidos en programa de inmovilizados. Gerokomos, 26(4), 150–156. [Google Scholar]
- Goodridge, D. M., Sloan, J. A., LeDoyen, Y. M., McKenzie, J.‐A., Knight, W. E., & Gayari, M. (1998). Risk‐assessment scores, prevention strategies, and the incidence of pressure ulcers among the elderly in four Canadian health‐care facilities. Canadian Journal of Nursing Research Archive, 30(2), 23–44. [PubMed] [Google Scholar]
- Graves, N., & Zheng, H. (2014). The prevalence and incidence of chronic wounds: A literature review. Wound Practice & Research: Journal of the Australian Wound Management Association, 22(1), 4. [Google Scholar]
- Greiner, M., Pfeiffer, D., & Smith, R. (2000). Principles and practical application of the receiver‐operating characteristic analysis for diagnostic tests. Preventive Veterinary Medicine, 45(1–2), 23–41. [DOI] [PubMed] [Google Scholar]
- Griswold, L. H., Griffin, R. L., Swain, T., & Kerby, J. D. (2017). Validity of the Braden Scale in grading pressure ulcers in trauma and burn patients. Journal of Surgical Research, 219, 151–157. 10.1016/j.jss.2017.05.095 [DOI] [PubMed] [Google Scholar]
- Hagisawa, S., & Barbenel, J. (1999). The limits of pressure sore prevention. Journal of the Royal Society of Medicine, 92(11), 576–578. 10.1177/014107689909201109 [DOI] [PMC free article] [PubMed] [Google Scholar]
- Halfens, R., Van Achterberg, T., & Bal, R. (2000). Validity and reliability of the Braden scale and the influence of other risk factors: A multi‐centre prospective study. International Journal of Nursing Studies, 37(4), 313–319. 10.1016/S0020-7489(00)00010-9 [DOI] [PubMed] [Google Scholar]
- Han, Y., Choi, J. E., Jin, Y. J., Jin, T. X., & Lee, S.‐M. (2018). Usefulness of the braden scale in intensive care units: A study based on electronic health record data. Journal of Nursing Care Quality, 33(3), 238–246. 10.1097/NCQ.0000000000000305 [DOI] [PubMed] [Google Scholar]
- Harrison, M. B., Wells, G., Fisher, A., & Prince, M. (1996). Practice guidelines for the prediction and prevention of pressure ulcers: Evaluating the evidence. Applied Nursing Research, 9(1), 9–17. 10.1016/S0897-1897(96)80324-7 [DOI] [PubMed] [Google Scholar]
- Higgins, J. P., Thompson, S. G., Deeks, J. J., & Altman, D. G. (2003). Measuring Inconsistency in meta‐analyses. British Medical Journal, 327(7414), 557–560. [DOI] [PMC free article] [PubMed] [Google Scholar]
- Hiromi Sanada, S., Sugama, J., Thigpen, B., Kitagawa, A., Kinosita, S., & Murayama, S. (2006). A new instrument for predicting pressure ulcer risk in an intensive care unit. Journal of Tissue Viability, 16(3), 21–26. 10.1016/S0965-206X(06)63006-4 [DOI] [PubMed] [Google Scholar]
- Hyun, S., Vermillion, B., Newton, C., Fall, M., Li, X., Kaewprag, P., Moffatt‐Bruce, S., & Lenz, E. R. (2013). Predictive validity of the Braden scale for patients in intensive care units. American Journal of Critical Care, 22(6), 514–520. [DOI] [PMC free article] [PubMed] [Google Scholar]
- Iranmanesh, S., Rafiei, H., & Sabzevari, S. (2012). Relationship between Braden scale score and pressure ulcer development in patients admitted in trauma intensive care unit. International Wound Journal, 9(3), 248–252. [DOI] [PMC free article] [PubMed] [Google Scholar]
- Jackson, D., Sarki, A. M., Betteridge, R., & Brooke, J. (2019). Medical device‐related pressure ulcers: A systematic review and meta‐analysis. International Journal of Nursing Studies, 92, 109–120. [DOI] [PubMed] [Google Scholar]
- Jalali, R., & Rezaie, M. (2005). Predicting pressure ulcer risk: Comparing the predictive validity of 4 scales. Advances in Skin & Wound Care, 18(2), 92–97. [DOI] [PubMed] [Google Scholar]
- Jaul, E. (2010). Assessment and management of pressure ulcers in the elderly. Drugs & Aging, 27(4), 311–325. [DOI] [PubMed] [Google Scholar]
- Jin, Y., Piao, J., & Lee, S. M. (2015). Evaluating the validity of the Braden scale using longitudinal electronic medical records. Research in Nursing & Health, 38(2), 152–161. [DOI] [PubMed] [Google Scholar]
- Jones, C. M., & Athanasiou, T. (2005). Summary receiver operating characteristic curve analysis techniques in the evaluation of diagnostic tests. Annals of Thoracic Surgery, 79(1), 16–20. [DOI] [PubMed] [Google Scholar]
- Kelechi, T. J., Arndt, J. V., & Dove, A. (2013). Review of pressure ulcer risk assessment scales. Journal of Wound Ostomy and Continence Nursing, 40(3), 232–236. [DOI] [PubMed] [Google Scholar]
- Kim, E.‐K., Lee, S.‐M., Lee, E., & Eom, M.‐R. (2009). Comparison of the predictive validity among pressure ulcer risk assessment scales for surgical ICU patients. Australian Journal of Advanced Nursing, 26(4), 87. [Google Scholar]
- Kumari, S., Sharma, D., Rana, A., Pathak, R., Lal, R., Kumar, A., & Biswal, U. (2015). Risk assessment tool for pressure ulcer development in Indian surgical wards. Indian Journal of Surgery, 77(3), 206–212. [DOI] [PMC free article] [PubMed] [Google Scholar]
- Kwong, E., Pang, S., Wong, T., Ho, J., Shao‐ling, X., & Li‐jun, T. (2005). Predicting pressure ulcer risk with the modified Braden, Braden, and Norton scales in acute care hospitals in Mainland China. Applied Nursing Research, 18(2), 122–128. [DOI] [PubMed] [Google Scholar]
- Lahmann, N. A., Halfens, R. J., & Dassen, T. (2005). Prevalence of pressure ulcers in Germany. Journal of Clinical Nursing, 14(2), 165–172. [DOI] [PubMed] [Google Scholar]
- Lahmann, N., Halfens, R. J. G., & Dassen, T. (2006). Pressure ulcers in German nursing homes and acute care hospitals: Prevalence, frequency, and ulcer characteristics. Ostomy Wound Management, 52(2), 20–33. [PubMed] [Google Scholar]
- Langemo, D. K., Olson, B., Hunter, S., Hanson, D., Burd, C., & Cathcart‐Silberberg, T. (1991). Incidence and prediction of pressure ulcers in five patient care settings. Decubitus, 4(3), 25–26, 28, 30 passim. [PubMed] [Google Scholar]
- Lee, J. K. (2003). The relationship of risk assessment using Braden scale and development of pressure sore in neurologic intensive care unit. Journal of Korean Academy of Adult Nursing, 15(2), 267–277. [Google Scholar]
- Lewicki, L. J., Mion, L. C., & Secic, M. (2000). Sensitivity and specificity of the Braden Scale in the cardiac surgical population. Journal of Wound Ostomy and Continence Nursing, 27(1), 36–41. [DOI] [PubMed] [Google Scholar]
- Li, Z., Lin, F., Thalib, L., & Chaboyer, W. (2020). Global prevalence and incidence of pressure injuries in hospitalised adult patients: A systematic review and meta‐analysis. International Journal of Nursing Studies, 105, 103546–103546. [DOI] [PubMed] [Google Scholar]
- Lim, E., Mordiffi, Z., Chew, H. S., & Lopez, V. (2019). Using the Braden subscales to assess risk of pressure injuries in adult patients: A retrospective case‐control study. International Wound Journal, 15, 665–673. [DOI] [PMC free article] [PubMed] [Google Scholar]
- Limaserrano, M., Gonzalezmendez, M. I., Martincastano, C., Alonsoaraujo, I., & Limarodriguez, J. S. (2018). Predictive validity and reliability of the Braden scale for risk assessment of pressure ulcers in an intensive care unit. Medicina Intensiva, 42(2), 82–91. [DOI] [PubMed] [Google Scholar]
- Lyder, C. H., Yu, C., Stevenson, D., Mangat, R., Empleofrazier, O., Emerling, J., & Mckay, J. (1998). Validating the Braden Scale for the prediction of pressure ulcer risk in blacks and Latino/Hispanic elders: A pilot study. Ostomy Wound Management, 44. [PubMed] [Google Scholar]
- Macaskill, P., Gatsonis, C., Deeks, J., Harbord, R., & Takwoingi, T. (2010). Cochrane Handbook for Systematic Reviews of Diagnostic Test Accuracy version 1.0.
- Mahmood, M., Kendi, A. T., Ajmal, S., Farid, S., O'Horo, J. C., Chareonthaitawee, P., Baddour, L. M., & Sohail, M. R. (2019). Meta‐analysis of 18F‐FDG PET/CT in the diagnosis of infective endocarditis. Journal of Nuclear Cardiology, 26(3), 922–935. [DOI] [PubMed] [Google Scholar]
- Mallow, P. J., Bhavik, P., Ruslan, H., & Kaplan, H. S. (2013). Prevalence and cost of hospital medical errors in the general and elderly United States populations. Journal of Medical Economics, 16(12), 1367–1378. [DOI] [PubMed] [Google Scholar]
- Marrie, R. A., Ross, J., & Rockwood, K. (2003). Pressure Ulcers: Prevalence, staging, and assessment of risk. Geriatrics Today, 6, 134–140. [Google Scholar]
- Matsumoto, W. K., Munhoz, A. M., Okada, A., Montag, E., Arruda, E. G., Fonseca, A., Ferrari, O., Brasil, J. A., Pretti, L., Filassi, J. R., & Gemperli, R. (2018). Influence of advanced age on postoperative outcomes and total loss following breast reconstruction: A critical assessment of 560 cases. Revista do Colegio Brasileiro De Cirurgioes, 45(2), e1616. [DOI] [PubMed] [Google Scholar]
- Moher, D., Liberati, A., Tetzlaff, J., & Altman, D. G. (2009). Preferred reporting items for systematic reviews and meta‐analyses: The PRISMA statement. Annals of Internal Medicine, 151(4), 264–269. [DOI] [PubMed] [Google Scholar]
- National Pressure Ulcer Advisory Panel and Alliance , (2014). Prevention and treatment of pressure ulcers: Clinical Practice guideline. Haesler E. (ed.). : Cambridge Media. [Google Scholar]
- Nguyen, K.‐H., Chaboyer, W., & Whitty, J. A. (2015). Pressure injury in Australian public hospitals: A cost‐of‐illness study. Australian Health Review : A Publication of the Australian Hospital Association, 39(3), 329–336. [DOI] [PubMed] [Google Scholar]
- NPUAP . (2016). Pressure injury. [EB/OL]. https://npuap.org/page/PressureInjuryStages
- Oh, D. Y., Kim, J. H., Lee, P. K., Ahn, S. T., & Rhie, J. W. (2007). Prevention of pressure ulcer using the pressure ulcer risk assessment based on braden scale. Archives of Plastic Surgery, 34(4), 465–469. [Google Scholar]
- Olson, K., Tkachuk, L., & Hanson, J. (1998). Preventing pressure sores in oncology patients. Clinical Nursing Research, 7(2), 207–224. [DOI] [PubMed] [Google Scholar]
- Padula, W. V., & Delarmente, B. A. (2019). The national cost of hospital‐acquired pressure injuries in the United States. International Wound Journal, 16(3), 634–640. [DOI] [PMC free article] [PubMed] [Google Scholar]
- Pancorbo‐Hidalgo, P. L., Francisco Pedro, G. F., Isabel Ma, L. M., & Carmen, A. N. (2010). Risk assessment scales for pressure ulcer prevention: A systematic review. Journal of Advanced Nursing, 54(1), 94–110. [DOI] [PubMed] [Google Scholar]
- Pang, S.‐ M.‐C., & Wong, T.‐ K.‐S. (1998). Predicting pressure sore risk with the Norton, Braden, and Waterlow scales in a Hong Kong rehabilitation hospital. Nursing Research, 47(3), 147–153. [DOI] [PubMed] [Google Scholar]
- Park, S.‐H., Choi, Y.‐K., & Kang, C.‐B. (2015). Predictive validity of the Braden Scale for pressure ulcer risk in hospitalized patients. Journal of Tissue Viability, 24(3), 102–113. [DOI] [PubMed] [Google Scholar]
- Park, S.‐H., & Lee, H. S. (2016). Assessing predictive validity of pressure ulcer risk scales‐ A systematic review and meta‐analysis. Iranian Journal of Public Health, 45(2), 122–133. [PMC free article] [PubMed] [Google Scholar]
- Park, S.‐H., Lee, Y.‐S., & Kwon, Y.‐M. (2016). Predictive validity of pressure ulcer risk assessment tools for elderly: A meta‐analysis. Western Journal of Nursing Research, 38(4), 459–483. [DOI] [PubMed] [Google Scholar]
- Ramundo, J. M. (1995). Reliability and validity of the Braden Scale in the home care setting. Journal of Wound, Ostomy, and Continence Nursing: Official Publication of the Wound, Ostomy and Continence Nurses Society, 22(3), 128–134. [DOI] [PubMed] [Google Scholar]
- Reitsma, J. B., Glas, A. S., Rutjes, A. W., Scholten, R. J., Bossuyt, P. M., & Zwinderman, A. H. (2005). Bivariate analysis of sensitivity and specificity produces informative summary measures in diagnostic reviews. Journal of Clinical Epidemiology, 58(10), 982–990. [DOI] [PubMed] [Google Scholar]
- Roa Díaz, Z. M., Parra, D. I., & Camargo‐Figuera, F. A. (2017). Validación e índices de calidad de las escalas de Braden y Norton. Gerokomos, 28(4), 200–204. [Google Scholar]
- Roca‐Biosca, A., Rubio‐Rico, L., Fernández, M. I. D. M., Grau, N. G., Garijo, G. T., & Fernández, F. P. G. (2017). Predictive validity of the Braden scale for assessing risk of developing pressure ulcers and dependence‐related lesions. Journal of Wound Care, 26(9), 528–536. 10.12968/jowc.2017.26.9.528 [DOI] [PubMed] [Google Scholar]
- Salvadalena, G., Snyder, M., & Brogdon, K. (1992). Clinical trial of the Braden Scale on an acute care medical unit. Journal of ET Nursing: Official Publication, International Association for Enterostomal Therapy, 19(5), 160–165. [PubMed] [Google Scholar]
- Šáteková, L., Žiaková, K., & Zeleníková, R. (2017). Predictive validity of the Braden Scale, Norton Scale, and Waterlow Scale in the Czech Republic. International Journal of Nursing Practice, 23(1), e12499.– 10.1111/ijn.12499 [DOI] [PubMed] [Google Scholar]
- Schoonhoven, L., Haalboom, J. R., Bousema, M. T., Algra, A., Grobbee, D. E., Grypdonck, M. H., & Buskens, E. (2002). Prospective cohort study of routine use of risk assessment scales for prediction of pressure ulcers. British Medical Journal, 325(7368), 797. 10.1136/bmj.325.7368.797 [DOI] [PMC free article] [PubMed] [Google Scholar]
- Schue, R. M., & Langemo, D. K. (1998). Pressure ulcer prevalence and incidence and a modification of the Braden Scale for a rehabilitation unit. Journal of WOCN, 25(1), 36–43. 10.1097/00152192-199801000-00007 [DOI] [PubMed] [Google Scholar]
- Seongsook, R. J., Ihnsook, R. J., & Younghee, R. L. (2004). Validity of pressure ulcer risk assessment scales; Cubbin and Jackson, Braden, and Douglas scale. International Journal of Nursing Studies, 41(2), 199–204. 10.1016/S0020-7489(03)00135-4 [DOI] [PubMed] [Google Scholar]
- Serpa, L. F., de Gouveia Santos, V. L., Gomboski, G., & Rosado, S. M. (2009). Predictive validity of Waterlow Scale for pressure ulcer development risk in hospitalized patients. Journal of Wound Ostomy and Continence Nursing, 36(6), 640–646. [DOI] [PubMed] [Google Scholar]
- Serpa, L. F., Santos, V. L. C. D. G., Campanili, T. C. G. F., & Queiroz, M. (2011). Predictive validity of the Braden scale for pressure ulcer risk in critical care patients. Revista latino‐americana De Enfermagem, 19(1), 50–57. 10.1590/S0104-11692011000100008 [DOI] [PubMed] [Google Scholar]
- Severens, J. L., Habraken, J. M., Duivenvoorden, S., & Frederiks, C. M. (2002). The cost of illness of pressure ulcers in The Netherlands. Adv Skin Wound Care, 15(2), 72–77. [DOI] [PubMed] [Google Scholar]
- Shi, C., Dumville, J. C., & Cullum, N. (2019). Evaluating the development and validation of empirically‐derived prognostic models for pressure ulcer risk assessment: A systematic review. International Journal of Nursing Studies, 89, 88–103. [DOI] [PubMed] [Google Scholar]
- Tannen, A., Bours, G., Halfens, R., & Dassen, T. (2006). A comparison of pressure ulcer prevalence rates in nursing homes in the Netherlands and Germany, adjusted for population characteristics. Research in Nursing & Health, 29(6), 588–596. 10.1002/nur.20160 [DOI] [PubMed] [Google Scholar]
- Tannen, A., Dassen, T., & Halfens, R. (2008). Differences in prevalence of pressure ulcers between the Netherlands and Germany–associations between risk, prevention and occurrence of pressure ulcers in hospitals and nursing homes. Journal of Clinical Nursing, 17(9), 1237–1244. 10.1111/j.1365-2702.2007.02225.x [DOI] [PubMed] [Google Scholar]
- VandenBosch, T., Montoye, C., Satwicz, M., Durkee‐Leonard, K., & Boylan‐Lewis, B. (1996). Predictive validity of the Braden Scale and nurse perception in identifying pressure ulcer risk. Applied Nursing Research, 9(2), 80–86. 10.1016/S0897-1897(96)80457-5 [DOI] [PubMed] [Google Scholar]
- Watkinson, C. (1997). Developing a pressure sore risk assessment scale. Professional Nurse (London, England), 12(5), 341. [PubMed] [Google Scholar]
- Wei, H., Peng, L., & Hong‐Lin, C. (2012). The Braden Scale cannot be used alone for assessing pressure ulcer risk in surgical patients: A meta‐analysis. Ostomy/wound Management, 58(2), 34–40. [PubMed] [Google Scholar]
- Wei, M., Wu, L., Chen, Y., Fu, Q., Chen, W., & Yang, D. (2020). Predictive validity of the braden scale for pressure ulcer risk in critical care: A meta‐analysis. Nursing in Critical Care, 25(3), 165–170. [DOI] [PubMed] [Google Scholar]
- Whiting, P. F., Rutjes, A. W. S., Westwood, M. E., Susan, M., Deeks, J. J., Reitsma, J. B., Leeflang, M. M. G., Sterne, J. A. C., & Bossuyt, P. M. M. (2011). QUADAS‐2: A revised tool for the quality assessment of diagnostic accuracy studies. Annals of Internal Medicine, 155(8), 529–536. 10.7326/0003-4819-155-8-201110180-00009 [DOI] [PubMed] [Google Scholar]
- Zarei, E., Madarshahian, E., Nikkhah, A., & Khodakarim, S. (2019). Incidence of pressure ulcers in intensive care units and direct costs of treatment: Evidence from Iran. Journal of Tissue Viability, 28(2), 70–74. 10.1016/j.jtv.2019.02.001 [DOI] [PubMed] [Google Scholar]
Associated Data
This section collects any data citations, data availability statements, or supplementary materials included in this article.
Supplementary Materials
Supplementary Material
Data Availability Statement
The data used to support the findings of this study are available from the corresponding author on reasonable request.