

Abstract
Background:
Clinical variants of progressive supranuclear palsy (PSP) include the classic Richardson’s syndrome (PSP-RS), as well as cortical presentations such as PSP-speech/language (PSP-SL) and subcortical presentations such as PSP-parkinsonism (PSP-P). Patterns of white matter tract degeneration underlying these variants, and the degree to which white matter patterns could differentiate these variants, is unclear.
Methods:
Forty-nine PSP patients (28 PSP-RS, 12 PSP-P and 9 PSP-SL) were recruited by the Neurodegenerative Research Group and underwent diffusion tensor imaging. Regional diffusion tensor imaging metrics were compared across PSP variants using Bayesian linear mixed-effects models, with inter-variant differentiation assessed using the area under the receiver operator characteristic curve (AUROC).
Results:
All three variants showed degeneration of the body of the corpus callosum, posterior thalamic radiation, superior cerebellar peduncle, internal and external capsule, and superior fronto-occipital fasciculus. PSP-RS showed greater degeneration of superior cerebellar peduncle compared to PSP-P and PSP-SL, whereas PSP-SL showed greater degeneration of body and genu of the corpus callosum, internal capsule, external capsule, and superior longitudinal fasciculus compared to the other variants. Fractional anisotropy in body of the corpus callosum provided excellent differentiation of PSP-SL from both PSP-P and PSP-RS (AUROC=0.91 and 0.92, respectively). Moderate differentiation of PSP-RS and PSP-P was achieved with fractional anisotropy in superior fronto-occipital fasciculus (AUROC=0.68) and mean diffusivity in the superior cerebellar peduncle (AUROC=0.65).
Conclusion:
In this pilot study, patterns of white matter tract degeneration differed across PSP-RS, PSP-SL and PSP-P, with the body of the corpus callosum showing some utility in the differentiation of PSP-SL from the other two variants.
Keywords: Richardson syndrome, PSP with predominant parkinsonism, PSP with speech/language, diffusion tensor imaging, white matter
Introduction
Progressive supranuclear palsy (PSP) is a neurodegenerative disorder that can present with a number of different clinical variants. The initially-described and best known form of PSP is PSP-Richardson’s syndrome (PSP-RS), characterized by oculomotor impairment and early postural instability [1, 2]. On neuroimaging, PSP-RS is associated with degeneration along the dentatorubrothalamic tract[3], with reduced diffusivity of the superior cerebellar peduncle observed on diffusion tensor imaging (DTI) [3–6], volume loss of the midbrain, thalamus and basal ganglia[6, 7] and [18F]flortaucipir PET uptake in the dentate nucleus of the cerebellum[8–10]. Mild degeneration has also been observed in the body of the corpus callosum and frontal lobes.
The other clinical variants of PSP tend to show different patterns of involvement of these sets of PSP-related structures, with some showing abnormalities limited to subcortical structures and others showing more cortical patterns of abnormalities. One such subcortical variant is PSP with predominant parkinsonism (PSP-P) which is characterized by bradykinesia and rigidity/tremor, as well as oculomotor impairment[1, 11]. These patients typically present with parkinsonian features that overlap with idiopathic Parkinson’s disease in the early stages of the disease until the development of oculomotor impairment, frequent falls and other PSP clinical features. Volume loss has been observed in subcortical structures in PSP-P, including basal ganglia and thalamus, with a relative sparing of the cortex compared to PSP-RS[6, 7]. Distinct from this is the highly cortical variant: PSP with predominant speech/language impairment (PSP-SL)[1, 12]. These patients present with apraxia of speech or a language disorder/aphasia. They eventually develop oculomotor impairment and other PSP clinical features[12, 13]. In this PSP variant, striking grey matter volume loss is observed in the frontal lobes, particularly premotor and motor regions of the frontal lobe, with only mild volume loss of the basal ganglia and midbrain[6, 13].
In a recent study we compared across PSP variants in terms of grey matter volume and [18F]flortaucipir PET uptake[6]. We found that PSP-SL showed smaller cortical volumes and greater [18F]flortaucipir uptake in precentral and motor cortices compared to both PSP-RS and PSP-P, reflecting the greater cortical involvement in this variant. Conversely, PSP-RS showed smaller volumes of the midbrain compared to both PSP-P and PSP-SL. PSP-RS was the only variant to show reduced volume of the superior cerebellar peduncle and [18F]flortaucipir uptake in dentate nucleus of cerebellum. These findings suggested that the dentatorubrothalamic tract was involved to a greater degree in PSP-RS. One limitation of that study, however, was that we did not directly interrogate white matter tracts using diffusion tensor imaging (DTI). Degeneration and protein deposition in white matter is a striking feature of PSP pathologically, and hence in order to understand the pathophysiology underlying the different variants of PSP it is vital to also assess the white matter. A better understanding of the pathophysiology of the PSP variants is essential in order to develop better targeted neuroimaging outcome measures that could be used as disease biomarkers in clinical treatment trails. Currently, widely recognized neuroimaging biomarkers for PSP are based solely on the typical PSP-RS presentation. Furthermore, since clinical features can overlap across PSP variants, neuroimaging signatures could potentially aid clinical diagnosis.
Hence, the aim of this current pilot study was to compare the integrity of the white matter utilizing DTI in PSP-RS, PSP-P and PSP-SL. We also aimed to determine the degree white matter tract measures could be useful in the differential diagnosis of these clinical variants. We hypothesize that patterns of white matter tract degeneration will differ across these three variants. It is particularly pertinent to better characterize differences between PSP-P and PSP-SL since many patients with PSP-SL eventually develop parkinsonism and can meet clinical criteria for PSP-P[13], even though the disease started with problems with speech and language.
Methods
Patients
We identified all patients that had been recruited by the Neurodegenerative Research Group (NRG) from the Department of Neurology, Mayo Clinic, Rochester, that met Movement Disorder Society (MDS) PSP clinical criteria[1] for possible or probable PSP-RS, PSP-P or PSP-SL and had undergone the same DTI acquisition protocol on a Siemens Prisma scanner between December 12th 2017 and March 3rd 2020. A total of 49 patients were identified, including 28 PSP-RS, 12 PSP-P and nine PSP-SL. Patients with other clinical variants of PSP were excluded since numbers scanned on the Siemens scanner were too small (<5) to allow group comparisons. All patients must have been over age 40, present with gradual progression of PSP-related symptoms and have an informant to provide independent evaluation of functioning. Patients were excluded if they only met suggestive of PSP criteria[1], if they met criteria for another neurodegenerative disease (including corticobasal syndrome[14], frontotemporal dementia[15], primary progressive aphasia[16], primary progressive apraxia of speech[17], Alzheimer’s disease[18], multiple system atrophy[19] and Parkinson’s disease[20]) and do not have the symptoms necessary to fulfill inclusion criteria for PSP, if they had concurrent illnesses that could account for the clinical symptoms, or structural brain abnormalities. Twenty-two healthy controls were consecutively recruited by NRG during the same period of time as the PSP patients and underwent the identical DTI acquisition. Healthy controls were included if they did not have any complaints of cognitive, motor or behavioral abnormalities and performed normally on the Montreal Cognitive Assessment Battery (≥26).
All PSP patients underwent a neurological evaluation that included testing on the PSP Rating Scale[21] to assess disease severity. The Movement Disorders Society sponsored revision of the Unified Parkinson’s Disease Rating Scale part III[22] was used to assess motor parkinsonism and the PSP Oculomotor Impairment Scale[4] to assess eye movement abnormalities. The Frontal Assessment Battery[23] was utilized to assess executive dysfunction, the Cambridge Behavioral Inventory[24] to assess behavioral abnormalities, and the Montreal Cognitive assessment[25] to assess general cognitive impairment. All patients were also evaluated by a Speech-language pathologist who determined the presence/absence of apraxia of speech and aphasia, as previously described [17]. The severity of apraxia of speech was rated using the Apraxia of Speech Rating Scale[26]. All patients underwent a detailed neuropsychological battery that included the Camden Memory Tests for words and faces[27] tests to assess memory; the 15-item Boston Naming Test[28] to assess confrontational naming; Trail Making Test A and B[29] to assess processing speed and cognitive flexibility/set shifting respectively, and the Visual Object and Space Perception Battery [30] fragmented letters and cubes tests to assess visuoperceptual and visuospatial function.
The study was approved by the Mayo Clinic Institutional Review Board (IRB) and all patients provided informed consent to participate in the study.
DTI analysis
All patients and controls underwent a standardized MRI protocol on a 3T Siemens Prisma scanner. The protocol included a 3D Magnetization Prepared Rapid Acquisition Gradient-Echo (MPRAGE) sequence and diffusion sequence. All diffusion MRI images were acquired with a spin echo single shot Echo Planar Imaging (EPI) sequence at 3T on one of two Prisma scanners (Siemens Healthcare, Erlangen, Germany), with 2.0mm isotropic voxels. Each scan had 13 b = 0 s/mm2, 6 b = 500 s/mm2, 48 b = 1000 s/mm2, and 60 b = 2000 s/mm2 volumes, with the diffusion gradients in each shell evenly spread using an electrostatic repulsion scheme [31], modified to distribute them over whole spheres instead of hemispheres. For each DTI scan, after denoising [32], the images, head motion and eddy current distortion was corrected using FSL’s eddy program [33–35]. We corrected for Gibbs ringing as described in [36] and then skull stripped the images [37]. The Rician noise bias was then removed using the noise image from denoising and the procedure outlined in [38]. Diffusion tensors were estimated using nonlinear least squares fitting and used to calculate Fractional Anisotropy (FA), Mean Diffusivity (MD), Radial Diffusivitiy (RD) and Axial Diffusivity (AxD) images in dipy [39]. Each of the different DTI images were non-linearly coregistered via an iterative, groupwise registration algorithm (Advanced Normalization Tools, ANTs[40]) and normalized to a 1mm isotropic Montreal Neurological Institute (MNI)152 standard space via the FMRIB58_FA template[41]. Regions of cerebrospinal fluid and grey matter were removed from consideration by masking out regions where mean FA across coregistered patient images was below 0.2. In order to generate region-level data for each scan ANTS was used to nonlinearly register the JHU “Eve” WM atlas [42] to each subject’s FA image. Median values for each DTI metric were calculated over 16 specified tracts, including superior cerebellar peduncle; middle cerebellar peduncle; corticospinal tract; posterior thalamic radiation; anterior and posterior limb of the internal capsule; external capsule; body, genu and splenium of the corpus callosum; superior longitudinal fasciculus; and the inferior and superior fronto-occipital fasciculus. These tracts were selected because they have been shown to be affected in PSP-RS[3] and in patients with apraxia of speech/agrammatic aphasia. A whole-brain voxel-level analysis of FA, MD, RD and AxD was also performed as previously described[43] comparing each PSP variant to controls and to each other. Results were assessed corrected for multiple comparisons using the family-wise error correction at p<0.05 and uncorrected at p<0.001, with age and gender included as covariates.
Statistical analysis
We used Bayesian linear mixed-effects models to evaluate group-wise differences in log-transformed DTI metrics within each region with age at scan as a covariate. The mixed models included controls and modeled patient group as a random intercept, thereby shrinking group-wise estimates towards a common mean. The shrinkage, or penalized estimation, inherent in mixed model estimation reduces over-fitting and bias, and reduces false positives when performing pairwise comparisons across multiple groups[44]. All statistical analyses were performed using R statistical software. Models were fit using the blme package which extends the mixed model functionality of the lme4 package. We used posterior simulations using the sim function in the arm package to get confidence intervals for each group[44]. We report 84% and 95% CIs for the group means. Because the groups were independent, 84% CIs provide a heuristic to facilitate pairwise comparisons; 84% CIs that do not overlap indicate a significant group-wise difference at p<0.05[45, 46]. To obtain p-values for group-wise comparisons, we used the duality between confidence intervals and hypothesis tests and report the p-value for a group-wise comparison as the alpha level corresponding to the widest CI that does not include zero. For example, a 90% confidence interval for a difference between groups that does not include zero indicates p<0.10; a 95% CI that does not include zero indicates p<0.05, etc. We quantified group-wise differences using the area under the receiver operating characteristic curve (AUROC), a nonparametric effect size measure[47].
Results
The three PSP groups did not differ in terms of age (at test) or gender, although there was a trend for a difference in time from onset to scan (p=0.06) with longest times observed in PSP-SL and PSP-P (Table 1). There was also no difference observed across groups in metrics of severity of cognitive impairment, parkinsonism, PSP disease severity or oculomotor impairment. There was a trend for worse memory performance in PSP-RS, although performance was still within normal limits.
Table 1:
Patient characteristics
| Variable | Controls N=22 | PSP-RS N=28 | PSP-P N=12 | PSP-SL N=9 | P-value across PSP groups |
|---|---|---|---|---|---|
|
| |||||
| No. Female, n (%) | 15 (68%) | 11 (39%) | 2 (17%)* | 2 (22%)* | 0.37 |
| APOE ε4, n (%) | NA | 5 (25%) | 3 (33%) | 4 (44%) | 0.60 |
| Education, yr | 16 [13, 18] | 15.5 [14.0, 17.5] | 15.0 [13.0, 16.0] | 17.2 [16.0, 19.0] | 0.13 |
| Age at scan, yr | 59 [57, 61] | 69.7* [66.9, 74.4] | 69.9* [68.0, 71.9] | 73.5* [68.9, 76.3] | 0.28 |
| Age at onset, yr | NA | 64.7 [61.0, 67.2] | 63.4 [61.2, 66.2] | 66.2 [64.0, 70.0] | 0.62 |
| Disease duration, yr | NA | 5.0 [3.2, 5.8] | 6.5 [5.0, 8.1] | 7.0 [4.9, 8.3] | 0.06 |
| Montreal Cognitive Assessment Battery, /30 | 28 [27, 29] | 21.7* [18.8, 25.0] | 23.1* [18.5, 27.0] | 22.2* [18.0, 26.0] | 0.73 |
| Frontal Assessment Battery, /18 | NA | 12.2 [10.8, 15.0] | 13.5 [12.8, 16.0] | 12.4 [10.5, 15.2] | 0.61 |
| Cambridge Behavioral Inventory | NA | 43.7 [22.0, 64.0] | 50.5 [37.0, 50.8] | 26.2 [24.0, 31.0] | 0.25 |
| Apraxia of Speech Rating Scale (version 3) | NA | 4.8 [3.0, 6.0] | 5.8 [2.0, 6.0] | 27.6 [21.0, 26.0] | <0.001 |
| Boston Naming Test, /15 | NA | 13.5 [13.0, 14.0] | 12.3 [11.5, 15.0] | 14.1 [13.0, 15.0] | 0.14 |
| MDS-UPDRS III, /132 | NA | 44.1 [34.0, 57.5] | 50.1 [40.2, 61.5] | 38.9 [39.0, 45.0] | 0.31 |
| PSP Rating Scale, /64 | NA | 39.1 [30.5, 51.0] | 39.4 [32.8, 42.8] | 37.7 [37.0, 44.0] | 0.95 |
| PSP Rating Scale – gait/midline | NA | 11.4 [8.8, 16.0] | 12.7 [10.5, 16.2] | 9.8 [6.2, 12.8] | 0.49 |
| PSP Oculomotor scale, /5 | NA | 2.9 [2.0, 4.0] | 2.4 [1.9, 3.2] | 2.3 [2.0, 3.0] | 0.23 |
| Camden words | NA | 21.7 [21.0, 23.0] | 23.5 [23.0, 24.5] | 23.7 [23.0, 25.0] | 0.054 |
| Camden faces | NA | 22.3 [22.0, 24.0] | 22.9 [21.5, 25.0] | 21.6 [20.0, 24.0] | 0.45 |
| Trail Making Test A, secs | NA | 83.3 [56.5, 99.0] | 85.7 [59.0, 92.0] | 97.5 [66.2, 126.0] | 0.67 |
| Trail Making Test B, secs | NA | 142.2 [99.2, 170.2] | 136.5 [95.5, 179.0] | 159.8 [103.8, 184.5] | 0.84 |
| VOSP letters, /20 | NA | 19.2 [19.0, 20.0] | 18.5 [18.0, 20.0] | 19.6 [19.0, 20.0] | 0.27 |
| VOSP cubes, /10 | NA | 8.8 [8.0, 10.0] | 8.9 [9.0, 10.0] | 8.4 [8.0, 10.0] | 0.76 |
Data shown are mean [IQR].
Significantly different from controls, p<0.05.
For categorical variables, p-values are from Fisher tests, for continuous variables, p-values are from Analysis of Variance regressions. MDS-UPDRS III = Movement Disorder Society sponsored revision of the Unified Parkinson’s Disease Rating Scale ; VOSP = Visual Object and Space Perception Battery
In the ROI-level FA analysis (Figure 1 and Table 2>), in comparison to controls, all three PSP variants showed reduced FA in the posterior thalamic radiation and the body of the corpus callosum. The PSP-RS and PSP-SL variants showed reduced FA in the external capsule, genu of the corpus callosum, superior longitudinal fasciculus and superior fronto-occipital fasciculus. Only PSP-RS showed reduced FA in the superior cerebellar peduncle and only PSP-SL showed reduced FA in the anterior limb of the internal capsule. When directly comparing between PSP variants, PSP-SL showed reduced FA compared to PSP-P in the anterior and posterior limb of the internal capsule, external capsule, body and genu of the corpus callosum, superior longitudinal fasciculus and superior fronto-occipital fasciculus. The only region in which PSP-SL showed reduced FA compared to PSP-RS was the body of the corpus callosum. The body of the corpus callosum provided optimum differentiation of PSP-SL from both PSP-P and PSP-RS (AUROC=0.91 and 0.92, respectively). The PSP-RS variant showed reduced FA in the superior cerebellar peduncle compared to PSP-SL, with a trend compared to PSP-P, and showed reduced FA in the posterior limb of the internal capsule and superior fronto-occipital fasciculus compared to PSP-P. The superior fronto-occipital fasciculus provided best differentiation of PSP-RS and PSP-P (AUROC=0.68).
Figure 1:
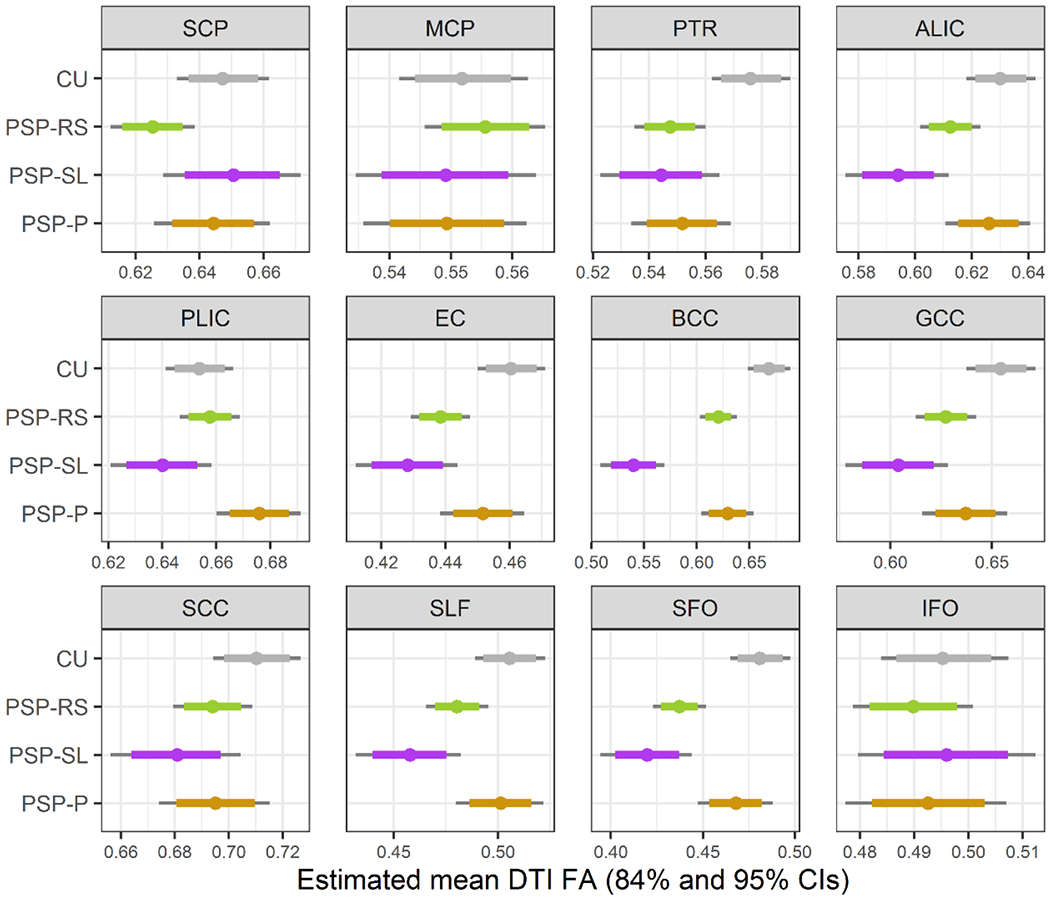
Boxplots of estimated fractional anisotropy (FA) from Bayesian Linear Mixed-Effects Models. ALIC = anterior limb of the internal capsule; BCC = body of the corpus callosum; CU = cognitively unimpaired; EC = external capsule; GCC = genu of the corpus callosum; IFO = inferior fronto-occipital fasciculus; MCP = middle cerebellar peduncle; PLIC = posterior limb of the internal capsule; PTR = posterior thalamic radiation; SCC = splenium of the corpus callosum; SCP = superior cerebellar peduncle; SFO = superior fronto-occipital fasciculus; SLF = superior longitudinal fasciculus
Table 2:
Pair-wise comparisons of fractional anisotropy
| ROI | PSP-RS vs Controls | PSP-SL vs Controls | PSP-P vs Controls | PSP-RS vs PSP-SL | PSP-RS vs PSP-P | PSP-SL vs PSP-P | ||||||
|---|---|---|---|---|---|---|---|---|---|---|---|---|
|
| ||||||||||||
| AUROC | P | AUROC | P | AUROC | P | AUROC | P | AUROC | P | AUROC | P | |
|
| ||||||||||||
| SCP | 0.73 | 0.046 | 0.51 | 0.84 | 0.58 | 0.81 | 0.69 | 0.03 | 0.61 | 0.06 | 0.62 | 0.62 |
| MCP | 0.58 | 0.64 | 0.55 | 0.77 | 0.50 | 0.78 | 0.54 | 0.38 | 0.61 | 0.37 | 0.58 | 0.98 |
| PTR | 0.90 | 0.002 | 0.93 | 0.02 | 0.80 | 0.04 | 0.59 | 0.76 | 0.52 | 0.68 | 0.58 | 0.53 |
| ALIC | 0.81 | 0.06 | 0.92 | 0.004 | 0.69 | 0.68 | 0.69 | 0.06 | 0.63 | 0.11 | 0.83 | 0.003 |
| PLIC | 0.54 | 0.70 | 0.66 | 0.26 | 0.74 | 0.052 | 0.66 | 0.07 | 0.66 | 0.04 | 0.80 | 0.001 |
| EC | 0.87 | 0.001 | 0.96 | 0.003 | 0.77 | 0.34 | 0.63 | 0.21 | 0.65 | 0.08 | 0.79 | 0.01 |
| BCC | 0.91 | 0.001 | 1.00 | <0.001 | 0.82 | 0.03 | 0.92 | <0.001 | 0.58 | 0.55 | 0.91 | <0.001 |
| GCC | 0.84 | 0.04 | 0.95 | 0.004 | 0.73 | 0.23 | 0.73 | 0.08 | 0.59 | 0.43 | 0.79 | 0.02 |
| SCC | 0.81 | 0.18 | 0.85 | 0.06 | 0.72 | 0.28 | 0.61 | 0.29 | 0.52 | 0.93 | 0.62 | 0.31 |
| SLF | 0.77 | 0.047 | 0.90 | 0.006 | 0.58 | 0.76 | 0.71 | 0.09 | 0.65 | 0.08 | 0.80 | 0.004 |
| SFO | 0.91 | 0.001 | 0.98 | 0.001 | 0.78 | 0.35 | 0.71 | 0.16 | 0.68 | 0.01 | 0.88 | 0.001 |
| IFO | 0.68 | 0.51 | 0.61 | 0.98 | 0.67 | 0.77 | 0.58 | 0.48 | 0.53 | 0.75 | 0.56 | 0.71 |
p-values come from the Bayesian models; AUROC = area under the receiver operator characteristic curve; ALIC = anterior limb of the internal capsule; BCC = body of the corpus callosum; EC = external capsule; GCC = genu of the corpus callosum; IFO = inferior fronto-occipital fasciculus; MCP = middle cerebellar peduncle; PLIC = posterior limb of the internal capsule; PTR = posterior thalamic radiation; SCC = splenium of the corpus callosum; SCP = superior cerebellar peduncle; SFO = superior fronto-occipital fasciculus; SLF = superior longitudinal fasciculus
In the ROI-level MD analysis (Figure 2 and Table 3), in comparison to controls, all three PSP variants showed increased MD in the superior cerebellar peduncle, anterior and posterior limb of the internal capsule, external capsule, body of the corpus callosum, and the superior fronto-occipital fasciculus. The PSP-RS and PSP-SL variants also showed increased MD compared to controls in the genu of the corpus callosum, superior longitudinal fasciculus and the inferior fronto-occipital fasciculus, and PSP-SL showed increased MD in the corticospinal tract and splenium of the corpus callosum. When directly comparing between PSP variants, PSP-SL showed increased MD compared to both PSP-RS and PSP-P in the body of the corpus callosum and the superior longitudinal fasciculus. The body of the corpus callosum provided optimum differentiation of PSP-SL from both PSP-P and PSP-RS (AUROC=0.85 for both). PSP-SL also showed increased MD in the external capsule compared to PSP-RS, and increased MD in the posterior limb of the internal capsule and genu of the corpus callosum compared to PSP-P. The PSP-RS variant showed increased MD in the superior cerebellar peduncle compared to both PSP-P and PSP-SL, with AUROC values of 0.65 and 0.77, respectively.
Figure 2:
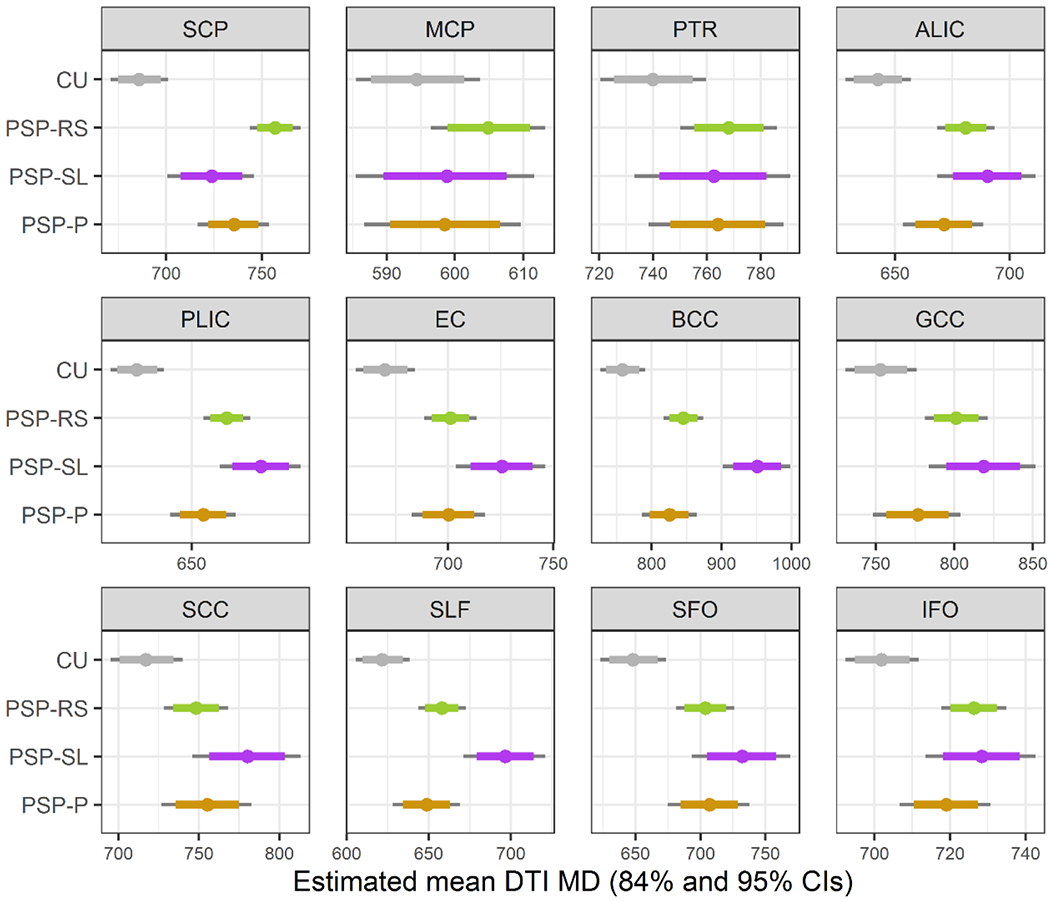
Boxplots of estimated mean diffusivity (MD) from Bayesian Linear Mixed-Effects Models. ALIC = anterior limb of the internal capsule; BCC = body of the corpus callosum; CU = cognitively unimpaired; EC = external capsule; GCC = genu of the corpus callosum; IFO = inferior fronto-occipital fasciculus; MCP = middle cerebellar peduncle; PLIC = posterior limb of the internal capsule; PTR = posterior thalamic radiation; SCC = splenium of the corpus callosum; SCP = superior cerebellar peduncle; SFO = superior fronto-occipital fasciculus; SLF = superior longitudinal fasciculus
Table 3:
Pair-wise comparisons of mean diffusivity
| ROI | PSP-RS vs Controls | PSP-SL vs Controls | PSP-P vs Controls | PSP-RS vs PSP-SL | PSP-RS vs PSP-P | PSP-SL vs PSP-P | ||||||
|---|---|---|---|---|---|---|---|---|---|---|---|---|
|
| ||||||||||||
| AUROC | P | AUROC | P | AUROC | P | AUROC | P | AUROC | P | AUROC | P | |
|
| ||||||||||||
| SCP | 0.98 | <0.001 | 0.94 | 0.02 | 0.89 | <0.001 | 0.77 | 0.01 | 0.65 | 0.04 | 0.63 | 0.38 |
| MCP | 0.81 | 0.13 | 0.80 | 0.63 | 0.64 | 0.59 | 0.61 | 0.37 | 0.63 | 0.32 | 0.62 | 0.98 |
| PTR | 0.87 | 0.06 | 0.85 | 0.25 | 0.76 | 0.17 | 0.52 | 0.70 | 0.54 | 0.77 | 0.57 | 0.94 |
| ALIC | 0.96 | <0.001 | 1.00 | 0.001 | 0.87 | 0.03 | 0.60 | 0.41 | 0.57 | 0.33 | 0.66 | 0.14 |
| PLIC | 0.98 | <0.001 | 1.00 | <0.001 | 0.91 | 0.008 | 0.69 | 0.11 | 0.59 | 0.22 | 0.76 | 0.02 |
| EC | 0.96 | 0.007 | 1.00 | 0.001 | 0.91 | 0.02 | 0.69 | 0.03 | 0.52 | 0.93 | 0.68 | 0.06 |
| BCC | 0.96 | <0.001 | 1.00 | <0.001 | 0.87 | 0.03 | 0.85 | 0.001 | 0.52 | 0.36 | 0.85 | <0.001 |
| GCC | 0.92 | 0.01 | 0.96 | 0.005 | 0.83 | 0.25 | 0.63 | 0.34 | 0.58 | 0.13 | 0.69 | 0.045 |
| SCC | 0.90 | 0.07 | 0.93 | 0.007 | 0.78 | 0.06 | 0.64 | 0.08 | 0.57 | 0.67 | 0.64 | 0.21 |
| SLF | 0.92 | 0.007 | 0.99 | <0.001 | 0.75 | 0.07 | 0.77 | 0.004 | 0.53 | 0.41 | 0.77 | 0.004 |
| SFO | 0.96 | 0.007 | 0.99 | 0.001 | 0.91 | 0.01 | 0.65 | 0.16 | 0.57 | 0.85 | 0.64 | 0.27 |
| IFO | 0.90 | 0.002 | 0.95 | 0.008 | 0.92 | 0.054 | 0.60 | 0.80 | 0.60 | 0.29 | 0.69 | 0.28 |
p-values come from the Bayesian models; AUROC = area under the receiver operator characteristic curve; ALIC = anterior limb of the internal capsule; BCC = body of the corpus callosum; EC = external capsule; GCC = genu of the corpus callosum; IFO = inferior fronto-occipital fasciculus; MCP = middle cerebellar peduncle; PLIC = posterior limb of the internal capsule; PTR = posterior thalamic radiation; SCC = splenium of the corpus callosum; SCP = superior cerebellar peduncle; SFO = superior fronto-occipital fasciculus; SLF = superior longitudinal fasciculus
The ROI-level RD and AxD results are shown in Supplementary Tables 2 and 3 and Supplementary Figures 1 and 2. Similar to the FA and MD analysis, RD in the body of the corpus callosum provided optimum differentiation of PSP-SL from both PSP-P and PSP-RS (AUROC=0.90 for both). Similar to the MD analysis, RD in the superior cerebellar peduncle provided optimum differentiation of PSP-RS and PSP-P, although the AUROC was moderate (0.66). ROI-level AxD values were unable to differentiate PSP variants.
The voxel-level analysis showed reduced FA and increased MD throughout the frontal white matter, particularly in posterior regions of the frontal lobe, and in the body of the corpus callosum in PSP-SL compared to controls (Figure 3 and Table 4). PSP-RS showed reduced FA and increased MD in the midbrain, thalamus, superior cerebellar peduncle, anterior and posterior limb of the internal capsule, external capsule, anterior and superior corona radiata, body of the corpus callosum, cingulum, superior and inferior frontal and precentral white matter, and cerebellum. PSP-P only showed restricted patterns of degeneration involving the fornix, thalamus and globus pallidus. Inter-group comparisons that survived correction for multiple comparisons included PSP-SL showing reduced FA in the body of the corpus callosum, and both reduced FA and increased MD in the frontal and premotor white matter, compared to PSP-RS and PSP-P (Figure 4 and Table 4>). PSP-RS showed reduced FA in the cerebellum and increased MD in the cerebellum and motor cortex compared to PSP-P, although results did not survive correction for multiple comparisons (Figure 4). The results with RD and AxD were very similar (Supplementary Figures 3 and 4).
Figure 3:
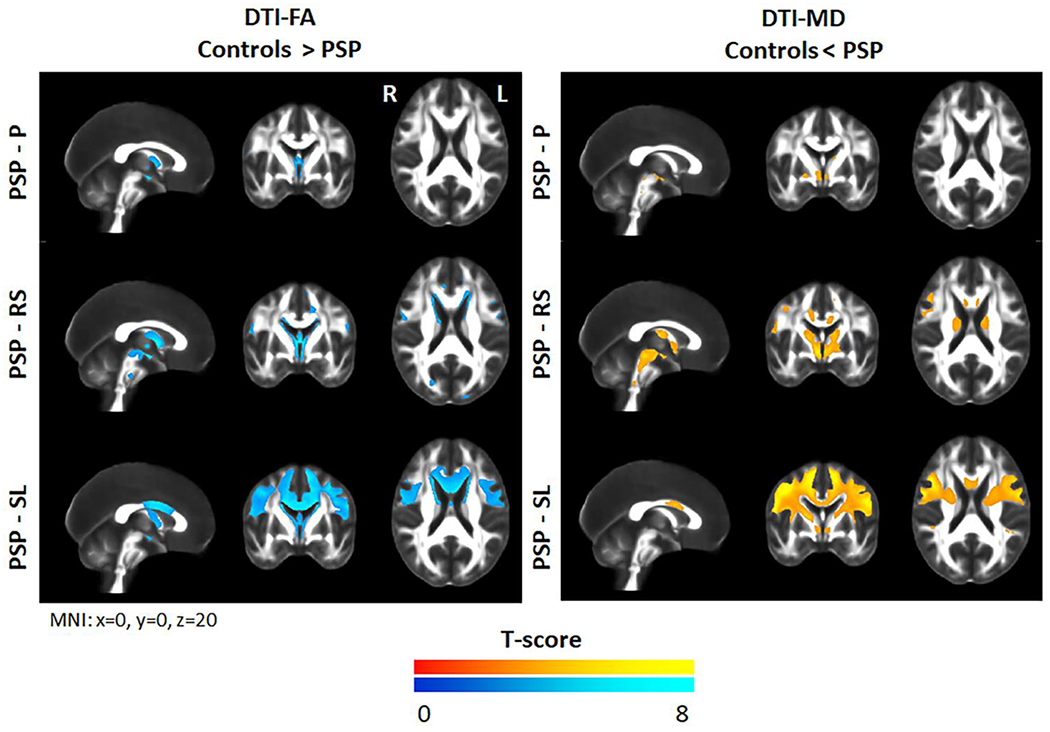
Voxel-level maps of reduced fractional anisotropy and increased mean diffusivity in the PSP variants compared to controls. Results are shown after correction for multiple comparisons using family wise error at p<0.05.
Table 4:
Voxel-level coordinates for significant clusters of results for fractional anisotropy (FA) and mean diffusivity (MD)
| DTI metric | Comparison | Regions | Cluster size | T | Coordinates (x, y, z) |
|---|---|---|---|---|---|
|
| |||||
| FA | PSP-RS<controls | Left thalamus/midbrain | 8010 | 8.44 | −1, −7, −9 |
| Left anterior corona radiata | 4869 | 6.28 | −13, 23, 31 | ||
| Right precentral WM | 737 | 6.20 | 57, −1, 16 | ||
| Right cingulum hippocampus | 596 | 6.08 | 16, −34, −10 | ||
| PSP-SL<controls | Right BCC | 71383 | 8.57 | 16, 4, 27 | |
| Left superior frontal WM | 8.29 | −8, −1, 60 | |||
| Left BCC | 7.74 | −18, 3, 29 | |||
| PSP-P<controls | Right fornix/thalamus | 1511 | 6.82 | 2, −6, −7 | |
| PSP-SL<PSP-P | Left BCC | 77529 | 6.40 | −3, 4, 26 | |
| Left superior frontal WM | 6.22 | −12, −1, 55 | |||
| Left BCC | 6.01 | −16, 2, 32 | |||
| PSP-SL<PSP-RS | Left BCC | 46852 | 6.19 | −4, 3, 26 | |
| Right BCC | 6.10 | 7, 1, 26 | |||
| Left superior frontal WM | 5.73 | −9, 0, 59 | |||
|
| |||||
| MD | Controls<PSP-RS | Right thalamus/midbrain | 28010 | 7.98 | 8, −5, −2 |
| Left thalamus/midbrain | 7.63 | −9, −7, −3 | |||
| Left SCP | 7.03 | −6, −32, −20 | |||
| Left superior frontal WM | 704 | 6.40 | −8, −9, 54 | ||
| Right inferior frontal WM | 552 | 6.05 | 47, 17, 19 | ||
| Right precentral WM | 1353 | 5.81 | 10, −20, 63 | ||
| Right BCC | 2118 | 5.49 | 12, 3, 34 | ||
| Controls<PSP-SL | Right precentral WM | 98693 | 9.97 | 42, 0, 43 | |
| Right superior frontal WM | 9.22 | 12, −1, 54 | |||
| Left precentral WM | 9.12 | −48, −4, 38 | |||
| Left posterior limb internal capsule | 855 | 5.62 | −8, −3, −4 | ||
| Right supramarginal WM | 649 | 5.57 | 45, −28, 29 | ||
| Left superior parietal WM | 673 | 5.39 | −22, −50, 53 | ||
| Controls<PSP-P | Right globus pallidus | 629 | 6.26 | 25, −7, −5 | |
| Right thalamus | 2111 | 5.97 | 7, −4, −3 | ||
| PSP-P<PSP-SL | Right superior frontal WM | 10890 | 7.99 | 12, −1, 54 | |
| Right superior frontal WM | 7.84 | 10, 5, 59 | |||
| Right precentral WM | 7.72 | 43, −1, 42 | |||
| Left superior frontal WM | 10234 | 7.14 | −14, 0, 53 | ||
| Left precentral WM | 7.12 | −46, −4, 39 | |||
| Left middle frontal WM | 6.39 | −32, 2, 48 | |||
| PSP-RS<PSP-SL | Right precentral WM | 8811 | 7.99 | 44, −1, 42 | |
| Left precentral WM | 2561 | 7.66 | −47, −4, 38 | ||
| Left superior frontal WM | 2678 | 6.84 | −13, −1, 57 | ||
All clusters that survived cluster-level correction for multiple comparisons (p<0.05) are shown. WM = white matter; BCC = body of the corpus callosum; SCP = superior cerebellar peduncle
Figure 4:
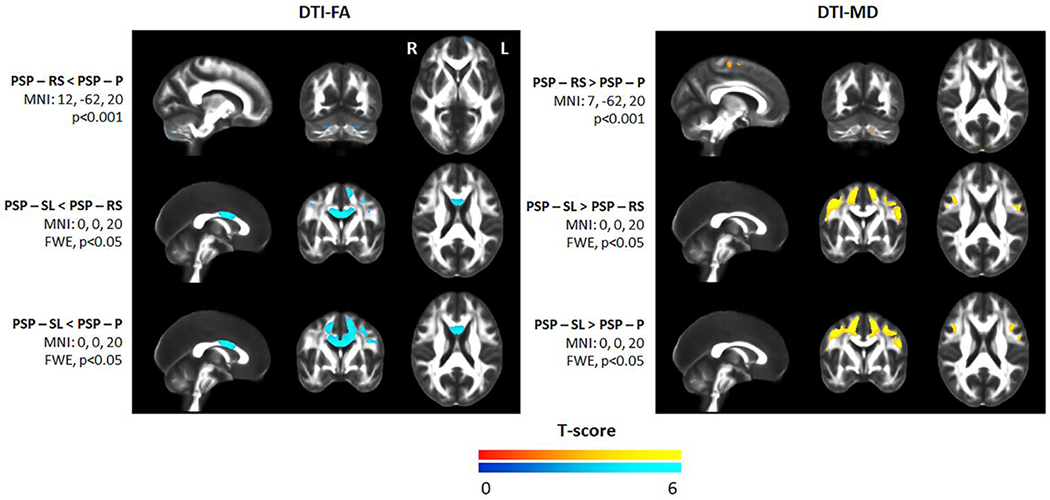
Voxel-level maps of reduced fractional anisotropy and increased mean diffusivity in each PSP variant compared to the others. Results are shown either uncorrected for multiple comparisons at p<0.001 or after correction for multiple comparisons using family wise error at p<0.05.
Discussion
The findings from this study point towards differing patterns of white matter tract degeneration across the three PSP clinical variants. Degeneration of the superior cerebellar peduncle was greatest in PSP-RS, while PSP-SL showed the most widespread degeneration of association fibers, corpus callosum and internal capsule. The PSP-P variant showed the most restricted patterns of white matter tract degeneration with less involvement of the superior cerebellar peduncle and association fibers. Despite the relatively small number of patients in some groups, the DTI measures provided good differentiation of the PSP-SL patients from the other two variants.
The PSP-RS group showed patterns of white matter degeneration consistent with previous DTI studies by our group and others[3–5, 48, 49], with striking involvement of the superior cerebellar peduncle and milder degeneration of the commissural and association fibers, including the superior longitudinal fasciculus, superior fronto-occipital fasciculus, corticocortical association fibers that run through the external capsule, projection fibers running through the internal capsule, and the posterior thalamic radiation. In fact, PSP-RS was the only variant that showed reduced directional diffusion in the form of FA in the superior cerebellar peduncle compared to controls, and PSP-RS showed greater involvement of this tract than both PSP-SL and PSP-P. This fits with our previous findings utilizing grey and white matter volume analysis in which involvement of the dentatorubrothalamic tract was involved to a greater degree in PSP-RS than many of the other clinical variants of PSP [6]. Other studies have also showed greater involvement of the superior cerebellar peduncle in PSP-RS compared to PSP-P[5, 50, 51]. Findings from the current study are consistent with studies showing that degeneration of the dentatorubrothalamic tract is particularly associated with the clinical features characteristic of PSP-RS[4, 50, 52]. The PSP-RS group also showed greater degeneration of the posterior limb of the internal capsule and superior fronto-occipital fasciculus compared to PSP-P, reflecting more widespread white matter tract degeneration in PSP-RS despite the fact that PSP-P had a longer disease duration at the time of DTI. Previous studies have observed greater degeneration of frontal white matter and corpus callosum in PSP-RS compared to PSP-P[5, 53].
The PSP-SL variant showed the most widespread patterns of white matter tract degeneration, involving commissural and association fibers, particularly tracts that project to or from the frontal lobe, including the superior longitudinal fasciculus, superior fronto-occipital fasciculus and inferior fronto-occipital fasciculus, as well as frontal and premotor white matter. Degeneration was also observed in both the internal and external capsule. These findings concord with the fact that PSP-SL shows striking grey matter atrophy in the frontal lobe, including the premotor and motor cortex[6, 13]. The superior cerebellar peduncle was abnormal in PSP-SL, although was involved to a lesser degree than in PSP-RS, and the overall pattern of degeneration was mainly restricted to supratentorial tracts. The PSP-SL variant showed greater involvement of the majority of these supratentorial tracts compared to the other variants, particularly PSP-P. Furthermore, PSP-SL showed the most widespread involvement of the corpus callosum with abnormalities observed in the genu, body and splenium of the corpus callosum, demonstrating involvement of prefrontal, premotor, motor and parietal commissural fibers. Commissural degeneration in PSP-RS involved the callosal genu and body, while only the body was involved in PSP-P.
Regions of white matter tract degeneration were observed in PSP-P compared to controls. In the FA analysis, abnormalities were only observed in the posterior thalamic radiation and body of the corpus callosum. Slightly more widespread abnormalities were, however, observed with MD and RD, which also involved the superior cerebellar peduncle, internal and external capsule, the superior fronto-occipital fasciculus, thalamus and globus pallidus. Previous studies have similarly observed DTI abnormalities in the superior cerebellar peduncle, corpus callosum and supratentorial association fibers in PSP-P[5, 50, 51, 54]. Findings with other imaging modalities in PSP-P have been more divergent. In our recent study, we found very little volume loss in PSP-P, with atrophy limited to the midbrain, and flortaucipir uptake to the basal ganglia[6]. Other studies have found volume loss of the superior cerebellar peduncle, basal ganglia and thalamus[7, 51], and even cortical atrophy in one study[7]. Despite these discrepancies, which may be due to different criteria for PSP-P, studies consistently find less atrophy and white matter tract degeneration in PSP-P compared to PSP-RS. Hence, when the frontal lobes are involved in PSP-P it is typically mild.
The DTI measures showed some potential to be useful in the differentiation of PSP variants. The body of the corpus callosum provided excellent AUROC values to differentiate PSP-SL from both PSP-RS and PSP-P, particularly when using FA and RD where the AUROC values were 0.90 or greater. The ability to differentiate PSP-RS and PSP-P based on these DTI measures was, however, only moderate, with the highest AUROC value of 0.68. This shows that PSP-RS and PSP-P are more similar to each other than either is to PSP-SL, which stands out due to the degree of involvement of white matter tracts projecting to and from the frontal lobes. The body of the corpus callosum may be a particularly useful biomarker for differentiating PSP-SL from other PSP variants. The PSP-SL variant is also relatively well distinguished from the other variants based on volume and flortaucipir measures from the supplementary motor area and motor cortex[6].
There was some overlap among the three PSP variants. All three showed involvement, albeit to different degrees, of the body of the corpus callosum, posterior thalamic radiation, superior cerebellar peduncle, anterior and posterior limb of the internal capsule, external capsule, and the superior fronto-occipital fasciculus. It is possible that this system of white matter tracts is particularly specific to PSP, regardless of clinical variant, although studies which include other clinical variants of PSP will be needed in order to test this hypothesis. We previously found that the striatum, thalamus, and globus pallidus, were commonly involved across many different PSP variants[6].
An issue that deserves some discussion is the fact that our findings differed somewhat depending on the specific DTI metric. While the overall patterns in each PSP variant compared to controls were similar across DTI metrics, the FA and RD performed the best in differentiating variants in the ROI-level analysis, while MD showed more widespread abnormalities at the ROI-level, for example in PSP-P. The AxD metric performed poorly in differentiating PSP variants. It is unclear whether these differences reflect biological differences in tract integrity or whether discrepancies are due to the relatively small number of patients in the PSP-SL and PSP-P groups which limits power. Noise in the DTI data, such as in the presence of crossing fibers, is particularly likely to lead to unstable estimates of AxD and RD which are difficult to interpret. There has been some suggestion that RD and AxD reflect different biological abnormalities in white matter tracts[55], although this has not been completed accepted in the field[56, 57]. While we report RD and AxD for completeness, caution should be exercised in interpreting these metrics.
The findings from this study help to further characterize the pathophysiology underlying different clinical variants of PSP. A limitation was that we did not have enough patients in order to perform comparisons to other clinical variants of PSP, and the number of patients in the PSP-P and PSP-SL groups was smaller than the PSP-RS group which would have influenced power. Our control cohort also lacked neuropsychological characterization and was younger than the PSP groups. We included age in our analyses to account for this difference. Further studies will be needed to determine the utility of DTI in the differentiation of PSP-RS, PSP-P and PSP-SL from other PSP variants, and to replicate our findings in larger samples. Furthermore, it will be important to relate these tract abnormalities to underlying pathology and to determine how DTI performs as a potential diagnostic biomarker compared to other neuroimaging modalities.
Supplementary Material
Acknowledgments:
Funded by the National Institutes of Health grants R01-NS89757, R01-DC12519 and R01-DC14942
Funding:
This study was funded by NIH grant R01-NS89757, R01-DC12519 and R01-DC14942.
Footnotes
Publisher's Disclaimer: This Author Accepted Manuscript is a PDF file of an unedited peer-reviewed manuscript that has been accepted for publication but has not been copyedited or corrected. The official version of record that is published in the journal is kept up to date and so may therefore differ from this version.
Conflicts of interest/Competing interests:The authors have no conflicts of interest.
Availability of data and material (data transparency): Data is available from the corresponding author on request.
Code availability (software application or custom code): The diffusion skull stripper is available on github.
References
- 1.Hoglinger GU, Respondek G, Stamelou M, et al. (2017) Clinical diagnosis of progressive supranuclear palsy: The movement disorder society criteria. Mov Disord 32:853–864 [DOI] [PMC free article] [PubMed] [Google Scholar]
- 2.Litvan I, Agid Y, Calne D, et al. (1996) Clinical research criteria for the diagnosis of progressive supranuclear palsy (Steele-Richardson-Olszewski syndrome): report of the NINDS-SPSP international workshop. Neurology 47:1–9 [DOI] [PubMed] [Google Scholar]
- 3.Whitwell JL, Avula R, Master A, et al. (2011) Disrupted thalamocortical connectivity in PSP: a resting state fMRI, DTI, and VBM study. Parkinsonism Relat Disord 17:599–605 [DOI] [PMC free article] [PubMed] [Google Scholar]
- 4.Whitwell JL, Master AV, Avula R, et al. (2011) Clinical correlates of white matter tract degeneration in PSP. Arch Neurol 68:753–760 [DOI] [PMC free article] [PubMed] [Google Scholar]
- 5.Agosta F, Pievani M, Svetel M, et al. (2012) Diffusion tensor MRI contributes to differentiate Richardson’s syndrome from PSP-parkinsonism. Neurobiology of aging 33:2817–2826 [DOI] [PubMed] [Google Scholar]
- 6.Whitwell JL, Tosakulwong N, Botha H, et al. (2020) Brain volume and flortaucipir analysis of progressive supranuclear palsy clinical variants. Neuroimage Clin 25:102152. [DOI] [PMC free article] [PubMed] [Google Scholar]
- 7.Agosta F, Kostic VS, Galantucci S, et al. (2010) The in vivo distribution of brain tissue loss in Richardson’s syndrome and PSP-parkinsonism: a VBM-DARTEL study. The European journal of neuroscience 32:640–647 [DOI] [PubMed] [Google Scholar]
- 8.Whitwell JL, Lowe VJ, Tosakulwong N, et al. (2017) [18 F]AV-1451 tau positron emission tomography in progressive supranuclear palsy. Mov Disord 32:124–133 [DOI] [PMC free article] [PubMed] [Google Scholar]
- 9.Passamonti L, Vazquez Rodriguez P, Hong YT, et al. (2017) 18F-AV-1451 positron emission tomography in Alzheimer’s disease and progressive supranuclear palsy. Brain 140:781–791 [DOI] [PMC free article] [PubMed] [Google Scholar]
- 10.Schonhaut DR, McMillan CT, Spina S, et al. (2017) (18) F-flortaucipir tau positron emission tomography distinguishes established progressive supranuclear palsy from controls and Parkinson disease: A multicenter study. Ann Neurol 82:622–634 [DOI] [PMC free article] [PubMed] [Google Scholar]
- 11.Williams DR, de Silva R, Paviour DC, et al. (2005) Characteristics of two distinct clinical phenotypes in pathologically proven progressive supranuclear palsy: Richardson’s syndrome and PSP-parkinsonism. Brain 128:1247–1258 [DOI] [PubMed] [Google Scholar]
- 12.Josephs KA, Duffy JR, Strand EA, et al. (2006) Clinicopathological and imaging correlates of progressive aphasia and apraxia of speech. Brain 129:1385–1398 [DOI] [PMC free article] [PubMed] [Google Scholar]
- 13.Whitwell JL, Stevens CA, Duffy JR, et al. (2019) An evaluation of the progressive supranuclear palsy speech/language variant. Movement Disorders Clinical Practice 6:452–461 [DOI] [PMC free article] [PubMed] [Google Scholar]
- 14.Armstrong MJ, Litvan I, Lang AE, et al. (2013) Criteria for the diagnosis of corticobasal degeneration. Neurology 80:496–503 [DOI] [PMC free article] [PubMed] [Google Scholar]
- 15.Rascovsky K, Hodges JR, Kipps CM, et al. (2007) Diagnostic criteria for the behavioral variant of frontotemporal dementia (bvFTD): current limitations and future directions. Alzheimer Dis Assoc Disord 21:S14–18 [DOI] [PubMed] [Google Scholar]
- 16.Gorno-Tempini ML, Hillis AE, Weintraub S, et al. (2011) Classification of primary progressive aphasia and its variants. Neurology 76:1006–1014 [DOI] [PMC free article] [PubMed] [Google Scholar]
- 17.Josephs KA, Duffy JR, Strand EA, et al. (2012) Characterizing a neurodegenerative syndrome: primary progressive apraxia of speech. Brain 135:1522–1536 [DOI] [PMC free article] [PubMed] [Google Scholar]
- 18.McKhann GM, Knopman DS, Chertkow H, et al. (2011) The diagnosis of dementia due to Alzheimer’s disease: recommendations from the National Institute on Aging-Alzheimer’s Association workgroups on diagnostic guidelines for Alzheimer’s disease. Alzheimer’s & dementia : the journal of the Alzheimer’s Association 7:263–269 [DOI] [PMC free article] [PubMed] [Google Scholar]
- 19.Gilman S, Wenning GK, Low PA, et al. (2008) Second consensus statement on the diagnosis of multiple system atrophy. Neurology 71:670–676 [DOI] [PMC free article] [PubMed] [Google Scholar]
- 20.Postuma RB, Berg D, Stern M, et al. (2015) MDS clinical diagnostic criteria for Parkinson’s disease. Mov Disord 30:1591–1601 [DOI] [PubMed] [Google Scholar]
- 21.Golbe LI, Ohman-Strickland PA (2007) A clinical rating scale for progressive supranuclear palsy. Brain 130:1552–1565 [DOI] [PubMed] [Google Scholar]
- 22.Goetz CG, Fahn S, Martinez-Martin P, et al. (2007) Movement Disorder Society-sponsored revision of the Unified Parkinson’s Disease Rating Scale (MDS-UPDRS): Process, format, and clinimetric testing plan. Mov Disord 22:41–47 [DOI] [PubMed] [Google Scholar]
- 23.Dubois B, Slachevsky A, Litvan I, Pillon B (2000) The FAB: a Frontal Assessment Battery at bedside. Neurology 55:1621–1626 [DOI] [PubMed] [Google Scholar]
- 24.Wear HJ, Wedderburn CJ, Mioshi E, et al. (2008) The Cambridge Behavioural Inventory revised. Dement Neuropsychol 2:102–107 [DOI] [PMC free article] [PubMed] [Google Scholar]
- 25.Nasreddine ZS, Phillips NA, Bedirian V, et al. (2005) The Montreal Cognitive Assessment, MoCA: a brief screening tool for mild cognitive impairment. Journal of the American Geriatrics Society 53:695–699 [DOI] [PubMed] [Google Scholar]
- 26.Strand EA, Duffy JR, Clark HM, Josephs K (2014) The apraxia of speech rating scale: a tool for diagnosis and description of apraxia of speech. Journal of communication disorders 51:43–50 [DOI] [PMC free article] [PubMed] [Google Scholar]
- 27.Warrington EK (1996) The Camden Memory Tests. Psychology Press, Hove [Google Scholar]
- 28.Kaplan E, Goodglass H, Weintraub S (2001) The Boston Naming Test (2nd Edition). Pro-ed, Austin, Tx [Google Scholar]
- 29.Spreen O, Strauss E (1998) Compendium of Neuropsychological tests, second edition: administration, norms and commentary. Oxford University Press, New York [Google Scholar]
- 30.Warrington EK, James M (1991) The visual object and space perception battery. Thames Valley Test Company, Bury St Edmonds, UK [Google Scholar]
- 31.Caruyer E, Lenglet C, Sapiro G, Deriche R (2013) Design of multishell sampling schemes with uniform coverage in diffusion MRI. Magn Reson Med 69:1534–1540 [DOI] [PMC free article] [PubMed] [Google Scholar]
- 32.Veraart J, Novikov DS, Christiaens D, Ades-Aron B, Sijbers J, Fieremans E (2016) Denoising of diffusion MRI using random matrix theory. Neuroimage 142:394–406 [DOI] [PMC free article] [PubMed] [Google Scholar]
- 33.Andersson JLR, Graham MS, Drobnjak I, Zhang H, Filippini N, Bastiani M (2017) Towards a comprehensive framework for movement and distortion correction of diffusion MR images: Within volume movement. Neuroimage 152:450–466 [DOI] [PMC free article] [PubMed] [Google Scholar]
- 34.Andersson JLR, Graham MS, Zsoldos E, Sotiropoulos SN (2016) Incorporating outlier detection and replacement into a non-parametric framework for movement and distortion correction of diffusion MR images. Neuroimage 141:556–572 [DOI] [PubMed] [Google Scholar]
- 35.Andersson JLR, Sotiropoulos SN (2016) An integrated approach to correction for off-resonance effects and subject movement in diffusion MR imaging. Neuroimage 125:1063–1078 [DOI] [PMC free article] [PubMed] [Google Scholar]
- 36.Kellner E, Dhital B, Kiselev VG, Reisert M (2016) Gibbs-ringing artifact removal based on local subvoxel-shifts. Magn Reson Med 76:1574–1581 [DOI] [PubMed] [Google Scholar]
- 37.Reid RI, Nedelska Z, Schwarz CG, Ward C, Jack CR (2018) The Alzheimer’s Disease Neuroimaging Initiative (2018) Diffusion Specific Segmentation: Skull Stripping with Diffusion MRI Data Alone. In: Kaden E, Grussu F, Ning L, Tax C, Veraart J (eds) Computational Diffusion MRI. Mathematics and Visualization. Springer, Cham [Google Scholar]
- 38.Koay CG, Ozarslan E, Basser PJ (2009) A signal transformational framework for breaking the noise floor and its applications in MRI. J Magn Reson 197:108–119 [DOI] [PMC free article] [PubMed] [Google Scholar]
- 39.Garyfallidis E, Brett M, Amirbekian B, et al. (2014) Dipy, a library for the analysis of diffusion MRI data. Front Neuroinform 8:8. [DOI] [PMC free article] [PubMed] [Google Scholar]
- 40.Avants BB, Yushkevich P, Pluta J, et al. (2010) The optimal template effect in hippocampus studies of diseased populations. Neuroimage 49:2457–2466 [DOI] [PMC free article] [PubMed] [Google Scholar]
- 41.Jenkinson M, Beckmann CF, Behrens TE, Woolrich MW, Smith SM (2012) Fsl. Neuroimage 62:782–790 [DOI] [PubMed] [Google Scholar]
- 42.Oishi K, Faria A, Jiang H, et al. (2009) Atlas-based whole brain white matter analysis using large deformation diffeomorphic metric mapping: application to normal elderly and Alzheimer’s disease participants. NeuroImage 46:486–499 [DOI] [PMC free article] [PubMed] [Google Scholar]
- 43.Schwarz CG, Reid RI, Gunter JL, et al. (2014) Improved DTI registration allows voxel-based analysis that outperforms tract-based spatial statistics. NeuroImage 94:65–78 [DOI] [PMC free article] [PubMed] [Google Scholar]
- 44.Gelman A, Hill J (2007) Data analysis using regression and multilevel/hierarchical models. Cambridge University Press, Cambridge ; New York [Google Scholar]
- 45.Knol MJ, Pestman WR, Grobbee DE (2011) The (mis)use of overlap of confidence intervals to assess effect modification. Eur J Epidemiol 26:253–254 [DOI] [PMC free article] [PubMed] [Google Scholar]
- 46.Payton ME, Greenstone MH, Schenker N (2003) Overlapping confidence intervals or standard error intervals: what do they mean in terms of statistical significance? J Insect Sci 3:34. [DOI] [PMC free article] [PubMed] [Google Scholar]
- 47.Acion L, Peterson JJ, Temple S, Arndt S (2006) Probabilistic index: an intuitive non-parametric approach to measuring the size of treatment effects. Stat Med 25:591–602 [DOI] [PubMed] [Google Scholar]
- 48.Knake S, Belke M, Menzler K, et al. (2010) In vivo demonstration of microstructural brain pathology in progressive supranuclear palsy: A DTI study using TBSS. Mov Disord [DOI] [PubMed] [Google Scholar]
- 49.Padovani A, Borroni B, Brambati SM, et al. (2006) Diffusion tensor imaging and voxel based morphometry study in early progressive supranuclear palsy. Journal of neurology, neurosurgery, and psychiatry 77:457–463 [DOI] [PMC free article] [PubMed] [Google Scholar]
- 50.Seki M, Seppi K, Mueller C, et al. (2018) Diagnostic potential of dentatorubrothalamic tract analysis in progressive supranuclear palsy. Parkinsonism Relat Disord 49:81–87 [DOI] [PubMed] [Google Scholar]
- 51.Potrusil T, Krismer F, Beliveau V, et al. (2020) Diagnostic potential of automated tractography in progressive supranuclear palsy variants. Parkinsonism Relat Disord 72:65–71 [DOI] [PubMed] [Google Scholar]
- 52.Surova Y, Nilsson M, Latt J, et al. (2015) Disease-specific structural changes in thalamus and dentatorubrothalamic tract in progressive supranuclear palsy. Neuroradiology 57:1079–1091 [DOI] [PMC free article] [PubMed] [Google Scholar]
- 53.Saini J, Bagepally BS, Sandhya M, Pasha SA, Yadav R, Pal PK (2012) In vivo evaluation of white matter pathology in patients of progressive supranuclear palsy using TBSS. Neuroradiology 54:771–780 [DOI] [PubMed] [Google Scholar]
- 54.Caso F, Agosta F, Jecmenica-Lukic M, et al. (2018) Progression of white matter damage in progressive supranuclear palsy with predominant parkinsonism. Parkinsonism Relat Disord 49:95–99 [DOI] [PubMed] [Google Scholar]
- 55.Song SK, Sun SW, Ju WK, Lin SJ, Cross AH, Neufeld AH (2003) Diffusion tensor imaging detects and differentiates axon and myelin degeneration in mouse optic nerve after retinal ischemia. NeuroImage 20:1714–1722 [DOI] [PubMed] [Google Scholar]
- 56.Wheeler-Kingshott CA, Cercignani M (2009) About “axial” and “radial” diffusivities. Magn Reson Med 61:1255–1260 [DOI] [PubMed] [Google Scholar]
- 57.Winklewski PJ, Sabisz A, Naumczyk P, Jodzio K, Szurowska E, Szarmach A (2018) Understanding the Physiopathology Behind Axial and Radial Diffusivity Changes-What Do We Know? Front Neurol 9:92. [DOI] [PMC free article] [PubMed] [Google Scholar]
Associated Data
This section collects any data citations, data availability statements, or supplementary materials included in this article.